Article

Nested Patterns of Phytoplankton and Zooplankton and Seasonal Characteristics of Their Mutualistic Networks: A Case Study of the Upstream Section of the Diannong River in Yinchuan City, China

1
School of Civil and Hydraulic Engineering, Ningxia University, Yinchuan 750021, China
2
School of Life Science, Ningxia University, Yinchuan 750021, China
*
Author to whom correspondence should be addressed.
Water 2023, 15(24), 4265; https://doi.org/10.3390/w15244265
Submission received: 18 November 2023 / Revised: 6 December 2023 / Accepted: 8 December 2023 / Published: 13 December 2023
(This article belongs to the Section Biodiversity and Functionality of Aquatic Ecosystems)

Abstract

:
The Diannong River, a valuable river and lake resource of the northern Ningxia Yellow River Irrigation Area, plays an instrumental role in regional flood control, drought resistance, climate regulation, and biodiversity conservation. Phytoplankton and zooplankton, as crucial elements of the aquatic ecosystem, have their distribution patterns evaluated and potential influencing factors identified, thereby enhancing the understanding of community distribution patterns. Nested structures and interspecies interaction relationships bear significant implications for community distribution patterns, functions, and stability. The upstream section of the Diannong River in Yinchuan City was chosen as the study object. Water samples were collected in January, April, July, and October 2021, and the community composition of phytoplankton and zooplankton was analyzed using relative abundance, density, and biomass. The distribution matrix temperature and bipartite network methodologies were deployed to investigate their nested pattern and interaction network seasonal characteristics. The findings indicate that the water environment of the Diannong River’s upstream section displays pronounced spatiotemporal heterogeneity, characterized by weak alkalinity and high fluoride content. The plankton community composition and relative abundance showed marked differences among the distinct sampling periods. The temperature of the random distribution matrix shows a significant difference compared to the zero-sum model, revealing a notable nested pattern in plankton in the Diannong River’s upstream section. The bipartite network suggests that the plankton composition was the simplest in January and the most complex in July, with the fiercest species competition observed in January and the lowest levels of species specificity, vulnerability, and generality. Water temperature (WT), dissolved oxygen (DO), total phosphorus (TP), available phosphorus (AP), CODCr, F, and Cl constitute the environmental parameters influencing the overall structure of the phytoplankton community in the Diannong River’s upstream section, whereas zooplankton did not present a significant correlation with water environmental factors.

1. Introduction

As an intrinsic part of freshwater ecosystems, plankton play a crucial role in shaping water structures and delivering ecological services. Phytoplankton, acting as one of the primary producers, affect the mid- to upper-level ecosystems through their involvement in nutrient transportation, food web construction, and nutrient dynamics. They lay the groundwork for food chains and food webs by providing oxygen and nutrients to herbivores. In contrast, zooplankton regulates the growth of phytoplankton and mediates the energy transfer from lower to higher trophic levels, thereby asserting their essential role in the ecosystem [1,2]. Plankton, characterized by their tiny size, robust vitality, and fast reproduction rates, exhibit acute sensitivity to environmental alterations [3]. In natural water bodies, the composition and existing biomass of phytoplankton are readily influenced by environmental gradients and undergo cyclical variations with changing seasons [4,5,6]. In the context of aquatic ecosystems, the composition and existing biomass of phytoplankton communities serve as critical metrics for assessing the nutrient status and productivity potential of water bodies and, to a certain extent, reflect the water quality [7,8]. Plankton have evolved an array of self-organization and adaptive mechanisms to maintain system stability. For instance, zooplankton control the biomass of phytoplankton through top-down effects. This interrelationship serves to portray not just the community characteristics of plankton but also the status of aquatic ecosystems [9]. As crucial components of aquatic ecosystems, plankton often serve as indicative biological groups for evaluating the health of water bodies [10]. Consequently, the study of spatiotemporal patterns and interrelationships within phytoplankton and zooplankton communities holds significant implications for understanding the characteristics and elucidating the evolutionary trends of aquatic ecosystems.
Initially coined by Darlington, the notion of nested patterns refers to a distribution model within an ‘island’ ecosystem, wherein most species found on ‘small islands’ are also present on the relatively biodiversity-rich ‘large islands’. This non-random distribution conformation is termed ‘nestedness’ [11]. Following this, Patterson and Atmar pioneered the systematic approach of conducting nested analysis at the community level via matrix construction [12], an approach extensively employed in community ecology studies. Studies have revealed that species distribution patterns in naturally fragmented habitats frequently exhibit pronounced nested structures. This distinct nestedness indicates sequences of species extinctions that can be predicted with a high degree of accuracy, rendering these patterns critically relevant to both theoretical research and practical applications in the field of conservation biology [13]. Nested patterns demonstrate significant variability across different systems and taxa, with the nested structure validated as a commonly exhibited structure within community compositions [14]. Nonetheless, whether the development of nested patterns in different community distribution patterns arises from biological interplays such as competition or the random grouping of species remains uncertain. Furthermore, due to the intimate association between species traits and environmental determinants, the consideration of environmental influences is indispensable in such studies. On a species level, nestedness facilitates the minimization of interspecies competition, fostering the coexistence of species and enhancing biodiversity [15]. From a biocoenosis-oriented perspective, the incorporation of nestedness can effectively fortify its resilience, leading to a decrease in the vulnerability of the biocoenosis to external perturbations [16].
Nested patterns are a principal instrument and a crucial indicator in the examination of community structure and composition mechanisms [17]. In recent years, nested patterns have found primary applications in the research of specific groups, such as avian species [18], large-sized organisms [19], and microbial assemblages [20]. This manner of distribution has been progressively discovered across an expanding range of biological communities, including mycorrhizal microbes [21], benthic organisms [22], and fish gut parasites [23]. Research pertaining to plankton predominantly encompasses aspects like species composition, community traits, and diversity [24], in addition to water quality assessments [25]. However, our understanding of the nested patterns existing between phytoplankton and zooplankton remains scarce [26]. This study posits the hypothesis that both phytoplankton and zooplankton communities may exhibit nested distribution patterns, and it aims to delineate the temporal and spatial characteristics of such nested structures. Investigating the nested patterns and interaction networks of plankton communities is imperative for the ecological assessment and management of fluvial systems. Consequently, the research was conducted in the upstream section of the Diannong River, located in Yinchuan City, where systematic sampling across different seasons was employed to explore the nestedness within the plankton community and the features of its interaction networks. The objective was to uncover the mechanisms driving these patterns, thereby contributing novel insights to the broader discourse on riverine ecosystem studies.

2. Materials and Methods

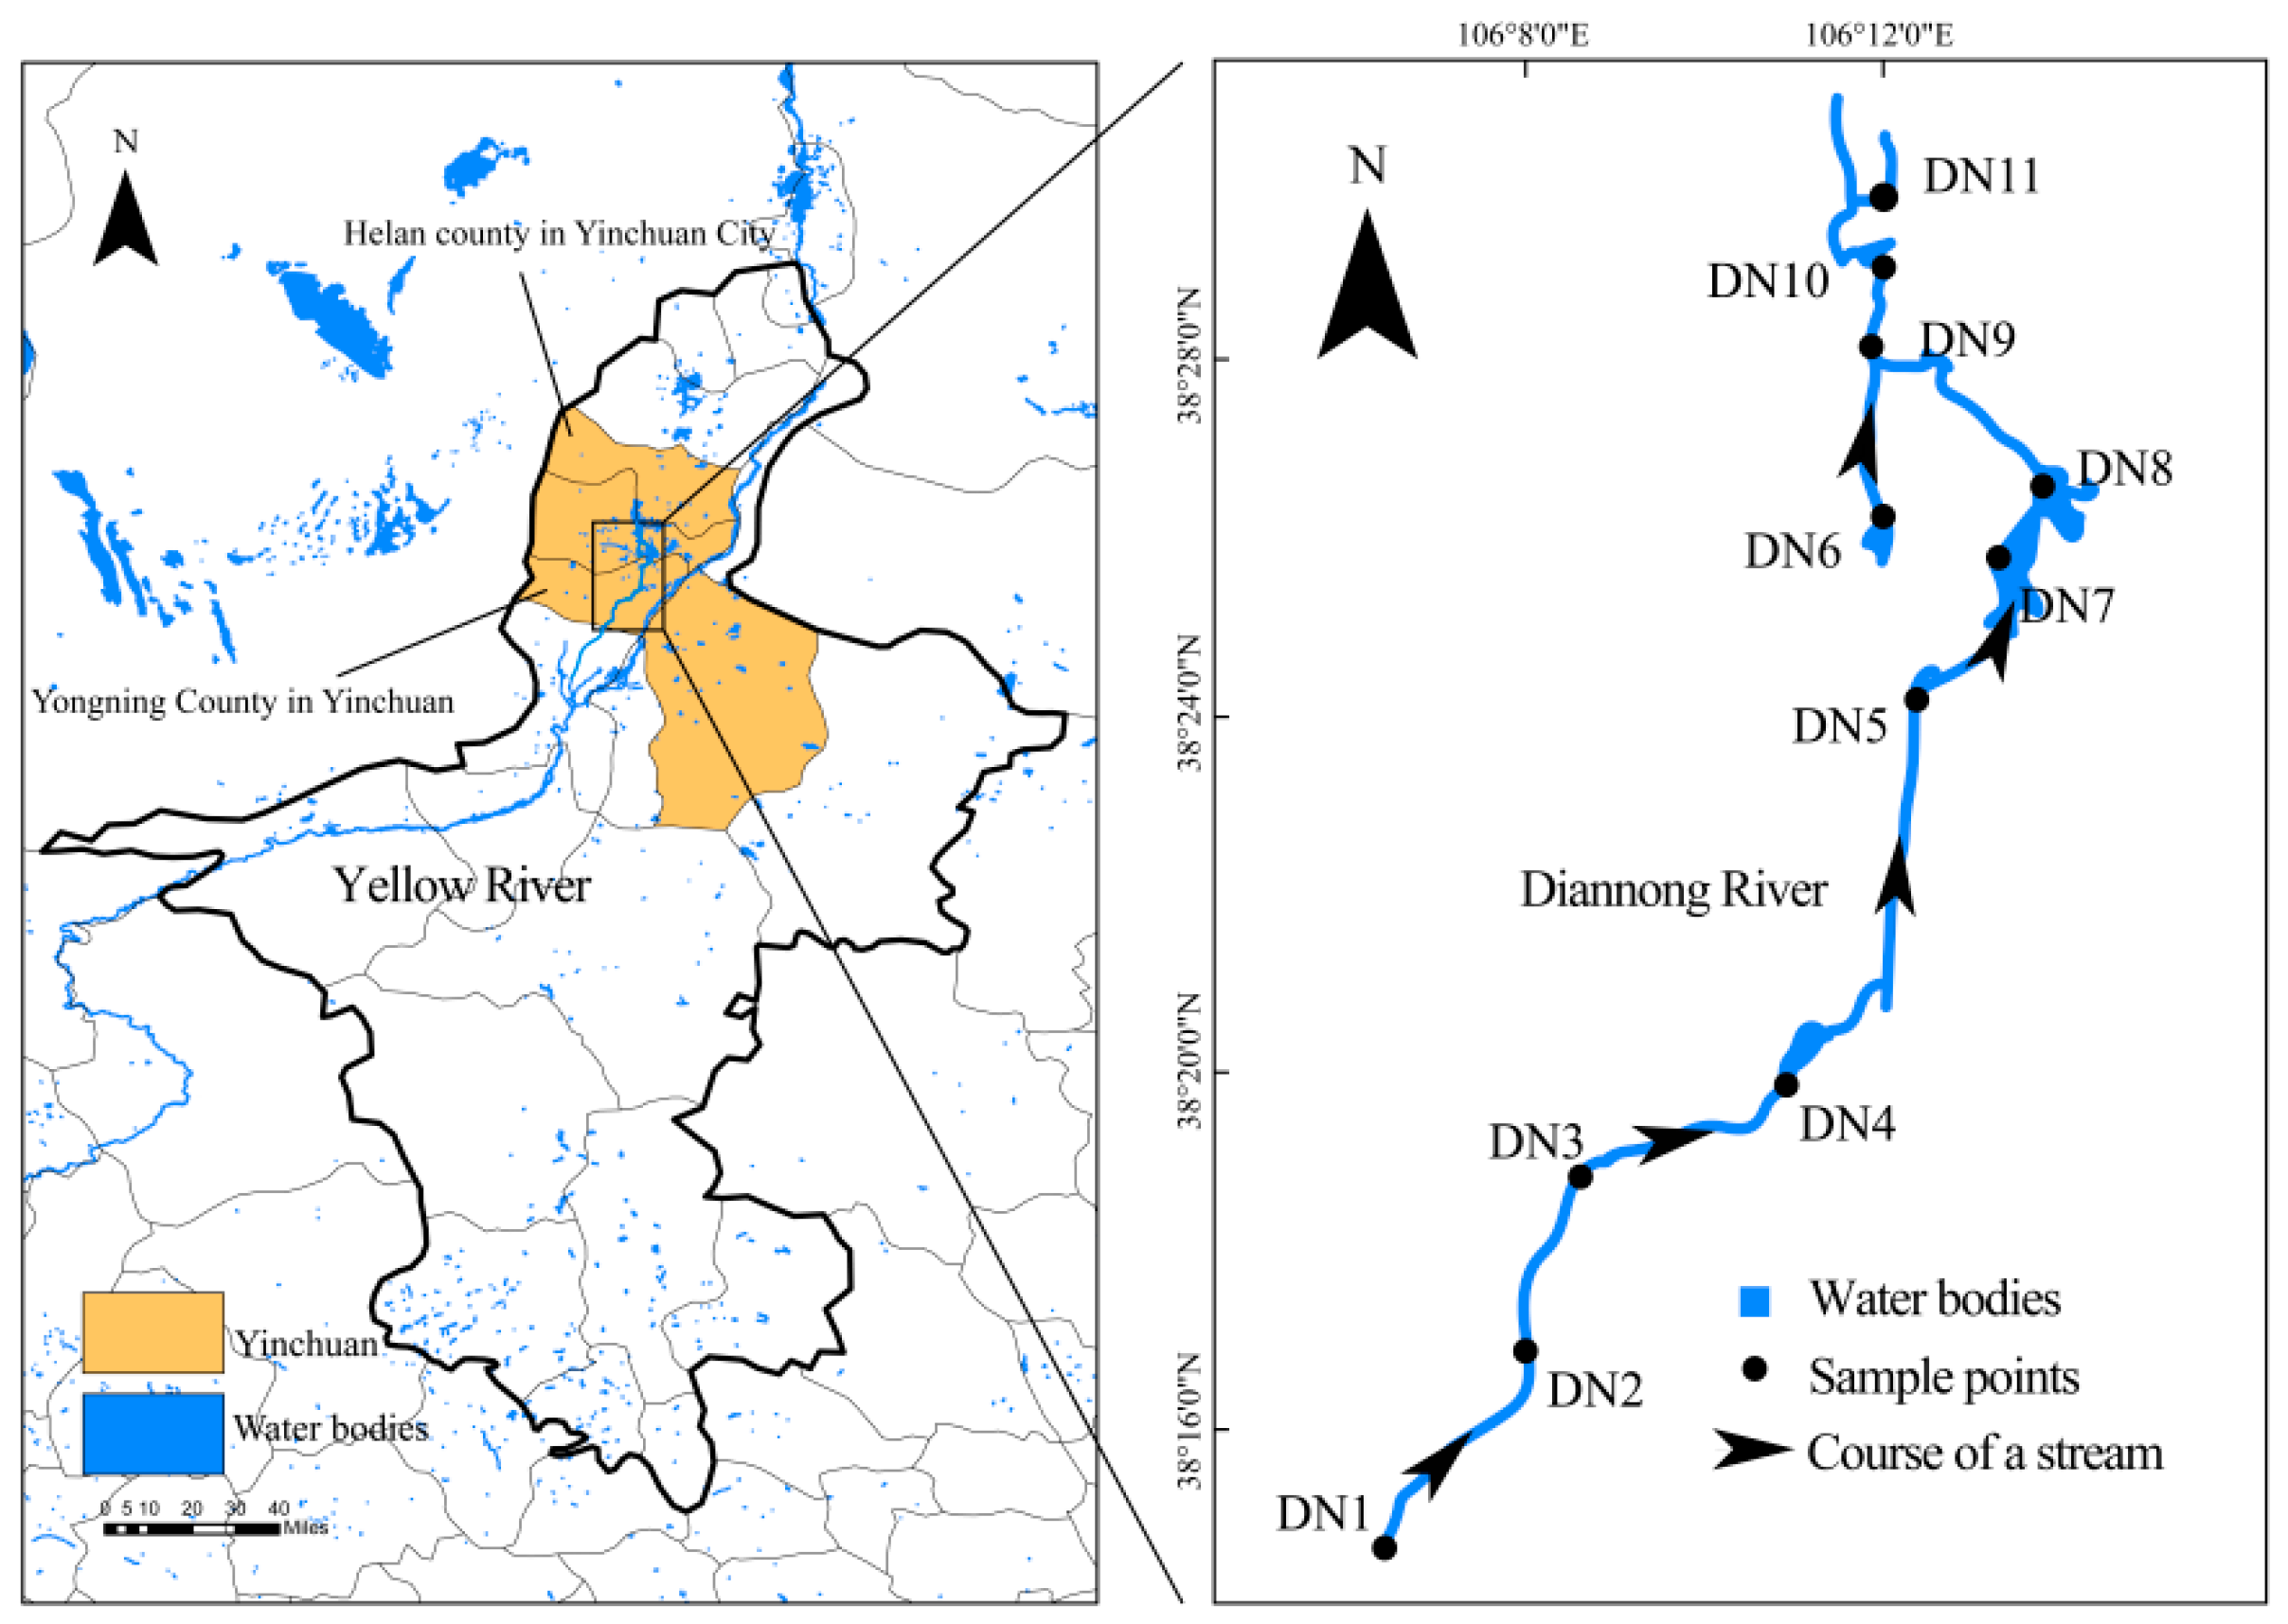
2.1. Overview of the Study Area

The Diannong River, situated in the Ningxia Hui Autonomous Region, originates from the Xinqiao flood detention area in Yongning County in the south and meets the Yellow River at the Riverside Square of Shizui Park in Huinong District, Shizuishan City, in the north. The river traverses six counties and districts across two cities, namely, Yongning County, Xixia District, Jinfeng District, and Helan County in Yinchuan City and Pingluo County and Huinong District in Shizuishan City, spanning a total distance of 180.5 km. The upper segment of the Diannong River stretches from the Yongjia Lake drainage gate in the Tanglai Canal to the Yuehai sluice gate, extending 59 km. This includes a 16 km water conveyance channel in the Yongning section and a 43 km landscape channel in the Yinchuan City section. The middle course of the Diannong River ranges from the Yuehai Sluice to Shahu Lake, measuring 27.5 km. The downstream section, extending from the Gaorong drainage gate to the Yellow River, measures 72 km. The Diannong River plays a pivotal role and significantly impacts the production, lifestyle, and societal advancement of the urban and agricultural regions within its catchment area. Spanning six cities and counties, it interconnects six flood control dams and two flood detention areas, diverts ten drainage ditches, and, in the Yinchuan section, links more than a dozen lakes, including Xihu, Beitahu, Huayan Lake, and Yuehai. It represents an exemplary project for the ecological restoration and management of riverine, lacustrine, and wetland ecosystems. Viewing from a natural feature lens, the lakes appear as natural extensions of the Diannong River, while the Diannong River seems to be the prolongation of the lakes. The constant continuity between the water bodies of the river and the lakes culminates in a wetland ecosystem, comprising a water area of 40 square kilometers, a wetland expanse exceeding 133 square kilometers, and a water storage potential of 90 million cubic meters.

2.2. Sample Points Deployment and Sampling Time

Field sampling investigations were undertaken in the upstream segment of the Diannong River in the months of January, April, July, and October of 2021. From the south to the north, a total of 11 sampling points were arrayed. Each sampling point was strategically sited to avoid areas of stagnation and backflow, selecting river sections that were straight with stable banks and a gentle water flow. The distances between each sampling point were rendered relatively uniform, ensuring coverage across the entire basin (Figure 1).

2.3. Sample Collection and Experimental Methods

The measurements of water temperature (WT), electrical conductivity (Cond), salinity (Sal), dissolved oxygen (DO), pH value, total dissolved solids (TDS), and chloride ion (Cl) were all undertaken using the YSI Pro-plus portable water quality analyzer (Yellow Springs Instruments, Yellow Springs, OH, USA). Fluoride (F) was gauged on-site using the HACH HQ40d portable water quality analyzer (HACH company, Loveland, CO, USA). Chlorophyll a (Chl.a) was quantified on-site employing the HACH Hydrolab DS5X (HACH company, Loveland, CO, USA). Total phosphorus (TP), total nitrogen (TN), available phosphorus (AP), ammonium nitrogen (NH4+-N), permanganate index (CODMn), and chemical oxygen demand (CODCr) were determined in accordance with the “Water and Wastewater Monitoring and Analysis Methods” (Fourth Edition). The analysis of sulfate (SO42−) was conducted based on the GB11899-89 standard [27].
Phytoplankton samples were categorized as qualitative and quantitative. Qualitative samples were collected using a number 25 plankton (Mesh Size: 200 mesh, 64 μm; Length of Net: 50 cm; Inner Circumference of Net Ring: 20 cm) net semi-submerged from the water’s surface to a depth of 0.5 m and maneuvered at a speed of 20 cm/s to 30 cm/s. The net followed a ‘∞’-shaped trajectory, with a slow drag duration of approximately 1 to 3 min. Following this, the plankton net was extracted from the water, and the qualitative samples were collected in the container at the lower end of the net. The lower outlet was then extended into the qualitative sampling bottle, and the switch of the lower piston was activated to collect the qualitative samples.
Quantitative water samples of 1 to 2 L were collected using a water sampler into a specific sampling bottle, with the volume of each sample recorded systematically. Upon completion of the sampling, adequate space was ensured between the liquid surface in the sample bottle and the bottle cap for effective agitation. Upon securing both qualitative and quantitative samples, Lugol’s solution was promptly introduced for fixation, at a proportion of 1.0% to 1.5% of the total water sample volume.
The entire set of quantitative samples were thoroughly agitated and transferred into a concentrator, where they were left undisturbed at room temperature for 24 to 48 h. The supernatant was then removed using a siphon until the phytoplankton sediment reached approximately the 50 mL mark. The bottom piston of the concentrator was unscrewed, allowing the collection of the phytoplankton sediment in a 100 mL graduated cylinder. This concentrator was rinsed 1 to 3 times with a small quantity of the supernatant; the rinse water was accumulated in the cylinder. The volume of the sample in the cylinder, denoting the concentrated volume, was noted, and the concentrated liquid was moved to a centrifuge tube. During the initial settling phase, the walls of the concentrator were gently tapped intermittently to mitigate adsorption. Throughout the siphoning process, the distance between the siphon mouth and the phytoplankton sediment should maintain a gap of at least 3 cm.
Zooplankton sampling was bifurcated into qualitative and quantitative methodologies. For qualitative collection, protozoans and rotifers were gathered using a No. 25 plankton net (mesh size: 200 mesh, 64 μm; length: 50 cm; inner diameter of the ring: 20 cm), while cladocerans and copepods were netted using a No. 13 mesh (mesh size: 125 mesh, 112 μm; length: 50 cm; inner diameter of the ring: 20 cm). Sampling was performed at the water surface down to a depth of 0.5 m, moving the net at a steady pace of 20 cm/s to 30 cm/s in a “∞” pattern for 1 to 3 min. The net was then raised, funneling the plankton into the container affixed to the net base, and subsequently transferred into qualitative collection bottles by opening the piston switch at the bottom end.
Rotifers were quantitatively collected at a standard volume of 1 L. For cladocerans and copepod zooplankton, 20 L was the general volume collected except during cyanobacterial bloom events when 10 L was collected, and 30–50 L was collected from locations with low primary productivity. These samples were concentrated through a No. 25 plankton net into quantitative collection bottles. Immediate fixation with a formaldehyde solution at 4% of the sample volume was conducted post-collection for both qualitative and quantitative samples. Sample labels for both qualitative and quantitative collections should include the type (quantitative or qualitative), sample ID, date of collection, sampling location, and the volume of the sample taken. For qualitative samples, plankton are typically identified at the species level or, minimally, at the genus level. Only protozoa of a size greater than 50 μm are taken into consideration. In the case of quantitative samples, a 0.1 mL counting chamber is employed under an optical microscope to enumerate plankton, thereby estimating the planktonic density and biomass in the original aquatic environment.
The identification of plankton species was carried out by referencing the “Atlas of Freshwater Microorganisms” [28] and “Freshwater Algae in China-Systems, Classification and Ecology” [29].

2.4. Construction of the Plankton Dichotomous Network and Its Analysis

The interaction between phytoplankton and zooplankton was investigated by employing the bipartite network’s distribution matrix [30]. In this matrix, the numeric values represented the co-occurrence frequency of phytoplankton and zooplankton. In addition, to prevent over-complication of the bipartite network, only species pairs with occurrence frequencies greater than half of the sampling points were considered; in other words, species with an occurrence frequency exceeding 5 were considered.

2.5. Data Analysis Methods

The original data underwent standardization, with analysis and data visualization accomplished within R’s vegan, bipartite_D3, ggplot2, and Car packages (version 4.1.2, http://r-project.org) “URL (accessed on 28 September 2023)”. The variance inflation factor (VIF) function was employed to assess collinearity among environmental and biological variables, and those with VIF values exceeding 10 were excluded. The non-parametric Kruskal–Wallis test was applied to investigate the heterogeneity of changes in environmental and biological parameters. Utilizing the bipartite_D3 function, a bipartite network of phytoplankton and zooplankton was constructed. The networklevel function served to analyze the bipartite graph network’s topological relationships, taking into account aspects like non-weighted connectivity, weighted connectivity, interaction evenness, ecological niche overlap, and species vulnerability (average number of low-trophic-level species corresponding to each high-trophic-level species) and generality (average number of high-trophic-level species corresponding to each low-trophic-level species). The bipartite network was visualized using bipartite_D3. A row sum-constrained null model was generated via the nullmodel function, and the t-test function was employed to statistically test the nestedness structure of the distribution matrix against the null model. The Mantel test function in the vegan package was employed to determine the correlation between environmental variables and the overall plankton community. In conjunction with the Pearson correlation matrix built from water environmental variables, the ggplot2 package was used to visualize the relationship between the plankton community composition in the upstream segment of the Diannong River and the environmental variables.

3. Results

3.1. Spatial and Temporal Characteristics of Water Quality

Table 1 displays the 16 water parameters for the upstream section of the Diannong River. This section is characterized by weak alkalinity and high fluoride content. Based on the Kruskal–Wallis test, significant differences were observed in WT, Cond, DO, Sal, TDS, pH, TN, NH4+-N, TP, AP, CODMn, F, Cl, and Chl.a across the four sampling periods (p < 0.05). The month of January was characterized by a pronounced increase in dissolved oxygen (DO) content, surpassing measurements from alternative months, and was concurrently notable for possessing the highest fluoride content.

3.2. Plankton Community Composition and Its Diversity

In the upstream section of the Diannong River, 94 phytoplankton species spanning 8 phyla were detected (Figure 2a). These included 31 Chlorophyta species with relative abundance between 11.87% and 17.40%, 26 Bacillariophyta species with an abundance from 42.13% to 99.52%, 18 Cyanophyta species with an abundance ranging from 0.06% to 13.98%, 11 Euglenophyta species with an abundance ranging from 3.29% to 17.93%, 3 Pyrrophyta species with an abundance ranging from 1.01% to 20.01%, 2 Cryptophyta species with an abundance ranging from 0.54% to 1.06%, 2 Chrysophyta species with an abundance ranging from 0.01% to 0.44%, and 2 Xanthophyta species with 0.10% to 1.41% relative abundance. The species diversity was highest in July and October and lowest in January. The phytoplankton density varied from 164 × 104 to 918 × 104 cell·L−1, with an average density of 557 × 104 cell·L−1 recorded over the four sampling periods. Seasonal differences in phytoplankton density were notable, with the highest density observed in July. The biomass range was between 2 and 8 mg·L−1, with an average of 5 mg·L−1 over the four sampling periods. The biomass peaked at 8 mg·L−1 in July, while in January, the phytoplankton biomass was distinctly lower at 2 mg·L−1.
A total of 38 zooplankton species across four categories were detected in the upstream section of the Diannong River (Figure 2b). This comprised 7 Protozoa species with a relative abundance from 0.02% to 3.05%, 21 Rotifer species with a relative abundance between 0.47% and 18.64%, 5 Cladocera species with an abundance of 3.14% to 17.56%, and 5 Copepod species with a relative abundance ranging from 63.68% to 96.94%. The species diversity was most abundant in July and October and sparsest in January. The yearly average density of zooplankton stood at 135 ind·L−1, spanning from 39 to 334 ind·L−1. July recorded the highest density at 334 ind·L−1, whereas the lowest density was observed in January at 39 ind·L−1. The average annual biomass was 5 mg·L−1, varying from 0.2 to 7.3 mg·L−1. The biomass of zooplankton peaked in July at 7.3 mg·L−1, largely contributed by Protozoa and Copepods, while the season with the minimum biomass was January.

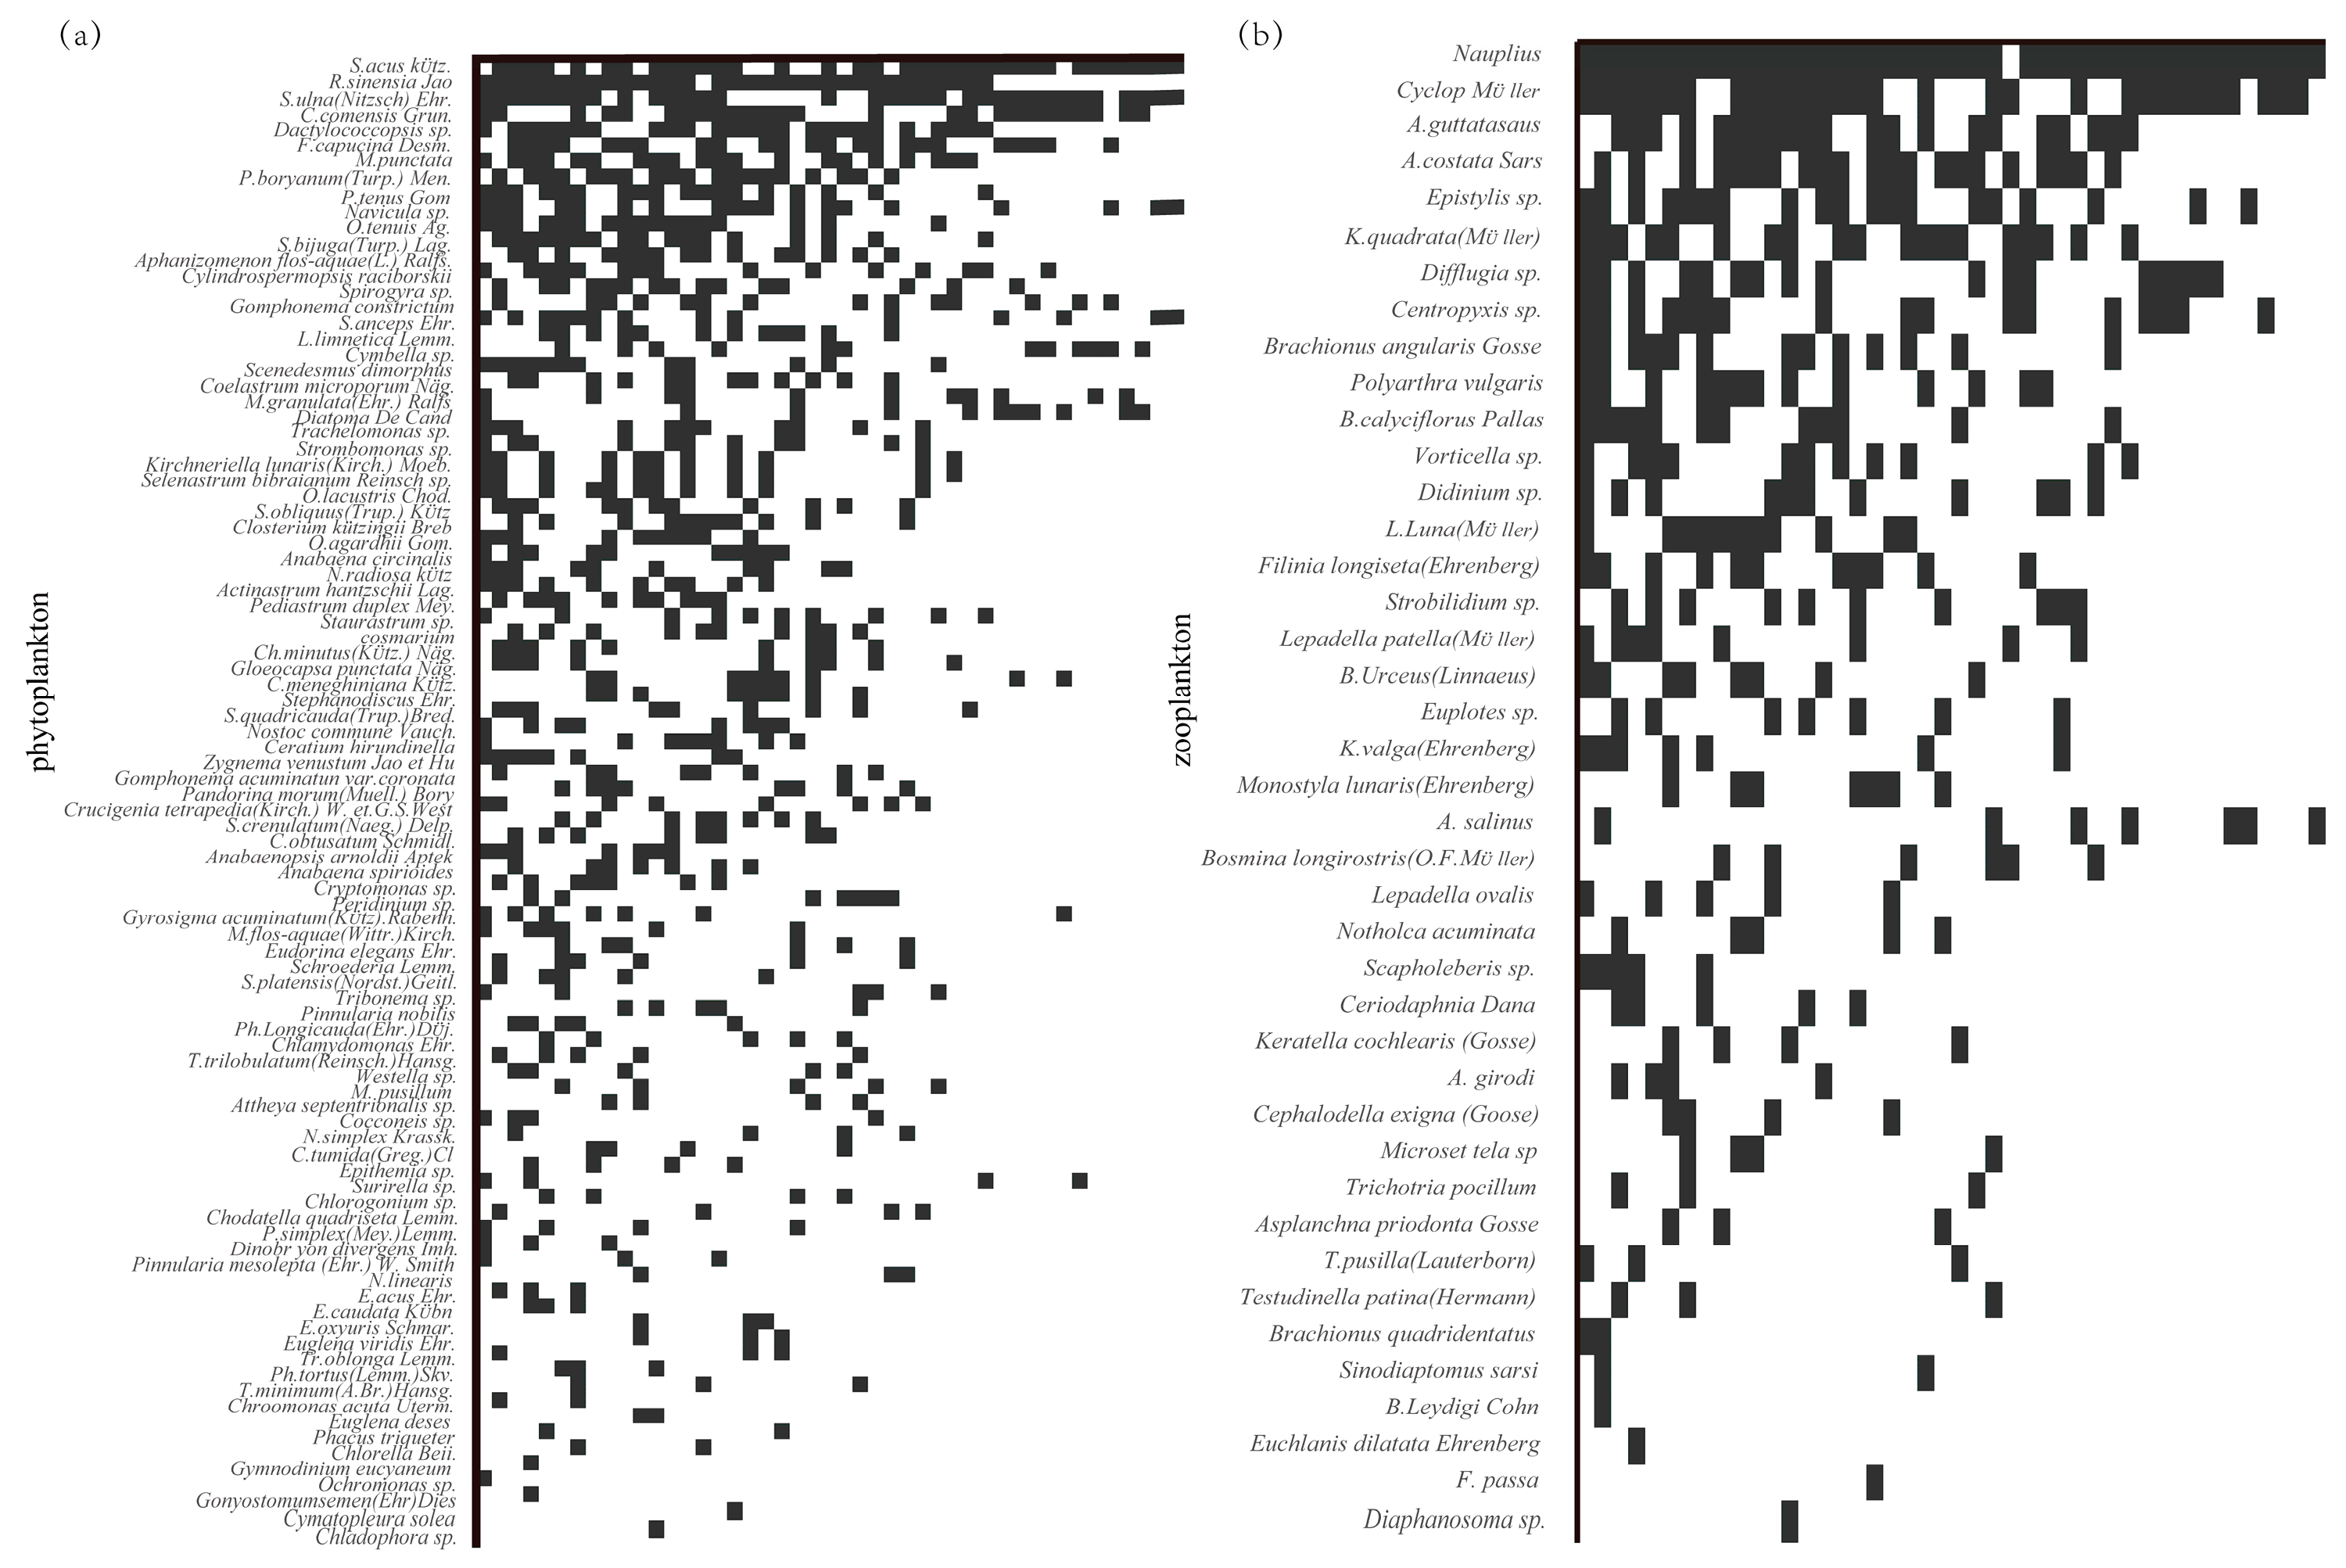
3.3. Nested Patterns of Planktonicity

The temperature of the distribution matrix for the phytoplankton community over the year was 20, while the null model indicated a temperature of 30 ± 3 for the random distribution matrix. The t-test demonstrated a significant difference (p < 0.01) between the actual and random distribution matrices, suggesting a pronounced nested structure in the phytoplankton community in the upstream section of the Diannong River (Figure 3a). According to the distribution matrix, the most widespread species (top 10 in terms of frequency of occurrence) included Synedra acusvar, Raphidiopsis sinensia, Synedra ulna, Cyclotella comensis Grun, Dactylococcopsis, Fragilaria capucina, Oscillatoria punctata, Pediastrum boryanum, Phormidium tenue, and Navicula sp. The temperature of the distribution matrix for the zooplankton community was measured at 12, while the null model identified the temperature for the random distribution matrix as 20 ± 5. The T-test demonstrated a significant disparity (p < 0.01) between the two, indicating a marked nested structure within the zooplankton community (Figure 3b). The most widespread species (top 10 in terms of frequency) identified from the distribution matrix included nauplius, Cyclops, Alona guttata, Alona costata, Carchesium sp, Keratella quadrata, Difflugia sp, Centropyxis sp, Brachionus angularis, and Polyarthra vulgaris.

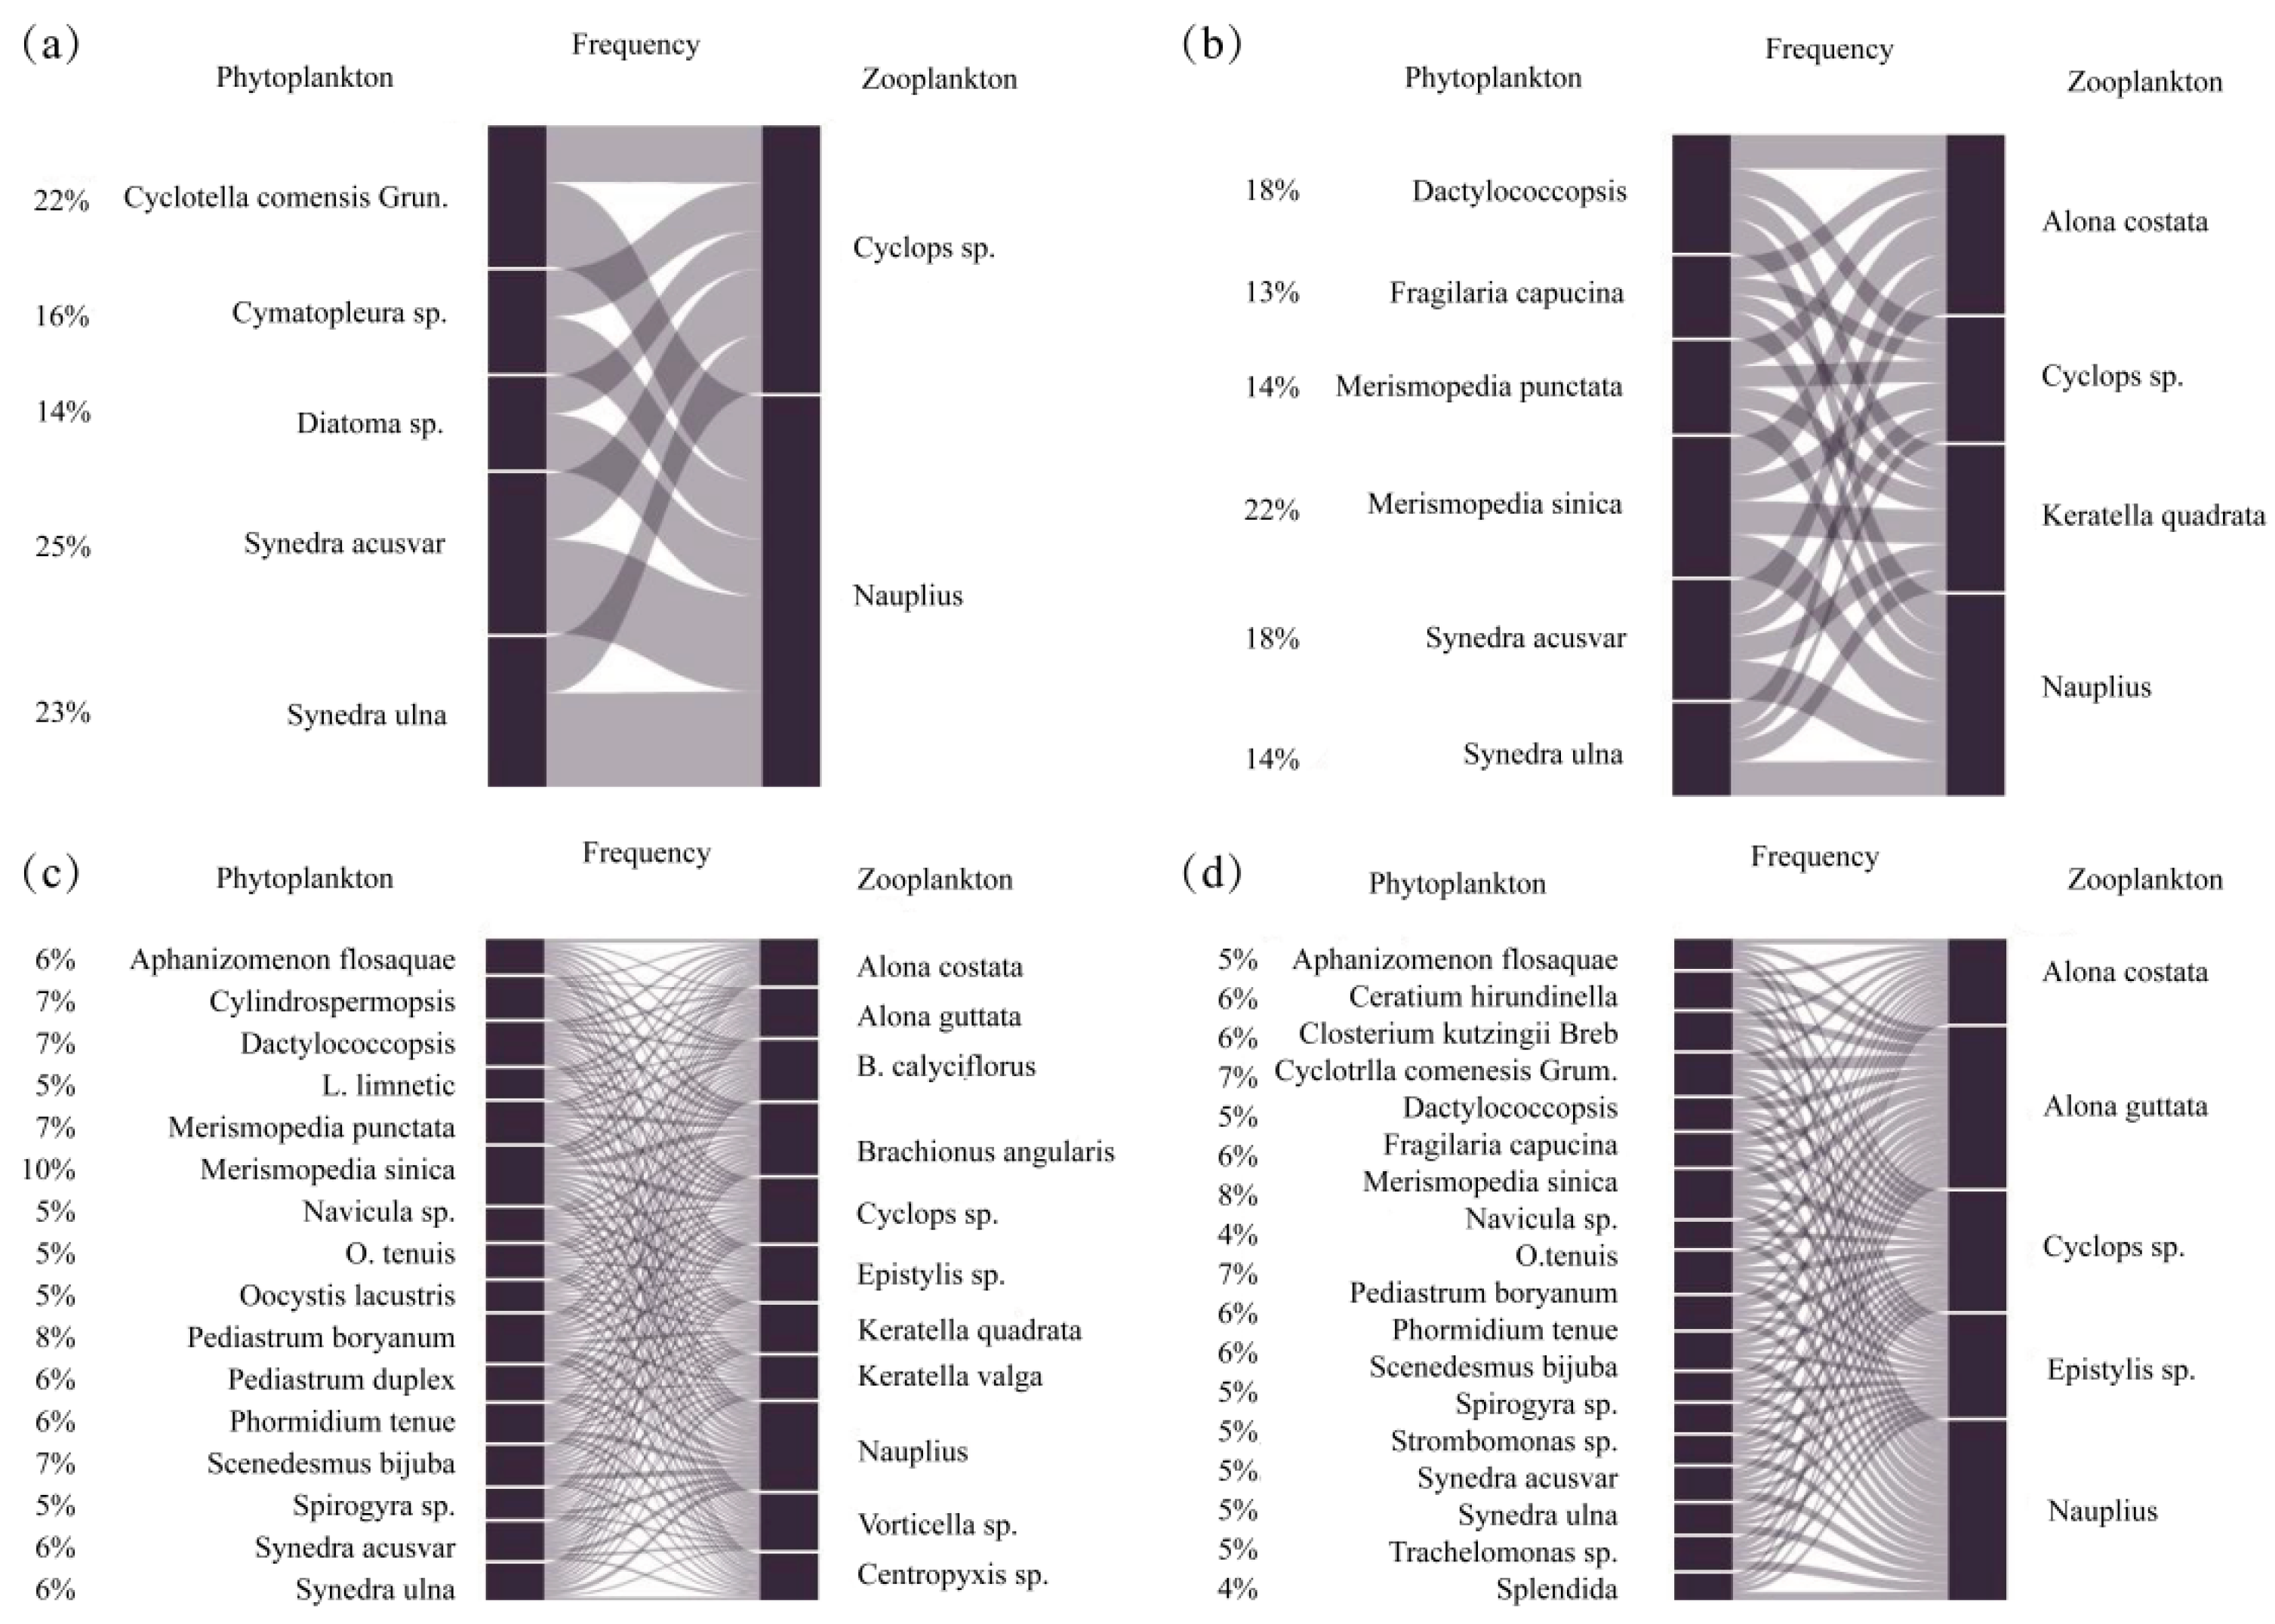
3.4. Plankton Interaction Network Relationships

The bipartite network of plankton in the upstream section of the Diannong River displayed considerable seasonal variations (Figure 4), with distinct discrepancies observed in January, April, July, and October. The network was least complex in January, comprising 7 nodes and 10 edges. The species counts for phytoplankton and zooplankton were five and two, respectively, with an unweighted connectivity of 1.00, a weighted connectivity of 0.49, a mutual evenness of 0.98, an ecological overlap of 0.99, and species vulnerability and generalism scores of 1.96 and 4.89, respectively. The bipartite network in April consisted of 10 nodes and 24 edges. The species counts of phytoplankton and zooplankton were six and four, respectively, with an unweighted connectivity of 1.00, a weighted connectivity of 0.49, a mutual evenness of 0.99, an ecological overlap of 0.99, and species vulnerability and generalism scores of 3.92 and 5.87, respectively. The July bipartite network encompassed 27 nodes and 176 edges. The count of phytoplankton and zooplankton species was 16 and 11, respectively, with an unweighted connectivity of 1.00, a weighted connectivity of 0.48, a mutual evenness of 0.99, an ecological overlap of 0.97, and species vulnerability and generalism indices of 10.61 and 15.52, respectively. The October bipartite network comprised 23 nodes and 90 edges. The count of phytoplankton and zooplankton species was 18 and 5, respectively, with an unweighted connectivity of 1.00, a weighted connectivity of 0.49, a mutual evenness of 0.99, an ecological overlap of 0.99, and species vulnerability and generalism indices of 4.80 and 17.67, respectively. The topological structure exhibited distinct seasonal distribution characteristics, with the ecological overlap and weighted connectivity of the plankton community in April being superior to those in January, July, and October. The findings inferred that the bipartite network in July was larger and more intricate than those in other months, indicating the highest complexity in the plankton community composition in July. Table 2 lists the taxa with robust co-occurrences (frequency ≥9) in the planktonic bipartite networks of the upper Dianong River, captured during distinct temporal intervals.
Plankton with a co-occurrence frequency greater than nine were selected to form a strong correlation network.

3.5. Correlation Analysis between Plankton and Water Environment Factors

Pearson correlation analysis was employed to investigate the interaction between the plankton community in the upstream section of the Diannong River and various water environment parameters (Figure 5). Significant correlations were observed between phytoplankton and water temperature (WT) (Pearson’s R = 0.77, p = 9.8 × 10⁻¹⁰), dissolved oxygen (DO) (Pearson’s R = −0.6, p = 1.4 × 10⁻⁵), total phosphorus (TP) (Pearson’s R = −0.34, p = 0.026), available phosphorus (AP) (Pearson’s R = 0.5, p = 0.00057), CODCr (Pearson’s R = 0.34, p = 0.026), F (Pearson’s R = −0.3, p = 0.049), Cl (Pearson’s R = −0.44, p = 0.0028), and Chl.a (Pearson’s R = −0.41, p = 0.004). However, no significant correlation was detected between zooplankton and any of the water environment parameters.

4. Discussion

4.1. Plankton Composition and Its Diversity in the Upper Section of the Diannong River

The low relative abundance of cyanobacteria in the upstream section of the Diannong River may be due to their positive correlation with resource availability-related variables, such as SRP, TDN, TSS, and Chl.a [31]. Most cyanobacterial species are present in eutrophic water bodies, with only a few occurring in less productive environments [32]. In riverine habitats, rapid flow rates make it difficult for cyanobacteria to attach, grow, and form dominant groups. Additionally, only cyanobacteria show a significant correlation with environmental heterogeneity, potentially due to the wide range of environmental conditions where these species can be found [33]. Chlorophyta display limited correlation with a few variables, such as high nutrient concentrations, especially for nitrogen-containing compounds [34]. The upstream section of the Diannong River is dominated by diatoms during all sampling periods, and research indicates that diatoms exhibit weak and insignificant correlations with water environmental factors, with only a few variables, such as nutrient concentrations and conductivity, displaying correlations with diatoms [35]. Zooplankton predation is a key factor in controlling phytoplankton populations and is among the main reasons for the reduction in phytoplankton populations [36].

4.2. Nested Structure of Plankton in the Upper Section of the Diannong River

The nesting patterns might be a result of ‘passive human sampling’ [37]. That is, significant variations exist in species abundance across different habitats. Consequently, species with higher abundance have a greater likelihood of being sampled. In different sampling areas, species with high abundance are more likely to appear both in small and large sample areas and vice versa for species with lower abundance. This leads to the natural formation of a nested structure in a series of species combinations across different sampling areas. ‘Passive sampling’ relates to the disparity in species abundance and sampling intensity, which explains why widespread species (those ranked in the top 10 for frequency of occurrence) are usually also the dominant species (those ranked in the top 10 for relative abundance). However, in the context of this study, only three species were the same among both the widespread and dominant species of phytoplankton (those ranked in the top 10 for frequency of occurrence and relative abundance), and only five species were the same among both the widespread and dominant species of zooplankton (those ranked in the top 10 for frequency of occurrence and relative abundance). This dismisses the notion that the nested structure of the plankton community results from random sampling. Additional research indicates a relationship between the nested structure of planktonic plant communities in freshwater ecosystems and an array of factors, including physical and chemical characteristics of the water, water connectivity, and environmental variables such as pH, total phosphorus (TP), and conductivity (Cond) [38,39]. Nonetheless, phytoplankton communities are highly heterogeneous in composition, with species from different populations presenting different ecological needs, tolerances, and dispersion capacities. In freshwater ecosystems, the richness of primary producer species escalates with nutrient enrichment. Enhanced resource availability may facilitate the persistent existence of more species by maintaining a multitude of populations less susceptible to random extinction through niche diversification [40].
The nested structure of plankton in the upstream section of the Diannong River demonstrates significant temporal nestedness in both phytoplankton and zooplankton. In the case of phytoplankton, the majority cannot actively migrate, and even those capable of migration primarily move in the vertical direction [41]. The phytoplankton in the upstream section of the Diannong River exhibit sensitivity to environmental changes and display significant correlations with WT, DO, TP, AP, CODCr, F and Cl. Certain studies have indicated that phytoplankton may enter a dormant state under increased environmental stress and during algal blooms [42], thereby reducing their volume, settling at the bottom of the water body, and forming cysts within the sediment, leading to a subsequent decrease in the water’s phytoplankton biomass. Nutrients such as nitrogen and phosphorus are preferentially absorbed and converted by phytoplankton. In consideration of these factors, alterations in water temperature, and nitrogen and phosphorus nutrients are the main factors contributing to the temporal nested structure of phytoplankton. Assessing the nestedness results of zooplankton in the upstream section of the Diannong River, it is evident that zooplankton display various degrees of nestedness. In conceptual terms, nestedness implies the loss of zooplankton species across different stations rather than species replacement [43], which is evidently associated with the diffusion distribution status of species. The influence of conductivity on the variations in zooplankton nestedness remains unclear. It is reported that conductivity is linked to soluble nutrients in the water body [44]; therefore, the potential relationship between conductivity (Cond) and zooplankton nestedness, and whether it relates to the distribution of nutrients in the water body, calls for further investigation. Previously monitored variables indicate that temperature, dissolved oxygen, and salinity are the three main factors driving zooplankton spatial distribution [45]. However, in this study, these variables did not exhibit a significant impact on the zooplankton community. The reasons underpinning the temporal nested structure of zooplankton still require additional research.

4.3. Seasonal Characteristics of the Interaction Network between Phytoplankton and Zooplankton in the Upper Section of the Diannong River

The bipartite network analysis of the upstream section of the Diannong River between phytoplankton and zooplankton reveals that the number of interacting species in April, July, and October substantially exceeds that in January. This suggests higher ecological stability in the upstream section of the Diannong River during April, July, and October compared to January. Research indicates that community diversity plays a pivotal role in bipartite network formation [46,47]. Particularly, the diversity of low-trophic-level communities plays an important role, wherein higher diversity contributes to the inclusion of more species within the bipartite network [48]. However, in the upstream section of the Diannong River, the quantity of species in January is markedly lower compared to that in April, July, and October. Phytoplankton serve as the primary producers in aquatic ecosystems, while zooplankton function as consumers. Typically, in natural water bodies, there is an inverse relationship between the biomass of phytoplankton and that of zooplankton—that is, the peak of zooplankton biomass occurs following the peak of phytoplankton biomass, reflecting zooplankton’s predation on phytoplankton [49]. Yet, certain phytoplankton can inhibit zooplankton predation by producing allelochemicals, such as Chlorella secreting chlorellin, to deter predation by large cladocerans [50]. Previous research has indicated significant temporal dynamic changes in the interaction between phytoplankton and zooplankton [51]. Notably, in the upstream segment of the Diannong River, there are also significant seasonal characteristics in the interaction between phytoplankton and zooplankton. The low temperature and weak illumination in January lead to a decrease in the photosynthetic efficiency of phytoplankton, compelling phytoplankton into dormancy due to environmental stress, which consequently results in a decline in the number of phytoplankton in January and an intensification of ecological niche overlap among species. Simultaneously, with the action of the bottom-up effect, fierce competition among zooplankton is induced [52,53].
The bipartite network topology of plankton in the upstream section of the Diannong River reveals that the weighted degree values in January, April, and October surpass those in July. This suggests that the plankton network exhibits greater specificity in January, April, and October, with competition among species mitigated through ecological niche separation. The vulnerability and ubiquity of species suggest that plankton display greater redundancy in April, July, and October, implying the presence of more compensatory mechanisms when subjected to certain disturbances and thereby enhancing community stability [54].

4.4. Correlation between Plankton and Water Environment Factors in the Upstream Section of the Diannong River

Variations in numerous physicochemical factors within the aquatic environment, including pH, nutrients, and temperature, directly influence the survival, growth, and reproduction of plankton [55]. Plankton can also exert effects on the water environment. For instance, a large-scale proliferation of phytoplankton can lead to algal blooms, resulting in reduced water transparency, a decrease in dissolved oxygen levels, diminished biodiversity, and subsequent damage to the aquatic ecosystem [56]. Conversely, phytoplankton can enhance water quality through photosynthetic oxygen production, the absorption of carbon dioxide and nutrients such as nitrogen and phosphorus, the adsorption of heavy metals, and the removal of organic matter [57]. The association between plankton and water environmental factors in the upstream segment of the Diannong River indicates a significant negative correlation between dissolved oxygen (DO), total phosphorus (TP), F, Cl, and Chl.a and phytoplankton, while water temperature (WT), AP, and CODCr present a significant positive correlation with phytoplankton. The proliferation of phytoplankton significantly intensifies with the increase in water temperature. However, as the water temperature ascends, the level of dissolved oxygen diminishes [58]; therefore, it exhibits a significant negative correlation with phytoplankton. Furthermore, earlier studies have indicated that changes in the structure of phytoplankton communities are tied to factors like nitrogen and phosphorus concentrations [59] and conductivity [60]. Nutrient salts, which are crucial for phytoplankton growth, reveal that changes in their concentrations not only affect the abundance of phytoplankton but also trigger changes in the structure of the phytoplankton community [61]. In this research, phytoplankton display a significant association with total phosphorus (TP) and available phosphorus (AP). Excessively high concentrations of total phosphorus can lead to the eutrophication of water bodies, triggering algal blooms and hypoxia, which is in agreement with some prior studies [62]. It is commonly understood that there exists a positive correlation between the abundance of phytoplankton and the concentration of Chl.a, the primary pigment involved in the photosynthetic activity of phytoplankton, particularly algae. Generally, an increase in phytoplankton concentration is paralleled by an increase in the total Chl.a content within the aquatic milieu. However, this investigation observed a significant inverse relationship, suggesting potential influences from factors such as changes in species composition and variations in light conditions. If ecological changes lead to a decrease in the Chl.a content within phytoplankton, it could result in a reduction in the overall concentration of Chl.a in the water regardless of any increase in total phytoplankton biomass. Furthermore, inadequate or excessive light conditions could inhibit the synthesis or stimulate the degradation of Chl.a, respectively, altering its concentration independent of phytoplankton abundance. Identifying the exact reasons for these observations requires a nuanced approach, due to the complexity of aquatic ecosystems, and may involve employing a wide range of scientific methods and analytical tools.
The upstream segment of the Diannong River did not exhibit any significant correlation between zooplankton and water environmental factors. In natural ecosystems, the impact of environmental factors on plankton is mutual, meaning that it is not the influence of a single factor alone that determines the distribution and development of plankton but the cumulative effect of numerous environmental factors. Moreover, the scale of the sampling time can cause limitations in the results. Therefore, further research is required on the habitat factors influencing plankton.

5. Conclusions

Comprehending the structure of the plankton community and discerning the environmental drivers that influence it are instrumental for the evaluation of environmental and ecological statuses. The upstream section of the Diannong River showcases pronounced seasonal variations in water quality, paired with a diverse plankton community. Both phytoplankton and zooplankton exhibit a nested distribution pattern, which is shaped by an array of factors such as temperature fluctuations, nutrient availability, and water environment heterogeneity. Specifically, the biomass of phytoplankton is predominantly modulated by changes in temperature and nutrient concentrations, while the correlation between zooplankton and these environmental factors remains less elucidated. Temporal dynamics reveal heightened stability and resilience in the plankton community during July, suggesting an augmented capacity to buffer against environmental perturbations within this period. Future investigations should aim to delineate the individual impacts of each environmental determinant on the nested structure of the plankton community, an endeavor crucial for enhancing the stewardship of aquatic ecosystems across river basins.

Author Contributions

All authors played an important role in this study and upheld a research-learning attitude in conducting the experiments, writing, and revising. Conceptualization, J.M. and X.Q.; methodology, J.M.; software, J.M.; validation, J.M., R.Z. and S.L.; formal analysis, J.M., R.Z. and S.L.; investigation, J.M.; resources, X.Q.; data curation, J.M. and R.Z.; writing—original draft preparation, J.M.; writing—review and editing, X.Q.; visualization, J.M.; supervision, X.Q.; project administration, J.M.; funding acquisition, X.Q. All authors have read and agreed to the published version of the manuscript.

Funding

This work was financially supported by the Natural Science Foundation of Ningxia (Key) Project, project no. (2023AAC02026). This study was also supported by a grant from the Ningxia University first-class discipline (water conservancy engineering) construction subsidy project under award number NXYLXK2021A03, and was also supported by the Graduate Student Innovation Program of Ningxia University under the project number (CXXM202241).

Institutional Review Board Statement

Not applicable.

Informed Consent Statement

Not applicable.

Data Availability Statement

The data are not publicly available due to privacy.

Acknowledgments

This material is based on work supported by the Natural Science Foundation of Ningxia (Key) Project, project no. (2023AAC02026), the Ningxia University firstclass discipline (water conservancy engineering) construction subsidy project under award number NXYLXK2021A03, and the Graduate Student Innovation Program of Ningxia University under the project number (CXXM202241).

Conflicts of Interest

The authors declare that there were no conflict of interest or any potential financial or other interests that could be perceived to influence the outcomes of this research.

References

  1. Hou, E.G.; Shang, S.Q.; Guan, S.S.; Sun, S.H.; Bai, H.F.; Yin, X.W. Spatial and temporal distribution and functional group characteristics of plankton community in Jixi wetland, Jinan City. J. Dalian Ocean Univ. 2023, 38, 482–493. [Google Scholar] [CrossRef]
  2. Lin, J.N.; Ming, H.X.; Zhang, Q.L.; Fan, F.J. Marine plankton-associated transmission of vibrios: A review. Microbiol. China 2023, 50, 4681–4693. [Google Scholar] [CrossRef]
  3. Xu, S.S.; Liu, F.; Chen, S.Y.; Zhang, Y.J.; Chen, L.J. Correlation analysis of macrobenthos community structure with plankton and environmental factors in the Chaiqu Zangbo Basin in Tibet. Acta Sci. Circumst. 2023, 43, 418–427. [Google Scholar] [CrossRef]
  4. Yang, Y.; Niu, H.Y.; Xiao, L.J. Spatial heterogeneity of spring phytoplankton in a large tropical reservoir: Could mass effect homogenize the heterogeneity by species sorting? Hydrobiologia 2018, 819, 109–122. [Google Scholar] [CrossRef]
  5. Liu, Y.L. Temperature and nutrients are significant drivers of seasonal shift in phytoplankton community from a drinking water reservoir, subtropical China. Environ. Sci. Pollut. Res. 2014, 21, 5917–5928. [Google Scholar] [CrossRef]
  6. Elliott, J.A. The seasonal sensitivity of Cyanobacteria and other phytoplankton to changes in flushing rate and water temperature. Glob. Change Biol. 2010, 16, 864–876. [Google Scholar] [CrossRef]
  7. Cottingham, K.L.; Carpenter, S. Population, community, and ecosystem variates as ecological indicators: Phytoplankton responses to whole-lake enrichment. Ecol. Appl. 1998, 8, 508–530. [Google Scholar] [CrossRef]
  8. Reynolds, C.S.; Padisák, J.; Sommer, U. Intermediate disturbance in the ecology of phytoplankton and the maintenance of species diversity: A synthesis. Hydrobiologia 1993, 249, 183–188. [Google Scholar] [CrossRef]
  9. Bess, Z.; Chandra, S.; Suenaga, E. Zooplankton influences on phytoplankton, water clarity, and nutruents in Lake Tahoe. Aquat. Sci. 2021, 83, 1–15. [Google Scholar] [CrossRef]
  10. Yuan, Y.X.; Jiang, M.; Liu, X.T.; Yu, H.; Otte, M.L.; Ma, C.; Her, Y.G. Environmental variables influencing phytoplankton communities in hydrologically connected aquatic habitats in the Lake Xingkai Basin. Ecol. Indic. 2018, 91, 1–12. [Google Scholar] [CrossRef]
  11. Liu, C.R.; Ma, K.P.; Chen, L.Z. Nestedness: Methods, mechanisms and implications for biological conservation. Chin. J. Plant Ecol. 2002, 26, 68–72. [Google Scholar] [CrossRef]
  12. Patterson, B.D.; Atmar, W. Nested subsets and the structure of insular mammalian faunas and archipelagos. Biol. J. Linn. Soc. 1986, 28, 65–82. [Google Scholar] [CrossRef]
  13. Atmar, W.; Patterson, B.D. The measure of order and disorder in the distribution of species in fragmented habitat. Oecologia 1993, 96, 373–382. [Google Scholar] [CrossRef]
  14. Lin, L.T.; Ma, K.M. Selection of nullmodels in nestedness pattern detection of highly asymmetric mycorrhizal networks. Chin. J. Plant Ecol. 2019, 43, 611–623. [Google Scholar] [CrossRef]
  15. Bastolla, U.; Fortuna, M.A.; Pascual-Garcia, A.; Ferrera, A.; Luque, B.; Bascompte, J. The architecture of mutualistic networks minimizes competition and increases biodiversity. Nature 2009, 458, 1018–1020. [Google Scholar] [CrossRef] [PubMed]
  16. Thebault, E.; Fontaine, C. Stability of ecological communities and the architecture of mutualistic and trophic networks. Science 2010, 329, 853–856. [Google Scholar] [CrossRef] [PubMed]
  17. Yang, F.; Liu, Z.; Yang, G.S.; Feng, G. Dominated Taxonomic and Phylogenetic Turnover but Functional Nestedness of Wetland Bird Beta Diversity in North China. Land 2022, 11, 1090. [Google Scholar] [CrossRef]
  18. Li, Z.; Lu, Z.; Shu, X.; Jiang, G.; Xu, L.; Zhou, F. Nestedness of bird assemblages in the karst forest fragments of southwestern Guangxi, China. Avian Res. 2022, 30, 92–102. [Google Scholar] [CrossRef]
  19. Clémençon, P.; Letourneur, D.; Ratchinski, P. A plant, a caterpillar, a wasp, and symbiotic microorganisms: Nested multitrophic interactions. Med. Sci. 2019, 35, 586–588. [Google Scholar] [CrossRef]
  20. Atunnisa, R.; Ezawa, T. Nestedness in arbuscular mycorrhizal fungal communities in a volcanic ecosystem, Selection of disturbance-tolerant fungi along an elevation gradient. Microbes Environ. 2019, 34, 327–333. [Google Scholar] [CrossRef]
  21. Aparicio-Rizo, P.; Munoz, G. Spatial and temporal variation of the endoparasite community structure of intertidal fishes incentral Chile, parasitological descriplors, species composition and nestedness. Lat. Am. J. Aquat. Res. 2017, 45, 737–747. [Google Scholar] [CrossRef]
  22. Yu, W.Z.; Yang, D.D.; Ji, M.D.; Bao, H.; Huang, Y.H.; Qu, D.; Ma, S.R.; Han, D.Q.; Fan, W.J. Patial distribution of plankton community in Shahe Reservoir and eutrophication assessment after low water level operation. Acta Sci. Circumst. 2022, 42, 94–102. [Google Scholar] [CrossRef]
  23. Bai, H.F.; Wang, Y.R.; Song, J.X.; Kong, F.H.; Zhang, X.X.; Li, Q. Characteristics of Plankton Community Structure and lts Relation to Environmental Factors in Weihe River China. Ecol. Environ. Sci. 2022, 31, 117–130. [Google Scholar] [CrossRef]
  24. Duan, X.M.; Qin, H.W.; Ma, H.Y.; Xu, Z.H.; Lv, H.R.; Liang, S.K. Temporospatial Distribution of Phosphorus and Response of Phytoplankton to Low Phosphoru: Stress in the Yellow River Estuary and Laizhou Bay. Period. Ocean Univ. China 2023, 53, 87–98. [Google Scholar] [CrossRef]
  25. Li, H.D.; Wu, X.W.; Xiao, Z.S. Assembly, ecosystem functions, and stability in species interaction networks. Chin. J. Plant Ecol. 2021, 45, 1049–1063. [Google Scholar] [CrossRef]
  26. Vorste, R.V.; Stubbington, R.; Acua, V.; Bogan, M.T.; Ruhí, A. Climatic aridity increases temporal nestedness of invertebrate communities innaturally drying rivers. Ecography 2021, 44, 860–869. [Google Scholar] [CrossRef]
  27. Tang, L.Q.; Chi, W.D.; Lv, F.; Gai, S.S.; Liu, W.; Wang, X.Y.; He, Q.; Ding, G. Seasonal Variation and Interrelationship of MarinePlankton and Benthos in Changdao Island. Sea. Period. Ocean. Univ. China 2023, 1–10. [Google Scholar] [CrossRef]
  28. Zhou, F.X.; Chen, J.H. Atlas of Freshwater Microorganisms; Chemical Industry Press: Beijing, China, 2010. [Google Scholar]
  29. Wei, Y.X.; Hu, H.Y. Freshwater Algae of China—System, Taxonomy and Ecology; Science Press: Beijing, China, 2006. [Google Scholar]
  30. Ning, X.Y.; Zhang, L.; Chen, K.Q.; Han, C.A.; Li, Q.S.; Li, K.Y.; He, H.; Zhao, B.Y. Effects of Exopalaemon modestus on nutrient levels and plankton communities in spring and Summel subtropical lakes and reservoirs: A microcosm experiment. J. Lake Sci. 2022, 34, 582–589. [Google Scholar] [CrossRef]
  31. Wan, L.L.; Chen, Z.F.; Guo, J.; Tong, L.H.; Ren, L.J.; Han, B.P.; Wu, Q.L. Principle and application of co-occurrence networks for freshwater ecosystem assessment. J. Lake Sci. 2022, 34, 1765–1789. [Google Scholar] [CrossRef]
  32. Hu, J.J.; Xue, L.Y.; Pang, W.J.; Yan, C.L.; Pei, G.F. Response of Submerged Macrophyte and Filamentous Green Algae to Nitrogen and Phosphorus Loads. Environ. Sci. Technol. 2023, 1–11. Available online: http://kns.cnki.net/kcms/detail/42.1245.X.20230913.0909.002.html (accessed on 28 September 2023).
  33. Soininen, J.; Paavola, R.; Muotka, T. Benthic diatom communities in boreal streams, community structure in relation to environmental and spatial gradients. Ecography 2004, 27, 330–342. [Google Scholar] [CrossRef]
  34. Xie, J.; Su, Y.L.; Wu, B.; Zhang, Y.; Xiao, L.J.; Gu, J.G. Responses of phytoplankton communities to N-P-Fe enrichments in wet season of tropical reservoirs in southern China: A case study of Dashahe Reservoir, Guangdong Province. J. Lake Sci. 2023, 1–11. Available online: http://kns.cnki.net/kcms/detail/32.1331.P.20231012.1623.004.html (accessed on 28 September 2023).
  35. Yan, J.; Xu, Z.J.; Li, T.J.; Wang, H.J.; Zhang, Y.B.; Qian, H. Spatiotemporal dynamics of larvae and juveniles in zhoushan coastal waters and their relationship with environmental factors. Oceanol. Limnol. Sin. 2023, 54, 799–810. [Google Scholar] [CrossRef]
  36. Yin, S.M.; Xing, L.Z.; Zhang, P.Y.; Duan, Y.W. Stability Analysis of Production Networks in the Asia-Pacific Region Based on Nested Structure Theory. Syst. Eng. Theory Pract. 2023, 1–22. Available online: http://kns.cnki.net/kcms/detail/11.2267.N.20230907.1621.010.html (accessed on 28 September 2023).
  37. Bohnenberger, J.E.; Schneck, F.; Crossetti, L.O.; Sonaira, L.M.; Da, M.M.D. Taxonomic and functional nestedness patterns of phytoplankton communi-ties among coastal shallow lakes in southern Brail. J. Plankton Res. 2018, 40, 555–567. [Google Scholar] [CrossRef]
  38. Wang, X.; Wang, Y.P.; Ding, P. Nested species subsets of amphibians and reptiles in Thousand Island Lake. Zool. Res. 2012, 33, 439–446. [Google Scholar] [CrossRef]
  39. Heino, J.; Soininen, J.; Alahuhta, J.; Lappalainen, J.; Virtanen, R. Metacommunity ecology meets biogeography, effects of geographical region, spatial dynamics and environmental filtering on community structure in aquatic organisms. Oecologia 2017, 183, 121–137. [Google Scholar] [CrossRef] [PubMed]
  40. Ramos-Jiliberto, R.; Oyanedel, J.P.; Vega-Retter, C.; Valdovinos, F.S. Nested structure of plankton communities from Chilean freshwaters. Limnologica 2009, 39, 319–324. [Google Scholar] [CrossRef]
  41. Qin, G.L.; Du, G.Z. Effect of species diversity on temporal variability of ecosystem function. Ecol. Sci. 2005, 2, 158–161. [Google Scholar] [CrossRef]
  42. Yang, M.; Bi, Y.H.; Hu, J.L. Diel vertical migration and distribution of phytoplankton during spring blooms in Xiangxi Bay, Three Gorges Reservoir. Lake Sci. 2011, 23, 375–382. [Google Scholar]
  43. Wei, G.L.; Zhang, S.C.; Cai, Z.H.; Zhou, J. Research pogress and ecological roles of phytoplankton cysts. Chin. J. Appl. Ecol. 2020, 31, 685–694. [Google Scholar] [CrossRef]
  44. Dai, M.X.; Zhu, Y.F.; Lin, X.; Mao, S.Q. Interpretation of environmental factors affecting zooplanktonic beta diversity and its components in Xiangshan Bay. Acta Ecol. Sin. 2017, 37, 5780–5789. [Google Scholar] [CrossRef]
  45. Walker, C.E.; Pan, Y.D. Using diatom assemblages to assess urban stream conditions. Hydrobiologia 2006, 516, 179–189. [Google Scholar] [CrossRef]
  46. Wu, M.L.; Wang, Y.S.; Sun, C.C.; Wang, H.L.; Dong, J.D.; Han, S.H. identification of anthropogenic effects and seasonality on water quality in Daya Bay, south China Sea. J. Environ. Manag. 2009, 90, 3082–3090. [Google Scholar] [CrossRef]
  47. Chavez-Gonzleza, E.; Vizentin-Bugoni, J.; Vizquez, D.P. Drivers of the structure of plant-hummingbird interaction net-works at multiple temporal scales. Oecologia 2020, 193, 913–924. [Google Scholar] [CrossRef] [PubMed]
  48. Id, O.C.; Arnan, X.; Bassols, E.; Narcís Vicens Bosch, J. Seasonal dynamics in a cavity-nesting bee-wasp community, Shifts in composition, functional diversity and host-parasitoid network structure. PLoS ONE 2019, 13, e0205854. [Google Scholar] [CrossRef]
  49. Robinson, S.; Losapio, G.; Henry, C. Flower-power, Flower diversity is a stronger predlictor of network stnucture than in-sect diversity in an Arctic plant-pollinator network. Ecol. Complex. 2018, 36, 1–6. [Google Scholar] [CrossRef]
  50. Wang, Y.R.; Xu, T.T.; Dong, W.T.; Yu, H.X. Phytoplankton Community Characteristics and Water Quality Assessment in Songbei National Wetland Park, Harbin. J. Northeast. For. Univ. 2023, 51, 71–76. [Google Scholar]
  51. Chen, F.; Meng, S.L.; Chen, J.Z.; Qiu, L.P.; Fan, L.M.; Song, C.; Zhen, Y.; Li, D.D.; Hu, G.D. Transmissibility characteristics of methomvl in chlorella-water fleas-zebrafish food chain. J. Dalian Ocean Univ. 2022, 37, 784–792. [Google Scholar] [CrossRef]
  52. Chen, Z.D.; Huang, L.P.; Chen, L.; Liang, H.; Liu, Y.Y.; Chen, X.L.; Zhang, T.; Chen, G.J. Seasonal variation and driving factors of carbon and nitrogen stable isotope values of plankton in four lakes of Yunnan Province. Lake Sci. 2021, 33, 761–773. [Google Scholar] [CrossRef]
  53. Tao, M.; Yue, X.J.; Yue, S.; Dai, L.N.; Han, W.W.; Wang, Y.M.; Liu, G.; Li, B. Phytoplankton community structure and cyanobacteria bloom risk of reservoirs in hilly regions of Sichuan Province based on dominant species niche and interspecific association. Acta Ecol. Sin. 2021, 41, 9457–9469. [Google Scholar] [CrossRef]
  54. Li, Y.P.; Li, Y.L.; Fu, J.; Yu, X.G.; Zou, C.J. Niche characteristics of macrobenthic community in the intertidal zone on the west coast of Liaodong Bay. Mar. Sci. 2019, 43, 32–39. [Google Scholar]
  55. Hu, Y.; Zhang, Y.Z.; Jiang, X.Y.; Sao, K.Q.; Tang, Y.M.; Gao, G. Seasonal characteristics of nestedness pattern and interaction of plankton assemblages in East Lake Taihu. J. Lake Sci. 2022, 34, 1620–1629. [Google Scholar] [CrossRef]
  56. George, J.A.; Lonslale, D.J.; Merlo, L.R.; Gobler, C.J. The interactive moles of temperature, nutrients, and zooplankton grazing in con-trolling the winter-spring phytoplankton bloom in a temperate, coastal ecosystem, Long Island Sound. Limnol. Oceanogr. 2015, 60, 110–126. [Google Scholar] [CrossRef]
  57. Zhao, M.; Jiao, S.L.; Liang, H. Eutrophication of Lakes in Karst Plateau Based on the Comprehensive Trophic State index Method. J. China Hydrol. 2020, 40, 9–15. [Google Scholar] [CrossRef]
  58. Gao, J.T.; Wu, F.S.; He, G.H.; Yang, W.H. Phytoplankton Community Characteristics and Environmental Driving Factors of Urban Lakes in Cold Regions. Environ. Sci. Technol. 2021, 44, 1–10. [Google Scholar] [CrossRef]
  59. Pang, Y.J.; Zhao, W.; Wei, J.; Fan, J.J.; Yin, D.P.; Wang, P.A.; Xie, Z.G. Comparison of plankton community structure and water environment characteristics between Huanren Reservoir and Biliuhe Reservoir. J. Dalian Ocean Univ. 2020, 35, 407–416. [Google Scholar]
  60. Xu, H.; Paerl, H.W.; Qin, B.; Zhu, G.; Gaoa, G. Nitrogen and Phosphonus Inputs Control Phytoplankton Growth in Eutrophic Lake Taihu, China. Limnol. Oceanogr. 2010, 55, 420–432. [Google Scholar] [CrossRef]
  61. Wang, H.; Yang, S.P.; Fang, S.Z.; Yu, F.C.; Feng, W.B.; Liu, L.P. Canonical correspondence analysis of relationship between characteristics of phytoplankton communit and environmental factors in Dianchi Lake. China Environ. Sci. 2016, 36, 544–552. [Google Scholar] [CrossRef]
  62. Da, W.Y.; Zhu, G.W.; Wu, Z.X.; Li, Y.X.; Xu, H.; Zhu, M.Y.; Lan, J.; Zhen, W.T.; Zhang, Y.L.; Qin, B.Q. Long-term variation of phytoplankton community and driving factors in Qiandaohu Reservoir, southeast China. J. Lake Sci. 2019, 31, 1320–1333. [Google Scholar]
Figure 1. Diagram of sampling sites in the Diannong River, Yinchuan City, Ningxia Hui Autonomous Region, China.
Water 15 04265 g001
Figure 2. Seasonal characteristics of plankton community abundance composition in the upper section of the Diannong River. (a) Phytoplankton phylum-level community abundance composition in the upper section of the Diannong River; (b) zooplankton phylum-level community abundance composition in the upper section of the Diannong River; (c) phytoplankton genus-level community abundance composition in the upper section of the Diannong River; (d) zooplankton genus-level community abundance composition in the upper section of the Diannong River.
Water 15 04265 g002
Figure 3. Zooplankton distribution matrix in the Cannon River ((a): phytoplankton; (b): zooplankton). The black color indicates species occurring at different sampling locations and times.
Water 15 04265 g003
Figure 4. Seasonal changes in mutualistic networks between phytoplankton and zooplankton communities. (a) January phytoplankton and zooplankton dichotomous networks; (b) April phytoplankton and zooplankton dichotomous networks; (c) July phytoplankton and zooplankton dichotomous networks; (d) October phytoplankton and zooplankton dichotomous networks.
Water 15 04265 g004
Figure 5. Correlation analysis between plankton community and water environment factors in the upstream section of Diannong River. Blue indicates phytoplankton, yellow indicates zooplankton, lines indicate significant linear regression, R is the correlation coefficient, and p-value is the significance of the Mantel test analysis.
Water 15 04265 g005
Table 1. Water parameters (mean ± SD) in the upstream section of the Diannong River in different sampling periods.
Environmental
Parameters
JanuaryAprilJulyOctoberStatistical
Significance
WT (°C)3.1 ± 1.74.1 ± 0.722.1 ± 0.314.1 ± 1.3***
Cond (µS/cm)911 ± 4001445 ± 656998 ± 2732298 ± 1803*
DO (mg/L)14 ± 39 ± 19 ± 25.6 ± 0.4***
Sal (ppt)0.8 ± 0.40.7 ± 0.30.5 ± 0.11.3 ± 1.0**
TDS (mg/L)1073 ± 468878 ± 403592 ± 1631586 ± 1248**
pH8.3 ± 0.27.5 ± 0.18.3 ± 0.38.2 ± 0.2***
TN (mg/L)3.8 ± 3.70.6 ± 0.51.2 ± 1.14.3 ± 3.6**
NH4+-N (mg/L)0.36 ± 0.150.44 ± 0.340.36 ± 0.330.33 ± 0.28**
TP (mg/L)0.05 ± 0.020.04 ± 0.020.03 ± 0.010.03 ± 0.01*
AP (mg/L)0.01 ± 0.010.005 ± 0.0020.0011 ± 0.00020.025 ± 0.025***
CODMn (mg/L)2.5 ± 1.13.9 ± 1.64.5 ± 1.93.9 ± 2.1**
CODCr (mg/L)16.7 ± 10.315.5 ± 10.126.3 ± 20.615.3 ± 7.5ns
F (mg/L)3.8 ± 2.51.2 ± 0.90.8 ± 0.41.1 ± 0.7***
Cl (mg/L)929 ± 536470 ± 375294 ± 121807 ± 705***
SO42− (mg/L)346 ± 333300 ± 235216 ± 115558 ± 488ns
Chl.a (mg/L)31 ± 2127 ± 146.5 ± 3.332 ± 26***
Note: ns, non-significant; *, p < 0.05; **, p < 0.01; ***, p < 0.001. The means of each water environment parameter were the averaged values over all regions.
Table 2. Strongly correlated species in the planktonic dichotomous network of the upstream section of the Diannong River at different time periods.
MonthZooplanktonPhytoplanktonFrequency
JanuaryNaupliusCyclotella comensis Grun.9
NaupliusSynedra acusvar10
NaupliusSynedra ulna10
AprilAlona costataMerismopedia sinica9
NaupliusMerismopedia sinica10
NaupliusSynedra acusvar9
JulyNaupliusPediastrum boryanum9
NaupliusDactylococcopsis9
NaupliusMerismopedia sinica11
Brachionus angularisMerismopedia sinica9
OctoberNaupliusCyclotella comensis Grun.9
NaupliusOithona tenuis9
NaupliusMerismopedia sinica10
Alona guttataCyclotella comensis Grun.9
Alona guttataMerismopedia sinica9
Disclaimer/Publisher’s Note: The statements, opinions and data contained in all publications are solely those of the individual author(s) and contributor(s) and not of MDPI and/or the editor(s). MDPI and/or the editor(s) disclaim responsibility for any injury to people or property resulting from any ideas, methods, instructions or products referred to in the content.

