Article

Utilization of Augmented Reality Technique for Sewer Condition Visualization

1
Smart Water and Environmental Engineering Group, Department of Ocean Operations and Civil Engineering, Faculty of Engineering, Norwegian University of Science and Technology, 6025 Ålesund, Norway
2
GIS Group, Department of Business and IT, University of South-Eastern Norway, 3800 Bø i Telemark, Norway
*
Author to whom correspondence should be addressed.
Water 2023, 15(24), 4232; https://doi.org/10.3390/w15244232
Submission received: 1 November 2023 / Revised: 29 November 2023 / Accepted: 5 December 2023 / Published: 8 December 2023
(This article belongs to the Section Urban Water Management)

Abstract

:
Wastewater pipelines are largely buried underground, and techniques for assessing and visualizing their condition are critical for planning and rehabilitation. This paper introduces a framework for integrating Geographic Information System (GIS), 3D-creation platform, augmented reality (AR) techniques, and machine learning algorithms for the dynamic visualization of the condition of sewer networks. A sewer network in Ålesund City, Norway, was used as a case study, and the developed framework was implemented on an Android OS and Microsoft HoloLens. The results show the potential applications of the integrated framework of GIS, AR, and 3D models for sewer condition visualization. The positioning accuracy of the application for 2D objects is equivalent to that of well-designed GPS receivers (approximately 1–3 m), depending on the handheld device used. Loading and locating 3D objects will be limited by the performance of the devices used.

1. Introduction

The collection, transport, and treatment of wastewater play a significant role in protecting the environment and public health. Wastewater collection systems mainly comprise pipes of different materials that undergo degradation over time. In Norway, the condition of the sewer network in some municipalities is poor, with a low annual renewal rate of approximately 0.6% [1], and requiring significant investments [2]. To plan investments, deterioration models could be used to assess the current and future status of sewer pipes by accounting for intrinsic (e.g., size, age, or material) and extrinsic (e.g., rainfall, soil type, or population) factors. Models used for the assessment and prediction of sewer conditions include regression [3], classification [4], and hybrid models [5]. The results of these models have been presented in Geographic Information System (GIS) for visualization of the geo-location of pipes that need improvement. Although the visualization of pipe conditions in a GIS map provides a powerful interface, inaccuracies in geographical data may inhibit the usefulness of such maps for operation and maintenance tasks. Recent studies reveal that visualization through augmented reality is one of the most cost-effective and dependable approaches for the operation and maintenance of urban underground pipe networks [6,7].
Augmented reality (AR) is a technology that integrates digital/virtual information with the user’s environment in real time. This technique enhances the visual perspectives of the physical real-world environment by using non-visual properties and capabilities of computing devices [8]. With the massive improvements in the computing power of computer software and hardware through Industry 4.0, AR is becoming one of the most promising technologies that in the future will support people in recognizing and experiencing real-world objects in a completely new way [9]. Moreover, AR technology has proven to be an effective supporting tool in product design, manufacturing, maintenance/inspection, and training activities [10]. However, applying AR technique to visualize objects in the water sector is still challenging and limited [11,12,13,14]. For example, Haynes, Hehl-Lange and Lange [14] indicated that the synchronization of 3D points displayed on device monitors and the corresponding points in the real world was one of the biggest challenges associated with the application of AR techniques. In addition, Mirauda, Erra, Agatiello and Cerverizzo [11] showed that handheld device orientation before use is essential, and the reliability of the AR application decreased over time because of drift, requiring that the device be reset during the experiment.
According to Hahmann and Burghardt [15], approximately 80% of all information available can be interpreted as spatial data or geodata. Therefore, profoundly digging into these data can provide valuable information for management and maintenance purposes. Data visualization can be easily implemented by using a variety of visualization packages: for example, the Microsoft Excel (https://www.microsoft.com/en-us/microsoft-365/excel) (accessed on 6 December 2023), the package Matplotlib (version: 3.8.2) in Python for 2D and 3D visualization [16], and the package ggplot2 (version: 3.4.4) in R [17]. One of the most significant disadvantages of the aforementioned packages is the ability to visualize data only on personal computers, which is not convenient for fieldwork. In terms of graphical visualization, spatiotemporal data can be generally visualized in two- or three-dimensional environments using three different techniques, including 2D maps, space-time cubes, or animations [18]. Based on the authors’ knowledge, few mobile applications have implemented the AR technique for visualization in the water sector.
The visualization platform, or visual communication, supports human problem-solving and improves user decision-making performance by transforming non-visual objects into visual objects that are accessible to the human mind [19]. The users/managers cannot effectively control or monitor the system without deeply understanding the data. An effective visualization platform will support water engineers/managers in having a visual overview and correctly evaluating the system status to inform reasonable maintenance strategies [20]. The main aim of this work was to develop a mobile application integrated with AR technique to support sewer management through 2D/3D visualization of sewer conditions. By combining sewer conditions produced from predictive models and AR technology, water engineers/managers can quickly estimate a sewer’s status in the field and reduce workloads compared to conventional methods such as digging or camera-based inspection. The study was conducted on sewer pipes in Ålesund city, Norway that were previously used for the development of deterioration models.

2. Theory and Methods

2.1. Literature Review

The application of AR in the management of underground utilities has received much attention in recent years. Huston, et al. [21] used building information modeling (BIM) and 3D Geographic Information System (GIS) for both design and spatial data during the planning, construction, and system lifecycle management phases of underground utilities. In that work, information technology and sensor signals were discussed to assess the state of urban underground infrastructure (e.g., water-related networks, natural gas, electric power) and provide reliable information for managers, planners, and users. A mask regional convolutional neural network and a 3D model were developed by Fang, et al. [22] to automatically detect, localize, and visualize sewer defects using a floating capsule robot.
A mobile interface connected to the internet using a client–server architecture was introduced by Schall, Zollmann and Reitmayr [13]. This AR system allows users to create, read, update, and delete data from a geospatial database. This mobile AR application improved workflows such as on-site planning, data capture and surveying, and on-site visualization. Similarly, AR systems allowing for editing and visualizing underground facilities’ geographic and attribute data using Unity3D have been developed [23,24]. Pereira, et al. [25] introduced a combination of AR and a ground penetrating radar (GPR) technique for the mapping and assessment of underground infrastructure. This system reduces the limitations of current GPR systems that have degraded or unavailable Global Positioning System (GPS) signals in urban canyons and city tunnels, respectively.
An integration between state-of-the-art technologies, including mobility, Global Navigation Satellite System (GNSS), AR, and 3D GIS geo-database, was mentioned in the study by Jimenez, et al. [26] to guide utility field workers in visualizing buried infrastructure. The authors also indicated market analysis to identify appropriate business models based on the developed system. Although the work briefly showed the main aspects to be considered in future commercialization, it did not clearly explain the aforementioned integration.
An AR-based underground facility management system using Map API and JSON communication techniques was proposed by Kim [27] to provide, manage, and replace the location information from the GIS system for underground facilities. The primary limitations of this approach become apparent as the author delved into its insufficient scalability and the constraints posed by GIS data when integrated with the utilized LibGDX engine.
Li, Feng, Han and Liu [6] developed a mobile augmented reality-based framework to visualize static and dynamic data of a real-life urban gas pipe network. Tarek and Marzouk [28] developed a smartphone AR application to visualize infrastructure networks, thereby improving infrastructure operation and maintenance workflows. An application using a Microsoft HoloLens headset was proposed by Côté and Mercier [29] to visualize pipe maps on the road surface. Rahman, et al. [30] developed an integrated framework comprising machine learning (ML), sensor data, and AR techniques to manage a prawn farm. The results have proved that the AR technique (as well as its integration) is a promising tool to manage assets more efficiently.
The aforementioned studies indicate that augmented reality-based techniques are receiving more attention from researchers and have become one of the promising means of visualization in recent years. This study provides an augmented reality framework for the visualization of pipe conditions. The study introduces a workflow from data collection and processing to ML implementation to predict the condition of sewer pipes, along with a 3D model for sewer condition visualization. The study builds on earlier studies of the authors on sewer condition assessment and prediction using ML for the Ålesund Municipality in Norway [3,4,5]. The platform developed in this study will allow sewer infrastructure managers to visualize the condition of pipes on-site for planning and maintenance.

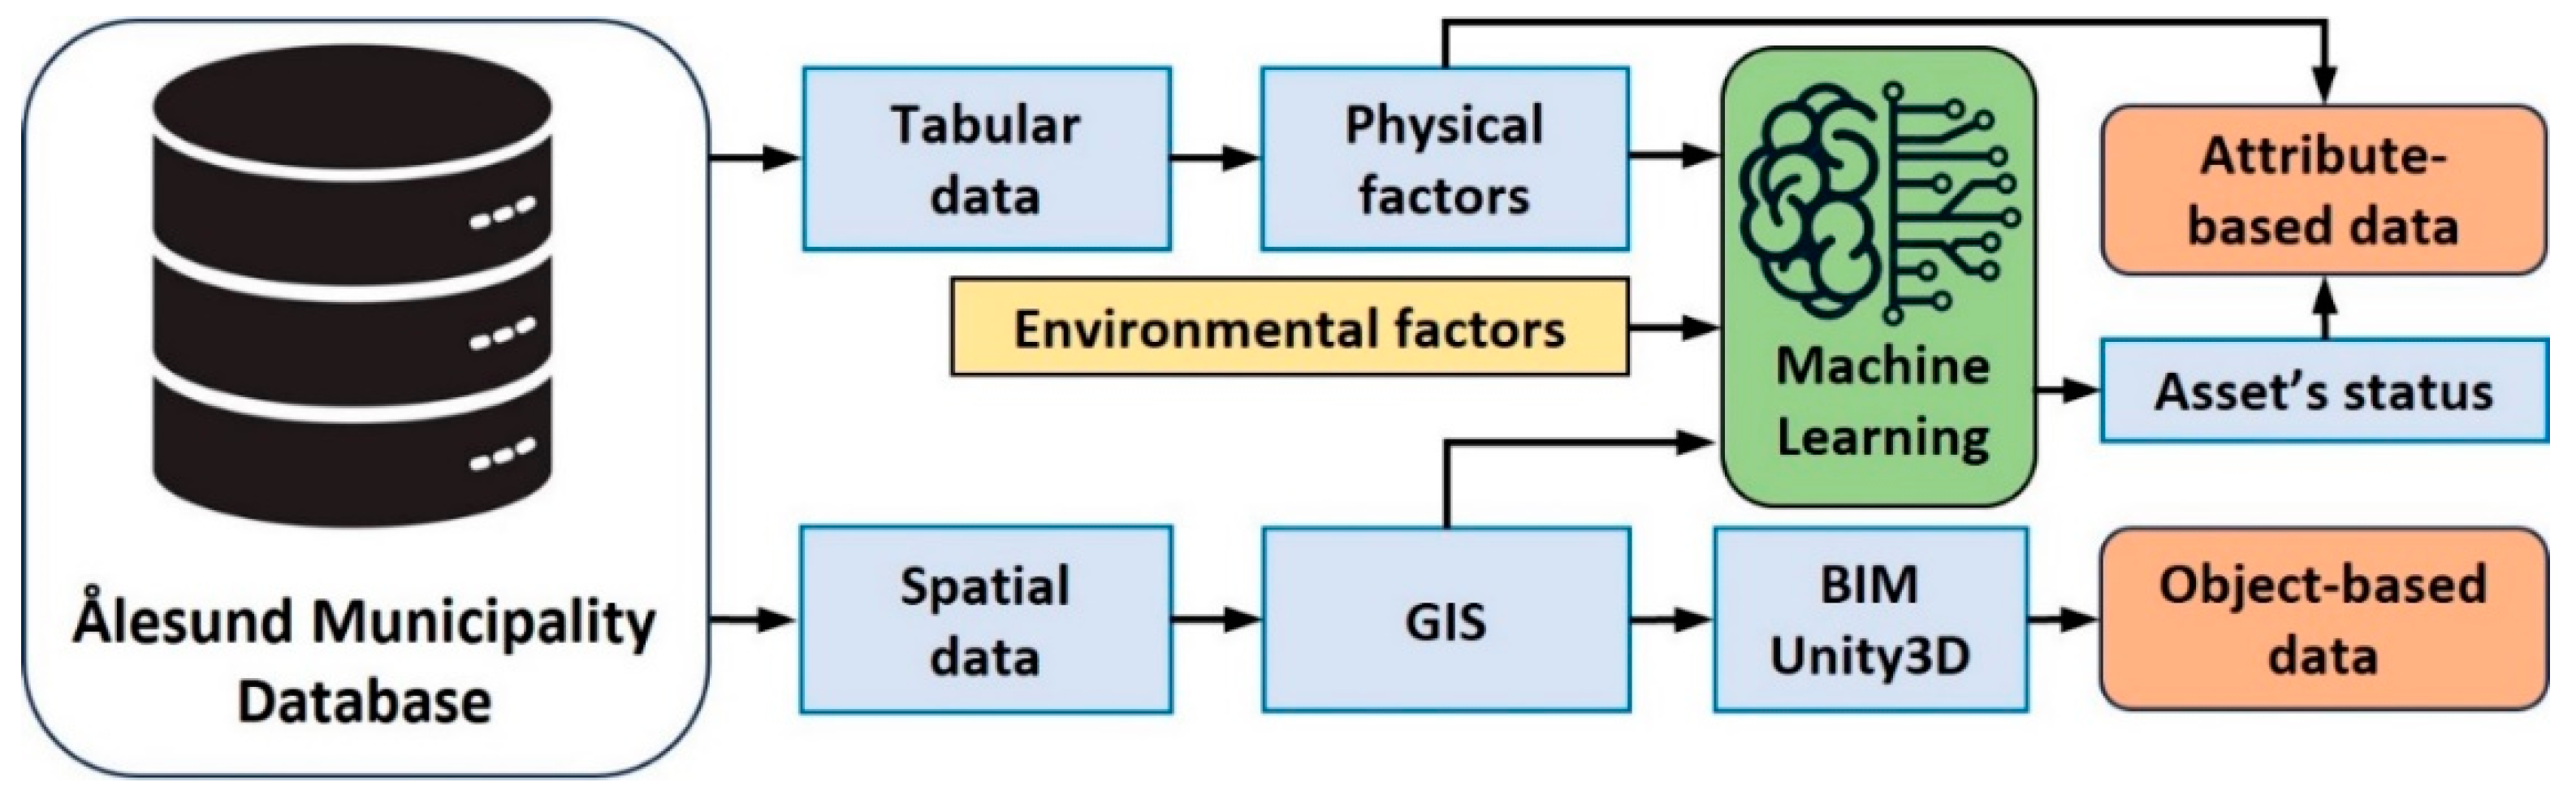
2.2. Data and 3D Model Preparation

Two main data types were used in the preparation phase of this application, including object-based data (3D models such as pipes and manholes) and their corresponding attribute-based data (such as material or status). The steps for data preparation are presented in Figure 1.
Some initial attribute data (e.g., material or installation year) and geospatial data (such as network structure) were extracted from databases managed by the Ålesund Municipality. These data and an auxiliary environmental dataset were used to compute sewer conditions. Sewer conditions were divided into good, intermediate, and bad conditions based on the study of Haugen and Viak [31]. Specifically, for the Ålesund sewer network, 10 physical factors (i.e., age, diameter, depth, length, slope, material, pipe type, network type, pipe form, and connection type) and 10 environmental factors (i.e., rainfall, geology, landslide area, population density, land cover, building area, groundwater level, traffic volume, road network, and soil type) were aggregated and assigned for each sewer pipe. Then, some filter, wrapper, and embedded feature selection methods were applied to eliminate insignificant factors from the dataset. Finally, 10 regression-based ML models, 17 classification-based ML models, and 4 hybrid ML models were developed to estimate the conditions of sewer pipelines. The best output produced from the models was selected as the input for visualizing using the application developed in this study. For more information on the application of ML models for sewer condition assessment, readers are referred to [3,4,5].
Geospatial data on the sewers were imported into GIS software, including ArcGIS (version: 10.8.2) or QGIS (version: 3.10 LTR), and BIM software, including Trimble SketchUp (version: Desktop 2022.0) and Autodesk InfraWorks (version: 17.11.0), to create 3D models. SketchUp, owned by Trimble, Inc., is a suite of products for a broad range of drawing and design applications, including architectural, interior design, industrial and product design, landscape architecture, civil and mechanical engineering, theater, film, and video game development [32]. Trimble SketchUp is widely applied to many real-world problems, such as annual solar insolation potentials analysis [33], volcanic processes visualization [34], microclimatic mapping [35], or tree row simulation [36]. InfraWorks, developed by Autodesk, Inc. (San Francisco, CA, USA), is one of the most widely used software applications in BIM environments for the planning and designing of infrastructure projects such as sewer networks (Figure 2). In Autodesk InfraWorks, users can easily incorporate GIS data to collect large amounts of data that give more accurate information about the area they are modeling, whether a built-up or natural environment. InfraWorks has been used as an integrated application within BIM and GIS for the smart city concept [37], drainage system management [38], and infrastructure simulation [39].
In this study, the 3D visualization platform was developed using Unity 3D, which is one of the most accessible and free tools for game developers [40]. Unity, which is developed by Unity Technologies, is a professional-quality game engine targeting a variety of platforms [41]. Unity 3D was employed to amalgamate 3D models acquired from Trimble SketchUp and Autodesk InfraWorks into the holographic environment. This integration included attributes extracted from the provided tabular dataset and predicted conditions from ML models. Unity 3D provides many comprehensive functions to implement AR applications [6]. Subsequently, the outcomes were visualized on both mobile devices and HoloLens. Additional data, such as road networks or building footprints, received from the Norwegian Mapping Authority (https://www.kartverket.no/en) (accessed on 20 March 2020) [4], were used to build the 3D model. These data were converted into shapefile (*.shp) format, which is an Environmental Systems Research Institute, Inc. (ESRI) (Redlands, CA, USA) vector data storage format for storing the location, shape, and attributes of geographic features.
An example of a 3D model of the study area in Unity is presented in Figure 3.

2.3. Visualization Platform Development

The visualization platform developed in this study comprises three main segments: indoor, intermediate, and outdoor, as presented in Figure 4.
The indoor segment involves 3D modeling and computation, focusing on the process implemented on personal and supercomputers. In this regard, 3D models of the sewer network (e.g., pipes, manholes, or pumps) were created and visualized using a high-performance computer system associated with the simulation programs [24,42]. Sewer conditions were predicted using ML and deep learning models based on input data, as described in Nguyen, Bui and Seidu [4]. The network components’ output was coded based on their corresponding indexes for visualization purposes. While creating 3D objects, the names and indexes of original objects were maintained to merge with information obtained from the previous step. This information was reused if any new update was received from the intermediate segment. Finally, the models and auxiliary data were transformed into Unity 3D for simulation on smart devices such as smartphones and HoloLens.
The intermediate segment involves the processing of remote data. This segment employed cloud-based platforms to store data and have remote interactive connections with the computer or handheld devices. In this segment, the database created from the indoor segment was transferred to the host computer system on a cloud-based connection. Real-time data received from sensors in the sewers were updated and stored on the StaalCloud portal managed by Ålesund municipality. In this segment, the data will undergo initial processing to generate fundamental network details such as pipe index, velocity, and sewer condition status. After that, these generated attributes are assigned to corresponding objects based on their unique indexes, which are generated from the indoor segment. Following this process, the data can be transmitted to the outdoor segment for display on computer or handheld devices. Finally, the intermediate segment is configured to receive updated information from the outdoor segment, store it, and send it back to the indoor segment to update the system.
The outdoor segment involves visualizing and updating data. This segment contains devices that can visualize objects and their attributes in a hands-free manner. In this segment, the processed data obtained from the indoor segment and updated data received from the intermediate segment are used to enhance the user’s experience via AR devices. The application directly reads information from computers or the cloud via a Wi-Fi network, matching them with corresponding objects and showing designated information. Any modification can be performed, and modified data in this segment can be transmitted back to the host computer in the indoor segment or the cloud database in the intermediate segment using an application programming interface (API) or equivalent protocols to update the database.
In our work, due to the limitations of accessing the cloud-based database (for data security reasons), we only tested two cases: (1) the connection between the indoor segment and the outdoor segment and (2) the ability to access, download, and visualize real-time data from the StaalCloud portal. The functions and performance for testing on the intermediate segment will need to be implemented in further investigations.

2.4. System Configuration

The StaalCloud portal is managed by the Ålesund municipality, and this is a platform to collect and store data from sensors. This portal was used to test the ability of the application to access, download, and visualize near real-time data. For the 3D visualization development platform, the Unity 3D game engine (version: 2021.3.15f1 Long Term Support), Android Studio (version: 2022.1.1), Java (version: 8), and C# (version: .NET Core 3.0, C# 8.0) programming languages were selected to develop and compile the application on mobile and Microsoft HoloLens devices.
In terms of hardware for running these applications, the Samsung Galaxy A42 5G (Android 10, 4 GB RAM, Qualcomm Snapdragon 690) [43] and Microsoft HoloLens (Windows 10, 64 GB Flash, 2 GB RAM) [44] were used. Except for the shape of objects (in 3D type), other attribute-related data were structured in the comma-separated values (CSV) format that is easily opened and modified by a text editor such as Notepad (version: 10240.0 or higher) or Microsoft Excel (https://www.microsoft.com/en-us/microsoft-365/excel) (accessed on 6 December 2023).

2.5. Accuracy Estimation

To assess the surveying accuracy of the application, experiments were performed at known reference points. Sewer networks are fundamentally composed of pipes and manholes [45]. While pipes are mainly invisible due to being covered by the ground surface, manholes can be easily recognized based on their cover on the ground. In this study, the accuracy of the mobile application was assessed based on the comparison of differences between the actual locations of manholes and their corresponding locations determined using the application (Figure 5). The accuracy of the HoloLens-developed application was not performed because of two reasons: (1) the first version of the HoloLens device used in this study does not support a GPS module inside, and (2) the development of the application on the HoloLens device aims to expand user interactions with holograms embedded into the real world.
The surveyed locations of tested manholes were latitude and longitude values of corresponding points in the World Geodetic System 1984 (WGS-84). However, the actual manholes’ locations in the database provided by Ålesund municipality were the horizontal coordinates of these points in the EPSG:32632-WGS84/UTM Zone 32N system; therefore, these geographical locations were transferred into this plane coordinate system. This transformation process was performed using ArcGIS Pro (version: 2.7.6) software developed by ESRI [46].
The locations of tested manholes with their names are shown in Figure 6; 20 different positions with different angles were implemented at each checked point to obtain measurements. The root mean square error (RMSE) was used to assess the accuracy of the developed application in locating manholes, as follows [6]:
R M S E = 1 20 i = 1 20 x i o b s x i a c t 2 + i = 1 20 y i o b s y i a c t 2
where x i a c t , y i a c t and x i o b s , y i o b s are actual horizontal coordinates and observed horizontal coordinates at one tested manhole, respectively.

3. Results and Discussion

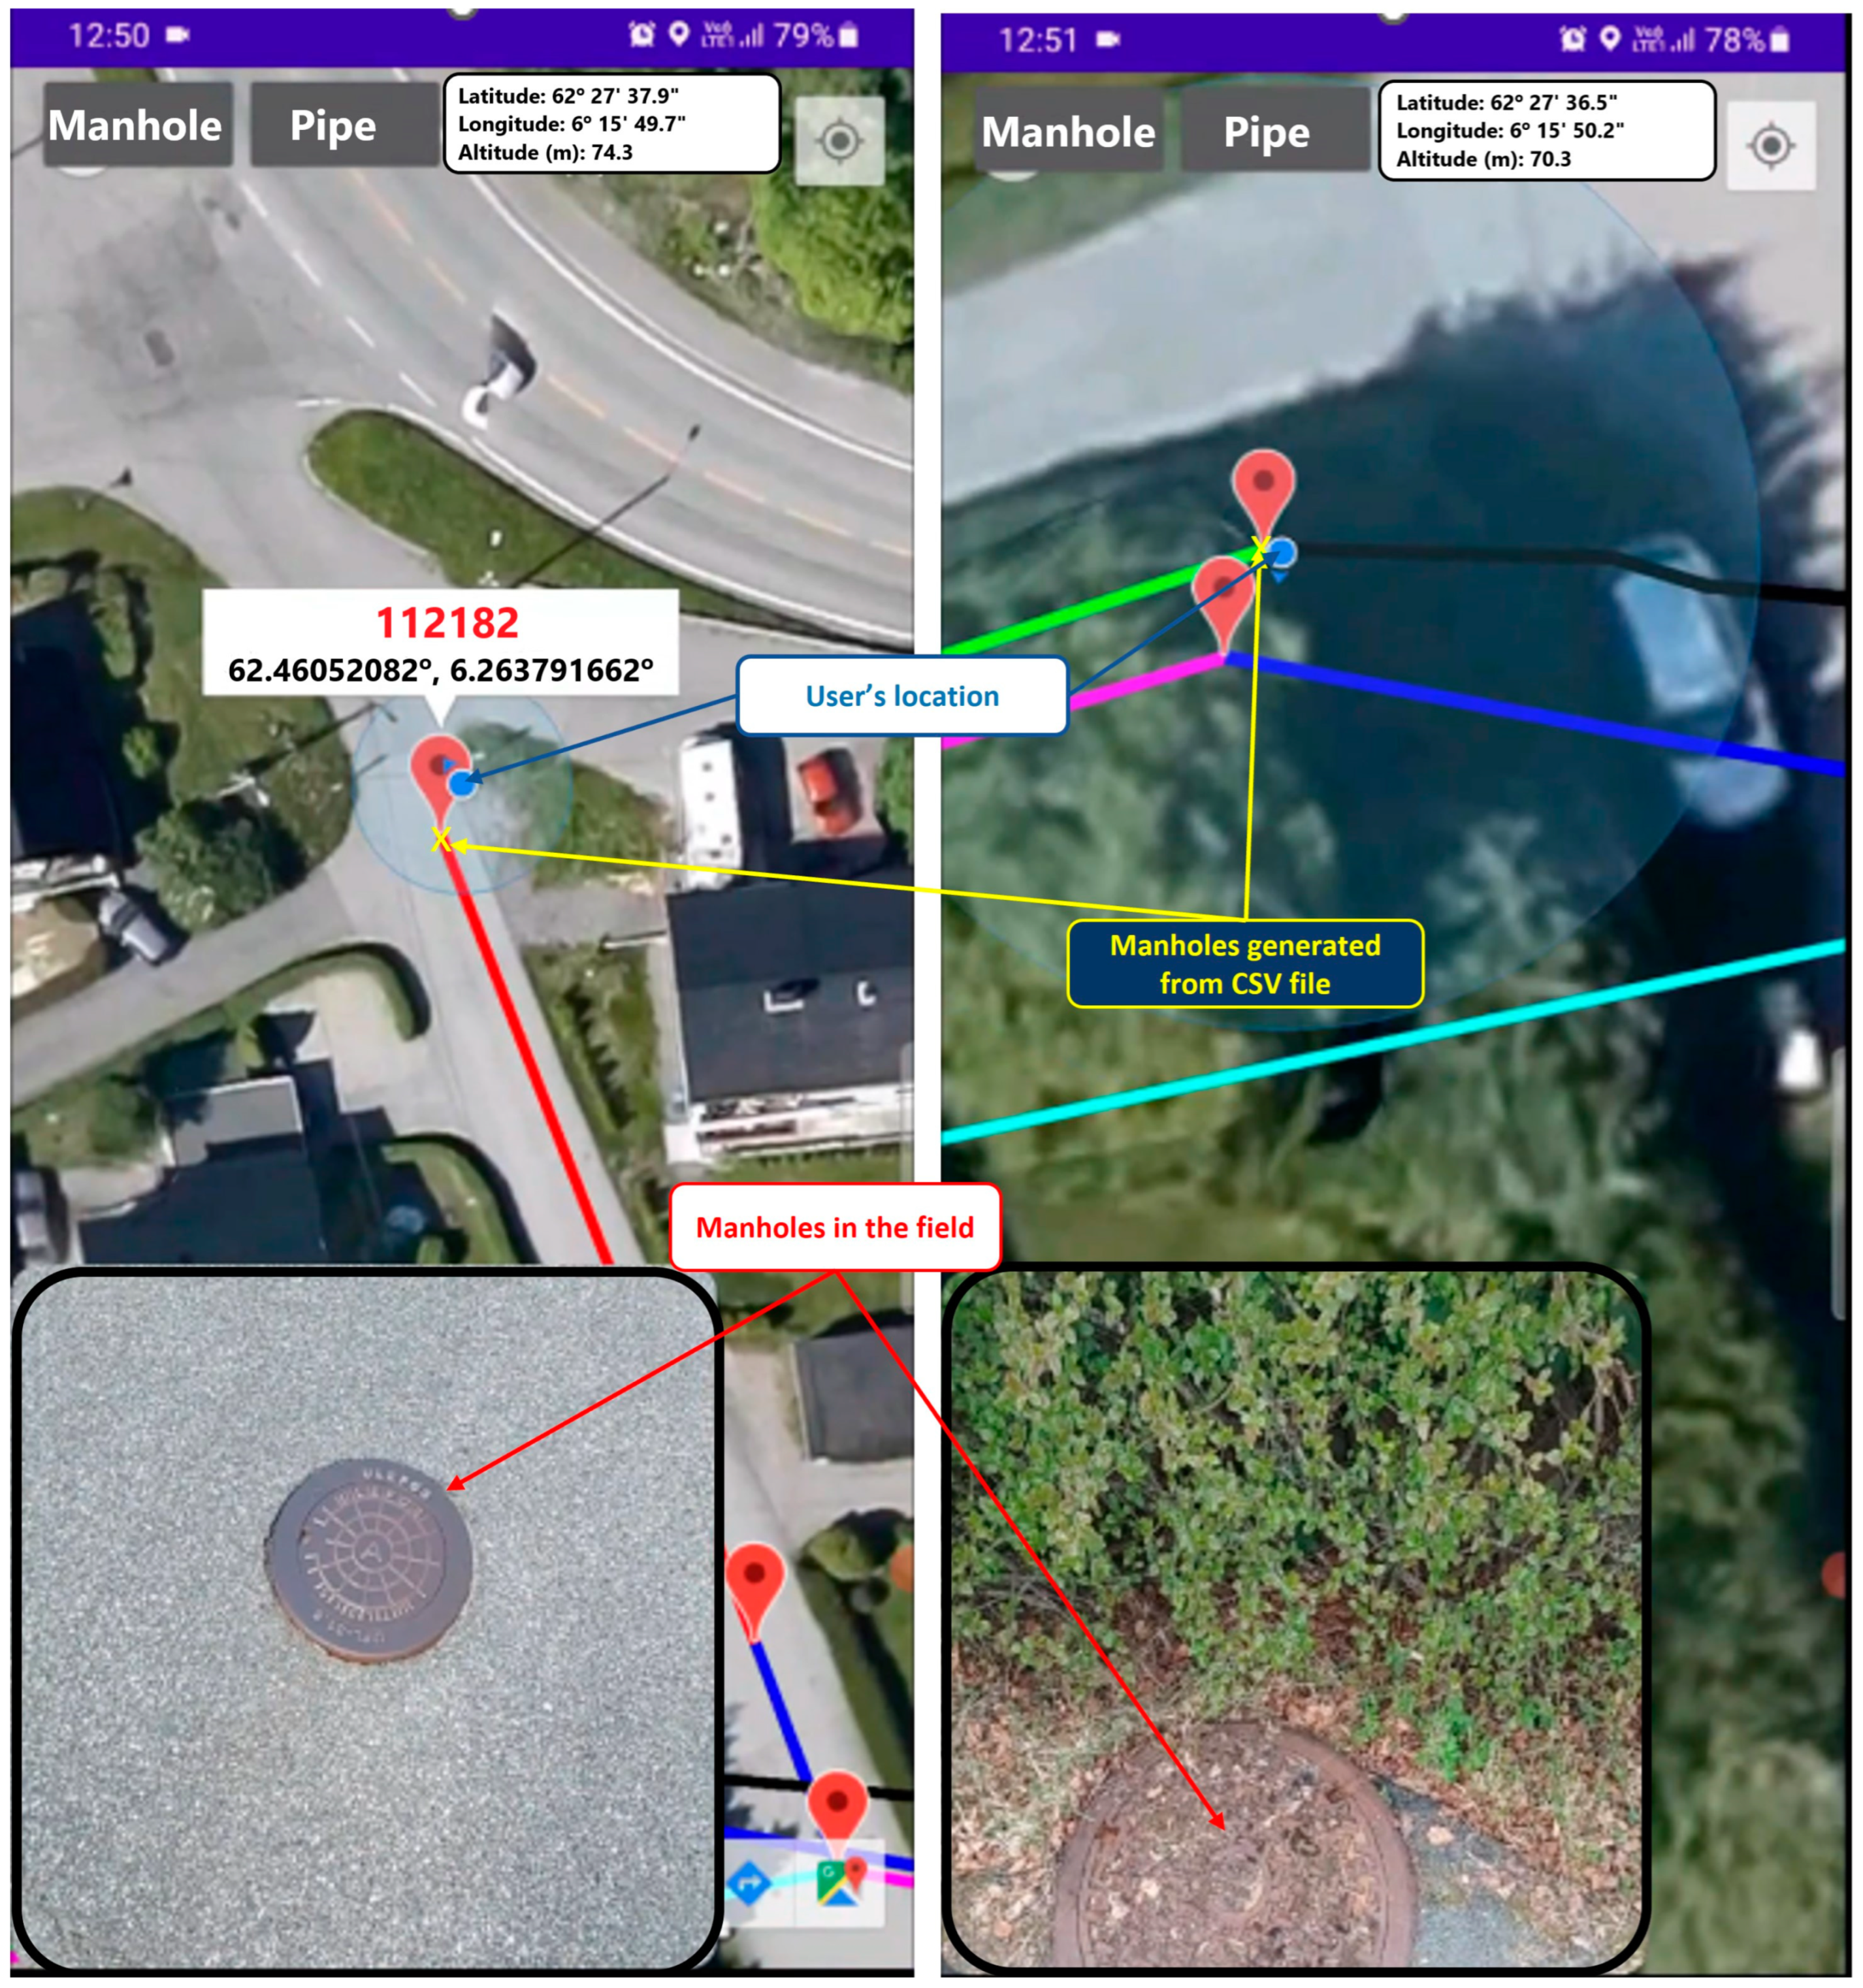
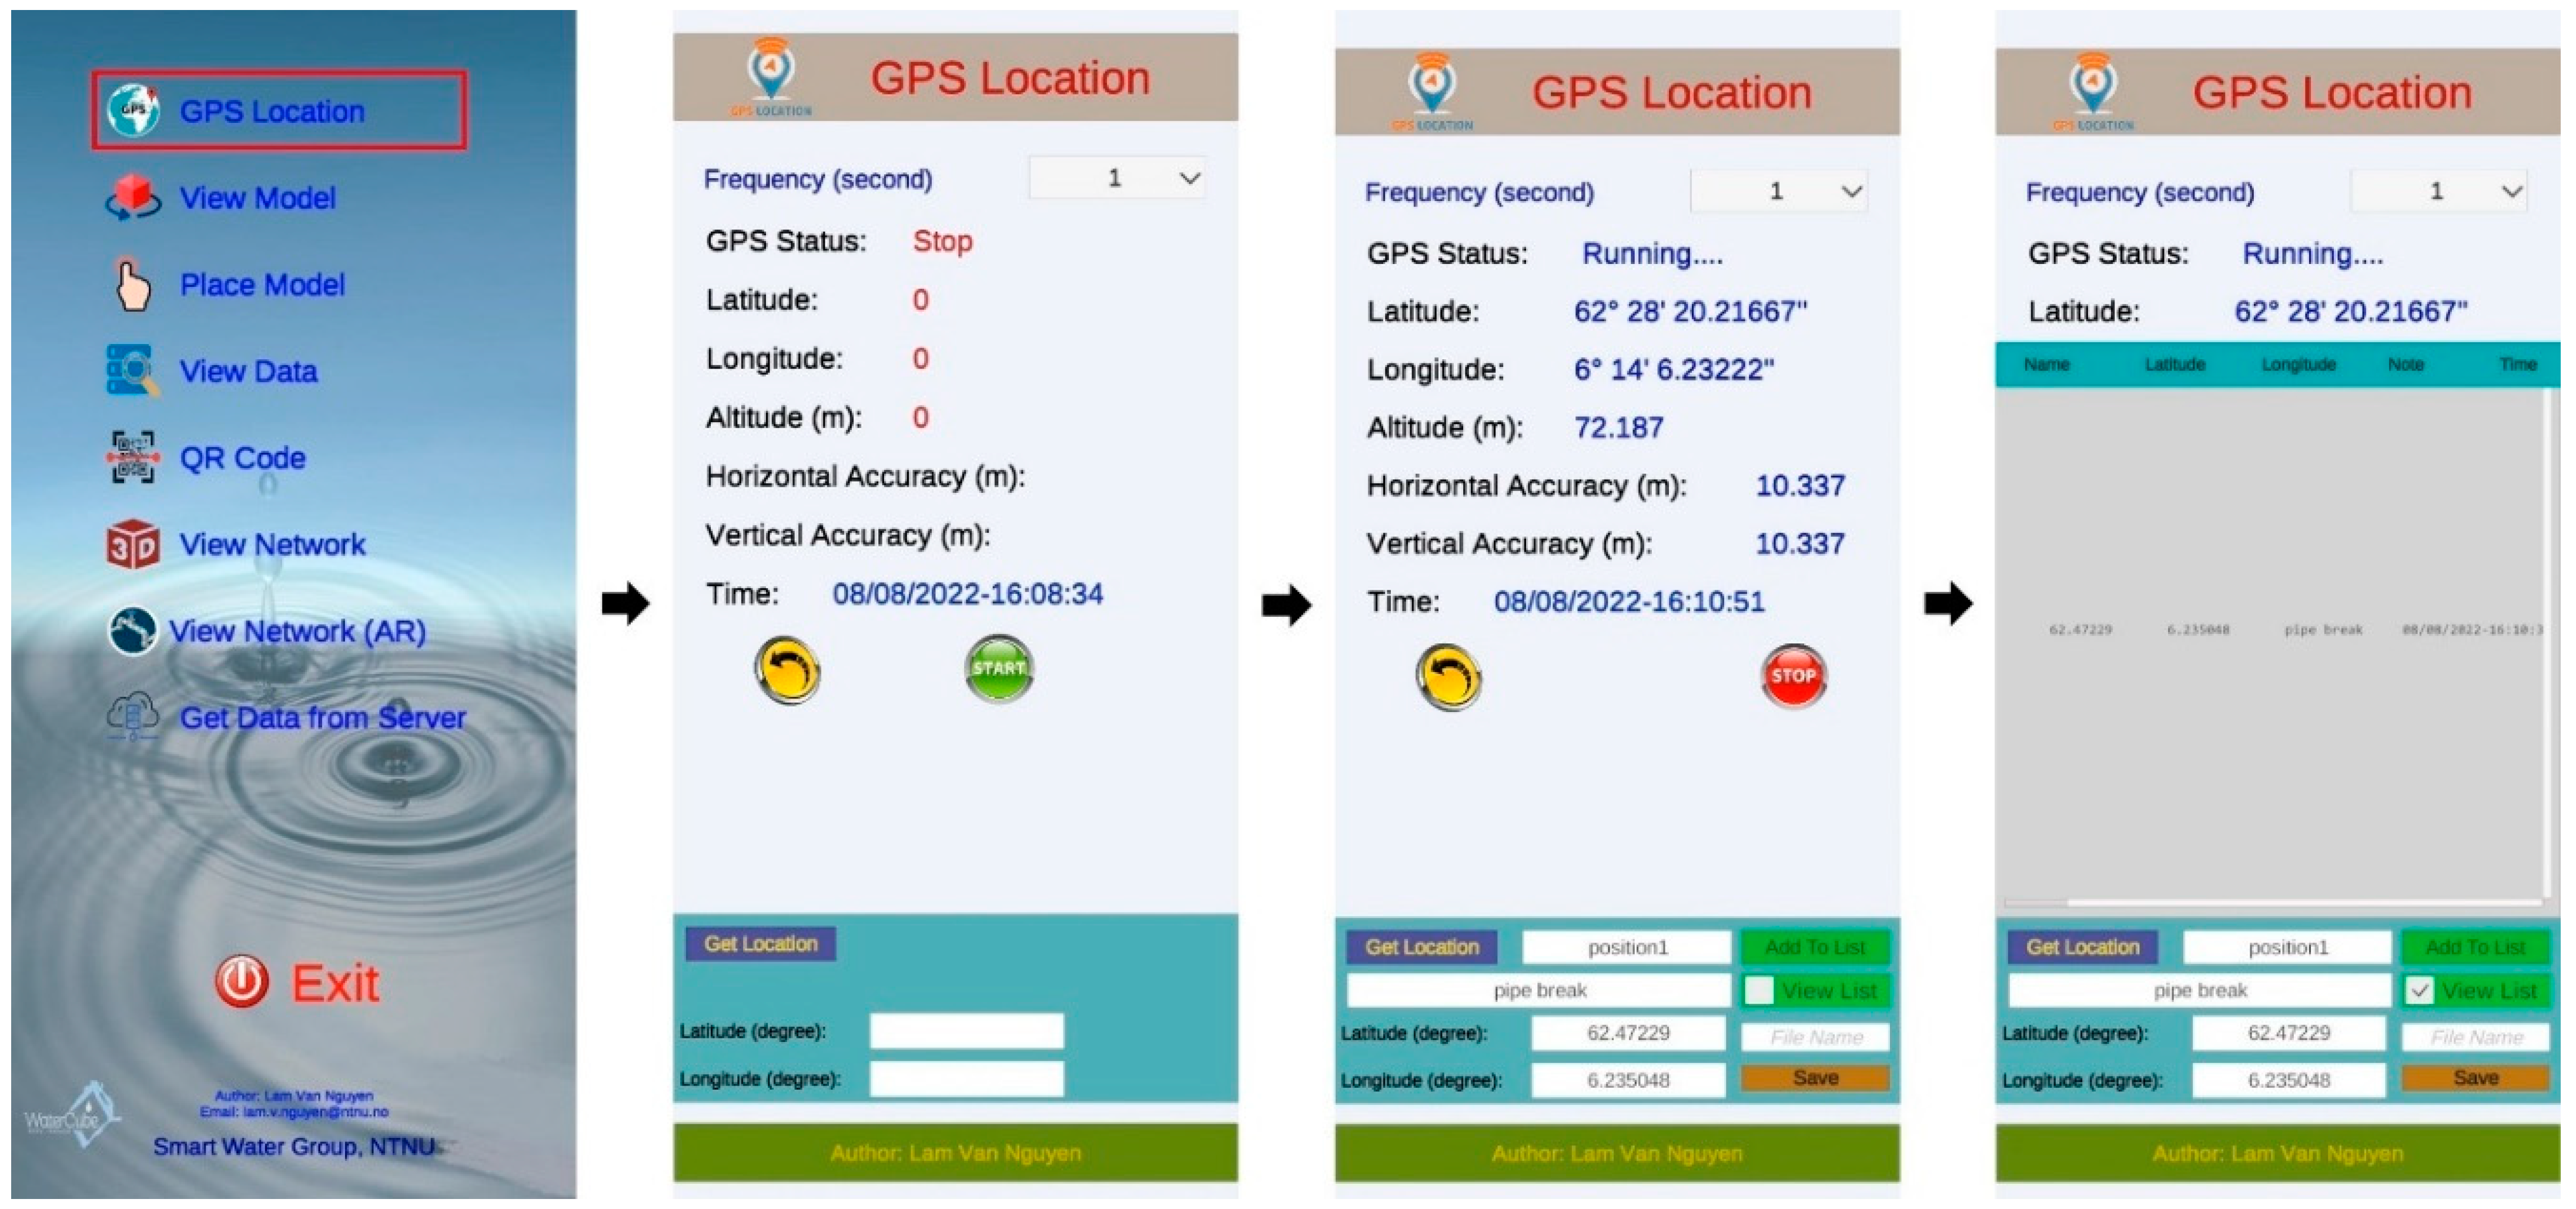
3.1. Visualization of Pipe Conditions with Mobile Application

The mobile application developed in this study allows the user to import attributes of manholes or pipes from a CSV file and visualize them in a real-time perspective. Moreover, the user can send commands from the mobile device to a personal computer (PC) via the WebSocket API protocol.
Based on a specific command received from the application on the mobile device, the PC will access a given tabular dataset or run pre-defined ML models to predict sewer condition status and produce the result. After that, these results are sent back to visualize on the mobile device. The process is illustrated in Figure 7.
An example of AR network visualization on a real scale is shown in Figure 8. After importing the given CSV files from the device’s storage, the users can see attributes, including their condition, by moving the center point of the device screen onto objects of interest.
Figure 9 shows an example of real-time data access and visualization received from sensors through the StaalCloud portal. The values in this figure (i.e., water level and temperature) will automatically change based on the user’s option.
The application also provides users with some extra functions, such as pinpointing locations of interest in the field using signals from satellites or visualizing given 3D objects. Specifically, the application allows the user to pinpoint the device’s location in the WGS-84 coordinate reference system from the GPS signal. This function is useful to pinpoint problems in the field (e.g., crack locations or noticed points), and the output can be saved in the CSV format (Figure 10).

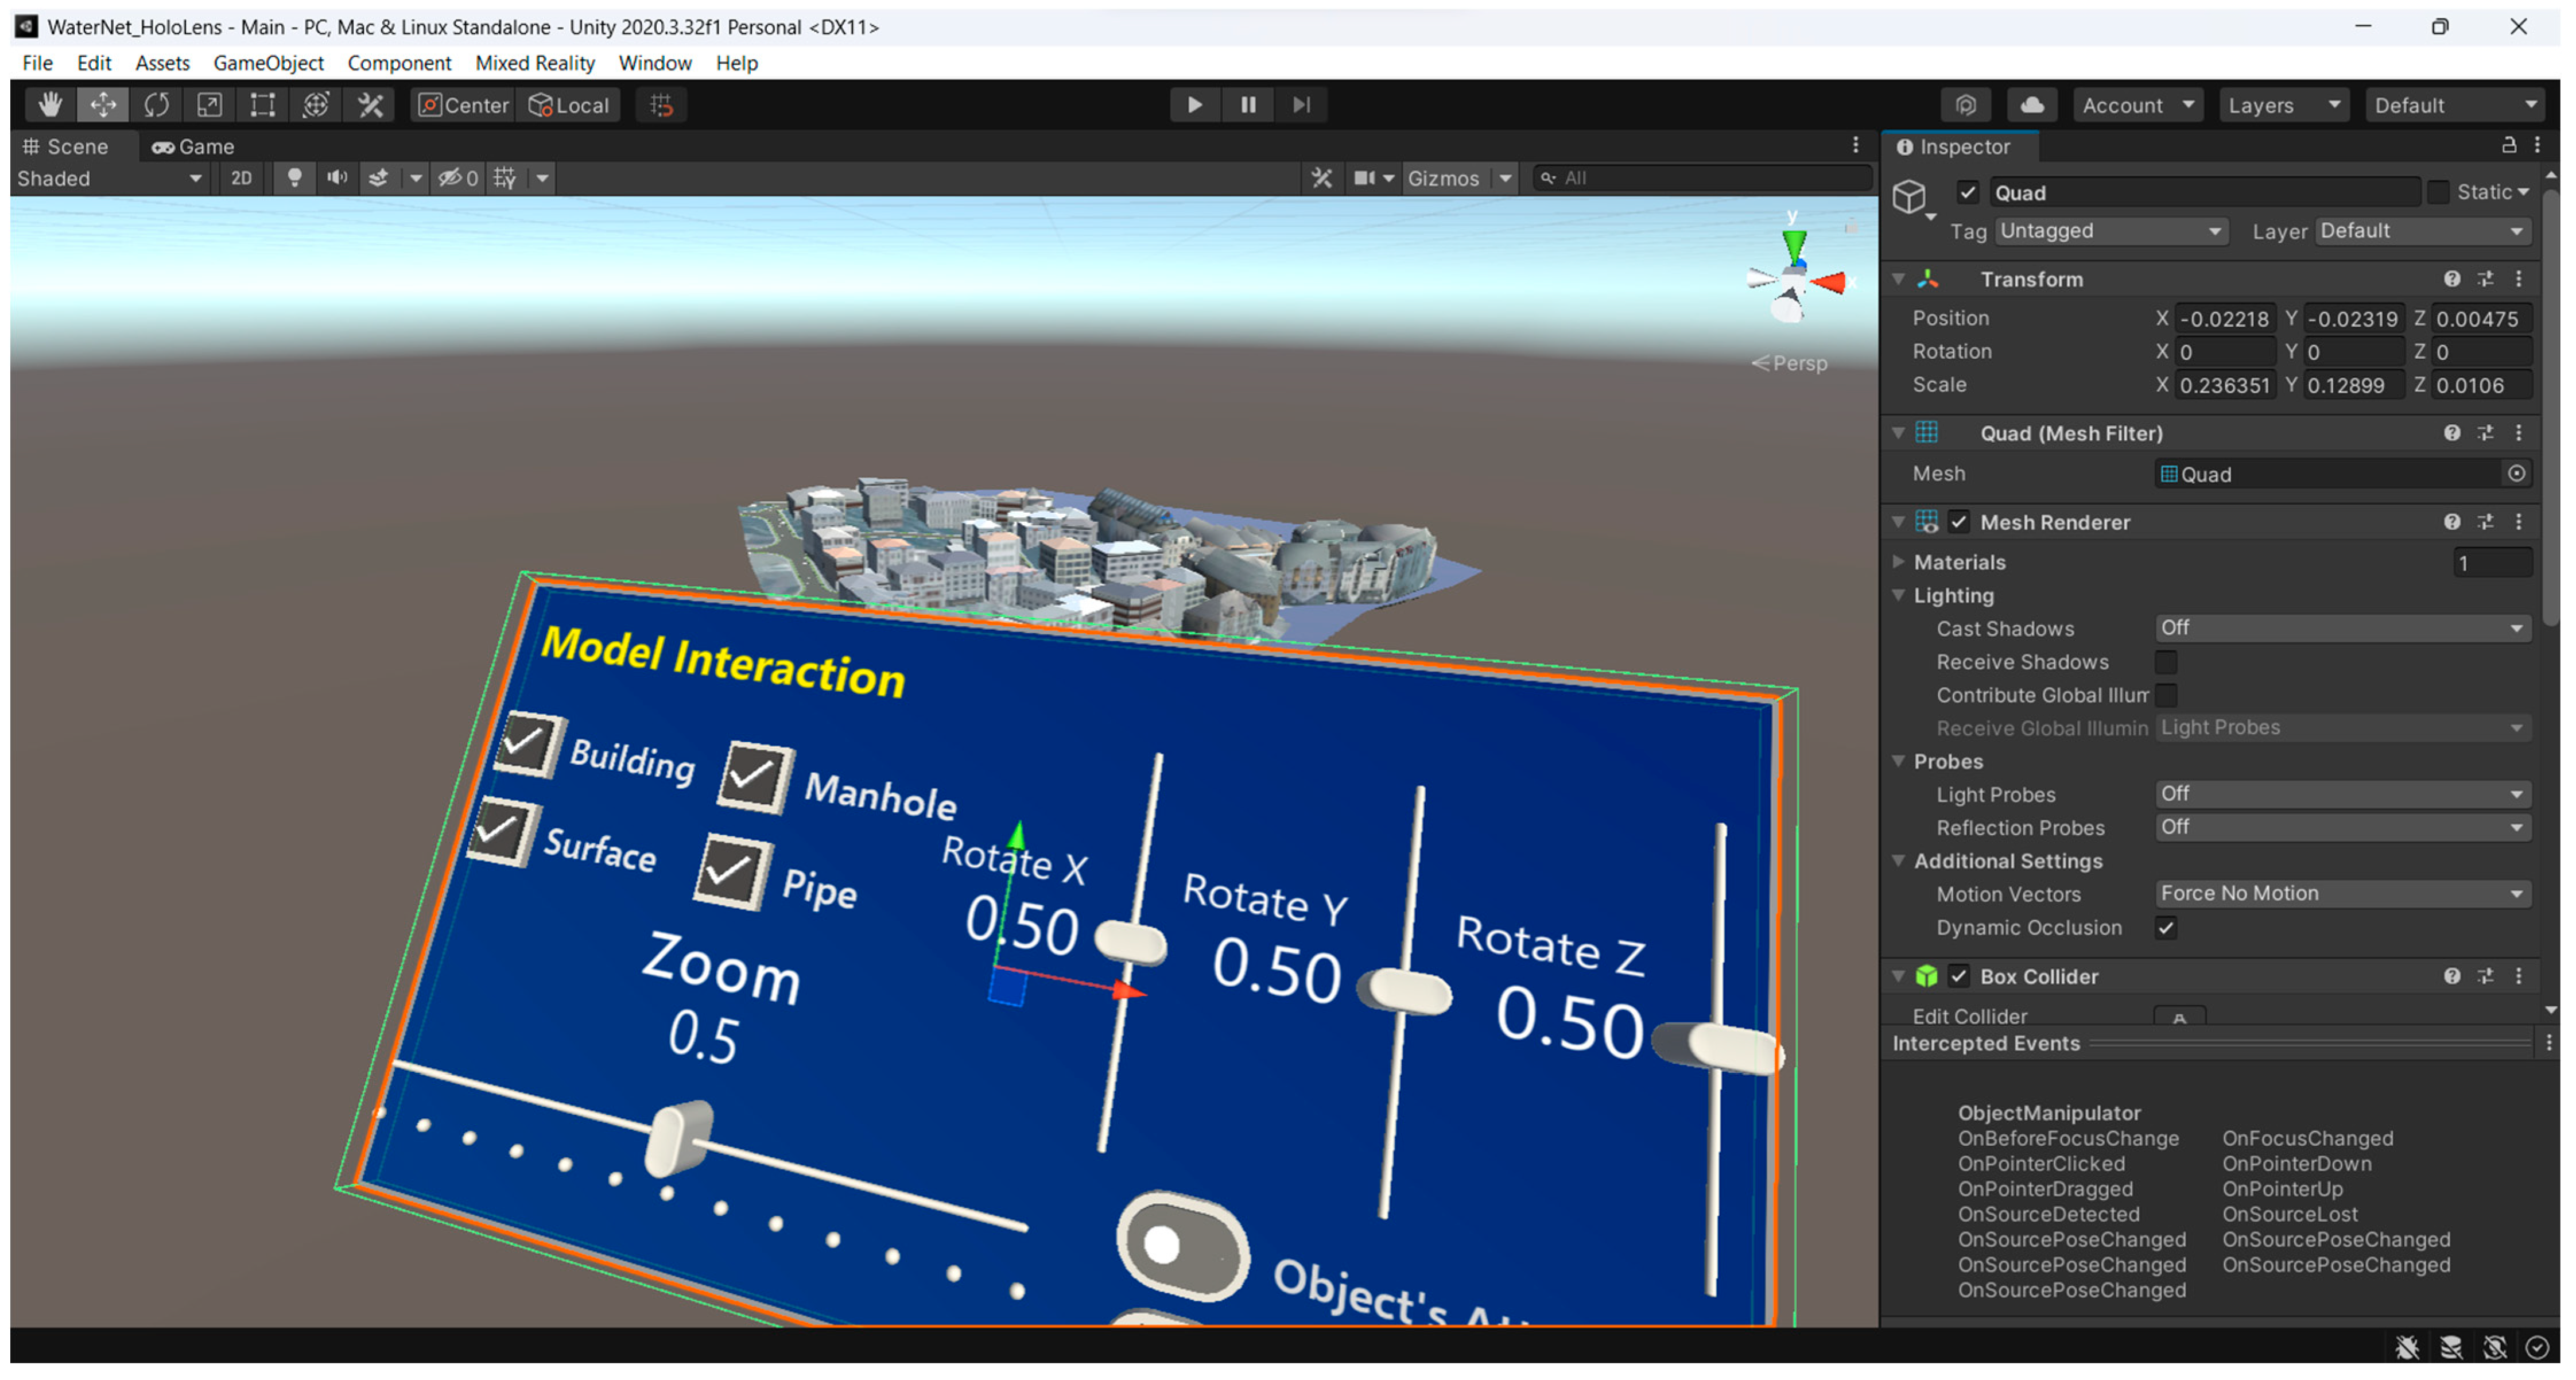
3.2. HoloLens Application

The inspiration for developing an application on HoloLens is to enhance the sense of authenticity of the user’s experience by providing several types of natural interaction, such as gaze, gesture, voice, and spatial mapping [47]. In order to build an application that was compatible with the HoloLens device, several configurations were developed. For example, the Mixed Reality Toolkit (version: 2.8.3) and Microsoft Mixed Reality OpenXR Plugin API (version: 1.1.15) were installed [48]. An example of running this application on the HoloLens device is presented in Figure 11.

3.3. Accuracy Assessment

The differences in distances between actual positions and measured positions (in 20 iterations) at each manhole are presented in Figure 12 (circles in the figure represent outliers in the dataset).
There were some outliers at manholes 58884, 112760, and 58886 (Figure 12). This may be explained by the existing high trees and electric wires that reduce signal strength from satellites to these manholes (Figure 13). For the manhole 112760, there was a high difference in the horizontal distances, although with no surrounding objects. This indicates that, in some cases, positioning accuracy with a smartphone can be unstable.
The average RMSE from the five tested manholes is shown in Table 1. The median RMSE from the tested manholes, with a 95% confidence interval, was 1.19–2.13 m for the application.
As shown in Table 1, the positioning accuracy when using smartphones was significantly low, especially near trees or high buildings that blocked satellite signals [6]. Therefore, integrating handheld devices with external equipment such as orientation sensors or real-time kinematic (RTK) receivers should be considered to improve positional accuracy [13]. The application has only been developed for Android, and developments for iOS devices should be considered in future work.
Due to the GPS error on smartphones and environmental objects [24], the positioning accuracy might not meet the desired expectations. Li, Feng, Han and Liu [6] highlighted that location-based AR applications using smartphones in previous studies achieved low accuracy, in a range of 3–10 m. The results in Table 1 show that the accuracy of the application developed in this study is equivalent to well-designed GPS receivers, which can achieve a positioning accuracy of 1–3 m [49].
Some approaches can be considered in future work to improve positioning accuracy for AR applications, such as using wireless technologies (image tracking, Bluetooth, radio frequency identification (RFID), or Wideband Code Division Multiple Access (WCDMA)/4G Long-term Evolution (LTE)) [50] or differential GPS (DGPS) techniques that can achieve centimeter-level accuracy [51].
In addition to the limitation of GPS positioning accuracy, the graphic processing capacity of mobile devices is also a drawback for the use of AR applications on a large scale. In this work, the mobile device sometimes did not work properly while loading the 3D model, possibly due to a heavy model load.
The main objective of this study was to demonstrate the promising application of smartphones and AR to visualize sewer networks and their properties using an integrated platform. In order to obtain a comprehensive assessment of accuracy using the smartphone for this purpose, many field measurements must be investigated. Moreover, differences in positioning accuracy on different mobile devices will be significant because of dissimilar hardware structures and positioning sensors [6,52].
Using this application in fieldwork requires that users pay attention to some things during the operation. For example, the function “GPS Location” for pinpointing geographical locations requires that mobile devices continuously receive a GPS signal, which consumes a lot of power and quickly drains their batteries [11]. Given the long duration of field investigations, users will need to be equipped with more batteries or external power sources.
Minimizing the delay in field data acquisition is one of the advantages of using an AR-based application; users can quickly and easily view the objects as well as their attributes. Compared to the traditional method, this will significantly reduce time wasted in the field without requiring manually checking real-world objects with corresponding ones from the record (an easily confused process).
It is worth noting that in the dynamic visualization of the water flow in pipes, other dynamic input data (such as temperature or contamination degree) can be visualized in the same way if they have the same data structure. Moreover, mobile devices and PCs must share the same private network to transfer data. However, the status of sewer pipes obtained from models can be stored in CSV format and copied to a mobile hard drive, allowing the application to access and visualize it in the field.
The developed applications on mobile and HoloLens devices should be considered in the future to integrate more needed functions based on the visualization platform developed in this study. In addition, model optimization (in terms of capacity and detail level) for running on hardware-limited devices (for example, mobile devices or HoloLens) needs to be improved.
The experimental functions in this application were built and conducted based on the sewer network in a specific study area in Ålesund city. For other areas, the steps utilized for the study area will be replicated. This paper presented the fundamental steps for sewer network 3D visualization on handheld devices such as smartphones and HoloLens, and a circle interaction between this application and computer/server to transfer and process data for sewer management purposes was introduced. Customized functions can be developed for specific purposes. Technical and non-technical operators can consult this application as an assistant tool for collecting and visualizing data in the water sector.

4. Conclusions and Outlook

The outputs of this work reveal the potential integration of mobile devices, GIS, and AR techniques in the management of water infrastructure. The users’ awareness of water infrastructure and the surrounding environment is enhanced in a way that allows the exploration of the relations between them.
The application is currently developed for mobile phones and has the following functionalities:
  • Allows for the collection of data on pipe and environmental attributes, processing, condition assessment, and visualization of pipe status on a mobile device;
  • Can be used by operators for the 3D visualization of buried sewer pipes, including their attributes and conditions;
  • Allows for the real-time visualization of dynamic data (e.g., water flow, water temperature) of the pipes through integration of geo-pipe locations and sensor data;
  • Can be used in the field for purposes of asset management.
A limitation of the application is the accuracy of the visualized and existing pipe infrastructure. Integrating handheld devices with external equipment such as orientation sensors or RTK technology will significantly enhance the positional accuracy of the system.

Author Contributions

Conceptualization, L.V.N. and R.S.; methodology, L.V.N. and R.S.; software, L.V.N.; validation, L.V.N.; formal analysis, L.V.N.; investigation, L.V.N.; writing—original draft preparation, L.V.N.; writing—review and editing, R.S. and D.T.B.; visualization, L.V.N.; supervision, R.S. and D.T.B.; project administration, R.S.; funding acquisition, R.S. All authors have read and agreed to the published version of the manuscript.

Funding

This research was funded by the Smart Water Project, grant number 90392200, financed by Ålesund Municipality and Norwegian University of Science and Technology (NTNU), Norway.

Data Availability Statement

Data will be made available on request.

Acknowledgments

The authors would like to thank the Norwegian Mapping Authority and Ålesund municipality for providing data for this research.

Conflicts of Interest

The authors declare no conflict of interest. The funders had no role in the design of the study; in the collection, analyses, or interpretation of data; in the writing of the manuscript; or in the decision to publish the results.

Abbreviations

GISGeographic Information System
ARAugmented Reality
BIMBuilding Information Modeling
GPRGround Penetrating Radar
GPSGlobal Positioning System
GNSSGlobal Navigation Satellite System
APIApplication Programming Interface
MLMachine Learning
ESRIEnvironmental Systems Research Institute, Inc.
CSVComma-Separated Values
RMSERoot Mean Square Error
PCPersonal Computer
WGS-84World Geodetic System 1984
RTKReal-Time Kinematic
RFIDRadio Frequency Identification
WCDMAWideband Code Division Multiple Access
LTELong-term Evolution
DGPSDifferential GPS

References

  1. Statistics, N. Municipal Wastewater. Available online: https://www.ssb.no/en/natur-og-miljo/vann-og-avlop/statistikk/utslipp-og-rensing-av-kommunalt-avlop (accessed on 28 October 2023).
  2. Fugledalen, T.; Rokstad, M.M.; Tscheikner-Gratl, F. On the influence of input data uncertainty on sewer deterioration models—A case study in Norway. Struct. Infrastruct. Eng. 2021, 19, 1064–1075. [Google Scholar] [CrossRef]
  3. Nguyen, L.V.; Seidu, R. Application of Regression-Based Machine Learning Algorithms in Sewer Condition Assessment for Ålesund City, Norway. Water 2022, 14, 3993. [Google Scholar] [CrossRef]
  4. Nguyen, L.V.; Bui, D.T.; Seidu, R. Comparison of Machine Learning Techniques for Condition Assessment of Sewer Network. IEEE Access 2022, 10, 124238–124258. [Google Scholar] [CrossRef]
  5. Nguyen, L.V.; Seidu, R. Predicting sewer structural condition using hybrid machine learning algorithms. Urban Water J. 2023, 20, 882–896. [Google Scholar] [CrossRef]
  6. Li, M.; Feng, X.; Han, Y.; Liu, X. Mobile augmented reality-based visualization framework for lifecycle O&M support of urban underground pipe networks. Tunn. Undergr. Space Technol. 2023, 136, 21. [Google Scholar] [CrossRef]
  7. Nguyen, L.S.; Schaeli, B.; Sage, D.; Kayal, S.; Jeanbourquin, D.; Barry, D.A.; Rossi, L. Vision-based system for the control and measurement of wastewater flow rate in sewer systems. Water Sci. Technol. 2009, 60, 2281–2289. [Google Scholar] [CrossRef]
  8. Bottani, E.; Vignali, G. Augmented reality technology in the manufacturing industry: A review of the last decade. IISE Trans. 2019, 51, 284–310. [Google Scholar] [CrossRef]
  9. Chen, Y.; Wang, Q.; Chen, H.; Song, X.; Tang, H.; Tian, M. An overview of augmented reality technology. J. Phys. Conf. Ser. 2019, 1237, 6. [Google Scholar] [CrossRef]
  10. Fite-Georgel, P. Is there a reality in Industrial Augmented Reality? In Proceedings of the 2011 10th IEEE International Symposium on Mixed and Augmented Reality, Basel, Switzerland, 26–29 October 2011; pp. 201–210. [Google Scholar]
  11. Mirauda, D.; Erra, U.; Agatiello, R.; Cerverizzo, M. Applications of Mobile Augmented Reality to Water Resources Management. Water 2017, 9, 699. [Google Scholar] [CrossRef]
  12. Centeno, J.A.S.; Kishi, R.T.; Mitishita, E.A. Three-dimensional Data Visualization in Water Quality Studies using Augmented Reality. In Proceedings of the 6th International Symposium on Mobile Mapping Technology, São Paulo, Brazil, 21–24 July 2009. [Google Scholar]
  13. Schall, G.; Zollmann, S.; Reitmayr, G. Smart Vidente: Advances in mobile augmented reality for interactive visualization of underground infrastructure. Pers. Ubiquitous Comput. 2013, 17, 1533–1549. [Google Scholar] [CrossRef]
  14. Haynes, P.; Hehl-Lange, S.; Lange, E. Mobile Augmented Reality for Flood Visualisation. Environ. Model. Softw. 2018, 109, 380–389. [Google Scholar] [CrossRef]
  15. Hahmann, S.; Burghardt, D. How much information is geospatially referenced? Networks and cognition. Int. J. Geogr. Inf. Sci. 2013, 27, 1171–1189. [Google Scholar] [CrossRef]
  16. Hunter, J.D. Matplotlib: A 2D Graphics Environment. Comput. Sci. Eng. 2007, 9, 90–95. [Google Scholar] [CrossRef]
  17. Villanueva, R.A.M.; Chen, Z.J. ggplot2: Elegant Graphics for Data Analysis (2nd ed.). Meas. Interdiscip. Res. Perspect. 2019, 17, 160–167. [Google Scholar] [CrossRef]
  18. Kjellin, A.; Pettersson, L.W.; Seipel, S.; Lind, M. Evaluating 2D and 3D visualizations of spatiotemporal information. ACM Trans. Appl. Percept. 2008, 7, 1–23. [Google Scholar] [CrossRef]
  19. Dübel, S.; Röhlig, M.; Schumann, H.; Trapp, M. 2D and 3D presentation of spatial data: A systematic review. In Proceedings of the 2014 IEEE VIS International Workshop on 3DVis (3DVis), Paris, France, 9 November 2014; pp. 11–18. [Google Scholar]
  20. Beha, F.; Göritz, A.; Schildhauer, T. Business model innovation: The role of different types of visualizations. In Proceedings of the ISPIM Conference Proceedings, Hamburg, Germany, 14–17 June 2015; p. 19. [Google Scholar]
  21. Huston, D.; Xia, T.; Zhang, Y.; Fan, T.; Orfeo, D.; Razinger, J. Urban underground infrastructure mapping and assessment. In Proceedings of the Sensors and Smart Structures Technologies for Civil, Mechanical, and Aerospace Systems 2017, Portland, OR, USA, 25–29 March 2017; p. 11. [Google Scholar]
  22. Fang, X.; Li, Q.; Zhu, J.; Chen, Z.; Zhang, D.; Wu, K.; Ding, K.; Li, Q. Sewer defect instance segmentation, localization, and 3D reconstruction for sewer floating capsule robots. Autom. Constr. 2022, 142, 104494. [Google Scholar] [CrossRef]
  23. Soria, G.; Ortega Alvarado, L.M.; Feito, F.R. Augmented and Virtual Reality for Underground Facilities Management. J. Comput. Inf. Sci. Eng. 2018, 18, 9. [Google Scholar] [CrossRef]
  24. Fenais, A.; Ariaratnam, S.T.; Ayer, S.K.; Smilovsky, N. Integrating Geographic Information Systems and Augmented Reality for Mapping Underground Utilities. Infrastructures 2019, 4, 60. [Google Scholar] [CrossRef]
  25. Pereira, M.; Burns, D.; Orfeo, D.; Farrel, R.; Hutson, D.; Xia, T. New GPR System Integration with Augmented Reality Based Positioning. In Proceedings of the 2018 on Great Lakes Symposium on VLSI, Chicago, IL, USA, 23–25 May 2018; pp. 341–346. [Google Scholar]
  26. Jimenez, R.J.P.; Becerril, E.M.D.; Nor, R.M.; Smagas, K.; Valari, E.; Stylianidis, E. Market potential for a location based and augmented reality system for utilities management. In Proceedings of the 2016 22nd International Conference on Virtual System & Multimedia (VSMM), Kuala Lumpur, Malaysia, 17–21 October 2016; pp. 1–4. [Google Scholar]
  27. Kim, B.-h. Development of Augmented Reality Underground Facility Management System using Map Application Programming Interface and JavaScript Object Notation Communication. Teh. Vjesn. 2023, 30, 797–803. [Google Scholar] [CrossRef]
  28. Tarek, H.; Marzouk, M. Integrated Augmented Reality and Cloud Computing Approach for Infrastructure Utilities Maintenance. J. Pipeline Syst. Eng. Pract. 2022, 13, 11. [Google Scholar] [CrossRef]
  29. Côté, S.; Mercier, A. Augmentation of Road Surfaces with Subsurface Utility Model Projections. In Proceedings of the 2018 IEEE Conference on Virtual Reality and 3D User Interfaces (VR), Tuebingen/Reutlingen, Germany, 18–22 March 2018; pp. 535–536. [Google Scholar]
  30. Rahman, A.; Xi, M.; Dabrowski, J.J.; McCulloch, J.; Arnold, S.; Rana, M.; George, A.; Adcock, M. An integrated framework of sensing, machine learning, and augmented reality for aquaculture prawn farm management. Aquac. Eng. 2021, 95, 102192. [Google Scholar] [CrossRef]
  31. Haugen, H.J.; Viak, A. Datafl yt—Klassifi Sering av Avløpsledninger; Norwegian Water BA: Hamar, Norway, 2018. [Google Scholar]
  32. Trimble. Trimble to Enhance its Office-to-Field Platform with the Acquisition of Google’s SketchUp 3D Modeling Platform. Available online: https://investor.trimble.com/news-releases/news-release-details/trimble-enhance-its-office-field-platform-acquisition-googles?releaseid=667690 (accessed on 19 October 2022).
  33. Bassett, T.; Lannon, S.C.; Waldron, D.; Jones, P.J. Calculating the solar potential of the urban fabric with SketchUp and HTB2. In Proceedings of the Solar Building Skins, Bressanone, Italy, 6–7 December 2012. [Google Scholar]
  34. Lewis, G.M.; Hampton, S.J. Visualizing volcanic processes in SketchUp: An integrated geo-education tool. Comput. Geosci. 2015, 81, 93–100. [Google Scholar] [CrossRef]
  35. Jusuf, S.K.; Ignatius, M.; Wong, N.H.; Tan, E. STEVE Tool Plug-in for SketchUp: A User-Friendly Microclimatic Mapping Tool for Estate Development. In Sustainable Building and Built Environments to Mitigate Climate Change in the Tropics: Conceptual and Practical Approaches, Karyono, T.H., Vale, R., Vale, B., Eds.; Springer International Publishing: Cham, Switzerland, 2017; pp. 113–130. [Google Scholar]
  36. Burner, D.M.; Ashworth, A.J.; Laughlin, K.F.; Boyer, M.E. Using SketchUp to Simulate Tree Row Azimuth Effects on Alley Shading. Agron. J. 2018, 110, 425–430. [Google Scholar] [CrossRef]
  37. Ma, Z.; Ren, Y. Integrated Application of BIM and GIS: An Overview. Procedia Eng. 2017, 196, 1072–1079. [Google Scholar] [CrossRef]
  38. Kuok, K.K.; Kingston Tan, K.W.; Chiu, P.C.; Chin, M.Y.; Rahman, M.R.; Bin Bakri, M.K. Application of Building Information Modelling (BIM) Technology in Drainage System Using Autodesk InfraWorks 360 Software; Springer Nature: Singapore, 2022; pp. 209–224. [Google Scholar]
  39. Barazzetti, L. Integrated BIM-GIS Model Generation at the City Scale Using Geospatial Data; SPIE: Bellingham, WA, USA, 2018; Volume 10773. [Google Scholar]
  40. Hocking, J.; Schell, J. Unity in Action: Multiplatform Game Development in C#, 3rd ed.; Manning Publications Co.: Shelter Island, NY, USA, 2022; p. 416. [Google Scholar]
  41. Juliani, A.; Berges, V.-P.; Teng, E.; Cohen, A.; Harper, J.; Elion, C.; Goy, C.; Gao, Y.; Henry, H.; Mattar, M. Unity: A General Platform for Intelligent Agents. arXiv 2018, arXiv:1809.02627. [Google Scholar] [CrossRef]
  42. Han, Y.-S.; Lee, J.; Lee, J.; Lee, W.; Lee, K. 3D CAD data extraction and conversion for application of augmented/virtual reality to the construction of ships and offshore structures. Int. J. Comput. Integr. Manuf. 2019, 32, 658–668. [Google Scholar] [CrossRef]
  43. Samsung. Galaxy A42 5G. Available online: https://www.samsung.com/us/smartphones/galaxy-a42-5g/ (accessed on 31 October 2022).
  44. Microsoft. HoloLens (1st gen) Hardware. Available online: https://learn.microsoft.com/en-us/hololens/hololens1-hardware (accessed on 1 November 2022).
  45. Duque, N.; Duque, D.; Aguilar, A.; Saldarriaga, J. Sewer Network Layout Selection and Hydraulic Design Using a Mathematical Optimization Framework. Water 2020, 12, 3337. [Google Scholar] [CrossRef]
  46. Zeiler, M. Modeling Our World: The ESRI Guide to Geodatabase Design; Environmental Systems Research Institute, Inc.: Redlands, CA, USA, 1999; Volume 40. [Google Scholar]
  47. Wang, W.; Wu, X.; Chen, G.; Chen, Z. Holo3DGIS: Leveraging Microsoft HoloLens in 3D Geographic Information. ISPRS Int. J. Geo-Inf. 2018, 7, 60. [Google Scholar] [CrossRef]
  48. Microsoft. Unity Development for HoloLens. Available online: https://learn.microsoft.com/en-us/windows/mixed-reality/develop/unity/unity-development-overview?tabs=arr%2CD365%2Chl2 (accessed on 1 November 2022).
  49. Renfro, B.A.; Stein, M.; Boeker, N.; Terry, A. An Analysis of Global Positioning System (GPS) Standard Positioning Service (SPS) Performance for 2017. 2018. Available online: https://www.gps.gov/systems/gps/performance/2018-GPS-SPS-performance-analysis.pdf (accessed on 22 November 2023).
  50. Jian, M.; Wang, Y.; Wu, B.; Cheng, Y. Hybrid cloud computing for user location-aware augmented reality construction. In Proceedings of the 2018 20th International Conference on Advanced Communication Technology (ICACT), Chuncheon, Republic of Korea, 11–14 February 2018; pp. 190–194. [Google Scholar]
  51. Chen, Y.; Zhao, S.; Farrell, J.A. Computationally efficient carrier integer ambiguity resolution in multiepoch GPS/INS: A common-position-shift approach. IEEE Trans. Control Syst. Technol. 2015, 24, 1541–1556. [Google Scholar] [CrossRef]
  52. Blum, J.R.; Greencorn, D.G.; Cooperstock, J.R. Smartphone Sensor Reliability for Augmented Reality Applications. In Mobile and Ubiquitous Systems: Computing, Networking, and Services; MobiQuitous 2012; Lecture Notes of the Institute for Computer Sciences, Social Informatics and Telecommunications Engineering; Springer: Berlin/Heidelberg, Germany, 2013; pp. 127–138. [Google Scholar]
Figure 1. The workflow for data preparation.
Water 15 04232 g001
Figure 2. Illustration of the sewer network in the study area: (a) without surface; (b) with surface objects.
Water 15 04232 g002
Figure 3. An example of a 3D model in Unity.
Water 15 04232 g003
Figure 4. Overview of the integrated visualization platform.
Water 15 04232 g004
Figure 5. Location of the manholes in the study area.
Water 15 04232 g005
Figure 6. Locations of the tested manholes.
Water 15 04232 g006
Figure 7. Network visualization in the application.
Water 15 04232 g007
Figure 8. AR network visualization in the application.
Water 15 04232 g008
Figure 9. Real-time data access from the StaalCloud portal.
Water 15 04232 g009
Figure 10. Pinpointing locations using GPS signals.
Water 15 04232 g010
Figure 11. Network visualization on HoloLens.
Water 15 04232 g011
Figure 12. The differences in the horizontal distances for each tested manhole.
Water 15 04232 g012
Figure 13. Noise background surrounding manholes.
Water 15 04232 g013
Table 1. Summary of RMSE at the tested manholes.
Manhole Name1121821127605888411276558886
Mean RMSE (m)1.152.191.801.591.56
Disclaimer/Publisher’s Note: The statements, opinions and data contained in all publications are solely those of the individual author(s) and contributor(s) and not of MDPI and/or the editor(s). MDPI and/or the editor(s) disclaim responsibility for any injury to people or property resulting from any ideas, methods, instructions or products referred to in the content.

