1. Introduction
Wetlands, serving as an integration of terrestrial and aquatic ecosystems, play a crucial role in water retention, flood control, water purification, environmental stability, biodiversity conservation, and resource utilization. Their capacity to hold water for extended periods, seasonally inundate, and periodically flood makes them both a source and sink for heavy metals, ultimately leading to metal accumulation in the soil [
1]. Soil, as an essential foundation for sustaining life on Earth and the overall ecosystem’s health, has grown increasingly important.
However, with the acceleration of urbanization in recent years, HMs have been deposited in soils, where they serve as critical sinks, which has become an issue of paramount ecological and human health concern [
2]. The research indicates that heavy metal elements accumulating in soil can find their way into the human body through three principal pathways: ingestion, dermal contact, and inhalation [
3]. Due to the strong biotoxicity and recalcitrance of HMs, their ingestion, even at low concentrations, can result in various health risks [
4]. The cumulative effect of heavy metal exposure can damage the immune system and increase the incidence of cancer, developmental defects, and mortality [
5]. Copper accumulation, for instance, might lead to Menkes and Wilson diseases [
6], while the accumulation of arsenic and mercury can induce various cancers (skin, lung, liver, and bladder), along with conditions such as Blackfoot disease, acrodynia, and ulcers, posing significant threats to both ecosystems and human health.
To comprehensively understand and effectively mitigate the risks that soil HMs pose to human health, the identification and quantification of potential sources of contamination are essential. In contemporary practice, a multitude of extant health risk assessments hinge upon conventional models characterized by deterministic parameters [
7]. These models typically employ fixed exposure parameter values and HMs concentrations for deterministic HRA. However, because environmental data are incomplete and stochastic, as well as differences in individual factors such as age, health status, gender, and metabolism, uncertainty is prevalent in risk assessment. This uncertainty diminishes the reliability and informativeness of deterministic risk assessment results, leading to deviations from actual risks. Using deterministic parameter-based point estimation methods to accurately identify the most critical factors in risk assessment becomes challenging and may result in an underestimation or overestimation of risk levels [
8,
9].
The probability HRA based on the Monte Carlo simulation can establish the likelihood of risks exceeding guideline thresholds and pinpoint the primary factors for risk management. It has been demonstrated to be one of the most valuable approaches in probabilistic risk analysis [
10,
11,
12]. As the sources of HMs are complex, commonly used qualitative identification methods such as correlation analysis and factor analysis, while simplifying complex pollutant datasets and better explaining temporal and spatial variations, cannot quantitatively describe the contributions of various sources to individual pollution indicators [
13]. As a result, researchers have started to employ APCS-MLR to quantitatively assess the contributions of various sources to HMs [
14]. For instance, Zhang utilized APCS-MLR in combination with a health risk model to establish a model for the sources of HMs health risks in tea and garden soils. They quantified the health risks of HMs and identified agricultural and natural sources as the primary pollution sources for carcinogenic and non-carcinogenic risks [
15]. Similarly, Wang integrated APCS-MLR with HRA to conduct a health risk assessment related to HMs found in PM2.5 particles within the Pingyao region. They identified automobile emissions and coal combustion as the primary sources of health risk in that area [
16]. By coupling APCS-MLR and the probability health risk model based on Monte Carlo simulations, pollution source contributions to health risks can be quantified, and primary pollution sources can be identified, thus, facilitating source control for soil heavy metals and better management and prevention of soil ecological environmental pollution.
The Qinghai–Tibet Plateau, also called the “Third Pole”, is renowned for its distinct natural geographic environment, which has given rise to numerous natural wetlands. Within these wetlands, rich biodiversity, microorganisms, and abundant wildlife exist, making them a valuable resource reservoir. Furthermore, these wetlands serve various crucial ecological functions. However, the extreme high-altitude and cold conditions of this region render its wetland ecosystems exceptionally sensitive and vulnerable [
17]. Once damaged, these ecosystems are challenging to restore. Lalu wetland, situated in the southwestern corner of Lhasa City, Tibet, China, is one of the most representative high-altitude wetlands globally. It has been designated as a national-level nature reserve and stands as the world’s highest-altitude and largest urban natural wetland. Additionally, it serves as a habitat and migration site for numerous nationally protected wildlife species. Lalu wetland plays a pivotal role in maintaining ecological balance, biodiversity, climate regulation, and environmental purification. It also offers abundant materials for scientific research and humanities education. Moreover, it serves as a significant recreational area for urban residents and holds great significance for the green and healthy development of cities [
18,
19].
In recent years, with ongoing urban development and a substantial increase in population, the wetland environment has experienced some impacts. The wetland area has reduced from 10 km
2 to 6.2 km
2, which has had implications for biodiversity [
18]. Environmental heavy metal pollution, with its significant repercussions on ecosystems, cannot be ignored. It remains a crucial challenge faced by researchers worldwide.
Therefore, with Lalu wetland as the study focus, this investigation aims to (1) utilize various pollution indicators and spatial distribution of heavy metals, unveiling the spatial distribution characteristics and pollution levels of heavy metals in the surface soil of Lalu wetland; (2) determine and quantify potential sources of heavy metals in Lalu Wetland soil using the APCS-MLR Model; (3) assess the health risk status of Lalu wetland through the Monte Carlo probability health risk evaluation model; (4) quantify the contributions of various sources of heavy metals to health risks in wetland soil using a source-oriented health risk assessment model and identifying priority sources for heavy metal control. The study results can provide a theoretical basis and data support for the formulation and implementation of safety measures in the prevention and control of soil heavy metal pollution in Lalu wetland. Additionally, it can serve as a crucial theoretical and practical reference for the identification, risk assessment, and comprehensive management of soil heavy metal pollution sources in high-altitude regions and similar wetland areas.
2. Materials and Methods
2.1. Study Area Overview
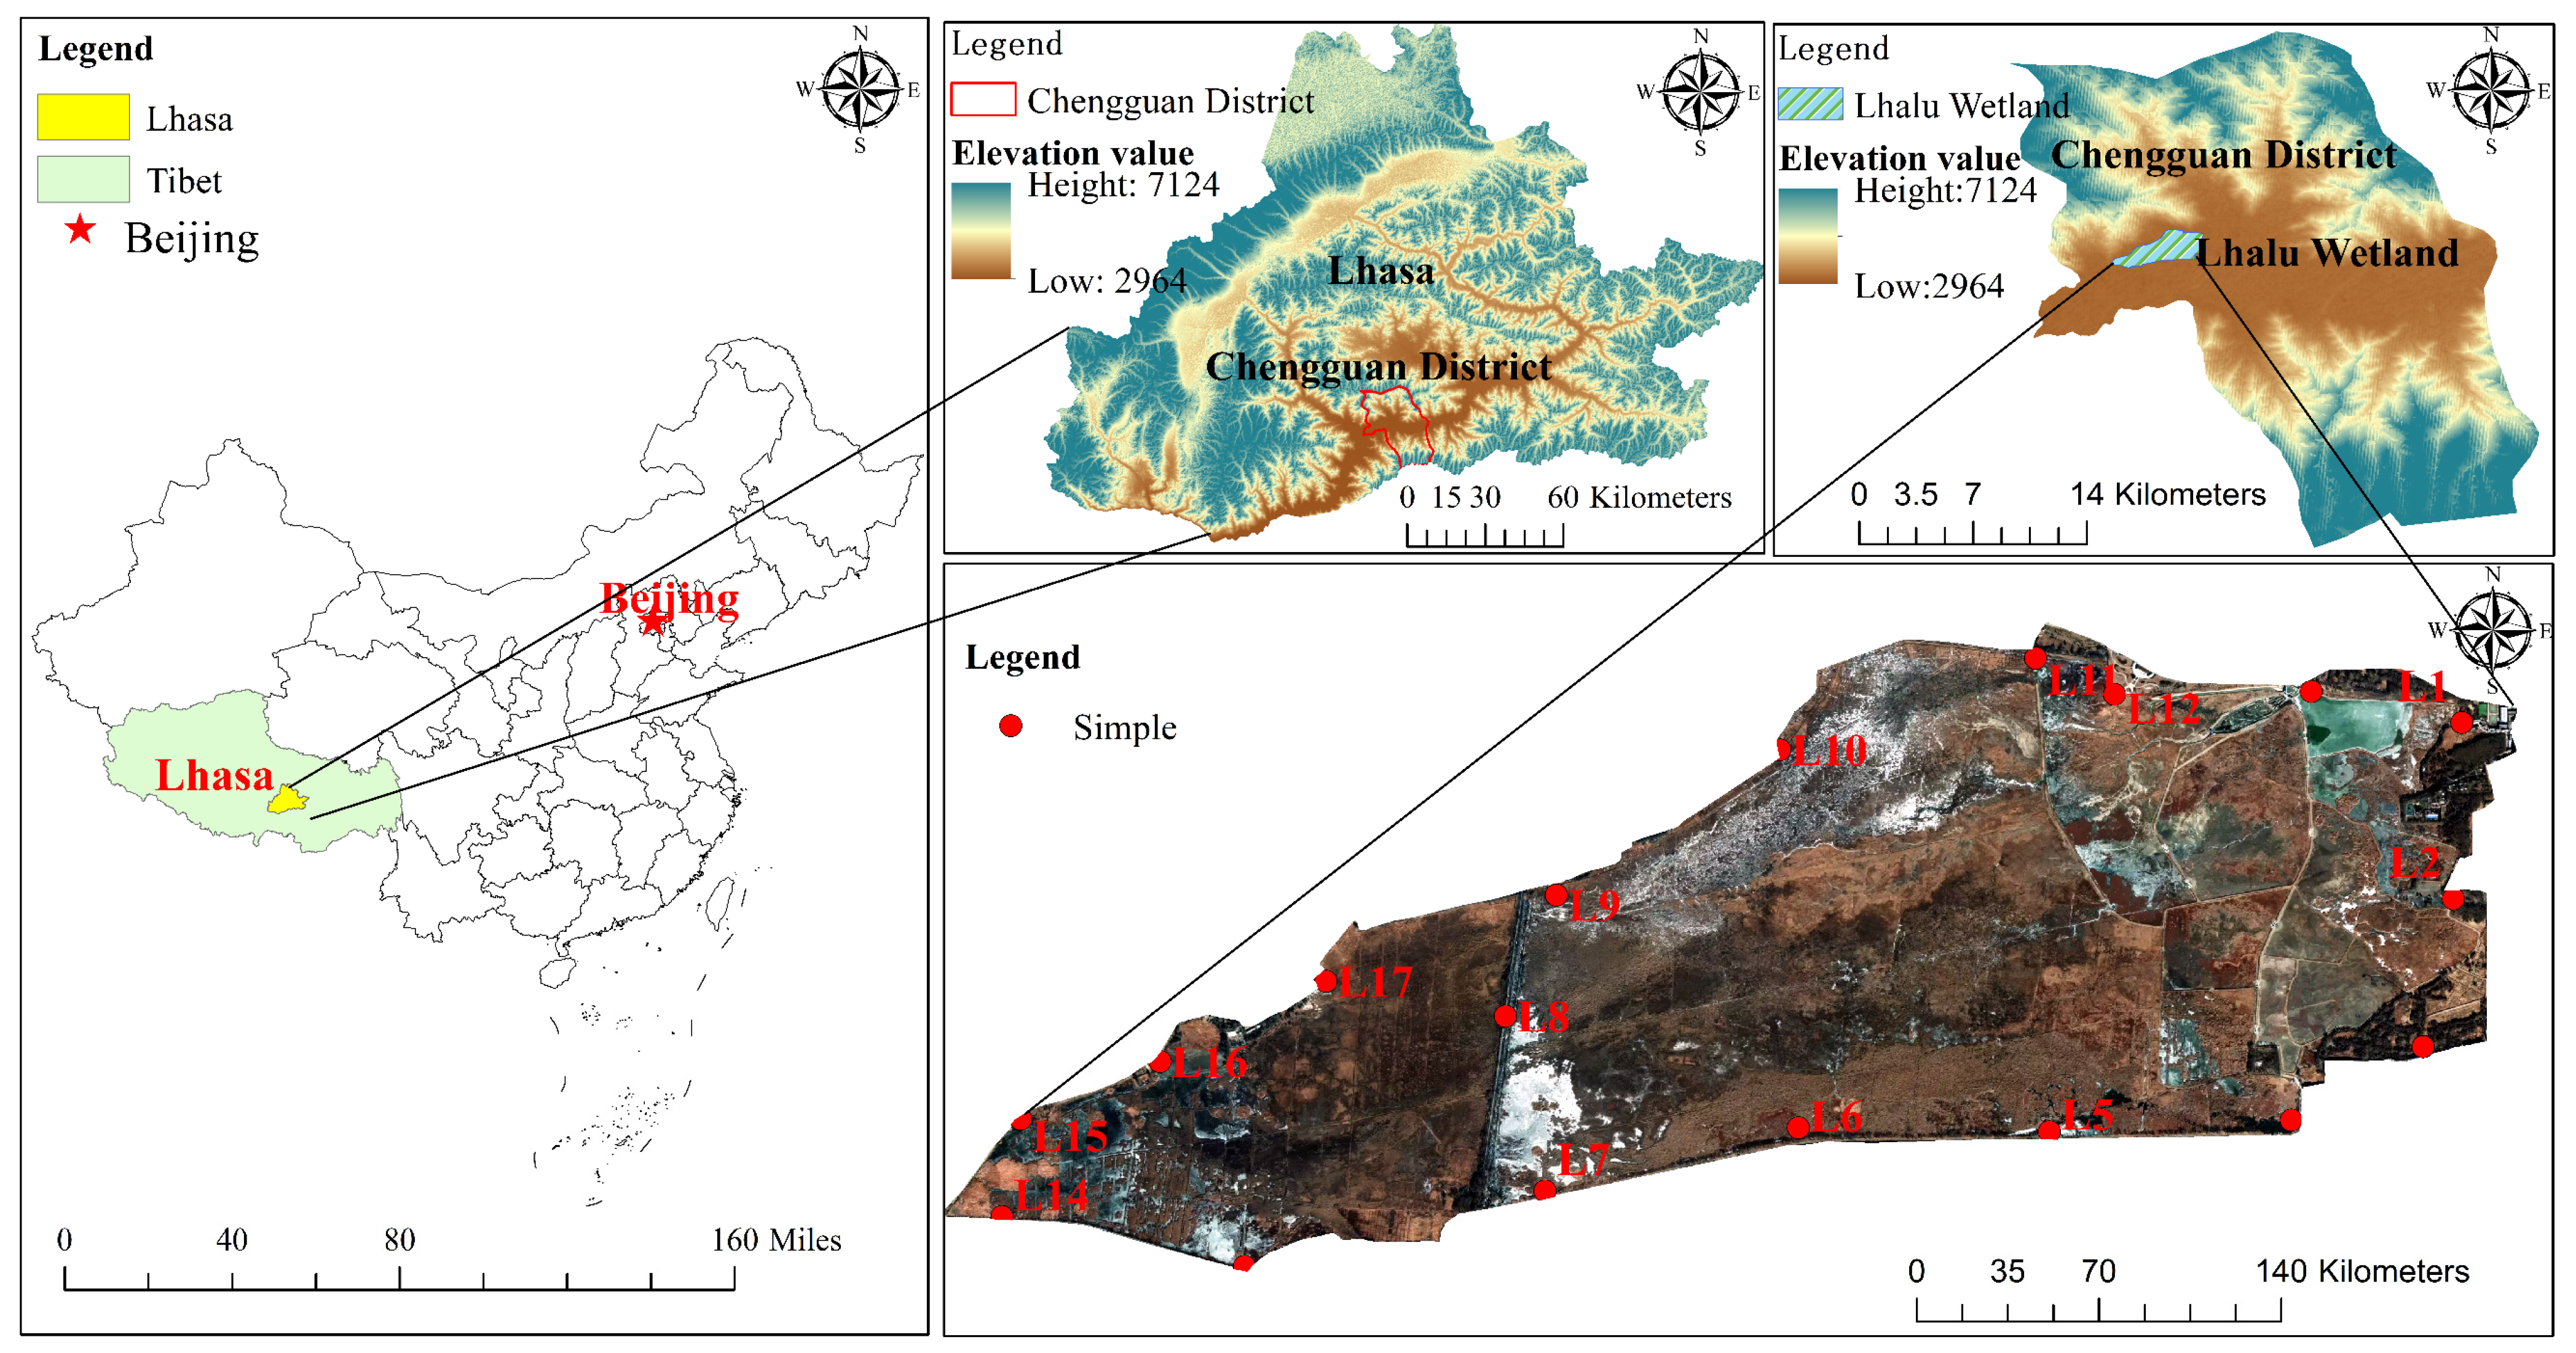
Lalu wetland is situated in the northwestern part of Lhasa City, extending in an east–west belt. Its geographical coordinates fall within the range of approximately 91°03′41″ to 91°06′48″ E longitude and 29°39′25″ to 29°42′08″ N latitude. It extends over a distance of 5.1 km from east to west and 4.7 km from north to south. Standing 3645 m above sea level on average, the wetland encompasses a protected area of 12.2 square kilometers that comprises a 6.6 km
2 core region, a 3.39 km
2 buffer zone, and a 2.21 km
2 experimental area [
20].
This region falls within the temperate semi-arid monsoon climate zone of the southern Tibetan Plateau. Precipitation is concentrated primarily between June and September, with an annual average rainfall of 444.8 mm, predominantly occurring during nighttime. The annual average humidity stands at 45%. Lalu wetland features relatively modest thermal conditions, characterized by low temperatures and minimal annual temperature fluctuations, with an annual mean temperature of only 7.5 °C [
17].
2.2. Sample Collection
By the guidelines established by the Standardization Administration of China in GB/T 36197-2018 [
21], 18 sampling points in total were strategically designated to ensure the representativeness and typicality of the samples (
Figure 1), taking into account the hydrological characteristics, topography, and practical sampling considerations of Lalu wetland. Portable GPS devices were employed to locate each sampling point accurately.
At every sampling point, soil samples were collected within a 10 × 10 m area using a five-point sampling method. The top 20 cm of soil (0–20 cm) were sampled from each location, with approximately 1 kg of soil collected from each point. These individual samples were later combined, devoid of any surface debris, and placed into polyethylene bags, which were subsequently sealed and labeled. Simultaneously, detailed information about each sampling point was recorded.
Upon returning to the laboratory, the soil samples were processed by removing impurities, air-dried, ground into fine particles, sieved through a 200-mesh nylon sieve, and stored in polyethylene bags for further analysis.
2.3. Sample Analysis
In a controlled laboratory environment, the soil samples were meticulously prepared by removing extraneous materials and subsequently left to air-dry at room temperature. The samples were then sieved to produce particles smaller than 0.15 mm.
The microwave digestion method was employed for the dissolution of samples using a high-purity blend of HCl-HNO3-HF-HClO4(Sinopharm Chemical Reagent Co., Ltd., Shanghai, China). The concentrations of Cu, Zn, Cr, Ni, and Pb were determined using ICP-MS (ICP-MS NexION 1000G, PerkinElmer, Waltham, MA, USA). In addition, the concentrations of As and Hg were determined using atomic fluorescence spectroscopy (AFS-8220, Beijing Ji Tian Instrument, Beijing, China).
To ascertain the exactitude and dependability of the research outcomes, the scrutiny and quality assurance/quality control (QA/QC) protocols for Cu, Cr, Ni, Zn, Pb, and Cd were executed by the methodologies stipulated in USEPA 6020B [
22]. The analysis of As followed the guidelines outlined in HJ 680 [
23].
2.4. Geo-Accumulation Index Method
The geo-accumulation index method, initially proposed by German scholar Muller in the late 1960s [
24], is a technique employed for assessing the extent of heavy metal enrichment in soil. It has since found widespread use in the quantitative evaluation of HMs pollution levels in soil [
25]. This method entails a comprehensive analysis of both anthropogenic activities and natural geological processes, taking into account their impact on HMs pollution [
26]. Accordingly, it offers an estimation of the level of HMs pollution in the local soil. The calculation formula is as follows:
In Equation (1),
and
represent the actual sample concentrations (mg/kg) of soil HMs in the study area and background values (mg/kg), respectively, while
signifies the accumulation index. The classification of the accumulation index based on its values is outlined in
Table 1.
2.5. Potential Ecological Risk Index Method
The potential ecological risk index method, as introduced by the Swedish scholar Hakanson in 1980, finds its foundation in a holistic evaluation encompassing the single-factor pollution index and the toxicity coefficients associated with heavy metal elements. It adequately reflects the toxicity levels of various heavy metal elements and offers a holistic view of their potential impacts on the soil [
28]. This approach not only considers the content of heavy metals but also establishes connections between the ecological, environmental, and toxicological effects of these elements. It is currently one of the widely utilized methods in ecological risk assessment. The calculation formula is as follows:
In Equation (2),
(dimensionless) represents the total potential ecological risk index for all heavy metals in a designated study area [
29].
(dimensionless) is the individual ecological risk index for a given element,
(dimensionless) stands for the toxic response factor,
(dimensionless) is the pollution coefficient for the element,
(mg/kg) represents the actual sample concentrations of the element, and
(mg/kg) is the reference value for the element (selected as the environmental background value for surface soils in Tibet in this study). Detailed classifications for
and
are provided in
Table 2. For Cu, Cr, Ni, Zn, Pb, Cd, and As, the values are 5, 2, 5, 1, 5, 30, and 10, respectively [
30].
2.6. Health Risk Assessment Model
According to the health risk assessment model recommended by the United States Environmental Protection Agency [
32], the quantification of human health risks from soil heavy metals is conducted through three exposure modes (oral ingestion, inhalation, and dermal contact) [
33]. This model categorizes human health risks into two types: carcinogenic risk (CR) and non-carcinogenic risk (NCR). Furthermore, the population is usually assessed as two groups: adults and children, to account for variations in physiology and behavior. The equations delineating the mean daily intake via the three distinct exposure routes (namely, ingestion, inhalation, and dermal contact) are presented as follows:
In Equations (3)–(5),
,
, and
denote the mean daily intake (mg/kg/day) via the routes of ingestion, inhalation, and dermal contact, respectively.
is the actual sample concentrations (mg/kg) of HMs in soil. For detailed information on the remaining parameters, please refer to
Table 3.
Non-carcinogenic risks are assessed using a hazard index (
), where the
represents the cumulative non-carcinogenic risk in the study area.
is the individual risk index for HMs
i under exposure mode
j, calculated as the ratio of the daily exposure dose (
) of HMs
i under exposure mode
j to its corresponding reference dose (
).
represents the summation of the individual risk indices (
) for different heavy metals under various exposure modes [
35]. The formulas for calculating
and
are as follows:
CR is assessed by the total carcinogenic risk (
).
is ascertained through the multiplication of the daily exposure dose (
) for individual HMs
i within the corresponding exposure mode
j and its corresponding slope factor (
).
represents the sum of individual carcinogenic risks (
) for different heavy metals under different exposure modes [
36]. The formulas for calculating
and
are as follows:
In Equations (8) and (9),
and
represent the toxic reference coefficients and carcinogenic slope factor values for individual heavy metals
i under exposure mode
j, with specific values detailed in
Table 4. If
(or
) exceeds 1, it indicates the existence of non-carcinogenic health risks from HMs to humans. Conversely, values below 1 suggest that HMs pose almost no non-carcinogenic health risk. If
(or
) is less than 1 × 10
−6, it implies the absence of a carcinogenic risk; 1 × 10
−6 ≤
(or
) < 1 × 10
−4 indicates an acceptable carcinogenic risk; while 1 × 10
−4 ≤
(or
) suggests an unacceptable carcinogenic risk [
37].
2.7. Monte Carlo Simulation
To avoid the potential distortion of health risk assessment results that may arise from the direct use of deterministic parameters, this study employs Monte Carlo simulation for health risk assessment. Based on probabilistic modeling, this approach takes into account the uncertainty around key exposure characteristics, such as the dermal adhesion coefficient, soil ingestion rate, and exposure frequency, as well as the fluctuation in HMs concentrations. As a result, it significantly reduces the uncertainty associated with health risk assessment outcomes.
The key steps of the Monte Carlo-based probabilistic risk assessment are as follows: determination of the probability distributions for the heavy metal concentration parameters; definition of uncertain parameter values based on these probability distributions; conducting 10,000 random samples within the parameter distribution ranges and using them in the risk assessment model for calculations; the extraction of simulated predictive parameters to obtain the cumulative probability distribution results for health risk assessment; and, concerning the sensitivity analysis outcomes, determination of the contribution variance of uncertain parameters.
2.8. APCS-MLR Source Apportionment Model
The APCS-MLR model calculates the absolute principal component factor scores based on PCA. These factor scores, along with the soil heavy metal content, are used as independent and dependent variables in a multiple linear regression analysis. This allows for the determination of contribution rates from various pollution sources, utilizing multiple linear regression coefficients [
39,
40]. The computational steps and formulas are as follows.
Standardization of the original data:
In Equation (10), represents the standardized value, represents the concentration of element j in the i sample (mg/kg), and and represent the mean and standard deviation of element j concentration (mg/kg), respectively.
Introducing the concentration factor of 0, the calculation of the absolute principal component scores, denoted as APCS
k, is performed as follows:
In Equations (11) and (12), represents the standardized value corresponding to zero concentration of the pollutant, represents the principal component score when the value is at an absolute zero, represents the score value of the principal component, and is the absolute principal factor score.
Using
as the independent variable, a multiple linear regression is performed, and the resulting regression coefficients can be utilized for calculating the contribution amount, as indicated by the following formula:
In Equation (13), (mg/k) represents the actual sample concentrations of HMs j; denotes the multivariate regression constant for heavy metal j; signifies the HMs j regression coefficient of source k.
Utilizing the absolute value method proposed by Gholizadeh, all negative values are transformed into positive contributions, addressing situations where negative values are present in the contribution calculation and enhancing the accuracy of heavy metal source apportionment [
41]. The contribution rate formula for factor k to heavy metals
j is as follows:
2.9. Source-Oriented Health Risk Assessment
Based on the results of Monte Carlo simulations and the integration of the APCS-MLR model with the HRA model, the contribution rates to health risks resulting from various sources of HMs are computed. To quantify the CR and NCR facing children and adults, the average health risk for individual HMs derived from Monte Carlo simulations is multiplied by the contribution rate of each source of these HMs (Ma et al., 2018). This calculates the contribution of heavy metal sources to the carcinogenic and non-carcinogenic health risks for children and adults [
36].
The formula for computing the non-carcinogenic risk contribution rate is presented as follows:
The formula for computing the carcinogenic risk contribution rate is presented as follows:
In Equations (15) and (16), represents the contribution rate of each factor to carcinogenic/non-carcinogenic risk, is the average non-carcinogenic risk value for each heavy metal element, is the average carcinogenic risk value for each HMs element; is the contribution rate of factor k to heavy metal j.
2.10. Data Analysis
The study involved data organization and descriptive statistical analysis using SPSS 26 and EXCEL 2019. The geographic spatial data were visualized and analyzed through ArcGIS. A probability human health risk assessment based on Monte Carlo simulation was conducted using an Oracle Crystal Ball v11.1.24 (Oracle, Austin, TX, USA). The data processing and graph plotting were performed using Origin 2021b.
3. Results and Discussion
3.1. Characteristics of HMs Concentration
A descriptive statistical analysis of HMs concentration in soil samples was conducted (
Table 5), which included maximum values, minimum values, mean values, standard deviations, coefficients of variation, probability distribution types, and background values. The average contents of Cu, Cu, Cr, Ni, Zn, Pb, Cd, and As were 33.89, 34.06, 15.56, 103.00, 49.09, 0.23, and 16.42 mg/kg, respectively. Except for Cr, Ni, and As, the average values of HMs in the soil exceeded the background values for Tibetan soil [
42] with the average amounts of Cu, Zn, Pb, and Cd being 1.48, 1.18, 1.36, and 2.15 times more than the background values for soil in Tibet, indicating a certain degree of enrichment in these four elements.
According to Karimi’s research, the coefficient of variation (CV) was categorized from low variation (CV < 20%) to moderate variation (20% < CV < 50%) and high variation (CV > 50%). A higher coefficient of variation indicates a more uneven distribution of elements, signifying a greater influence from human activities [
43]. The ranking of the coefficient of variation for heavy metal elements in the study area’s soil is as follows: Cu > Cd > As > Zn > Ni > Cr > Pb. The coefficient of variation for Pb was 18.66%, indicating low variation and a relatively uniform spatial distribution of Pb. In contrast, the coefficients of variation for Cr, Ni, Zn, and As were 22.22%, 24.37%, 30.61%, and 49.58%, indicating moderate variation and less uniform spatial distribution. Cu had the highest coefficient of variation at 59.10%, indicating high variation and a heterogeneous distribution with local enrichment, which is significantly influenced by human activities. Fluctuations in the levels of HMs within the surface soil of the study area are impacted not solely by geological factors but also by human activities. Thus, a more in-depth validation and analysis through source apportionment becomes imperative.
The study, by comparing the average concentrations of heavy metals in the soil and sediments of Lalu wetland with those in other wetlands across China (as presented in
Table 6), revealed notable patterns. In Lalu wetland soil, the average concentration of Cu surpassed that of Suohuangcang National Wetland, Huangshui National Wetland, and Yellow River Delta Wetland but fell below Huixian Wetland and Dongting Lake Wetland. Zn and Pb elements showed slightly elevated levels compared to the Yellow River Delta Wetland but were lower than in other wetlands. The element concentrations were slightly higher than those in Huangshui National Wetland but lower than in other wetlands. Additionally, Cr, Ni, and Cd elements were generally lower than in other wetlands. While certain heavy metal elements in the Lalu wetland soil exceeded those in some regions of China, the majority of them were lower than in other wetlands. Overall, Lalu wetland exhibited relatively lower concentrations of heavy metals in its soil, indicating a comparatively favorable environmental quality.
3.2. Analysis of the Spatial Distribution Characteristics of Heavy Metals
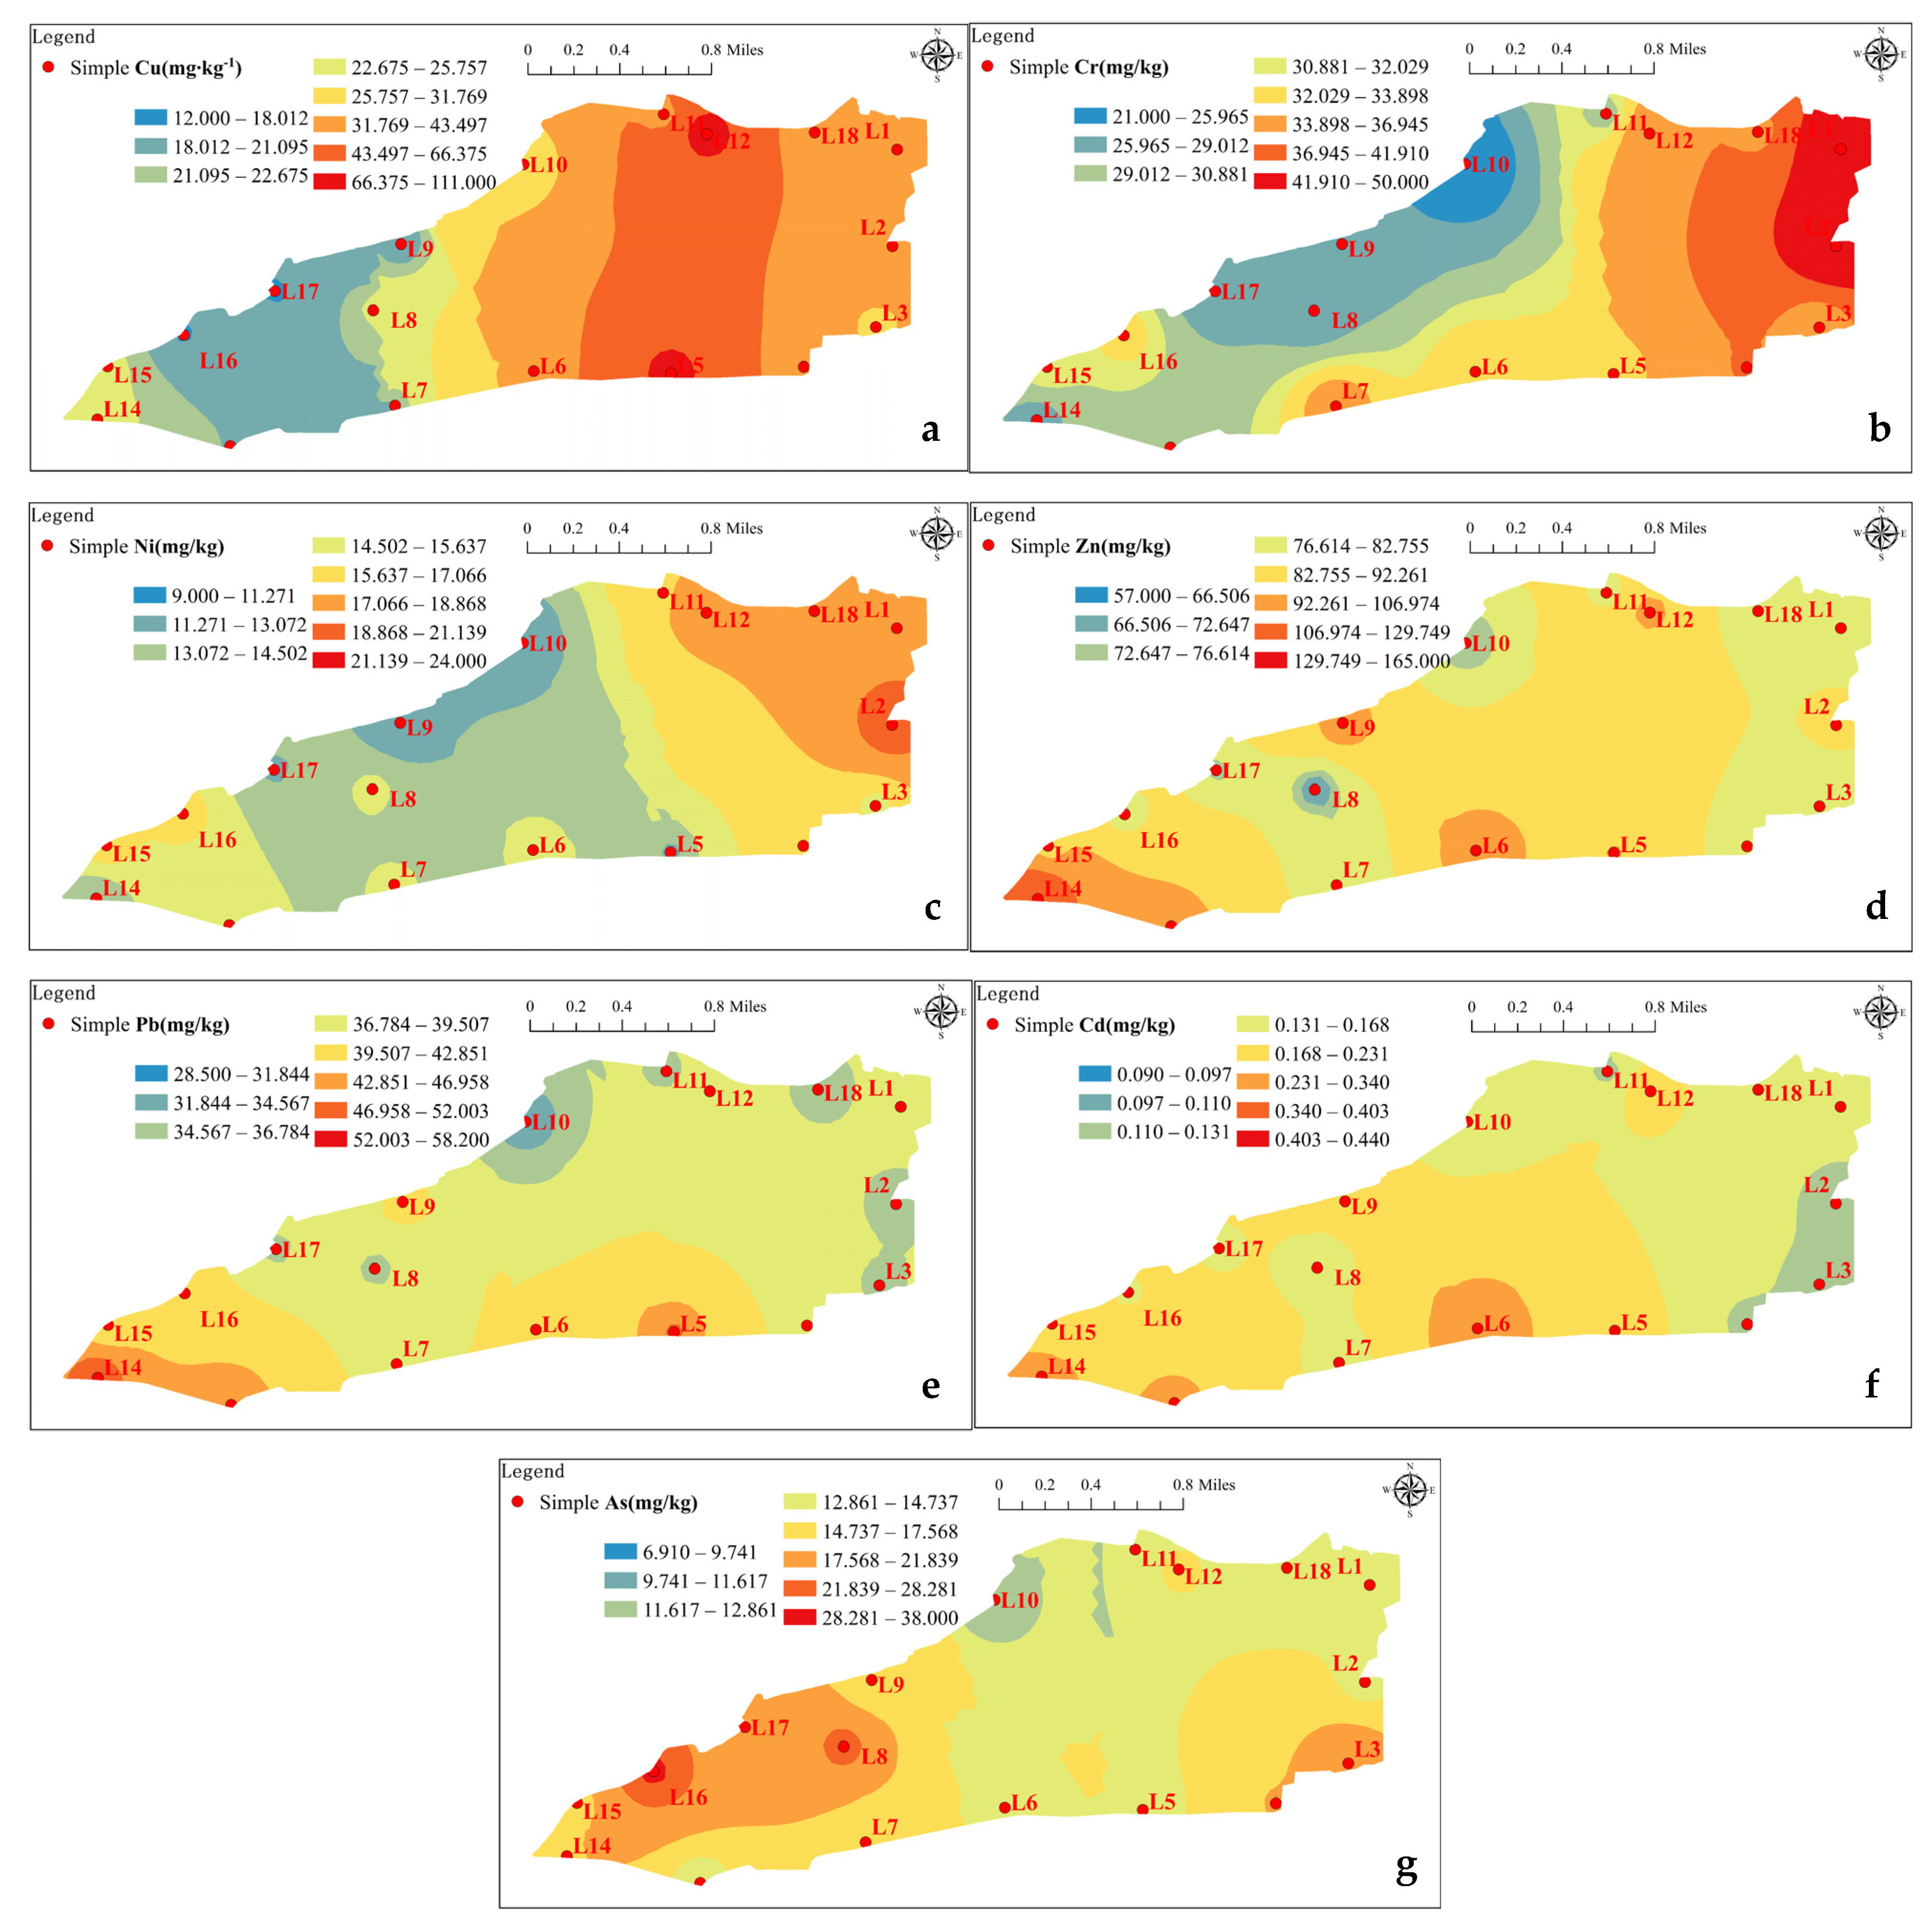
In this study, the pollution status and spatial distribution of heavy metals in wetland soils were analyzed using the inverse distance weighting (IDW) method in ArcGIS for spatial interpolation. The research revealed distinct spatial variations among the seven heavy metals within the study area (
Figure 2). Specifically, the spatial distribution of Cr and Ni exhibited similarities, with high-value regions primarily located in the eastern part of Lalu. Zn, Pb, and Cd showed analogous spatial distributions, with high-value areas concentrated mainly in the western and southern regions of the wetlands, adjacent to transportation arteries and residential areas. The high-value regions for Cu were predominantly situated in the eastern part of the study area, characterized by the absence of distinct point source pollution and a predominant planar distribution. As’s high-value regions were primarily found in the western and southeastern areas of the study site.
3.3. Ecological Risk Assessment of Soil HMs
The potential ecological risk index and the geo-accumulation index methods were used in the study. Based on the background levels of soil HMs in Tibet, the contamination levels of wetlands with soil HMs were evaluated. The results of the geo-accumulation index method (
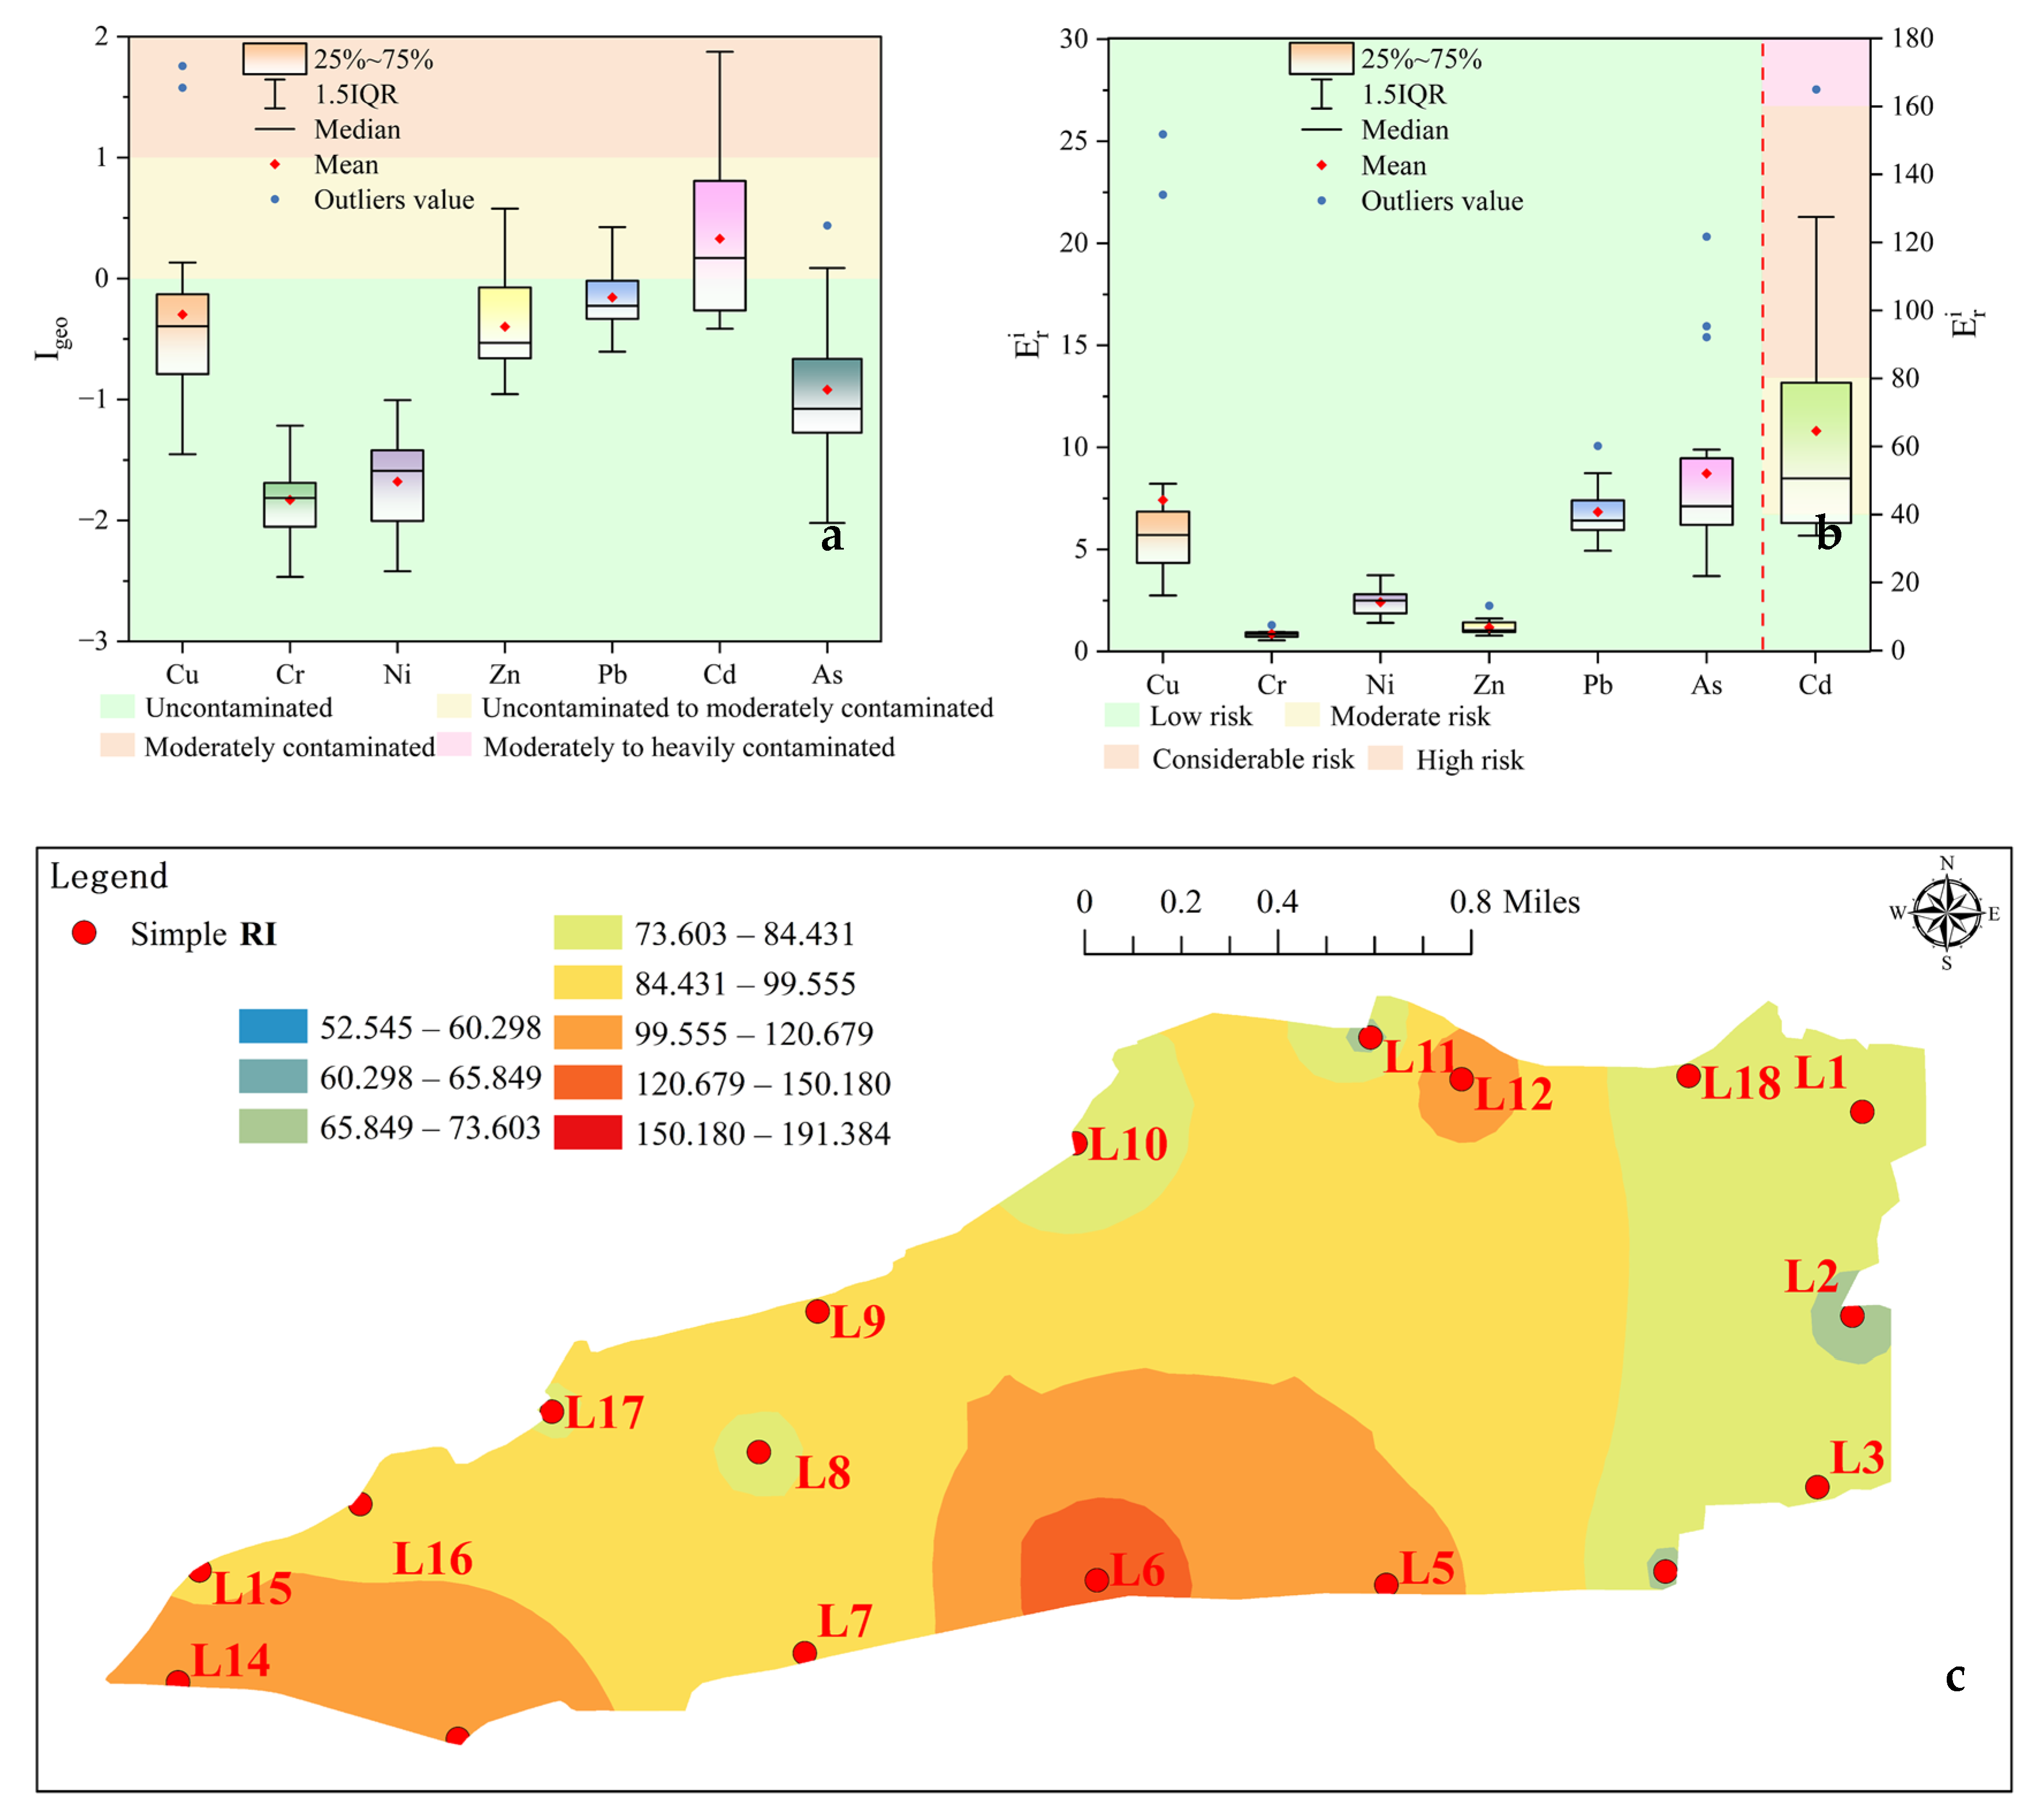
Figure 3a) showed that the range of values for each heavy metal element was Cu (−1.45 to 1.76), Cr (−2.47 to −1.21), Ni (−2.42 to −1.00), Zn (−0.96 to 0.58), Pb (−0.61 to 0.42), As (−2.02 to 0.44), and Cd (−0.42 to 1.87), with mean values ranked as Cd (0.33) > Pb (−0.16) > Cu (−0.30) > Zn (−0.40) > As (−0.92) > Ni (−1.68) > Cr (−1.83). Elements Pb, Cu, Zn, As, Ni, and Cr had mean values less than 0, indicating uncontaminated, while Cd had a mean value greater than 0 but less than 1, signifying uncontaminated to moderately contaminated. In summary, elements Cr and Ni were barely influenced by anthropogenic factors, elements Zn, Pb, Cu, and As were moderately affected, and Cd was relatively more influenced by external factors.
The results of the potential ecological risk index method (
Figure 3b) indicated a range of values for each heavy metal element: Cu (2.74 to 25.34), Cr (0.54 to 1.29), Ni (1.40 to 3.74), Zn (0.77 to 2.24), Pb (4.93 to 10.07), As (3.70 to 20.32), and Cd (33.75 to 165). Their mean values ranked as Cd (64.58) > As (8.722) > Cu (7.42) > Pb (6.83) > Ni (2.41) > Zn (1.19) > Cr (0.86). Similar to the geo-accumulation index method results, all heavy metal elements, except Cd, had maximum values below 40, indicating low risk. Cd mean value was 64.58, representing moderate risk, with 38.89% of the sampling points having Cd values below 40 (low risk), 38.89% having values ranging from 40 to 80 (moderate risk), and 22.22% with values between 80 and 160 (High risk), making it a major factor in the ecological risk of wetland soil. Overall, the range index (RI) values for soil heavy metals in the study area ranged from 52.54 to 191.38, with a mean of 92.01, indicating low risk. However, there are localized areas of moderate risk, especially in the southwest and southern regions of the wetlands (as shown in
Figure 3c), likely due to the presence of multiple traffic arteries and large residential areas in the vicinity, causing HMs from human activity to accumulate in the nearby soil, raising the level of localized danger.
3.4. Source Apportionment of HMs
To ascertain the origins of HMs in the soil of the Lalu wetland, the research initially utilized Pearson correlation analysis to establish the correlations between the concentrations of soil heavy metals (HMs). The possible sources of HMs were then assigned and quantified using the APCS-MLR model (
Figure 4a). Additionally, as seen in
Figure 4b, this study compared the factor contributions of the APCS-MLR model with the HMs’ Pearson correlation coefficients and the outcomes of their cluster analysis to confirm the veracity of the heavy metals source analysis results.
Pearson correlation analysis (
Figure 4b) revealed strong correlations with correlation coefficients of 0.75 for Pb and Cd, 0.86 for Pb and Zn, 0.81 for Cd and Zn, and 0.79 for Cr and Ni, indicating significant correlations between these elements, suggesting a common source for these elements. Cu showed correlations ranging from 0.2 to 0.4 with Zn, Pb, Cd, and Cr, indicating a degree of correlation, suggesting that Cu may have similar sources or migration patterns to these elements [
49]. The relationships between As and the other elements were either very weak or negative, indicating different sources for As. The analysis results were consistent with the cluster analysis, categorizing the seven heavy metal elements into three groups: Cu, Zn, Pb, and Cd formed one group, Cr and Ni formed another group, and As was in a separate group.
The study extracted three major factors using the APCS-MLR model, as shown in
Table 7, with a cumulative variance contribution rate of 81.49%. These factors could explain a significant portion of the data’s information, with R2 values for all seven heavy metal elements exceeding 0.70, indicating a high level of fit and relatively high model accuracy [
50].
Factor 1 contributed 51.13% of the variance and was primarily associated with Cu (0.498), Zn (0.909), Pb (0.937), and Cd (0.875). The average concentrations of these four elements were all higher than the local background values, and there were significant correlations between Zn, Pb, and Cd. Cu showed weaker correlations with these three elements. The study area is a typical urban wetland surrounded by roads and densely populated residential areas. The high-value areas for Zn, Pb, and Cd were mainly concentrated in the western part of the study area near a busy road intersection, indicating the influence of traffic factors. The current research suggests that Zn, Pb, Cd, and Cu are commonly associated with traffic factors, originating from leaded gasoline, engine wear, and braking in road-related sources [
51]. Vehicle materials contain a significant amount of Cu, Zn, Pb, and Cd, which are released into the environment through the wear and tear of vehicle components during usage [
52]. Vehicle emissions also contain substantial amounts of Pb (approximately 17 mg/L in unleaded gasoline), trace Cu, and Cd. Considering the presence of several major traffic arteries, a gas station, and an auto repair center near the western part of the study area, and the accumulation of these HMs in the soil, as a result of various factors including inadequate fuel combustion at high altitudes, factors have contributed to their further enrichment in the wetland soil [
53,
54]. Therefore, Factor 1 can be interpreted as primarily influenced by traffic sources.
Factor 2 contributed 32.35% of the variance and was primarily associated with Cr (0.927) and Ni (0.915), with both elements having concentrations below the local background values. These elements showed strong correlations, low variability, and no clear point source distribution, suggesting a smaller impact from human activities. Prior investigations have shown that chromium (Cr) and nickel (Ni) are commonly linked to soil parent materials and are widely dispersed during the soil genesis and parent material processes [
49]. Soils on the Qinghai–Tibet Plateau are primarily derived from the weathering of ultramafic rocks, and elements Cr and Ni are abundant and evenly distributed [
55]. Therefore, Factor 2 can be explained as primarily influenced by soil parent material sources.
Factor 3 contributed 16.52% of the variance, with As (0.983) as the primary element. Its average concentration was 16.31 mg/kg, exceeding the average As concentration of 11.2 mg/kg in Chinese soil background values [
56], yet slightly lower than the local background value’s average As concentration of 18.7 mg/kg. High concentrations were concentrated in areas of heavy metal enrichment in the wetland, such as the outfall and inflow areas. The previous research indicates that As primarily originates from factors such as rock weathering, combustion of fossil fuels, agricultural activities, and modern industrial products containing As. However, considering the relatively low As content in the study area, it suggests limited influence from human activities. Additionally, Tibet boasts abundant shale resources and geothermal reserves containing As minerals that can dissolve in geothermal water. These minerals are then enriched in aquatic environments through the effects of water vapor generated by geothermal activity [
57,
58]. Furthermore, wetland recharge water primarily originates from natural water bodies associated with the Lhasa River, such as the tailwater from the Xianduo Hydropower Station and the Liusha River. The Lhasa River water, in particular, exhibits a relatively high As concentration [
59]. Therefore, Factor 3 can be attributed to the influence of geothermal activity.
Based on the contribution rates of various metal sources calculated by the APCS-MLR model, it shows that the percentages of Cu, Zn, Pb, and Cd that are contributed by traffic sources are relatively large at 48.42%, 79.28%, 91.21%, and 77.33% (
Figure 4a), respectively. Soil matrix sources contribute significantly to Cu, Cr, and Ni, with percentages of 49.58%, 91.06%, and 84.30%, respectively. Hydrological activities contribute relatively high percentages to As, at 81.04%. The previous studies suggest that when different factors contribute similarly to the same element, it can be inferred that the element likely has multiple sources. Therefore, it is reasonable to conclude that Cu is likely influenced by both traffic and soil matrix sources.
3.5. Health Risk Assessment
In order to lower the uncertainty of parameters in HRA, a Monte Carlo simulation was employed to evaluate the CR and NCR of surface soil HMs in the Lalu wetland for the entire population, including children and adults, through 10,000 simulation runs.
The average CR and NCR values for seven HMs in the study area’s soil under three different exposure modes for both adults and children are presented in
Table 8, with the contribution rates shown in
Figure 5. Regarding exposure modes, heavy metals were found to primarily affect adults through dermal contact, with contribution rates of 68.53% and 65.51% in non-carcinogenic and carcinogenic assessments, respectively. Conversely, for children, the primary exposure mode was oral ingestion, with contribution rates of 71.74% and 73.37%, possibly due to the lower probability of oral ingestion by adults and the larger surface area of skin exposure. The children’s smaller skin exposure area, along with frequent hand-to-mouth behaviors, led to a higher intake of heavy metal elements, as observed in previous studies [
60], which aligns with the findings of Chen et al. [
51]. Therefore, to safeguard the residents’ health, it is imperative to minimize direct soil particle ingestion, with particular attention to restricting hand-to-mouth behaviors among children.
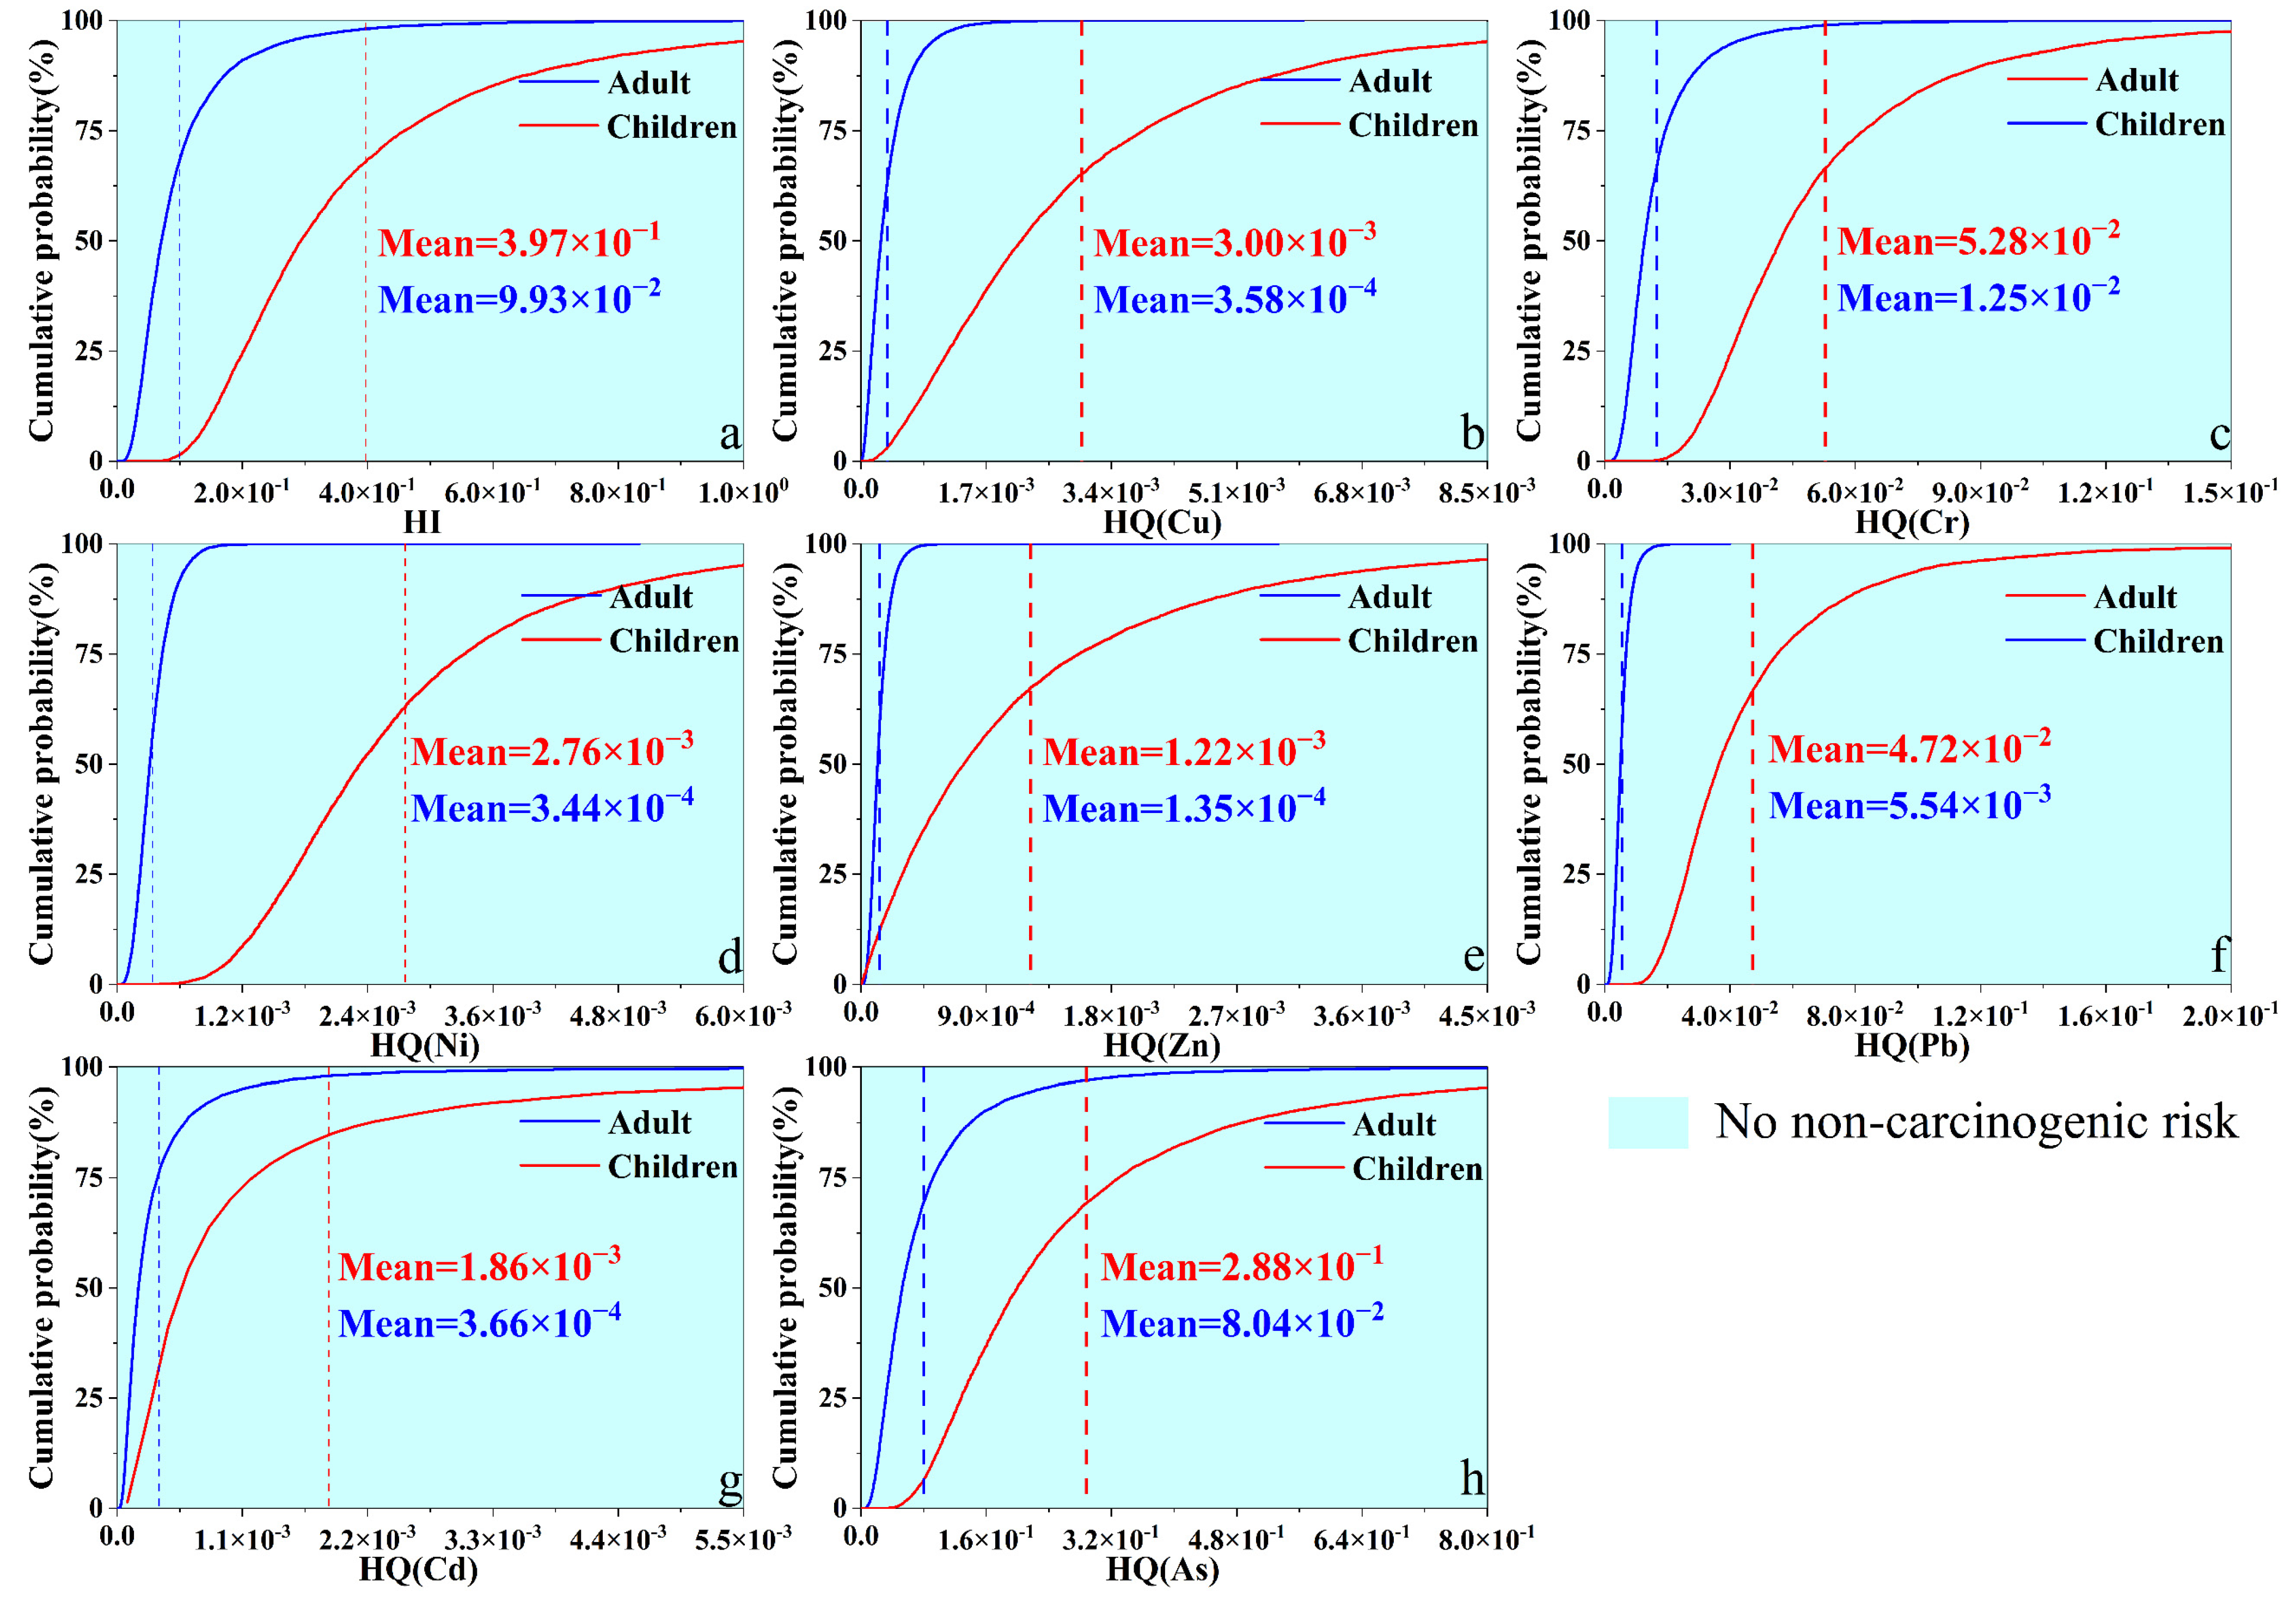
Through a comparative analysis of the probability distribution graphs for risk indices and hazard quotients (HQ) concerning NRC in different population groups (adults and children), as presented in
Figure 6a,b–h, it is evident that within the 95% confidence interval, the average values and 95th percentile values of HI for both adults and children remain below the USEPA guideline of 1 (
Figure 6a). These values do not exceed the risk threshold, signifying the absence of NCR associated with soil heavy metals in the study area. Notably, children exhibit a higher average HI compared to adults, indicating a greater NCR (
Figure 6a). Furthermore, the average HQ values and their 95th percentile values for all seven heavy metals (HMs) in both children and adults are less than 1, confirming that these seven HMs do not pose NCR to human health. The basic trends in the HQ mean for the NCR of each HMs for children and adults were As > Cr > Pb > Cu > Ni > Cd > Zn and As > Cr > Pb > Cd > Cu > Ni > Zn (
Figure 6b–h), respectively, which were both presented as the highest non-carcinogenic risk for As.
Similarly, upon comparing the probability distribution graphs for target carcinogenic risk (TCR) and carcinogenic risk (CR) values for different population groups (adults and children), as depicted in
Figure 7a,b–f, it is revealed that within the 95% confidence interval, the mean TCR values for adults and children are 2.71 × 10
−5 and 2.81 × 10
−5, respectively. These values surpass the USEPA guideline of 1 × 10
−6 but remain below 1 × 10
−4 (
Figure 7a), indicating an acceptable carcinogenic risk associated with soil heavy metals for human health in the study area. Children, in comparison to adults, exhibit higher mean TCR values, signifying a greater CR (
Figure 7a). Additionally, except for Pb, the mean CR values for the other HMs in both children and adults exceed 1 × 10
−6 but are below 1 × 10
−4, suggesting an acceptable carcinogenic risk. The CR values of Pb for both children and adults are below 1 × 10
−6, signifying the absence of any carcinogenic risk to human health. The basic trends in the mean CR values for the CR of each HMs for children and adults were As > Ni > Cr > Cd > Pb and As > Cr > Ni > Cd > Pb (
Figure 7b–f), respectively, with As posing the highest carcinogenic risk.
Through a comparative analysis of the health risk assessment results of heavy metals in soil across various regions in China, as presented in
Table 9, it is evident that both carcinogenic and non-carcinogenic risks for adults and children in Lalu wetland are significantly lower than those in Lhasa, Jiuquan, and Nyingchi. This suggests that the soil environment’s health risk status in Lalu wetland is relatively favorable and notably superior to these three regions.
In summary, children exhibit greater sensitivity to soil heavy metals than adults, reflected in their elevated mean values for both CR and NCR. Their primary exposure mode is oral ingestion, likely due to frequent hand-to-mouth behaviors [
62]. Moreover, As is consistently the leading risk factor for both CR and NCR in adults and children. This can be attributed to the region’s elevated background levels of As and the high carcinogenic slope factor in health risk assessments, coupled with a lower reference dose [
63]. Consequently, it is recommended that communities and schools intensify health awareness efforts, minimize children’s direct contact with contaminated soil, restrict the frequency of children’s hand-to-mouth behaviors, encourage regular handwashing, and implement targeted remediation in As-contaminated areas.
3.6. Source-Oriented Health Risk Assessment
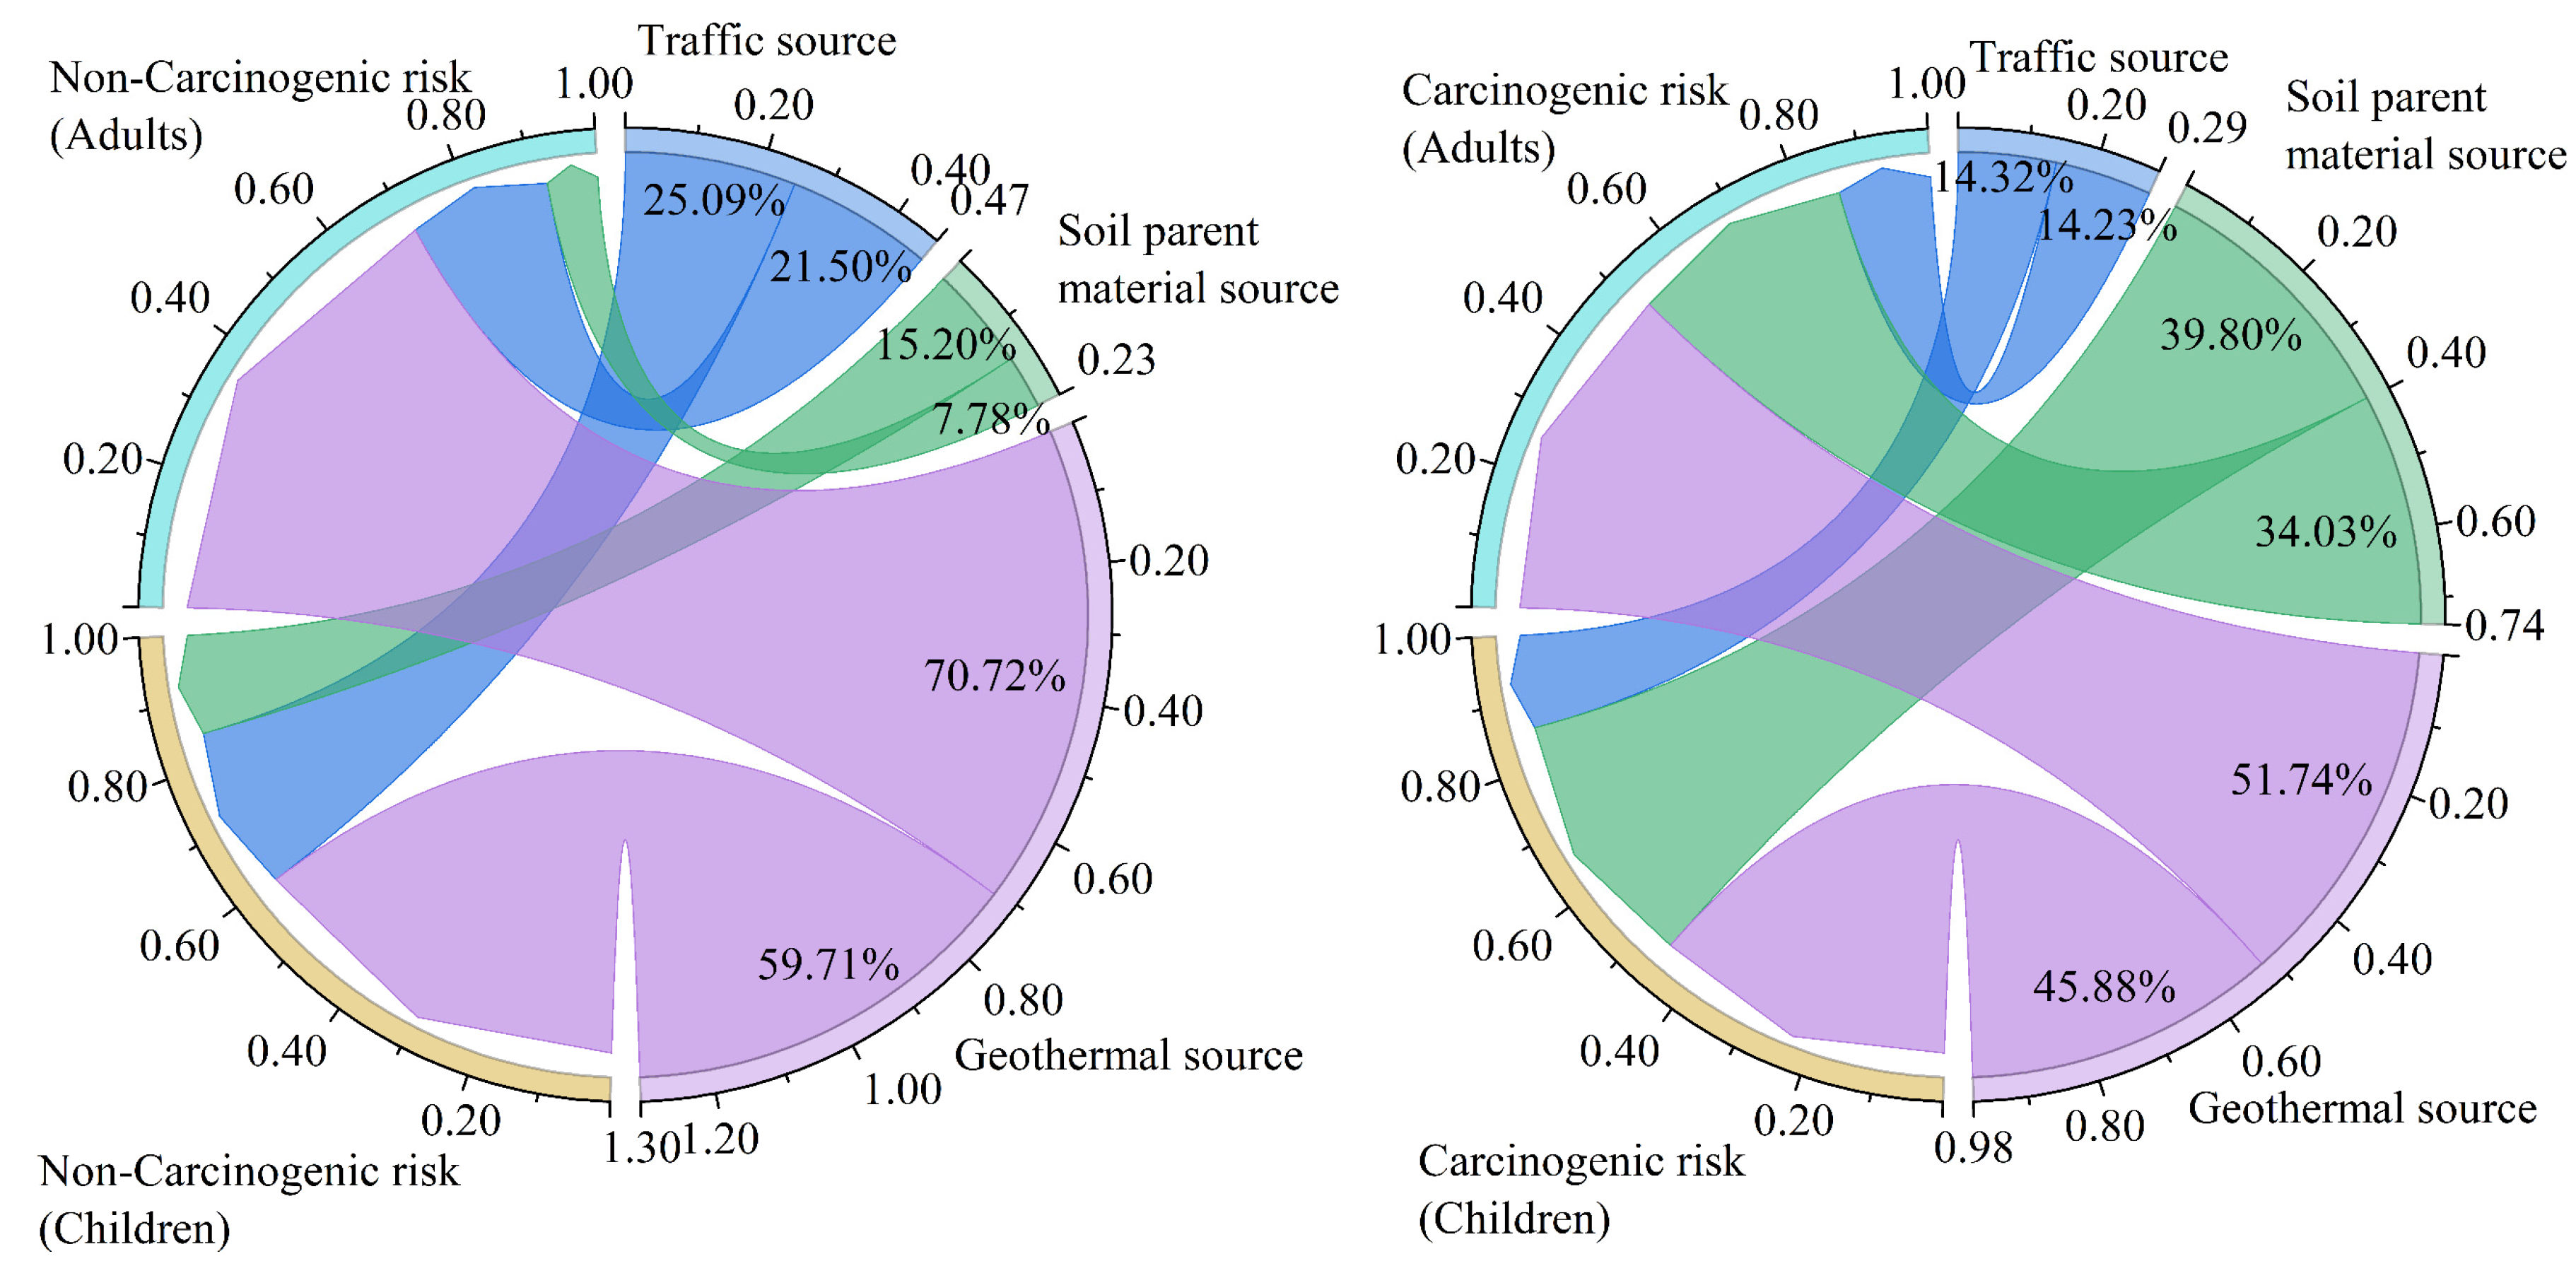
Based on the source apportionment results derived from the APCS-MLR model, we further assessed the NCR and CR by considering the contributions from different pollution sources. As shown in
Figure 8, there is a similarity in the effects of different sources on health risks for children and adults, which is consistent with the findings of Zhang et al. [
15]. In both adults and children, the rank order of contribution of the three HMs sources to CR and NCR are in the following order: geothermal > traffic > soil. The order of CR to NCR for adults and children from the three heavy metal sources is geothermal > traffic > soil matrix, while for carcinogenic risks, the order is geothermal > soil matrix > traffic. Geothermal sources account for 70.72% and 59.71% of the CR for adults and children, respectively, and 51.74% and 45.88% of the NCR, contributing the most among the three sources. Meanwhile, traffic sources contribute 21.50% and 25.09% to NCR for adults and children, and soil matrix sources contribute 34.03% and 39.80% to CR for adults and children, with their contributions being relatively high and significant.
This phenomenon may be attributed to the fact that Lhasa primarily relies on tourism and animal husbandry as its main economic activities, with very few modern industrial and mining enterprises. Furthermore, these industrial facilities are located far from the core urban area of Lhasa, whereas the Lalu wetland is situated in the central region, surrounded by highways, densely populated residential areas, and backed by mountains. Industrial pollution from these sources has a negligible impact on the wetland. Geothermal sources contribute the most to the As element in the study area and, in both CR and NCR assessments, As is the predominant contributing element. In the context of carcinogenic risk, the low carcinogenic slope factors of the primary contributing elements, Cd and Pb from traffic sources, compared to Cr and Ni from soil matrix sources, lead to the geothermal sources having the highest contribution, thus, reducing the contribution from traffic sources.
Quantifying the contributions of different heavy metal sources to health risks aids in formulating mitigation methods and measures. By prioritizing the control of specific heavy metal sources, health risks can be reduced to the maximum extent possible. Considering that geothermal sources, a natural origin, are the primary contributors to health risks in the study area, there should be a strong emphasis on controlling traffic sources. This can be achieved by constructing natural plant barriers and road green belts around the wetland to block heavy metals originating from traffic sources and prevent their enrichment within the wetland, thereby achieving precise control of heavy metals in the wetland soil.
4. Conclusions
Taking the high-altitude urban wetland of Lalu as the research subject, this study explored the distribution characteristics, ecological risks, sources, and health risks of heavy metals in wetland soils. The APCS-MLR model and Pearson correlation analysis were employed to identify and quantify potential sources of HMs, with a particular focus on introducing an HRA model based on the Monte Carlo simulation, reaffirming the model’s effectiveness and offering a new perspective for assessing wetland soil health risks. According to the study’s findings, the research area’s ecological risk from HMs is low risk, with Cd being the primary contributing element. The main sources of contamination are traffic, soil matrix, and geothermal sources, contributing 51.13%, 32.35%, and 16.52%, respectively. Both adults and children face no non-carcinogenic risks but bear acceptable carcinogenic risks. Moreover, children exhibit higher health risks than adults with As as the primary risk-contributing element. Geothermal sources are the primary contributors to health risks for all population groups. However, given that geothermal sources are natural and uncontrollable factors, and Cd is the major contributor to ecological risks, while As is the primary contributor to health risks, emphasis should be placed on controlling traffic sources.
The amalgamation of the APCS-MLR model and correlation analysis for source apportionment not only improves the precision of source identification but also quantifies the contribution of each HMs source to soil contamination, better determining the elements that should be prioritized for control. Additionally, introducing the Monte Carlo simulation into the health risk assessment facilitates probabilistic health risk evaluation, accurately identifying prominent health risk indicators to provide more reliable evidence for heavy metal pollution prevention and control. Based on measured HMs concentrations, the integration of APCS-MLR with health risk assessment establishes a source-oriented health risk assessment model, quantifying the contributions of various heavy metal sources to population health risks. This approach effectively determines the primary sources for control, enabling precise prevention and control of soil heavy metal pollution. However, because pollution sources vary by region, suitable pollutant source analysis techniques should be chosen on an individual basis. Therefore, to establish a more robust scientific foundation for HMs pollution control, further research and the exploration of more advanced methods are recommended.


