Article

Evolution of Water-Conducting Fracture in Weakly Cemented Strata in Response to Mining Activity: Insights from Experimental Investigation and Numerical Simulation

1
Kekegai Coal Mine Shaanxi Yanchang Petr Yulin Coal Chem Co., Yulin 719000, China
2
School of Mines, China University of Mining and Technology, Xuzhou 221116, China
3
MOE Key Laboratory of Deep Coal Resource Mining, China University of Mining and Technology, Xuzhou 221116, China
4
School of Civil and Surveying &Mapping Engineering, Jiangxi University of Science and Technology, Ganzhou 341000, China
5
School of Resources & Environment Engineering, Jiangxi University of Science and Technology, Ganzhou 341000, China
*
Author to whom correspondence should be addressed.
Water 2023, 15(23), 4173; https://doi.org/10.3390/w15234173
Submission received: 3 November 2023 / Revised: 19 November 2023 / Accepted: 1 December 2023 / Published: 2 December 2023

Abstract

:
The accurate prediction of the vertical extent of water-conducting fracture (WCF) zones in weakly cemented strata is particularly significant in preventing and controlling water hazards in western coal mines. The evolution of fractures in weakly cemented strata affected by mining disturbances was comprehensively analyzed by physical similarity models, numerical simulations, and field investigations. Results indicated that the development progress of water-conducting fractures can be divided into three phases: initial slow generation, subsequent rapid development, and eventual stabilization. The numerical simulation results revealed that in the initial stage of working face mining, the development of the plastic zone is limited, and there is minimal failure in the overlying strata; therefore, fractures are slowly produced without penetrating through the strata. When the plastic zone fully encompasses the entire main roof, it triggers severe shear failure in the overlying strata, resulting in rapid fracture propagation and penetration. Once the fracture height reaches a stable state, there is no further increase in the maximum vertical displacement of key strata, indicating the extensive collapse and compaction of the overburden as well as the stabilization of the fracture heights. A modified prediction equation for WCF in weakly cemented strata was obtained by correcting the traditional empirical formula based on field investigations. This modified prediction equation enhances the accuracy in predicting fracture heights and provides a theoretical reference to address the issue of the inaccurate prediction of the water-conducting fracture height in western mine rock strata.

1. Introduction

The overall layout of China’s coal resource development continues to be optimized, and the central and western regions possess significant advantages in terms of abundant resource allocation, excellent mining conditions, and low production costs [1] and have gradually developed into the emphasized center of China’s coal production, becoming increasingly prominent for its important role and strategic position. Currently, several mines have been established in the western mining region of China, primarily focusing on Jurassic and Chalk coal seams. This kind of strata is different from the coal-bearing strata in the central and eastern regions of China, as shown in Figure 1. The majority of them consist of loosely cemented strata with low mechanical strength, prone to disintegration and susceptible to slaking when exposed to water [2]. The shallow-buried ultra-thick coal seam in this area is highly susceptible to mining disturbance, leading to the formation of a roof water channel fracture zone that connects with the overlying aquifer [3]. This results in various ecological and production safety issues, including river diversion, groundwater depletion, a reduction in vegetation coverage rate, and mine water inflow [4,5]. Due to the impact of high-intensity coal mining, there is a significant and extensive range of rock fracture development and expansion in the western mining area. The previous empirical formula was established based on a substantial amount of measured data from the central and eastern mining areas, making it challenging to accurately calculate the height of WCF zones under weakly cemented rocks in the western mining area. The study of the evolution law of the WCF zone in weakly cemented rock and the optimization of the prediction formula to prevent mine water hazards are therefore highly significant in the western mining area.
Clarifying the mechanical properties of weakly cemented rock masses serves as the foundation for the study of fracture expansion in such geological formations, and it holds significant importance in exploring the failure characteristics of fracture structures within weakly cemented rock strata and uncovering the developmental patterns of water-conducting fracture zones. The red sandstone was examined to obtain its strength and deformation characteristics by a triaxial test system, revealing that tension–shear composite failure was the main failure form of the weakly cemented rock [6,7]. The failure mechanism of weakly cemented red sandstone under disturbance was analyzed based on scanning electron microscopy [8]. However, weakly cemented granular materials behaved nonlinearly regarding their bulk properties, and most micromechanical models cannot describe these characteristics [9,10]. From an energy perspective, the creep characteristics and energy evolution of weakly cemented rock were investigated through a triaxial graded loading creep test, while also revealing the energy dissipation theory-based energy evolution characteristics at each stage of creep [11]. The creep model is predominantly employed to characterize the creep behavior of loosely consolidated soft rock, which is limited by its inherent strength [12]. The non-Darcy hydraulic properties and deformation behaviors of such weakly cemented rock structures, like broken gauges, were studied through laboratory, theoretical, and in-situ aspects [13,14]. The long-term mechanical properties of a weakly cemented rock mass were also studied by carrying out creep tests under different initial confining pressures, and the creep behavior of the weakly cemented rock mass was further explained [15,16].
The fracture structure and failure mechanism of weakly cemented rock have been extensively investigated, as they play a crucial role in determining the ultimate fracture pattern based on the failure characteristics of the rock mass. The failure modes of rock masses with varying degrees of cementation strength differ, as strongly cemented rocks tend to fail in tension while weakly cemented rocks tend to fail in shear [17]. The failure of a weakly cemented rock mass encountering water is always accompanied by erosion and particle migration, so mass variation is the main factor to form the water-conducting channel [18]. A new proposed finite element method represents the variation in fracture between solid and jointed blocks, which also can be applied in weakly cemented porous media [19]. The adaptive neuro-fuzzy inference system has been proposed by some researchers as the most suitable approach to predicting the unconfined compressive strength of weakly cemented rocks and determining the failure modes of rock masses with low strength [20]. It is necessary to perform a comprehensive assessment of the response mechanism of weakly cemented stones under triaxial compression loading conditions, in order to ensure water-preserved mining and reflect the fact that the confined pressure is highly sensitive to the characteristics of the weakly cemented rock [21]. Despite the macroscale, a scanning electron microscope has been used to observe the composition and pore development [22]. The understanding of aquiclude responses to mining excavation is crucial in evaluating the reliability of water-conserved mining in a weakly cemented rock environment [23].
Scholars have conducted extensive research on the developmental laws of WCF zones under mining disturbances. The failure mechanism and fracture evolution law of weakly cemented rock under mining and excavation disturbances has been studied by investigating the stress distribution released by the roof rock mass induced by coal mining in both the vertical and horizontal directions, with a particular emphasis on monitoring displacement in these two directions [24]. A study of longwall mining-induced strata movement comprehensively considering the stress changes and fractures was conducted to reveal the displacement law of the overburden layer [25]. The subsidence of the ground surface is controlled by the deformation of the weakly cemented key strata. Therefore, the deformation characteristics of the weakly cemented rock mass under this loading condition play a crucial role in determining the efficiency in controlling strata movement and surface subsidence [26]. The phenomenon of water-conducting fractures is closely associated with water hazards. By studying the movement of aquifer layers, we can enhance our understanding of the mechanisms and processes involved in water inrushes from underlying confined aquifers. This knowledge will be invaluable in predicting and preventing water inrush hazards in practical applications [27]. The prediction of the WCF height is traditionally based on empirical formulas derived from single-slice mining conditions, where the mining height is less than 3 m and the total slice mining height is limited to within 15 m [28]. Moreover, related research has indicated that the excavation speed has a great influence on the damage of the overburden rock layers, so the possibility of rock layer disasters should be considered when conducting underground mining activities [29,30]. The key to maintaining the stability of the surrounding rock lies in gaining insights into the roadway layout through coal seam and cross-layer excavation, as well as deepening our understanding of the deformation mechanism of weakly cemented rock [31,32]. Previous research has indicated that the key strata layer is vital to controlling the height of the WCF zone [33].
The previous research has primarily focused on the mechanical properties, failure behavior, and dynamic migration laws of weakly cemented rock masses. However, there has been insufficient mention of the evolutionary laws pertaining to WCF zones within weakly cemented rock strata. The development and evolution characteristics of the WCF zone in weakly cemented overlying rock during comprehensive mechanized top-caving coal mining were analyzed using a combination of physical similarity model testing and numerical simulation methods. Furthermore, based on the results of field measurements, the empirical prediction formula has been modified to enhance its accuracy when applied in weakly cemented rock layers. This provides a theoretical reference for the prediction and prevention of water inflow in mining area roof aquifers and the protection of water resources.

2. Weakly Cemented Characteristics

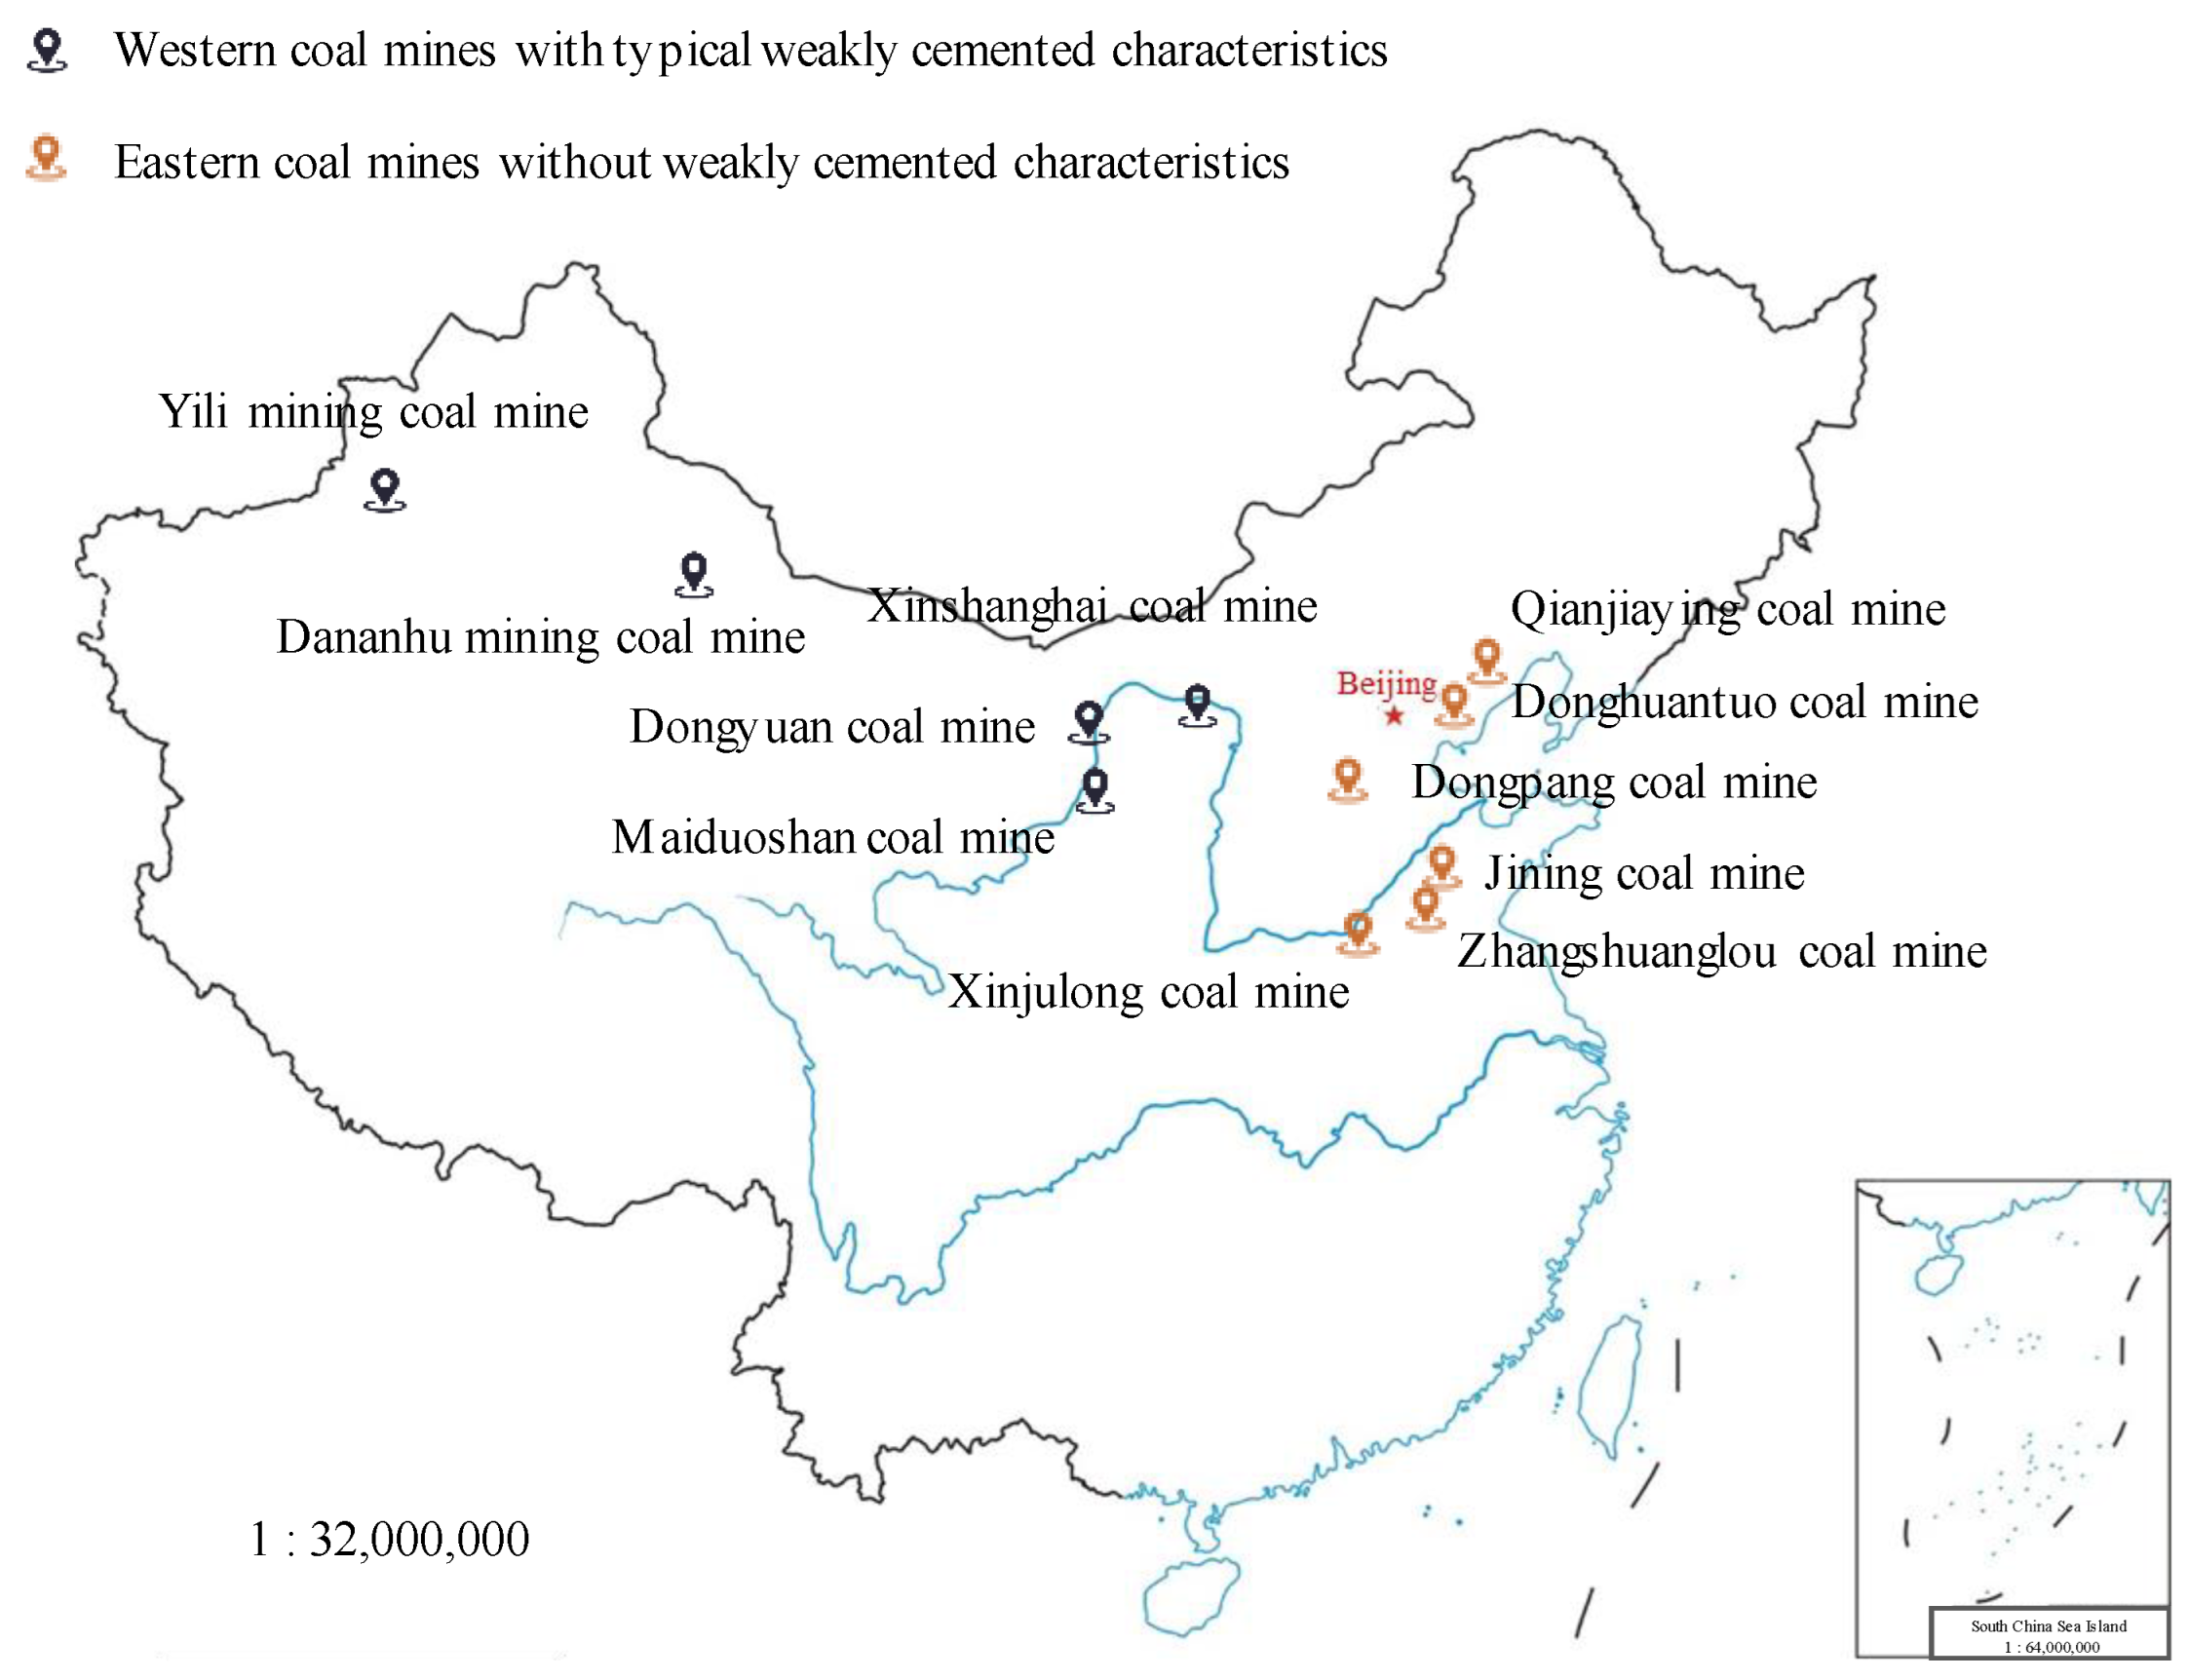
2.1. Geological Characteristics of the Mining Area

The mine was specifically designed for an inclined shaft, and the working face utilizes the comprehensive caving coal mining technique. The structure of the coal seam in the mining area is simple, where the rock layers show obvious weakly cemented characteristics. The main roof is fine sandstone, while the immediate roof consists of a combination of siltstone and fine sandstone. The development of internal joint cracks is absent in a portion of the roof, while the compressive strength of both the roof and floor rock significantly deteriorates under saturated conditions. The water resistance of the rock layer is poor due to the high permeability of mudstones and argillaceous siltstones, which makes them susceptible to water softening. The comprehensive column diagram of the mine is shown in Figure 2.
The coalfield contains four aquifers, and the indirect water-filled aquifer within the coal seam exhibits high permeability due to the development of internal pores and cracks, thus qualifying as a weak but water-rich aquifer. The sandstone aquifer in the coal seam roof contains void cracks and the distance between the aquifer and the roof is 20.82~28.81 m, with an average distance of 23.47 m.

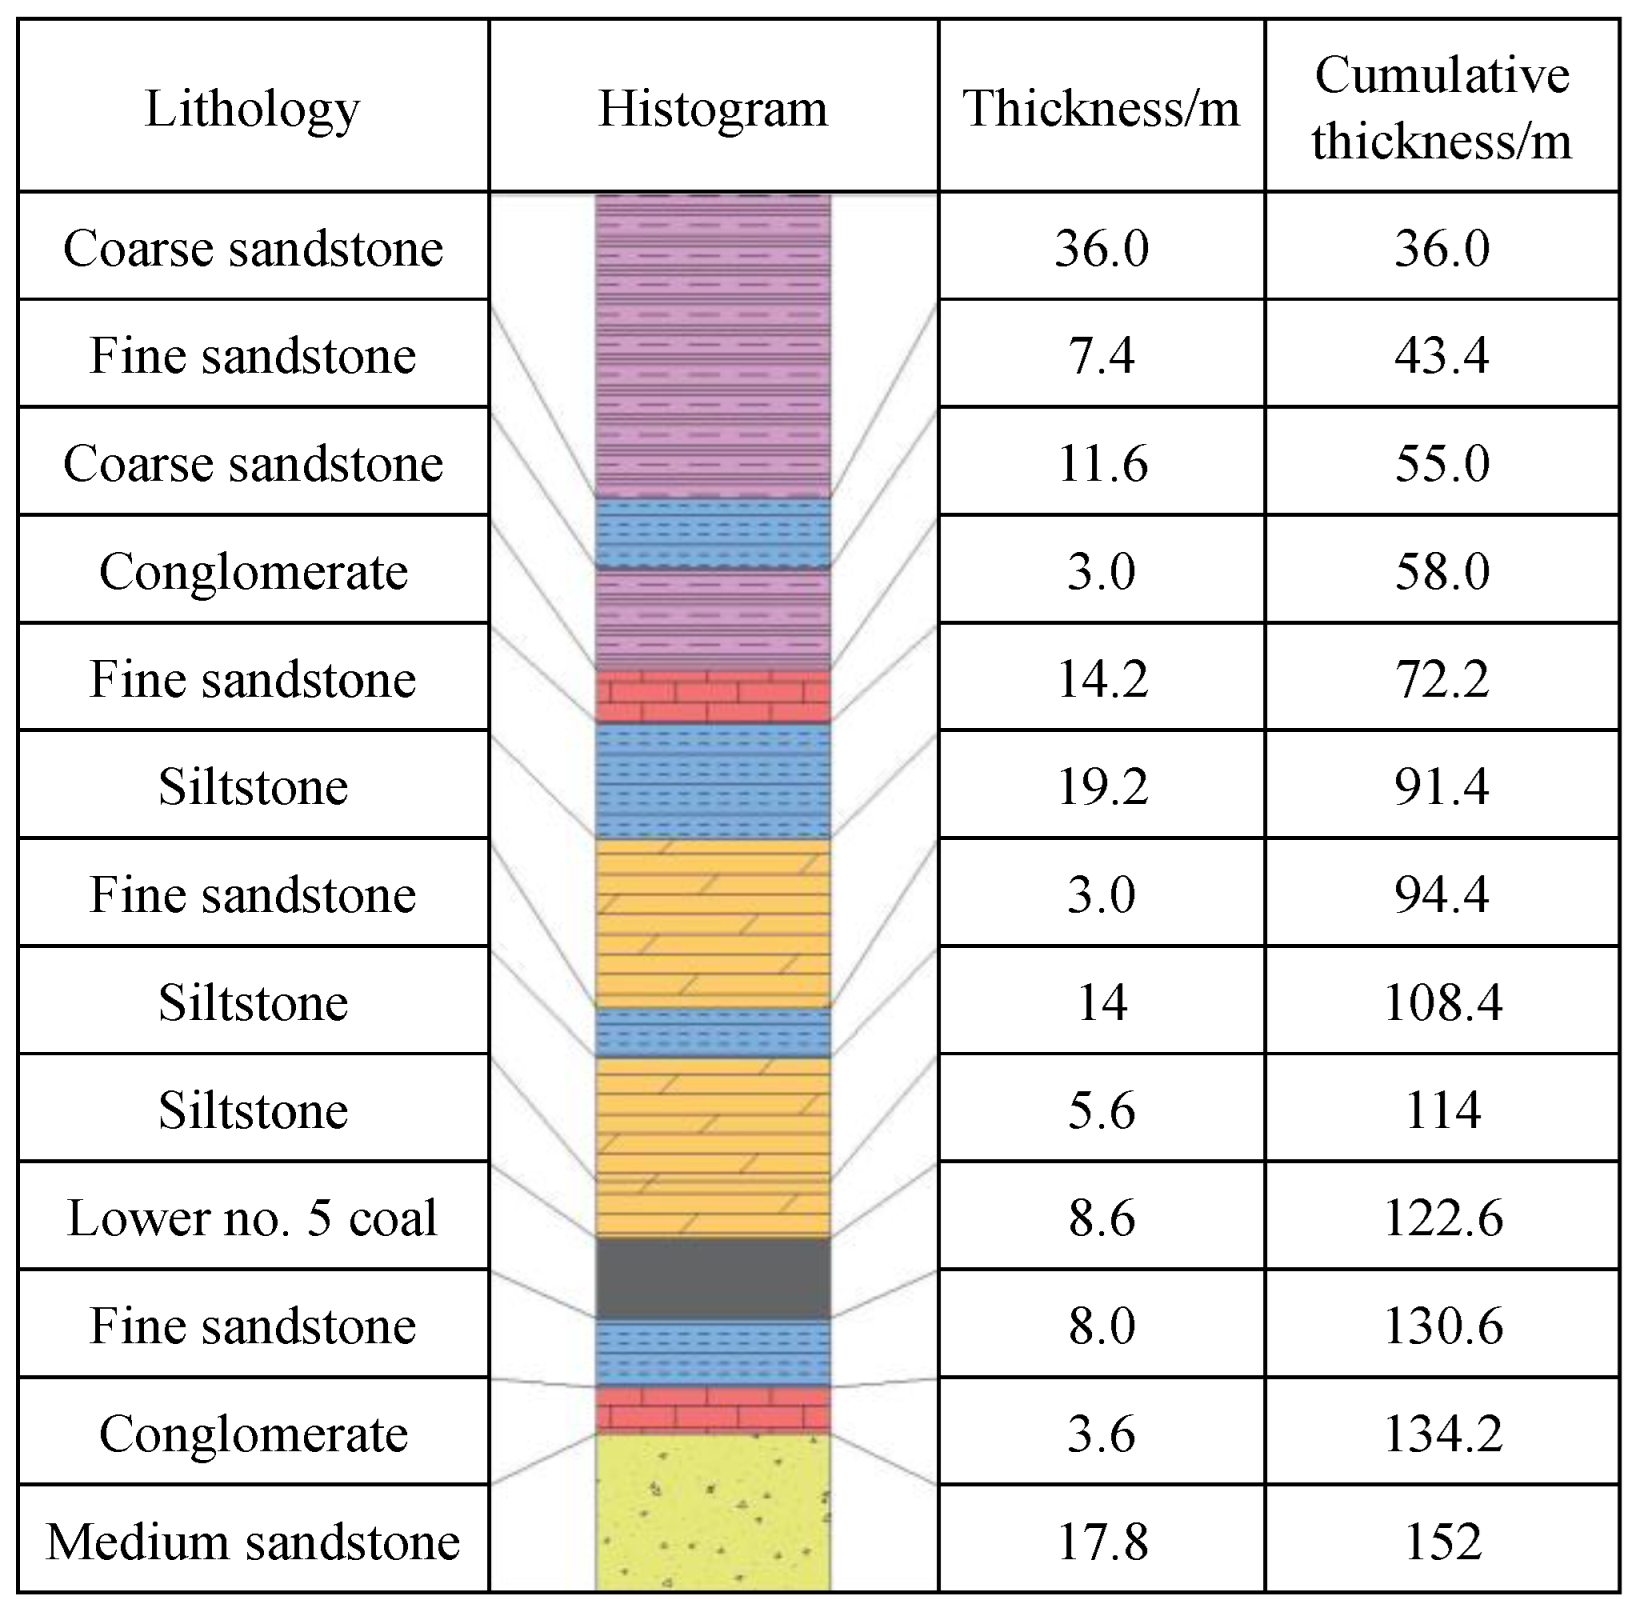
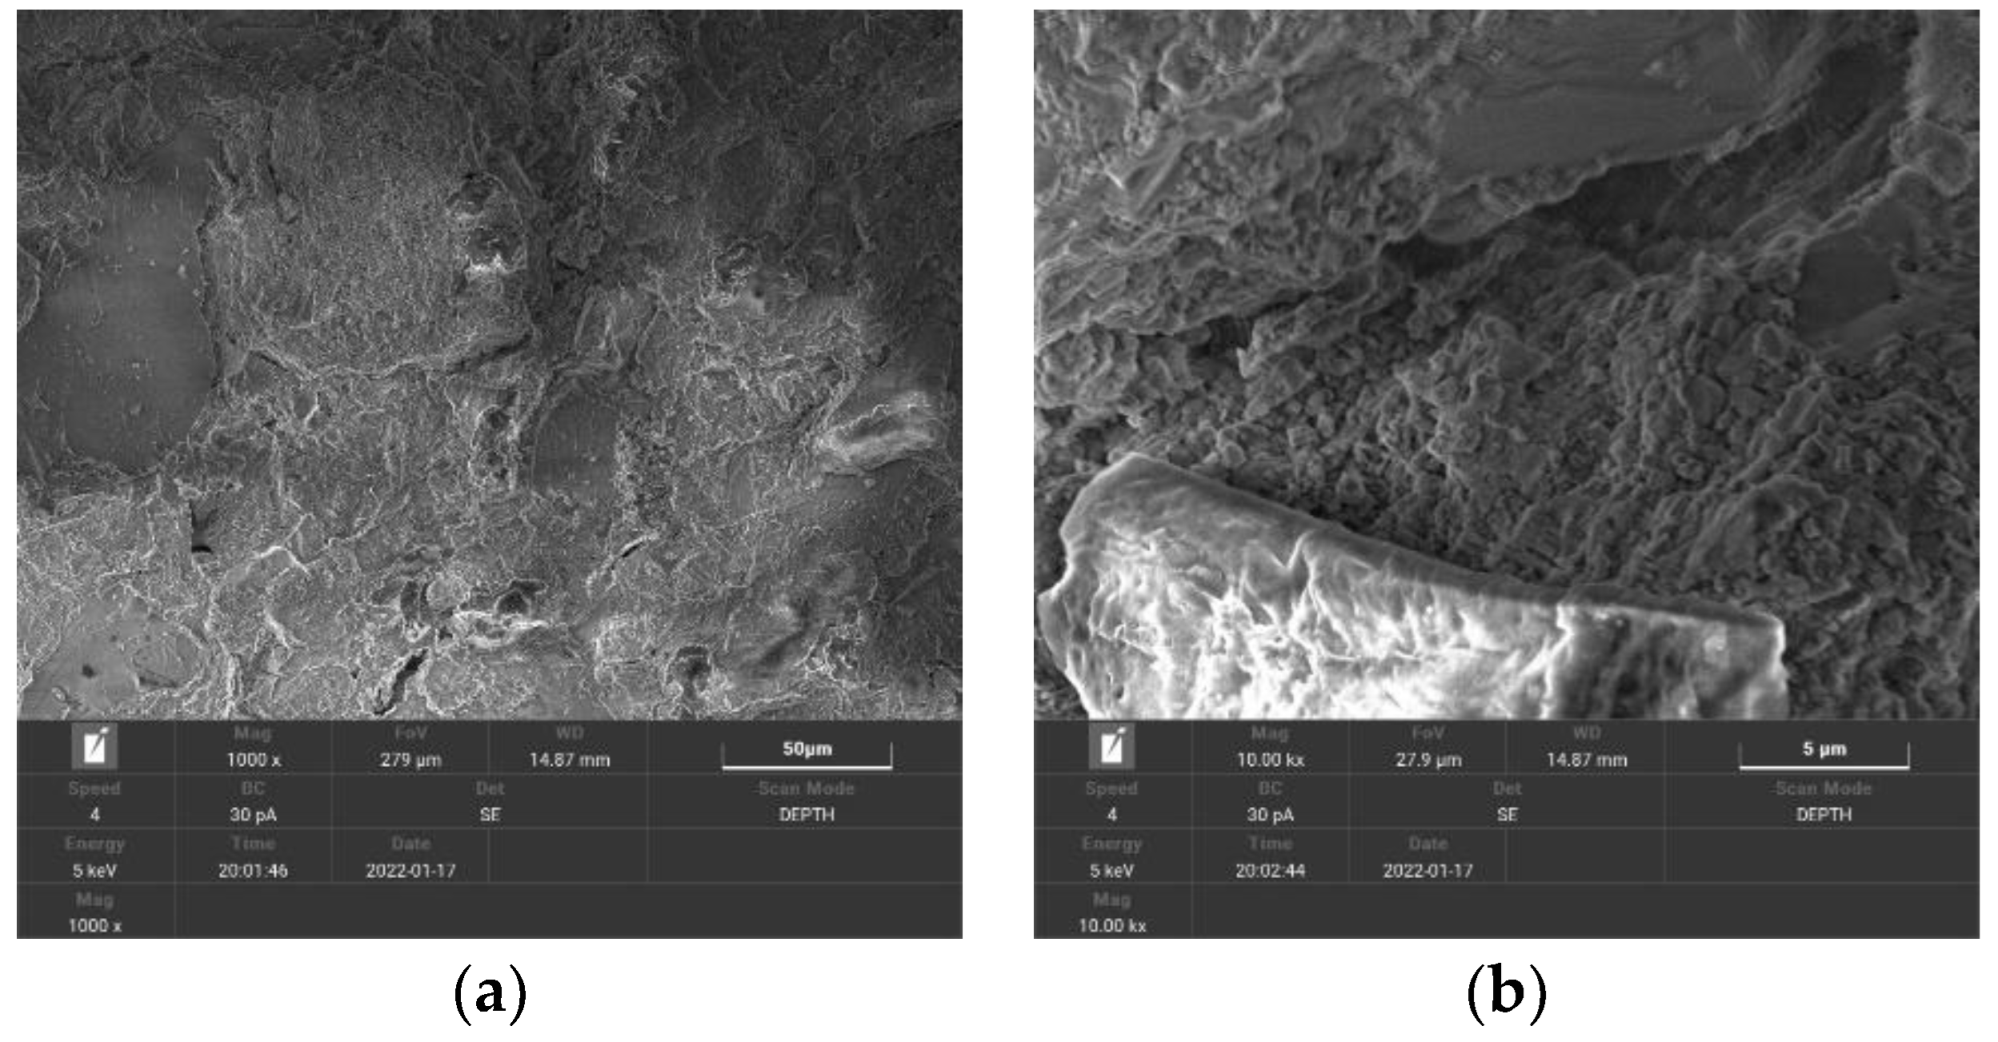
2.2. Weakly Cemented Characteristics of Key Strata

The samples of weakly consolidated siltstone were obtained from the coalmine and scanning electron microscopy was carried out with a field emission scanning electron microscope. The microscopic structure characteristics of the weakly consolidated siltstone amplified by 1000 and 10,000 times were observed. The observation results are shown in Figure 3.
According to the scanning results of the electron microscope, various degrees of surface cracks and internal granular cracks are observed in the weakly cemented siltstone at a magnification of 1000 times.
By magnifying the internal crack to a scale of 10,000 times, the obviously layered and stacked surface of the siltstone, accompanied by different sizes of particles arranged loosely and disordered, could be observed. The microstructure of the weakly cemented siltstone displayed by electron microscopy reflected the development of the pore size of the overlying rock and the arrangement of rock particles in the mining area, which further verified the weakly cemented characteristics of the key layer of siltstone.

3. Physically Similar Simulation of the Development of Water-Conducting Fracture Zone

3.1. Similar Simulation Test Design

Based on the occurrence conditions of the coal seam in the mine and utilizing the mechanical parameters obtained from both field investigations and laboratory tests of coal and rock, and considering the similarity criterion, a physical similarity simulation test platform of 2.5 m × 0.3 m × 1.5 m was created to carry out this test, and the laying was conducted according to the sequence and height of the rock strata in Figure 1.
  • According to the physically similar simulation criteria and the calculation formula, the geometric similarity ratio was determined to be 100:1.
  • Material selection and proportions. Sand with an average particle size between 0.25 and 0.35 mm, gypsum, and calcium carbonate were selected to simulate the rock layer, and mica powder was used to separate the layers.
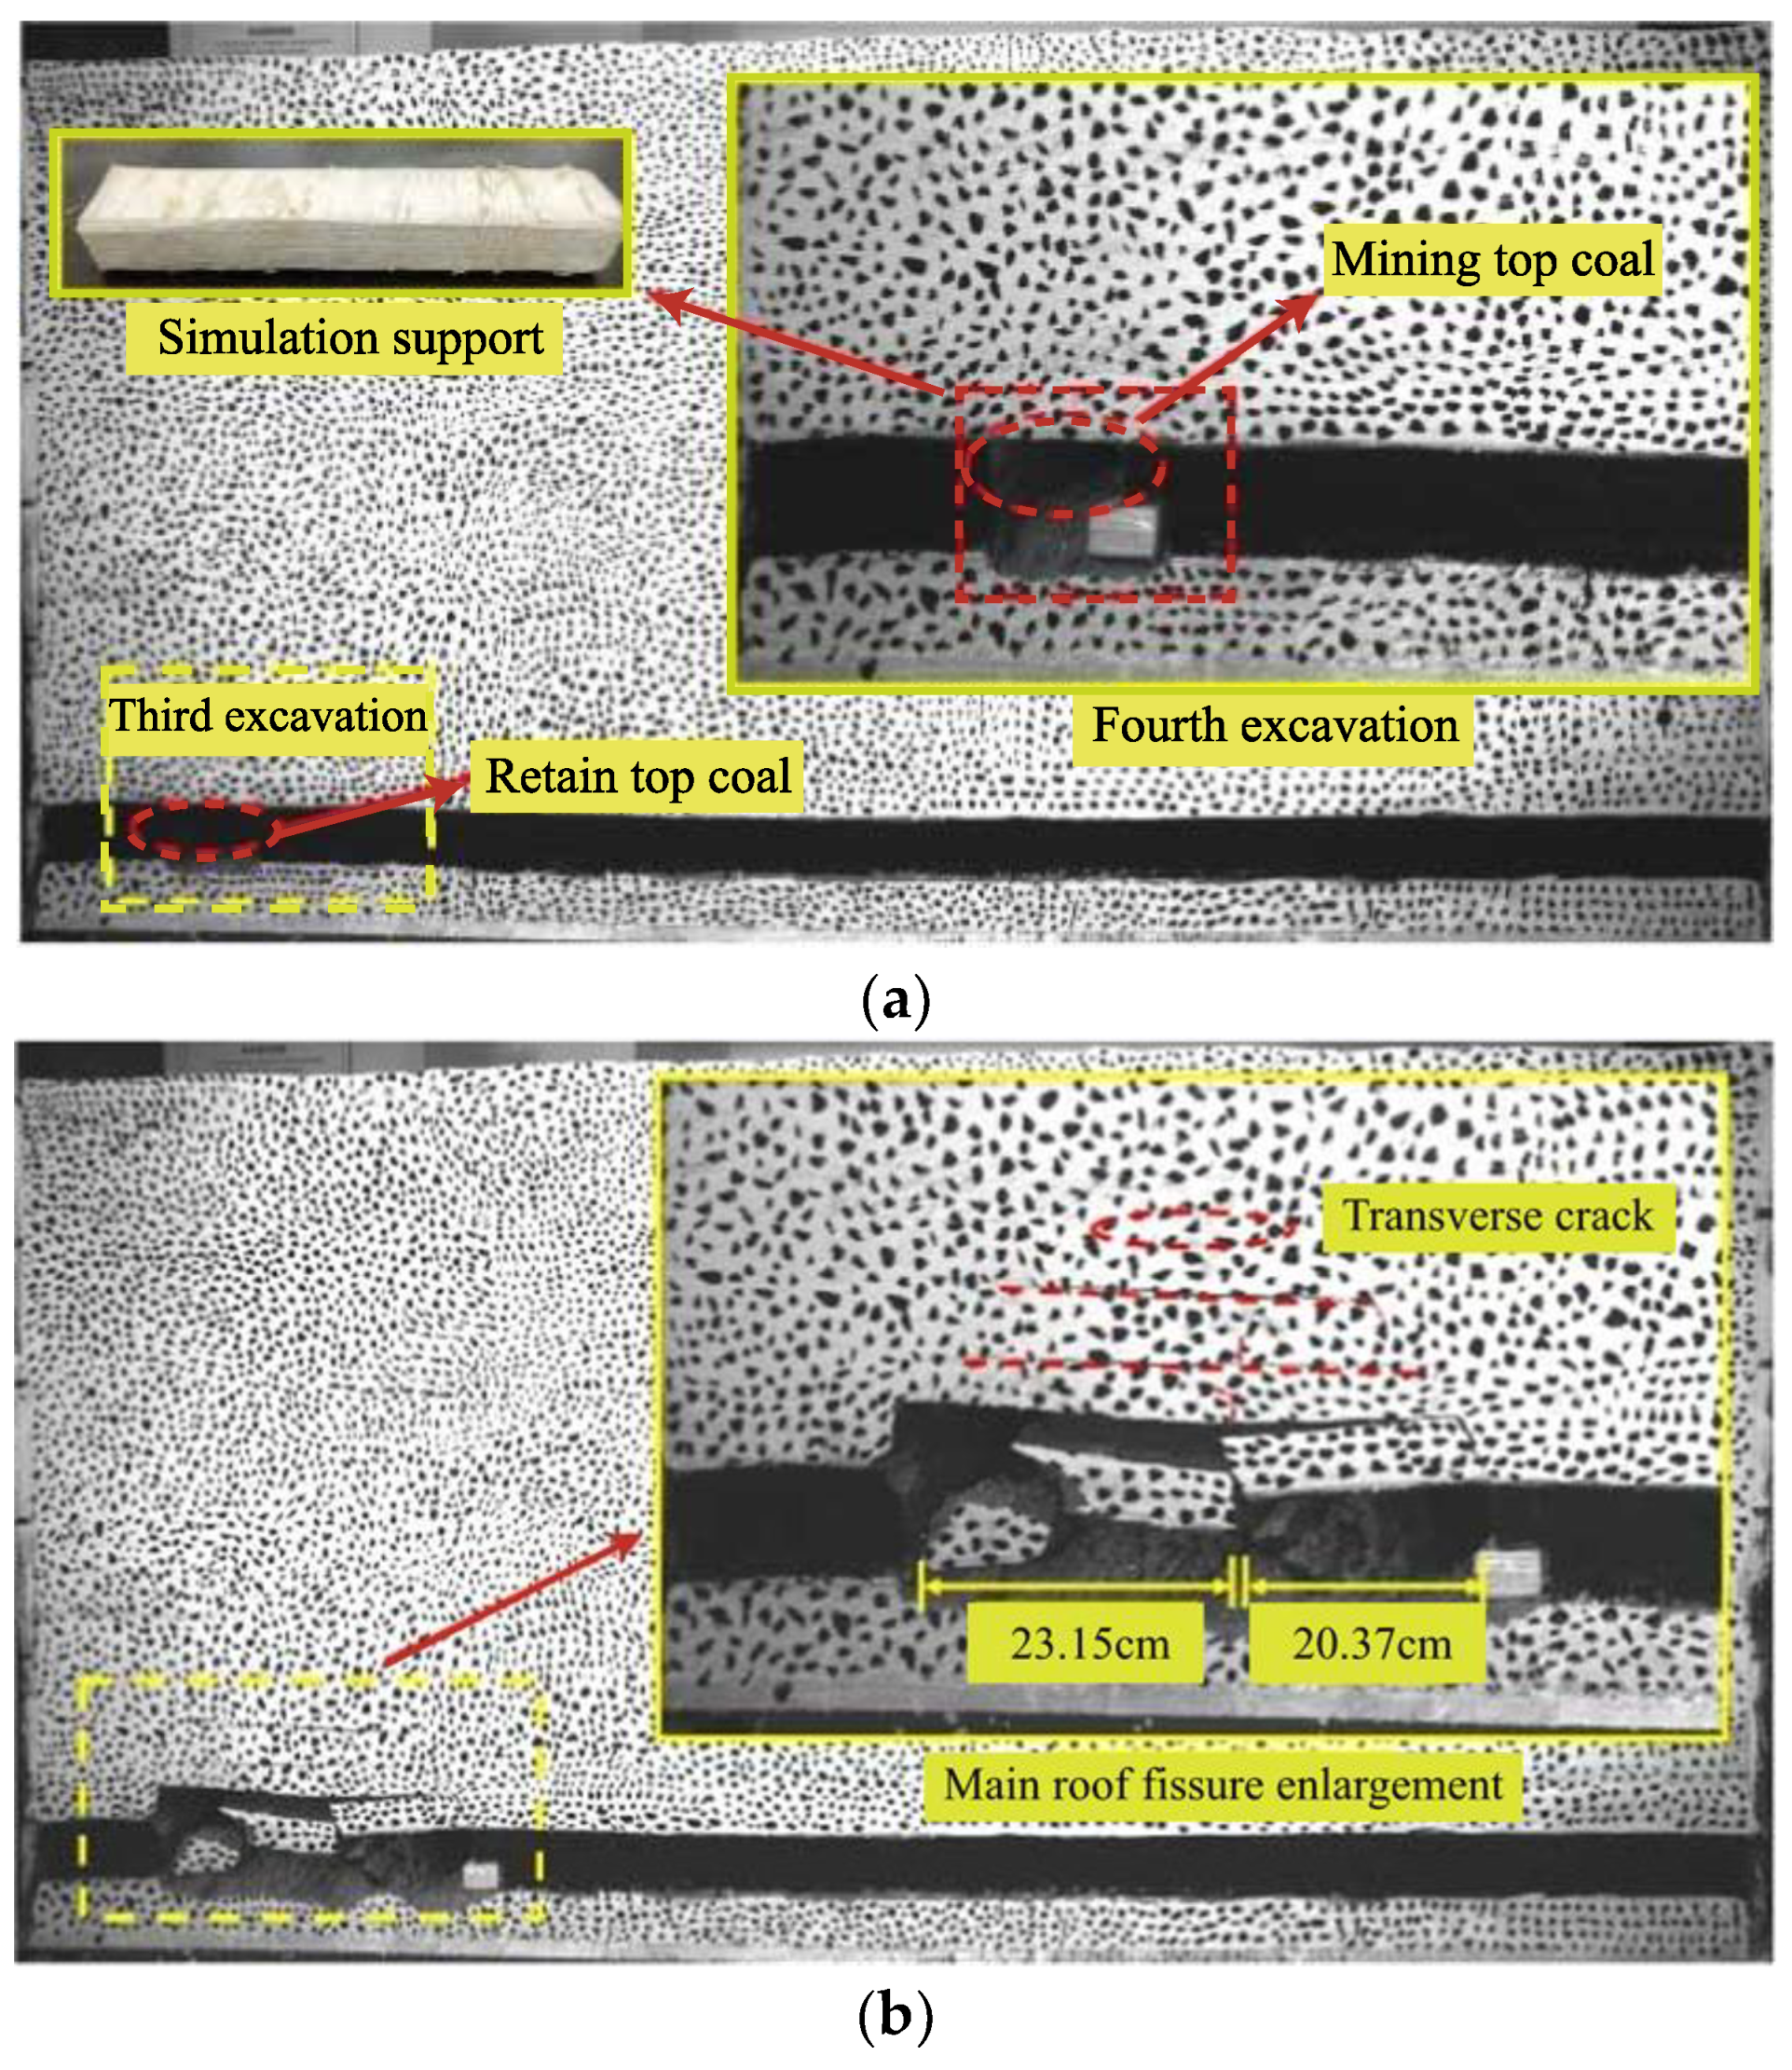
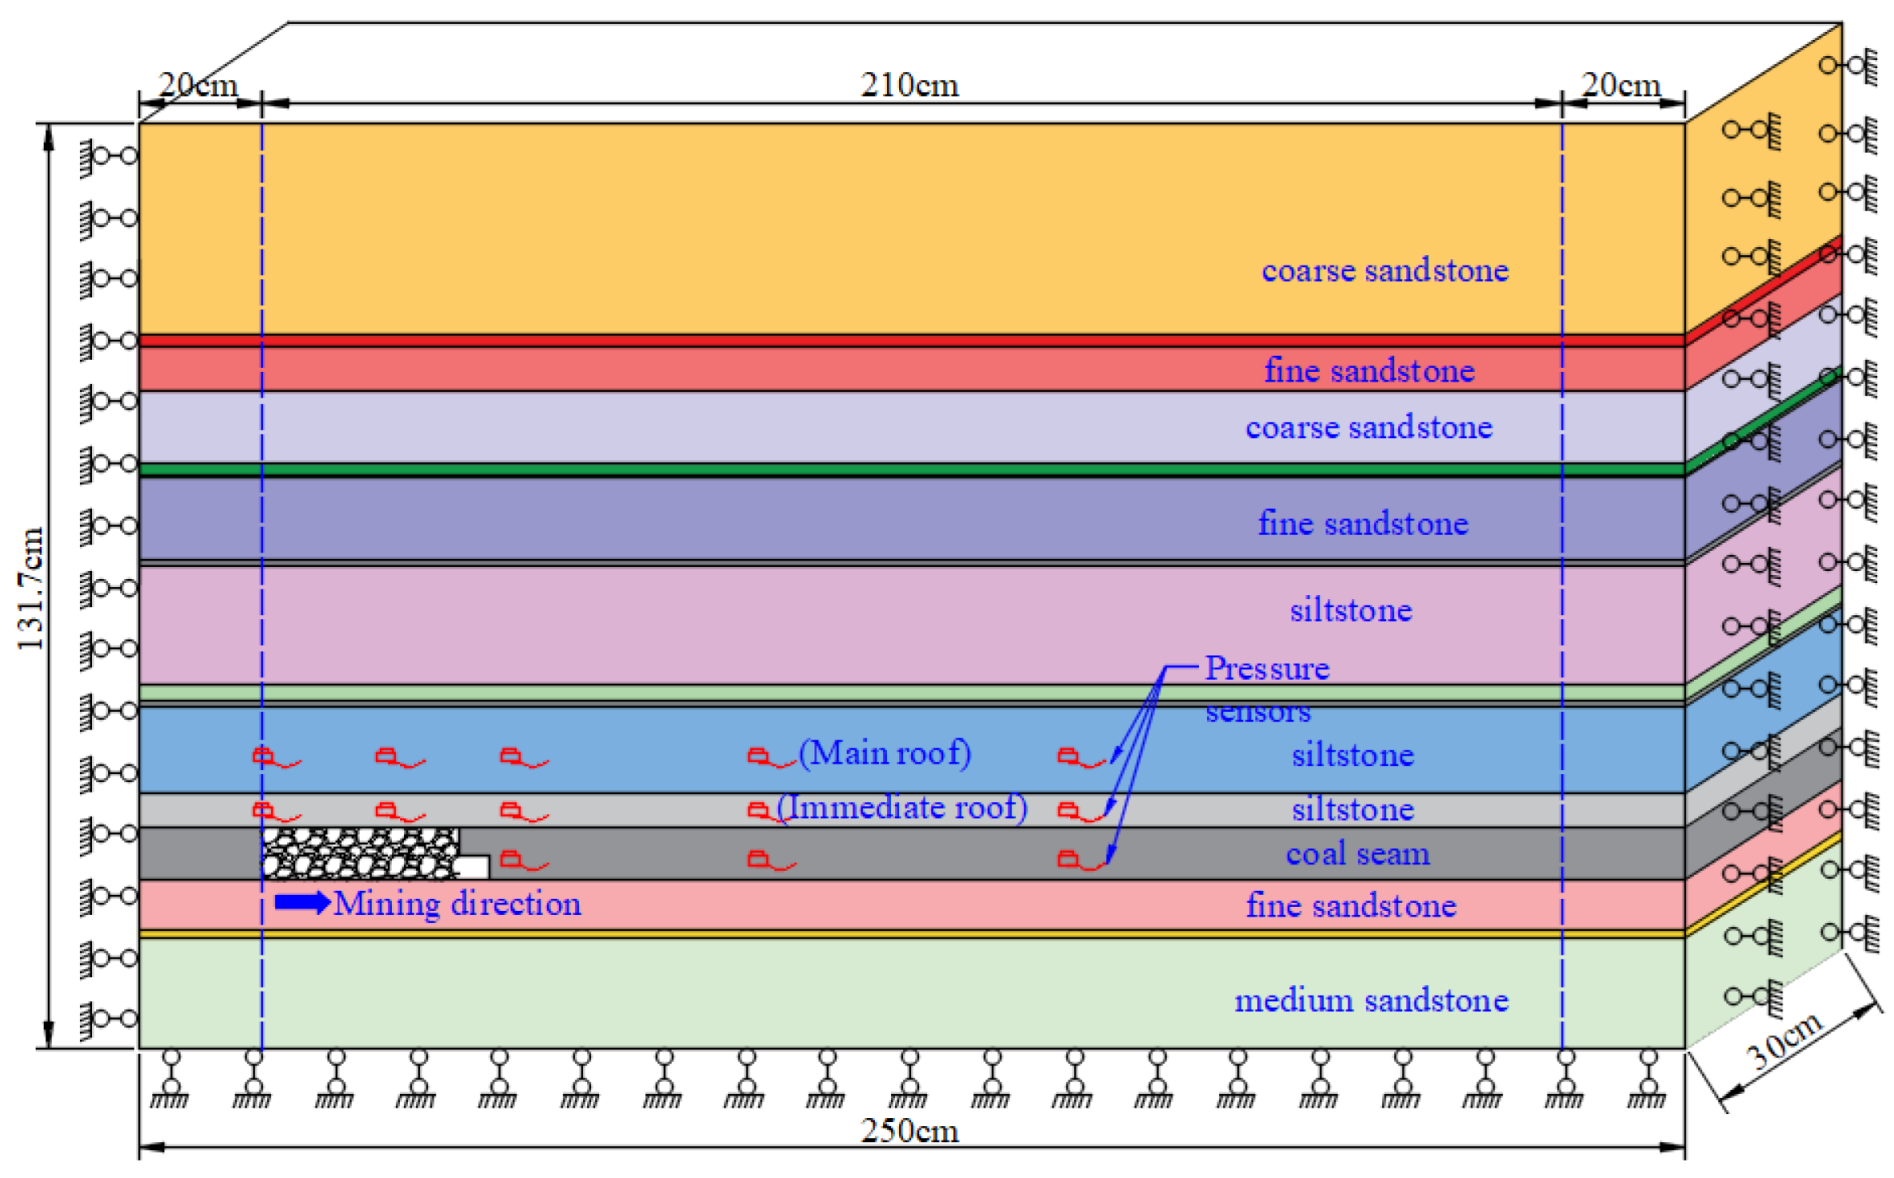
  • Excavation methods. The overall length and height of the model were 250 cm and 131.7 cm, respectively, and a protective coal pillar of 20 cm was reserved on both sides. The bottom coal layer with a thickness of 4 cm was excavated first, and then the bottom coal layer of the next step was excavated, and the top coal layer with a thickness of 4.6 cm in the previous step was excavated at intervals of half an hour after moving the shield. The model diagram is depicted in Figure 4.
  • Arrangement of the observation lines. The displacement of the overlying strata during the excavation process was monitored by a remote full-scene strain testing system to analyze the extended height of the WCF.

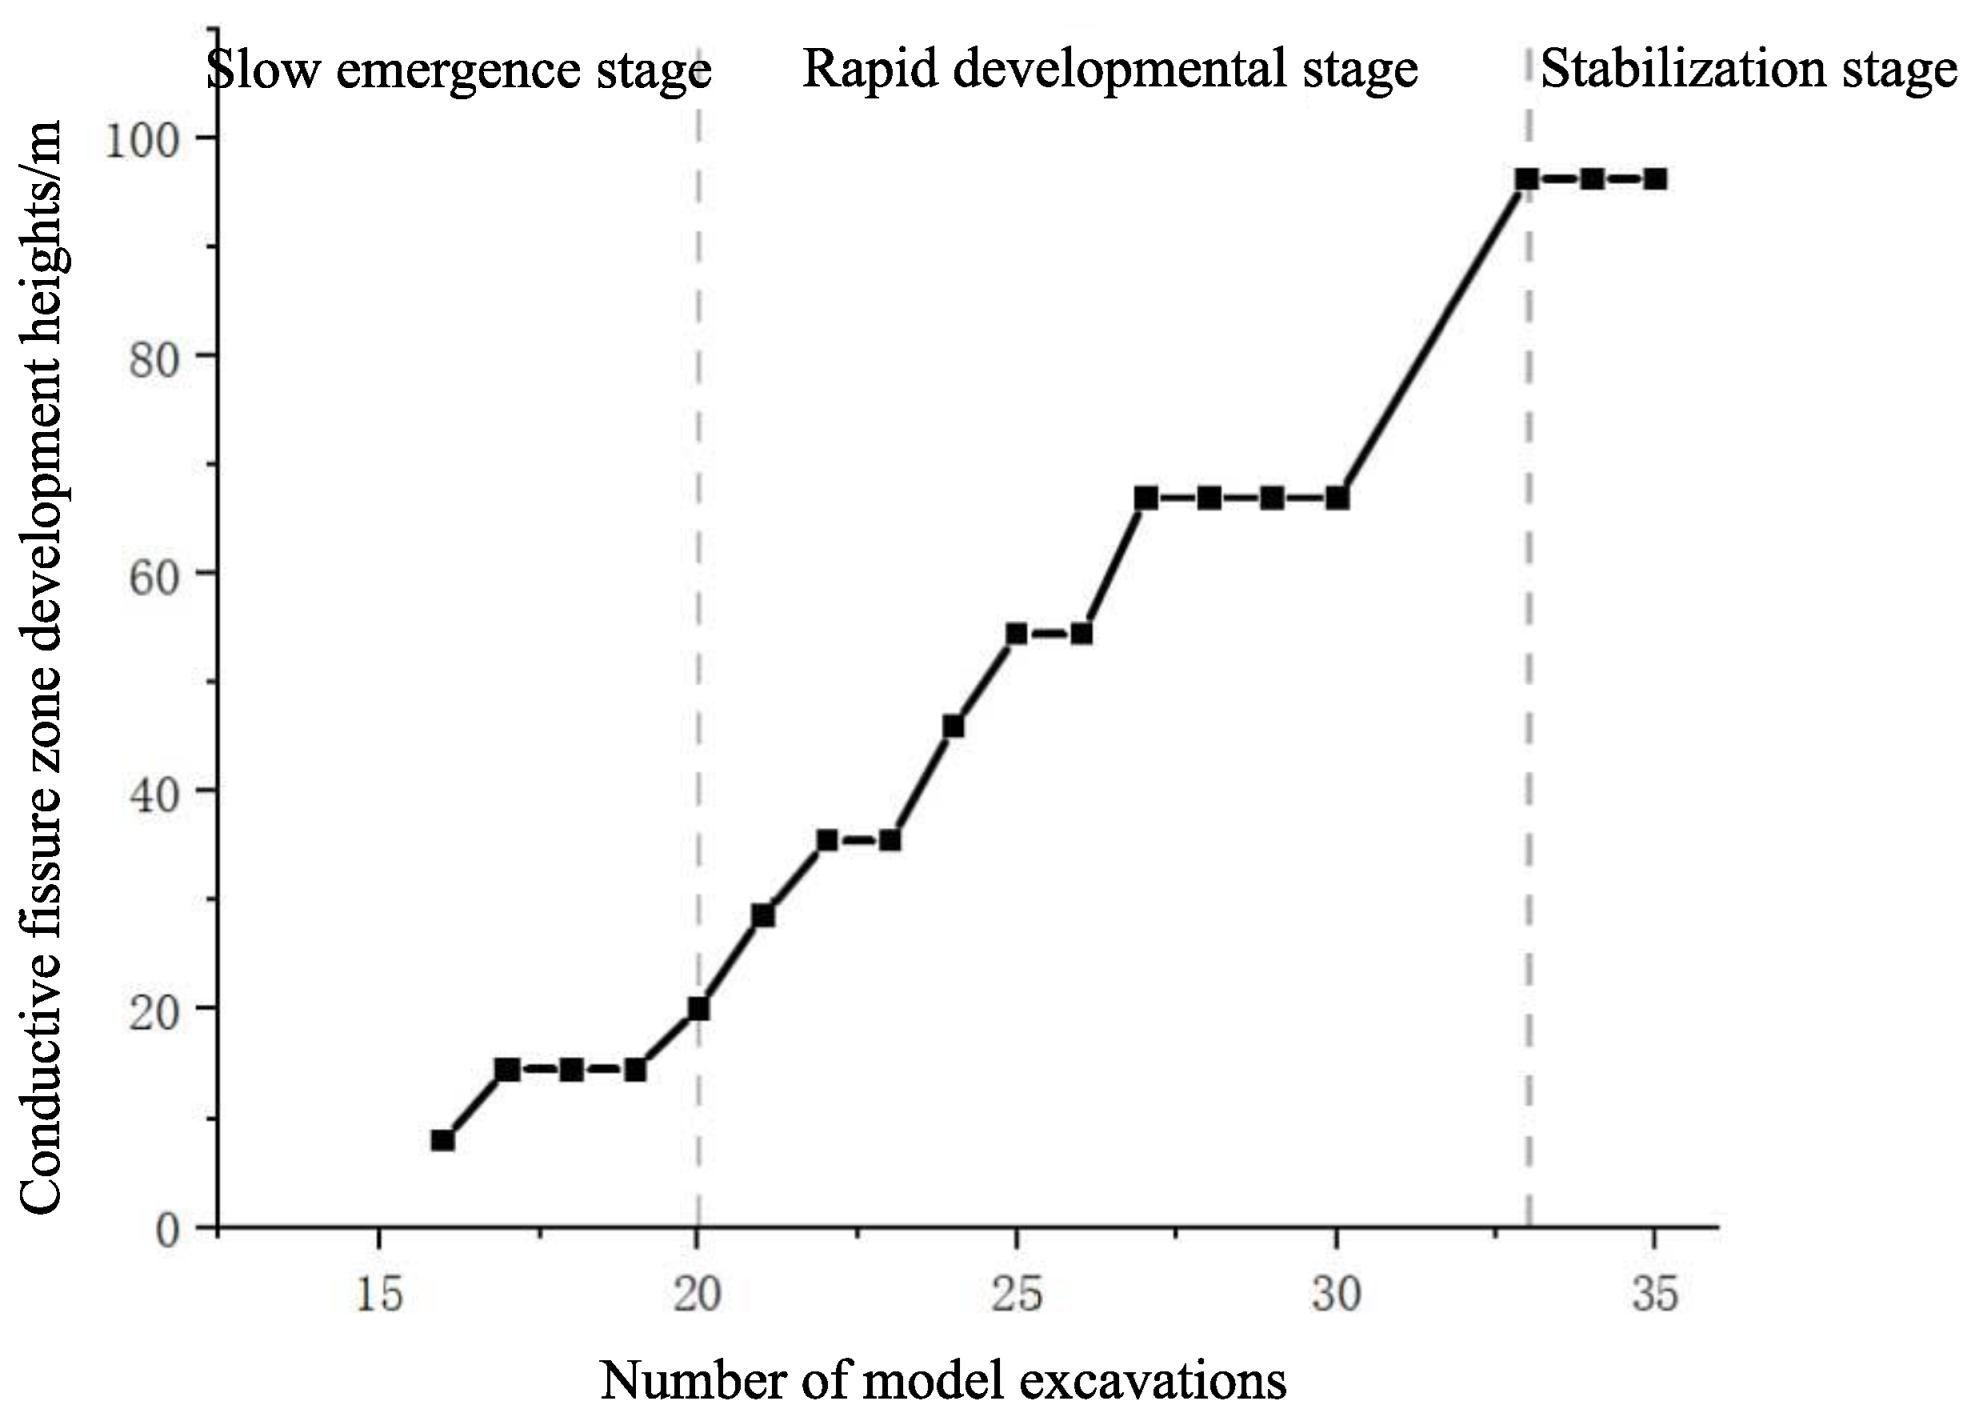
3.2. Analysis of the Results of Physical Similarity Simulation

The caving of the immediate roof is shown in Figure 5. The immediate roof collapsed at the 6th and 10th excavations, respectively; however, cracks did not develop in the overlying rock during the collapse. Small transverse cracks occurred in the basic roof, and a cantilever beam structure formed at the goaf side after the 16th excavation. In the process of the 17th excavation, the original cracks further expanded, and longitudinal shear fissures appeared with the collapse of the roof. After the third collapse of the roof, the microfractures generated in the main roof strata further developed into obvious fractures. Longitudinal cracks were also produced in the middle of the rock, but the cracks did not penetrate the entire main roof rock layer and could not conduct water.
The development process of water-conducting cracks in the main roof is shown in Figure 6. The initial collapse of the main roof occurred during the 20th release of coal, with a maximum subsidence height of 14.5 cm from the coal seam, while no expansion was observed in the fracture of the overlying rock layer. The second collapse of the main roof occurred during the 24th excavation, resulting in an increase of 3 cm in the caving height. Additionally, the crack extended to a distance of 46 cm from the coal seam. Meanwhile, a portion of the immediate roof remained cantilevered, creating a separation space between it and the main roof. The immediate roof underwent bending and rotation, while the main roof gradually sank and compacted.
During the 17th to 25th advances of the working face, the main roof caved twice, with an average caving step distance of 22.4 cm. A large-scale failure and caving occurred at the main roof, which was located 48 cm away from the coal seam. After the 27th excavation, a separation layer with a maximum distance of 4 cm appeared above the rock layer after collapse. The WCF zone extended up to 67 cm above the coal seam, while the transverse fracture of the underlying stratum extended towards the working face. The WCF zone developed up to 67 cm above the coal seam, and the transverse fracture of the overlying stratum extended beyond the working face. The immediate roof collapsed and the main roof caved a third time after the 30th excavation; the longitudinal fracture penetrated through the main roof and tended to be water-conducted.
The results indicated that the average step distance of the four collapses was 23.2 cm. Additionally, the WCF was extended to seal off the weakly cemented key layer, resulting in a height of 48 cm. The weakly cemented key layer developed a separation layer, which represents the potential development area for WCF zones. Therefore, further investigation is required to determine the final height of the developed WCF zone based on the collapse behavior of the weakly cemented key layer. The overburden fracture process of the weakly cemented key layer is shown in Figure 7.
The weakly cemented key layer experienced its initial failure during the 33rd excavation process, with a breaking distance of 92.6 cm from the coal seam. The separation layer resulting from the third roof collapse was compressed and sealed off. The rock stratum exhibited an increased collapse height of 3.7 cm upon coal extraction, presenting an overall failure shape resembling a trapezoid.
The immediate roof and main roof fully collapsed after the 38th excavation, while the weakly commented key layer and overlying strata exhibited slight bending and sinking without the occurrence of any new cracks. During the 33rd~37th advances of the working face, a single occurrence of fracture and collapse was observed in the weakly cemented key layer and overlying strata. The resulting fracture extended up to a distance of 96.3 cm from the coal seam, indicating that the determined final height of the WCF zone in weakly cemented rock through physical simulation was 96.3 m. The height variation of the WCF is shown in Figure 8.
It can be observed that the height of the WCF zone exhibited an upward trend and finally stabilized at a peak value. The overall development process can be divided into three stages: initial slow generation, subsequent rapid development, and eventual stabilization.

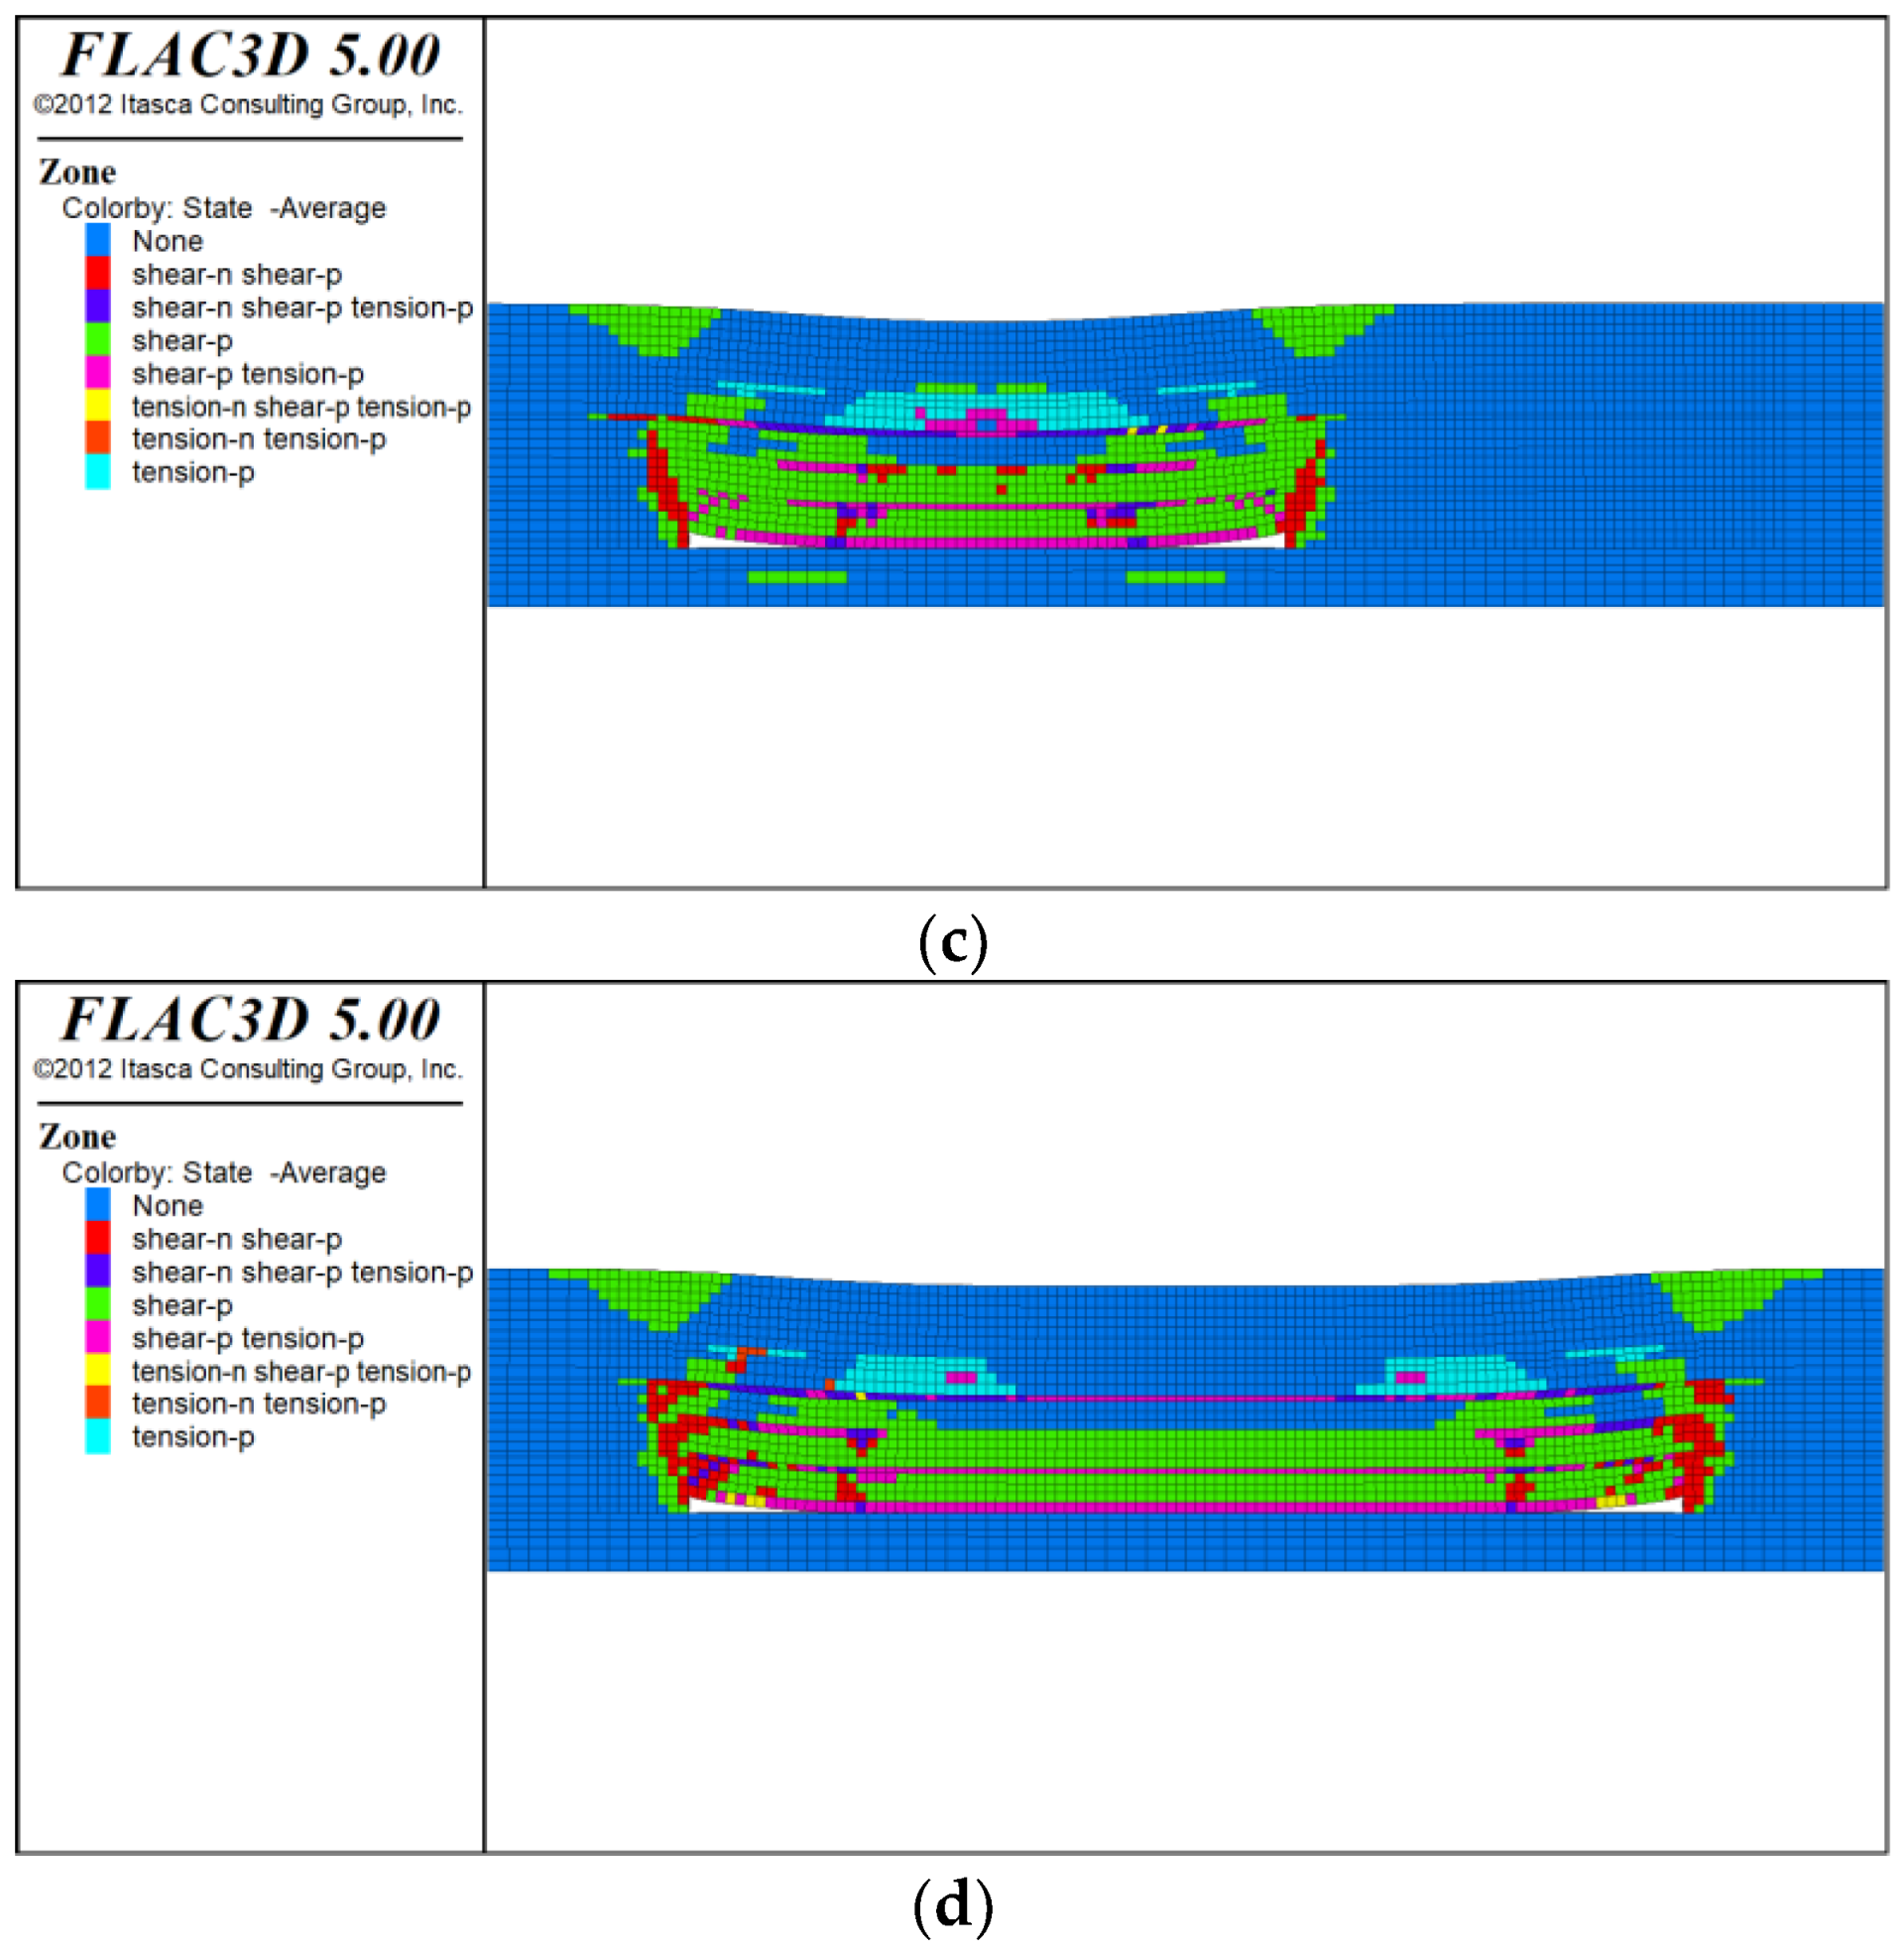
4. Numerical Simulation of Development of Water-Conducting Fracture Zone

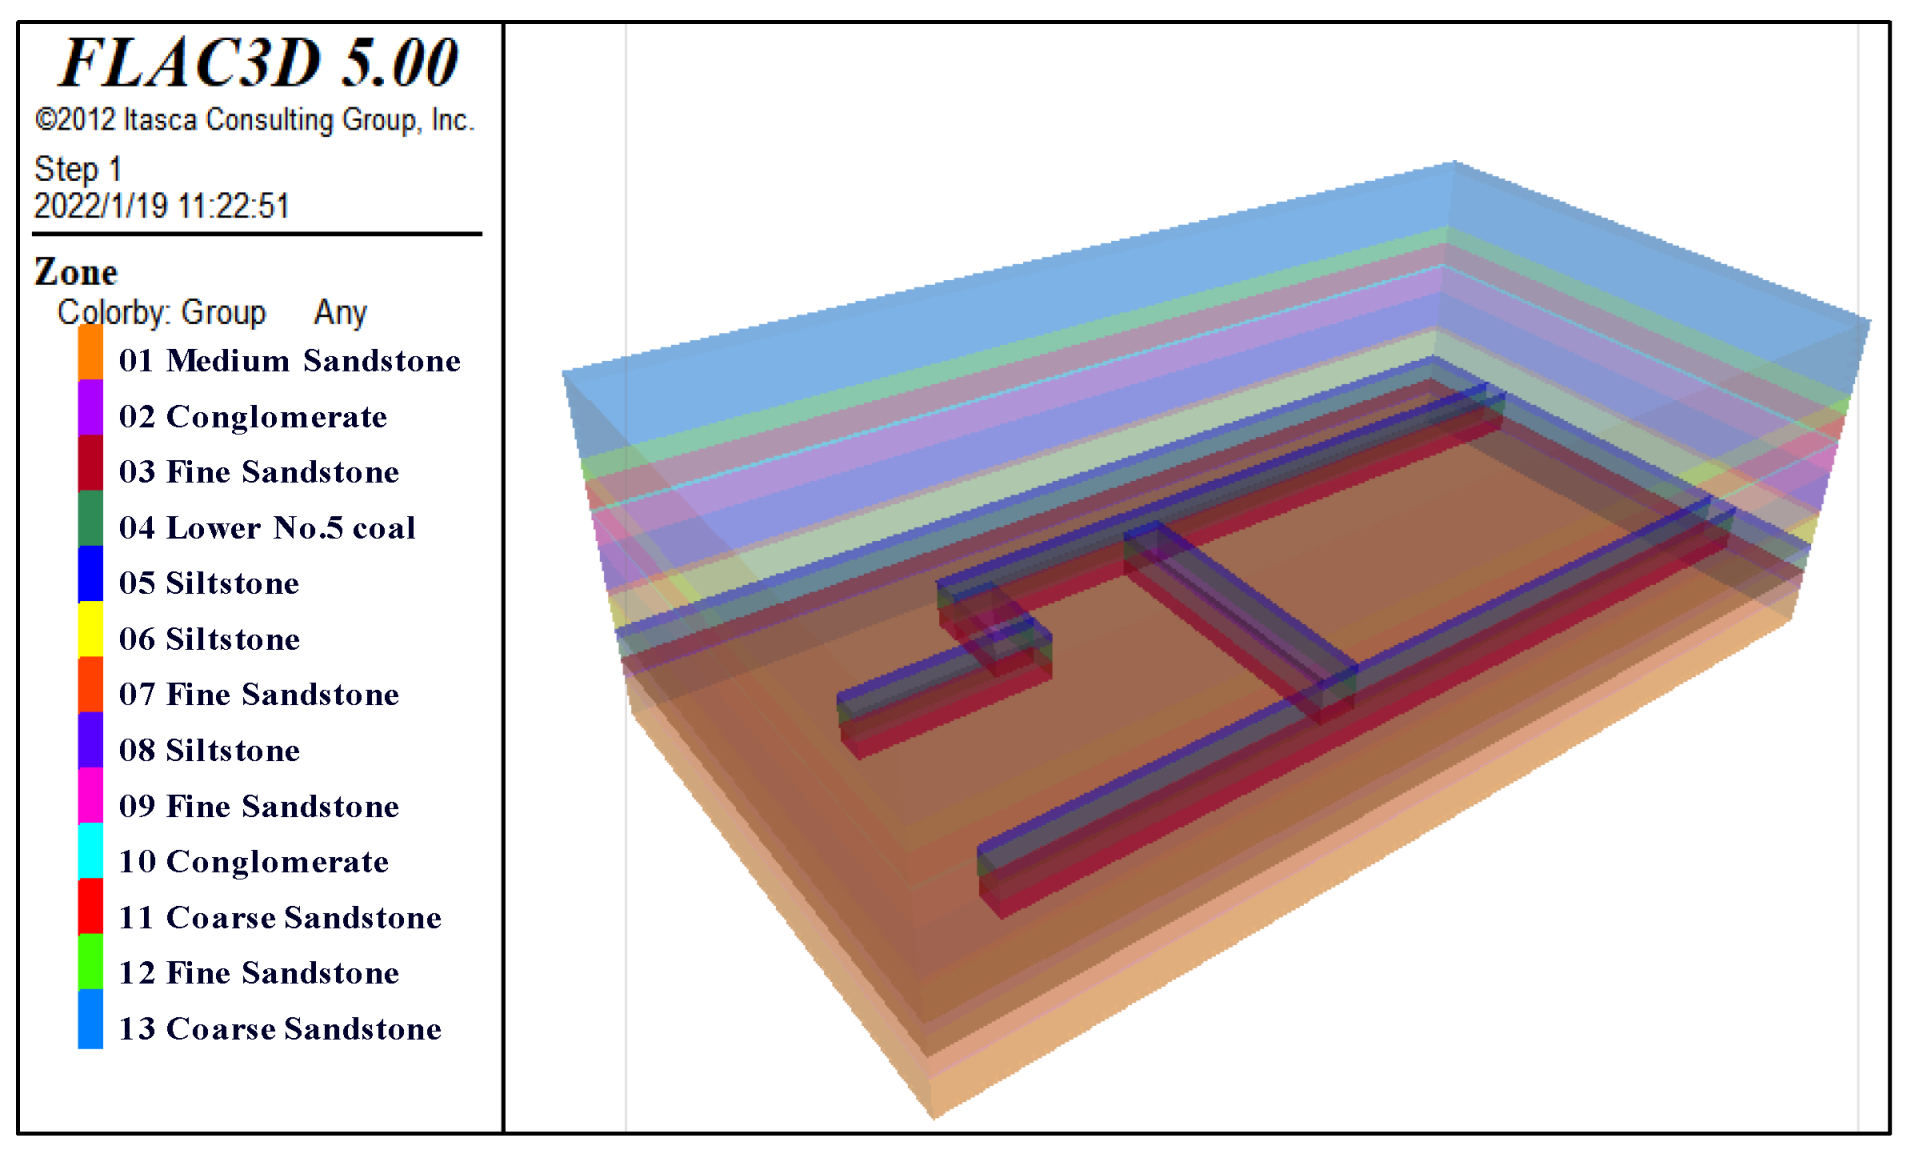
4.1. Model Establishment

Flac3D was used to simulate the fracture development law of the overlying strata in the process of advancing the working face, and then the evolution law of the WCF zone in the process of mining was analyzed. A three-dimensional mesh model with a length × width × height of 700 m × 360 m × 152.3 m was established considering the rock mechanic characteristics and actual construction conditions. Considering the boundary effect, a 100 m coal pillar was reserved on both sides of the advancing direction of the working face, and the initial length of the working face was 105 m, which was increased to 155 m after advancing 65 m, and stopped at the protection coal pillar. The model diagram is shown in Figure 9.
The distribution of the plastic zone in the overburden rock layer at advancing distances of 100 m, 150 m, 300 m, and 500 m was investigated. The displacement and stress changes at the location of the measuring point were extracted to comprehensively analyze the development characteristics of the water-conducting fractures.

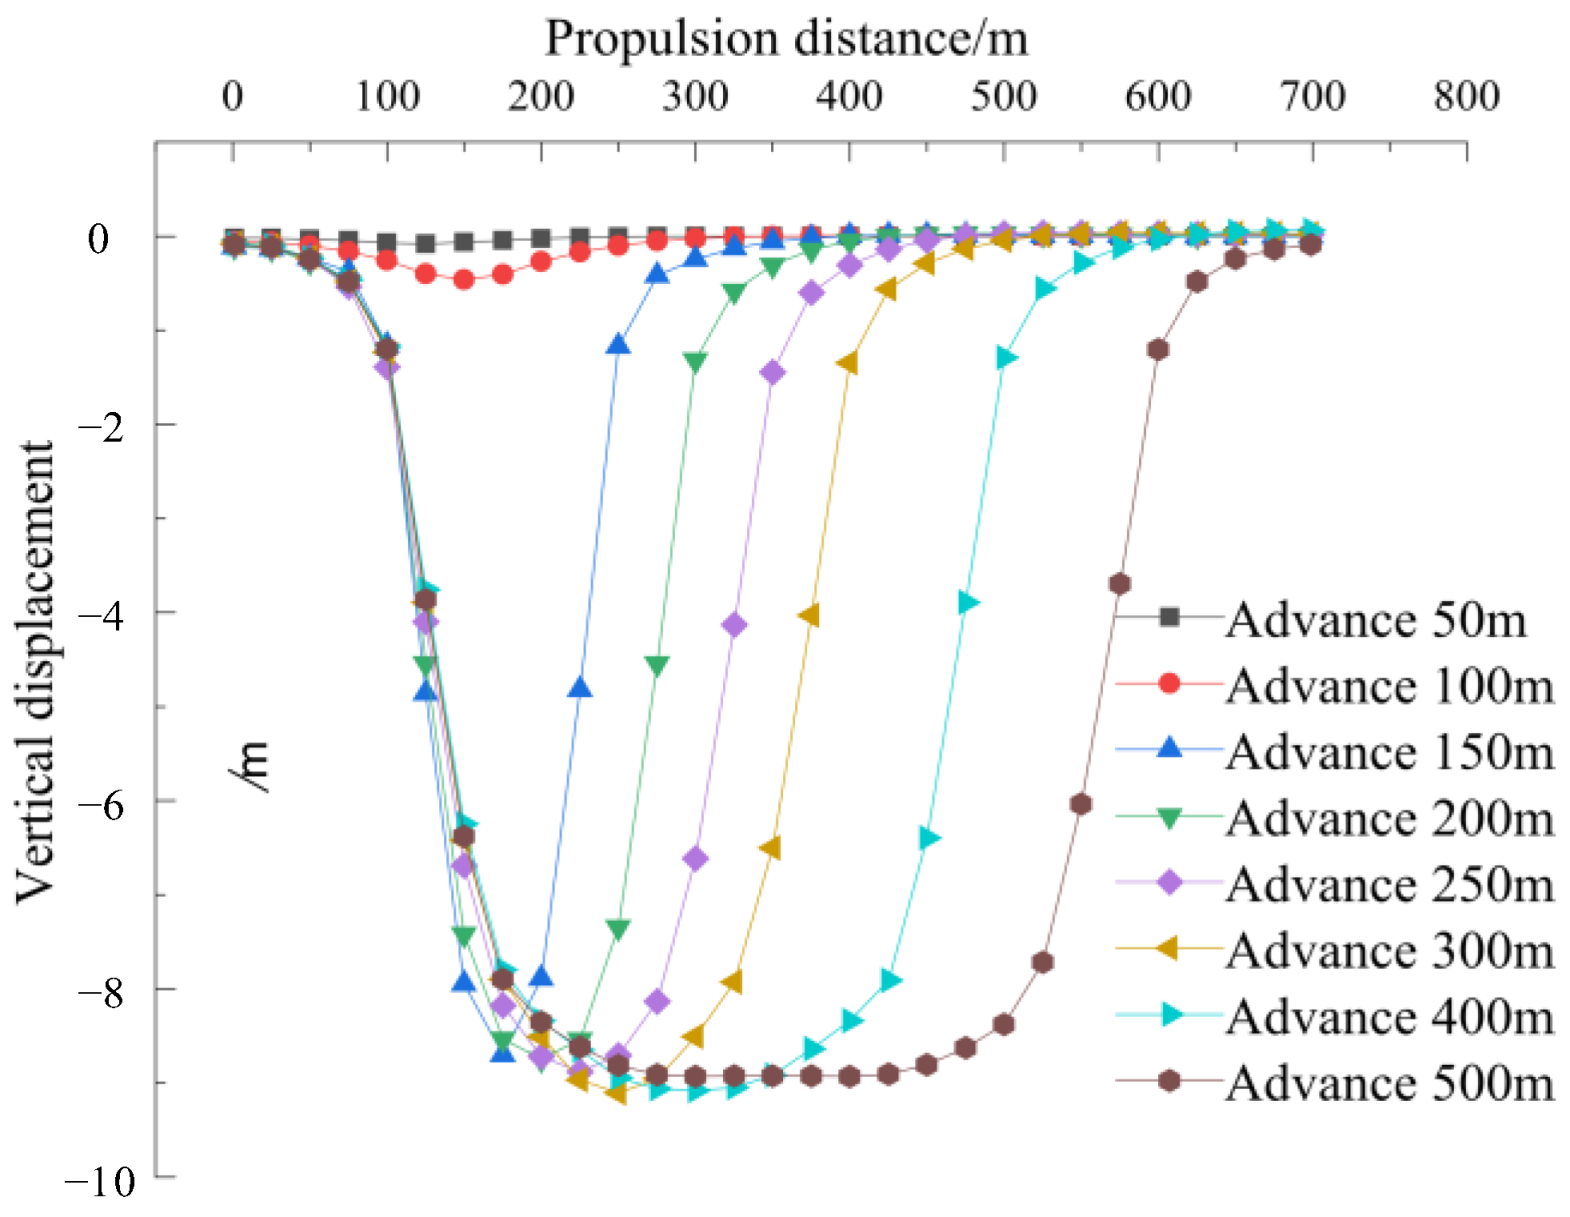
4.2. Simulation Results

The development of the plastic zone of the overlying rock at the advanced distance of the working face of 100 m~500 m was studied to determine the height evolution characteristics of the WCF zone, and the simulation results are shown in Figure 10.
When the working face advanced by 100 m, the maximum height of the plastic zone experiencing shear failure reached 41 m, while the overburden fracture extended to a depth of 75 m without fully penetrating the entire rock layer. When the working face advanced 150 m, the fracture penetrated through the overall strata. The overlying strata underwent significant flexure and subsidence, resulting in a separation zone located 75 m above the coal seam. Simultaneously, the overlying rock experienced both tensile and shear failure from top to bottom. When the working face advanced to 300 m, there was a slight decrease in the development of the plastic zone due to the overall subsidence of the overlying rock. Finally, when the working face advanced to a distance of 500 m, the overall plastic zone of the overlying rock exhibited a distinct saddle shape, while the plastic zone on both sides of the goaf extended up to 76 m. In summary, the overburden fracture that occurred continuously extended upward and maintained stability during the advancement of the working face, which was consistent with the observed overburden fracture pattern in the physical similarity simulation.
The height of the plastic zone stabilized and eventually formed a distinct saddle shape as the working surface continued to advance. The surface above the corresponding positions at both ends of the goaf was shear-damaged, indicating that this area has strong potential for the development of water-conducting fractures.
The measuring points were strategically positioned at 25 m intervals within the central section of a weakly cemented siltstone layer, which was 19.2 m thick. This placement allowed for a more accurate depiction of the vertical displacement of overlying rock during excavation, specifically capturing the changes in measuring points as the working face advances. The vertical displacement of weakly cemented siltstone is shown in Figure 11.
The vertical displacement of the weakly cemented key layer remained relatively stable during the 100 m advancement of the working face, indicating the minimal occurrence of rock failure. When the working face advanced to a distance of 150 m, the key strata experienced maximum subsidence of 8.5 m. During the advancement process from 200 m to 400 m, the weakly cemented key layer exhibited an expansion in subsidence along the direction of advancement, with no change in its maximum displacement. Then, the maximum vertical displacement of the key strata reached approximately 8.9 m when the working face advanced to a distance of 500 m. The vertical displacement of the key strata exhibited a uniform distribution over a specific length, implying the extensive collapse of the overlying rock due to the release of internal stress and stagnation in fracture development. When the working face advanced to 200 m, the cracks of the weakly cemented key strata approached the maximum vertical displacement, and as the working face continued to advance to 500 m, the vertical displacement of the rock gradually stabilized. After reaching a distance of 500 m, the development of cracks in the overlying rock ceased, and its maximum vertical displacement stabilized without a further increase. This indicates the gradual compaction of the overlying rock and suggests that no new fractures would be generated during this process.

5. Actual Field Measurement of Water Conduction Fracture Zone in the Mining Area

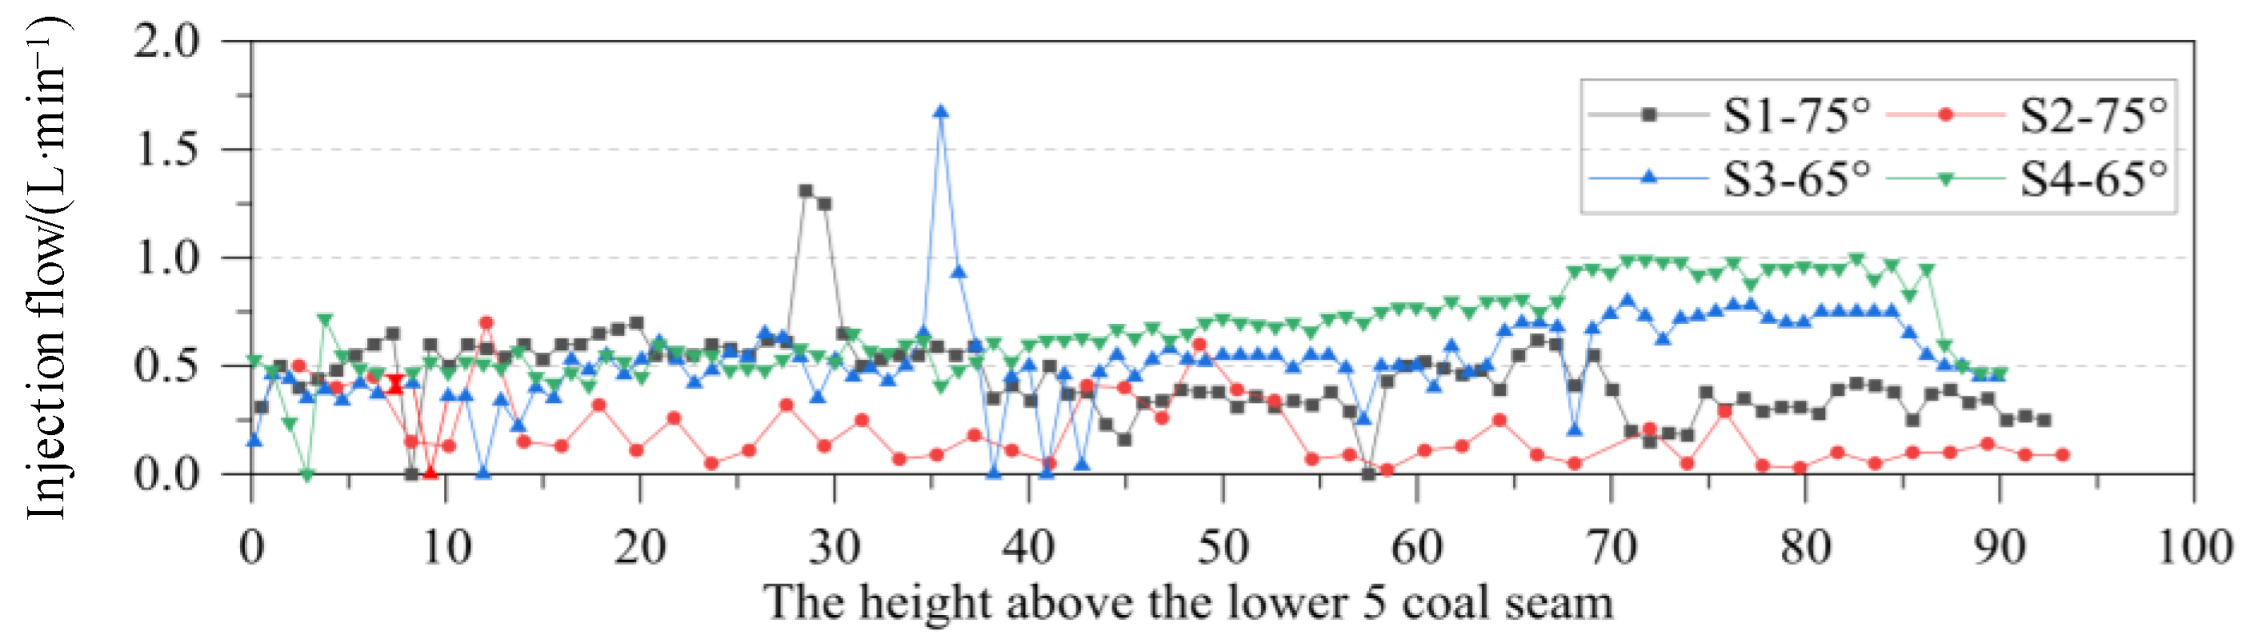
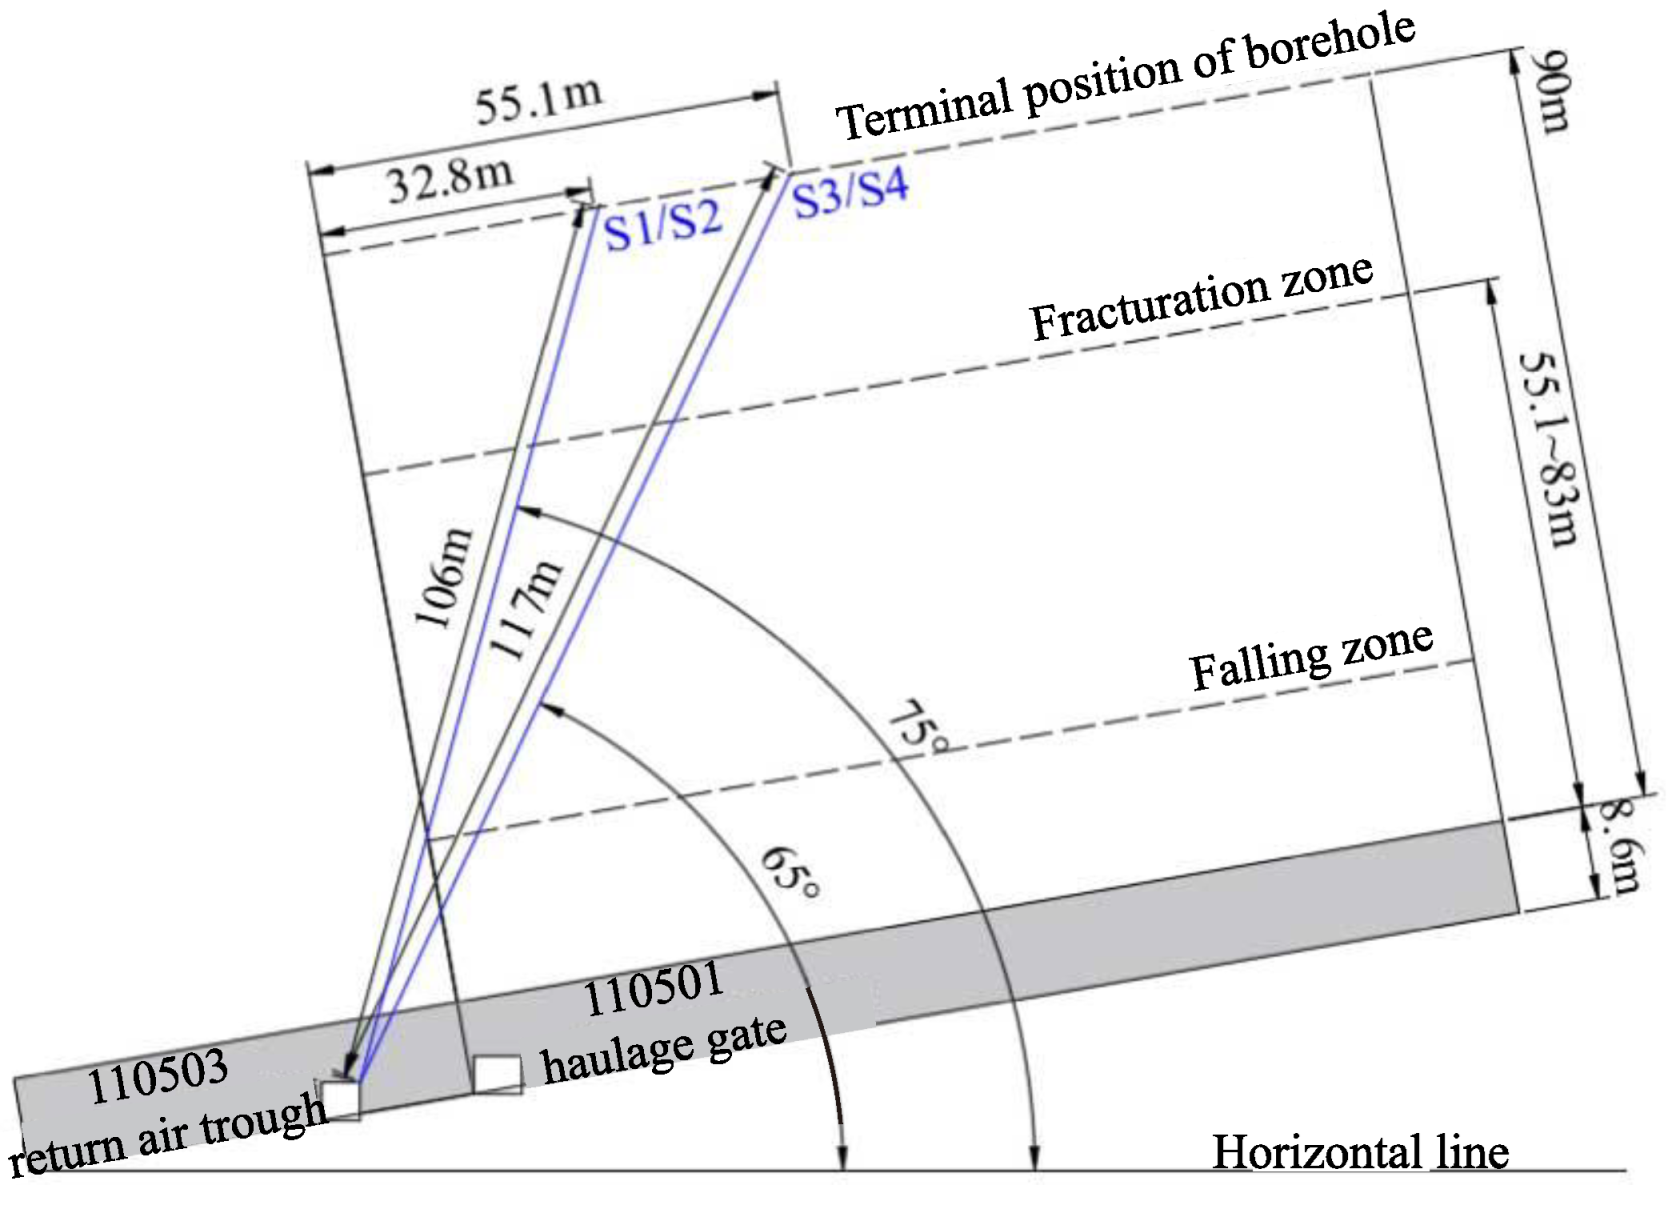
5.1. Observation Borehole Layout

In order to comprehend the development of water conduction fracture zones in weakly cemented rock, the leakage in a borehole after water injection was monitored. Based on the outcomes of the physical similarity simulation and numerical simulation, one pre-mining comparative borehole and three post-mining observation boreholes were established. The layout of the borehole for face observation is shown in Figure 12.

5.2. Comparative Analysis of Measured Results

The borehole water quantity measured by the lateral leakage method of water injection in the underground overhead hole is shown in Figure 13.
The water leakage curve reveals that the flow rate of the S-2 borehole remained relatively stable within a height range of 90 m, suggesting that the elevation angle of the S-2 borehole was excessively steep and did not intersect with the WCF zone. The water leakage of the S-3 and S-4 boreholes increased in the range of 70 m~85 m above the working face, and the average flow rates reached 0.73 L·min−1 and 0.95 L·min−1, respectively, indicating that the injected water was lost through the water conduction fracture zone. The flow rate of holes S-3 and S-4 decreased sharply from 85 m and 87 m to 0.5 L·min−1 or less, which was similar to the amount of water boreholes in comparison. The results indicate that the measured height of the overburden water-conducting fracture zone ranged from 85 m to 87 m. However, when observing long-distance boreholes, it is challenging to avoid drifting drilling issues. Additionally, the final hole’s position did not align with the highest point of the water conduction fracture zone (near the saddle, close to the working face boundary). Therefore, based on the comprehensive analysis, it can be inferred that the actual height of the water conduction fracture zone should range from 88 m to 95 m.

5.3. Prediction Method of the Height of Water-Conducting Fracture Zone

The height of the water conduction fracture zone is directly related to the mining height. Referring to the empirical calculation formula [34] to obtain the height of the water-conducting zone,
H l i = 100 M 0.26 M + 6.88 ± 11.49
where M is the effective mining thickness, m.
The effective mining thickness of 8.6 m has been substituted, resulting in a calculated maximum height range for the water conduction fracture zone of 82.85 m~105.83 m, which exhibits some deviation when compared to the measured data. As mentioned above, the weakly cemented characteristic is the primary reason for the error. Therefore, this formula should be modified to precisely predict the height of the WCF zone in the weakly cemented rock strata. The prediction formula of the water conduction fracture zone can be assumed as follows:
H l i = 100 M a M + b ± c
where Hli is the height of the water conduction fracture zone, m; M is the thickness of the coal seam, m; a and b are coefficients; and c is the error parameter.
The height of the water conduction fracture zone measured in multiple weakly cemented overburden mines [35,36] was used for univariate linear regression fitting to obtain the main body of the equation for the prediction of the height of the fracture zone.
H l i = 100 M 0.36 M + 5.47
The value of c in the formula is obtained by back-calculating the main calculation formula with the actual measured value and solving by the Bezier formula:
c = ± i = 1 n ( l i l ) 2 n 1
where li is the measured height of the water conduction fracture zone, m; l is the calculation height of the main body of the formula, m; n takes 20; and c is the error parameter (deviation value).
Bringing every parameter into the formula, the prediction formula for the development height of the water conduction fracture zone suitable for the weakly cemented rock layer is obtained:
H l i = 100 M 0.36 M + 5.47 ± 13.50
where Hli is the height of the water conduction fracture zone, m; and M is the thickness of the coal seam, m.
In order to verify the reliability of formula (5), the measured data of five western, weakly cemented mines were counted [33,34,36]. The results calculated by the empirical formula and the revised predicted formula were obtained, and the average values of the predicted heights were compared with the measured heights of the water conduction fracture zone. The error results are shown in Table 1.
In Table 1, the error range between the heights obtained by the empirical equation is −17.7% to −3.9%, and the predicted result is smaller than the measured result and the error is relatively large.
The new prediction equation obtained after revising the empirical formula was used for calculation, and the error range was basically between −3.8% and 6.7%, i.e., the height of the WCF zone obtained by the predicted formula was basically within the allowable error range and consistent with the measured data. Compared with the empirical equation, the error value is relatively small, and it can be used as a reference for the height prediction of the weakly cemented water conduction fracture zone in western coal mines.

6. Conclusions

In order to investigate the developmental patterns of WCF zones in weakly cemented strata in western mining areas, a comprehensive approach was employed, including physical modeling, numerical simulation, and field investigation, to analyze the evolutionary behavior of fracture zones in weakly cemented rock under mining-induced influences. A modified formula was proposed to predict the height of WCF zones in weakly cemented rock formations in the western mining area, providing a theoretical reference to resolve the issue of misalignment in predicting the water-conducting heights of weakly cemented rock strata in such regions. The main conclusions are as follows.
(1) A physical similarity simulation test with a 100:1 similitude ratio was carried out based on laboratory tests, and the deformation and fracture characteristics of the overlying strata above the working face were obtained. The development process of the WCF zone was categorized into three stages: initial slow generation, subsequent rapid development, and eventual stabilization. The collapse distances of the immediate roof and main roof measured 20 m and 22.4 m, respectively. The maximum height of caving reached 48 m, while the WCF zone in the weakly cemented rock layer extended up to a maximum height of 96.3 m.
(2) The internal factors influencing the development of weakly cemented WCF zones at different stages were elucidated by analyzing the evolution pattern of the plastic zone and the vertical displacement variation in the key overburden layer through numerical simulation. During the initial mining phase, the plastic zone development was limited and there was only slight damage in the overburden strata. As a result, fracture propagation occurred at a slow rate without penetrating through the rock layer. However, as the working face advanced further, the plastic zone eventually encompassed the entire main roof. This led to a severe shear failure in the overburden strata, causing rapid crack propagation that penetrated through the entire layer. When the fracture reached its maximum height, the vertical displacement of the key strata remained constant, indicating the large-scale collapse of the upper layer and the cessation of further growth in the height of the fracture zone.
(3) The precise determination of the vertical extent of the WCF zone was achieved by monitoring the leakage in the underground overhead borehole after water injection. The flow rate of observation holes S-3 and S-4 exhibited a significant increase within the height range of 70 m to 80 m. However, at heights of 85 m and 87 m, respectively, there was a sharp drop in flow rate to 0.5 L·min−1. By comparing these rates with those observed at the reference hole, it could be deduced that the WCF zone was located between the heights of 85 m and 87 m.
(4) The empirical formula of the coal mine was utilized to propose a modified formula to predict the height of the WCF zone. The findings demonstrated a significant enhancement in accuracy in predicting the height of the zone within weakly cemented rock strata through this method.

Author Contributions

Conceptualization, funding acquisition, project administration, resources, D.M.; data curation, formal analysis, visualization, writing—original draft, Q.L.; methodology, writing—review and editing, C.Z.; supervision, Y.L.; software, G.W.; investigation, validation, Z.H. All authors have read and agreed to the published version of the manuscript.

Funding

This study was supported by the National Key R&D Program of China (2022YFC2905600) and the National Science Fund for Excellent Young Researchers of China (52122404).

Data Availability Statement

Data are contained within the article.

Conflicts of Interest

Author Quanhui Liu was employed by the company Kekegai Coal Mine Shaanxi Yanchang Petr Yulin Coal Chem Co. The remaining authors declare that the research was conducted in the absence of any commercial or financial relationships that could be construed as a potential conflict of interest.

References

  1. Zhang, C.; Wang, P.; Wang, E.; Chen, D.; Li, C. Characteristics of coal resources in China and statistical analysis and preventive measures for coal mine accidents. Int. J. Coal Sci. Technol. 2023, 10, 22. [Google Scholar] [CrossRef]
  2. Meng, Q.; Han, L.; Qiao, W.; Lin, D.; Fan, J. Support technology for mine roadways in extreme weakly cemented strata and its application. Int. J. Min. Sci. Technol. 2014, 24, 157–164. [Google Scholar] [CrossRef]
  3. Wu, Q.; Wang, M.; Wu, X. Investigations of groundwater bursting into coal mine seam floors from fault zones. Int. J. Rock Mech. Min. Sci. 2004, 41, 557–571. [Google Scholar] [CrossRef]
  4. Ma, D.; Duan, H.; Zhang, J.; Bai, H. A state-of-the-art review on rock seepage mechanism of water inrush disaster in coal mines. Int. J. Coal Sci. Technol. 2022, 9, 50. [Google Scholar] [CrossRef]
  5. Ma, D.; Duan, H.Y.; Zhang, J.X.; Liu, X.W.; Li, Z.H. Numerical Simulation of Water-Silt Inrush Hazard of Fault Rock: A Three-Phase Flow Model. Rock Mech. Rock Eng. 2022, 55, 5163–5182. [Google Scholar] [CrossRef]
  6. Bai, Y.; Shan, R.L.; Ju, Y.; Wu, Y.X.; Sun, P.F.; Wang, Z.E. Study on the mechanical properties and damage constitutive model of frozen weakly cemented red sandstone. Cold Reg. Sci. Tech. 2020, 171, 102980. [Google Scholar] [CrossRef]
  7. Ma, D.; Kong, S.B.; Li, Z.H.; Zhang, Q.; Wang, Z.H.; Zhou, Z.L. Effect of wetting-drying cycle on hydraulic and mechanical properties of cemented paste backfill of the recycled solid wastes. Chemosphere 2021, 282, 131163. [Google Scholar] [CrossRef] [PubMed]
  8. Chen, S.G.; Zhang, H.M.; Wang, L.; Yuan, C.; Meng, X.Z.; Yang, G.S.; Shen, Y.J.; Lu, Y.N. Experimental study on the impact disturbance damage of weakly cemented rock based on fractal characteristics and energy dissipation regulation. Theor. Appl. Fract. Mech. 2022, 122, 103665. [Google Scholar] [CrossRef]
  9. Holtzman, R. Micromechanical model of weakly-cemented sediments. Int. J. Numer. Anal. Methods Geomech. 2012, 36, 944–958. [Google Scholar] [CrossRef]
  10. Ma, D.; Duan, H.Y.; Zhang, J.X. Solid grain migration on hydraulic properties of fault rocks in underground mining tunnel: Radial seepage experiments and verification of permeability prediction. Tunn. Undergr. Space Technol. 2022, 126, 104525. [Google Scholar] [CrossRef]
  11. Hu, S.C.; Zhang, C.X.; Ru, W.K.; Han, J.M.; Guo, S.H.; Zhou, X.D.; Yang, L. Creep properties and energy evolution characteristics of weakly cemented rock under step loading. Int. J. Rock Mech. Min. Sci. 2023, 170, 105428. [Google Scholar] [CrossRef]
  12. Liu, J.S.; Jing, H.W.; Meng, B.; Wang, L.G.; Yang, J.J.; Zhang, X.F. A four-element fractional creep model of weakly cemented soft rock. Bull. Eng. Geol. Environ. 2020, 79, 5569–5584. [Google Scholar] [CrossRef]
  13. Ma, D.; Zhang, J.X.; Duan, H.Y.; Huang, Y.L.; Li, M.; Sun, Q.; Zhou, N. Reutilization of gangue wastes in underground backfilling mining: Overburden aquifer protection. Chemosphere 2021, 264, 128400. [Google Scholar] [CrossRef]
  14. Ma, D.; Li, Q.; Cai, K.C.; Zhang, J.X.; Li, Z.H.; Hou, W.T.; Sun, Q.; Li, M.; Du, F. Understanding water inrush hazard of weak geological structure in deep mine engineering: A seepage-induced erosion model considering tortuosity. J. Cent. South Univ. 2023, 30, 517–529. [Google Scholar] [CrossRef]
  15. Ru, W.K.; Hu, S.C.; Zhou, A.H.; Luo, P.K.; Gong, H.; Zhang, C.X.; Zhou, X.D. Study on Creep Characteristics and Nonlinear Fractional-Order Damage Constitutive Model of Weakly Cemented Soft Rock. Rock Mech. Rock Eng. 2023, 56, 8061–8082. [Google Scholar] [CrossRef]
  16. Zhao, Y.X.; Liu, B. Deformation Field and Acoustic Emission Characteristics of Weakly Cemented Rock under Brazilian Splitting Test. Nat. Resour. Res. 2021, 30, 1925–1939. [Google Scholar] [CrossRef]
  17. Chen, Z.Q.; Yang, Z.M.; Wang, M.R. Hydro-mechanical coupled mechanisms of hydraulic fracture propagation in rocks with cemented natural fractures. J. Pet. Sci. Eng. 2018, 163, 421–434. [Google Scholar] [CrossRef]
  18. Ma, D.; Wang, J.J.; Li, Z.H. Effect of particle erosion on mining-induced water inrush hazard of karst collapse pillar. Environ. Sci. Pollut. Res. 2019, 26, 19719–19728. [Google Scholar] [CrossRef] [PubMed]
  19. Sellers, E.J.; Klerck, P. Modelling of the effect of discontinuities on the extent of the fracture zone surrounding deep tunnels (Reprinted from Tunnels under Pressure). Tunn. Undergr. Space Technol. 2000, 15, 463–469. [Google Scholar] [CrossRef]
  20. Wang, Z.K.; Li, W.P.; Chen, J.F. Application of Various Nonlinear Models to Predict the Uniaxial Compressive Strength of Weakly Cemented Jurassic Rocks. Nat. Resour. Res. 2022, 31, 371–384. [Google Scholar] [CrossRef]
  21. Yu, H.J.; Liu, H.L.; Hang, Y.J.; Liu, J.H.; Ma, S.Q. Deformation and Failure Mechanism of Weakly Cemented Mudstone under Tri-Axial Compression: From Laboratory Tests to Numerical Simulation. Minerals 2022, 12, 153. [Google Scholar] [CrossRef]
  22. Yu, W.J.; Li, K.; Liu, Z.; An, B.F.; Wang, P.; Wu, H. Mechanical characteristics and deformation control of surrounding rock in weakly cemented siltstone. Environ. Earth Sci. 2021, 80, 1–15. [Google Scholar] [CrossRef]
  23. Zhang, S.Z.; Fan, G.W.; Zhang, D.S.; Luo, T.; Guo, X.; Dun, S.Q.; Chen, H. Physical Simulation on Weakly Cemented Aquiclude Stability due to Underground Coal Mining. Minerals 2022, 12, 1494. [Google Scholar] [CrossRef]
  24. Cheng, G.W.; Ma, T.H.; Tang, C.A.; Liu, H.Y.; Wang, S.J. A zoning model for coal mining—induced strata movement based on microseismic monitoring. Int. J. Rock Mech. Min. Sci. 2017, 94, 123–138. [Google Scholar] [CrossRef]
  25. Guo, H.; Yuan, L.; Shen, B.T.; Qu, Q.D.; Xue, J.H. Mining-induced strata stress changes, fractures and gas flow dynamics in multi-seam longwall mining. Int. J. Rock Mech. Min. Sci. 2012, 54, 129–139. [Google Scholar] [CrossRef]
  26. Huang, Y.L.; Li, J.M.; Ma, D.; Gao, H.D.; Guo, Y.C.; Ouyang, S.Y. Triaxial compression behaviour of gangue solid wastes under effects of particle size and confining pressure. Sci. Total Environ. 2019, 693, 133607. [Google Scholar] [CrossRef] [PubMed]
  27. Lu, Y.L.; Wang, L.G. Numerical simulation of mining-induced fracture evolution and water flow in coal seam floor above a confined aquifer. Comput. Geotech. 2015, 67, 157–171. [Google Scholar] [CrossRef]
  28. Miao, X.X.; Cui, X.M.; Wang, J.A.; Xu, J.L. The height of fractured water-conducting zone in undermined rock strata. Eng. Geol. 2011, 120, 32–39. [Google Scholar] [CrossRef]
  29. Sun, L.H.; Long, Y.X.; Li, X.; Jiang, Z.X.; Fan, Y.; Wang, Z.Z.; Han, X.G. Effect of Loading Rate on the Mechanical Properties of Weakly Cemented Sandstone. Sustainability 2023, 15, 2750. [Google Scholar] [CrossRef]
  30. Zhang, W.; Zhang, B.L.; Zhao, T.B. Study on the Law of Failure Acoustic-Thermal Signal of Weakly Cemented Fractured Rock with Different Dip Angles. Rock Mech. Rock Eng. 2023, 56, 4557–4568. [Google Scholar] [CrossRef]
  31. Yu, H.J.; Liu, H.L.; Xia, Y.; Zhang, M.C.; Hang, Y.J.; Luo, W.J. A Study on the Deformation Mechanism of the Rock Surrounding a Weakly Cemented Cross-Layer Roadway, under Tectonic Stress. Energies 2023, 16, 2546. [Google Scholar] [CrossRef]
  32. Zhao, J.P.; Tan, Z.S.; Wang, X.Y.; Zhou, Z.L.; Li, G.L. Engineering characteristics of water-bearing weakly cemented sandstone and dewatering technology in tunnel excavation. Tunn. Undergr. Space Technol. 2022, 121, 104316. [Google Scholar] [CrossRef]
  33. Zhang, L.F.; Zhang, Z.Z.; Wang, K.K.; Tan, X.D.; Zhang, T.D.; Zhang, L. Characteristic Developments of the Water-Conducting Fracture Zones in Weakly Cemented Overlying Strata of Jurassic Coal Mines in Western China. Water 2023, 15, 1097. [Google Scholar] [CrossRef]
  34. Wu, Q.; Guo, X.M.; Shen, J.J.; Xu, S.; Liu, S.Q.; Zeng, Y.F. Risk Assessment of Water Inrush from Aquifers Underlying the Gushuyuan Coal Mine, China. Mine Water Environ. 2017, 36, 96–103. [Google Scholar] [CrossRef]
  35. Zhang, L.F.; Zhang, Z.Z.; Wang, K.K.; Tan, X.D.; Zhang, L.; Zhang, T.D. Development and Height Prediction of Fractured Water-Conducting Zone in Weakly Cemented Overburden: A Case Study of Tashidian Erjingtian Mine. Sustainability 2023, 15, 13899. [Google Scholar] [CrossRef]
  36. Lu, C.J.; Xu, J.P.; Li, Q.; Zhao, H.; He, Y. Research on the Development Law of Water-Conducting Fracture Zone in the Combined Mining of Jurassic and Carboniferous Coal Seams. Appl. Sci. 2022, 12, 11178. [Google Scholar] [CrossRef]
Figure 1. Locations of western and eastern coal mines with different cemented characteristics.
Water 15 04173 g001
Figure 2. Geological diagram in coal mine area.
Water 15 04173 g002
Figure 3. Microstructure of siltstone with different magnification times. (a) 1000 times (b) 10,000 times.
Water 15 04173 g003
Figure 4. Physical similarity model.
Water 15 04173 g004
Figure 5. Collapse process of immediate roof at (a) the initial and fourth excavations and (b) the 20th excavation.
Water 15 04173 g005
Figure 6. Collapse process of the main roof: (a) the first collapse of the main roof, (b) the second collapse of the main roof, (c) the collapse of the main roof overburden layer, (d) the third collapse of the main roof.
Water 15 04173 g006aWater 15 04173 g006b
Figure 7. Collapse of weakly cemented key strata.
Water 15 04173 g007
Figure 8. Variation curve of the water-conducting fracture height.
Water 15 04173 g008
Figure 9. Sketch of model establishment.
Water 15 04173 g009
Figure 10. Plastic zone of working face advancing 100~500 m: (a) 100 m, (b) 150 m, (c) 300 m, (d) 500 m.
Water 15 04173 g010aWater 15 04173 g010b
Figure 11. Vertical displacement curves of weakly cemented key strata.
Water 15 04173 g011
Figure 12. Observation drill hole layout.
Water 15 04173 g012
Figure 13. Curves of water injection and leakage of borehole.
Water 15 04173 g013
Table 1. Parameters of formula for prediction of the height of water-conducting fracture zone.
Coal MineActual Height
(m)
Empirical
Result (m)
Relative Error
(%)
Predicted
Result (m)
Relative Error
(%)
Dananhu47.5939.16−17.745.80−3.8
Yili No. 15147.18−7.4954.406.7
Xiagou97.4795.17−2.36101.143.77
Binchang109104.72−3.9109.60.5
Hanglaiwan98.192.34−5.898.600.5
Disclaimer/Publisher’s Note: The statements, opinions and data contained in all publications are solely those of the individual author(s) and contributor(s) and not of MDPI and/or the editor(s). MDPI and/or the editor(s) disclaim responsibility for any injury to people or property resulting from any ideas, methods, instructions or products referred to in the content.

