Article

Hydrochemical Characteristics and Quality Evaluation of Groundwater in Jinta Basin, Northwest China

1
Center for Hydrogeology and Environmental Geology Survey, China Geological Survey, Baoding 071051, China
2
School of Environmental Science and Engineering, Southern University of Science and Technology, Shenzhen 518055, China
*
Authors to whom correspondence should be addressed.
Water 2023, 15(23), 4171; https://doi.org/10.3390/w15234171
Submission received: 23 October 2023 / Revised: 24 November 2023 / Accepted: 25 November 2023 / Published: 1 December 2023
(This article belongs to the Special Issue Soil-Groundwater Pollution Investigations)

Abstract

:
The ecological environment of the northwest inland basin is fragile. The groundwater environment is a crucial influencing factor for the harmonious and sustainable development of the local social economy and the ecological environment. It is significant to investigate the groundwater chemical characteristics, water quality, and the factors that influence groundwater chemistry for groundwater resources development and construction of the ecological environment. In this study, the Jinta Basin (JB), Gansu Province, was the selected study area. Three hundred and fifty groups of shallow groundwater samples in the JB were collected and analyzed, and the characteristics and controlling factors of groundwater were determined by using Piper diagram, Gibbs plot, ion ratio relationship, and factor analysis. Single index evaluation method, comprehensive evaluation method, and entropy-weighted water quality index method were used to evaluate the water quality of the groundwater. The results indicated that the shallow pore water in the JB was alkaline as a whole; the ranges of total dissolved solids (TDS) in the Beidahe River impact area (BIA), the transition area (TA) and the Heihe River impact area (HIA) were 328.4–12,400 mg·L−1, 372.70–3774.0 mg·L−1, and 366.30–75,200.0 mg·L−1, respectively; the major anions and cations of the shallow pore water were SO42−/Cl and Mg2+/Na+, respectively. The Piper diagram illustrated that the hydrochemical type of groundwater in the JB were mainly HCO3·SO4-Mg type, SO4·HCO3-Mg type, SO4-Mg·Na type, SO4·Cl-Na·Mg type, and Cl-Na type. The overall water quality of the shallow groundwater in the JB was relatively poor, mainly falling into Class IV-V water quality. Sulfate, total hardness (TH), TDS, chloride and sodium were the main influencing factors of water quality. The chemical characteristics of groundwater in the JB were controlled by a variety of natural factors, including rock weathering, evaporative concentration, and cation exchange, among which the main controlling factors of shallow pore water were leaching, evaporative concentration and anthropogenic activities (contribution rate of 73.94%), and sulfate rock and carbonate rock dissolution (contribution rate of 14.91%).

1. Introduction

Water is the source of life. Groundwater is essential in the ecologically fragile inland arid basin of Northwest China [1,2]. The groundwater resources in the arid inland areas of Northwest China serve as the fundamental guarantee for local residents’ water supply for production, daily life, and ecological needs. The groundwater environment is a crucial influencing factor for the harmonious and sustainable development of the social economy and the ecological environment.
Previous studies have found that the chemical characteristics, water quality characteristics and evolutionary patterns of groundwater are closely related to the surrounding environment, and are mainly affected by the hydrogeological conditions, water–rock interactions, and other natural environments, as well as by human activities, such as domestic sewage and groundwater overexploitation [3,4,5,6]. The main controlling factors of groundwater evolution mainly include soluble salt dissolution, ion exchange, human activities, weathering of silicate minerals, and evaporation [7,8,9]. The dissolution–filtration is the main cause of groundwater total dissolved solids (TDS) elevation in the recharge and runoff areas of the inland basin, Northwest China, while evaporation has a greater impact on groundwater salinisation in the discharge area [10]. Groundwater chemistry components can indicate the runoff path of groundwater, reflect the characteristics of groundwater flow, and identify the chemical characteristics, water quality characteristics and formation mechanism of groundwater in the study area [11,12]. For the study of groundwater chemical characteristics and controlling factors, the more mature approach is to combine the hydrogeochemical theory with multivariate statistical analysis to analyze the controlling factors and sources of genesis [13,14,15].
Jinta Basin (JB) is located in the middle and lower reaches of the Heihe River Basin in the northwestern part of Gansu Province, with the Heihe River Irrigation area and Yuanyangchi Irrigation area on the east and west sides. Groundwater is the major source of water for local residents’ daily life and agricultural irrigation in the JB. With the development of industry and agriculture, increased groundwater extraction has led to a decline in the water table. The mountain front aquifer in the northern part of the basin gradually thinned, and the shallow groundwater evaporation was intense, which led to the increase in TDS and the deterioration of water quality. Therefore, the issues related to the rational distribution of groundwater resources and water security have become increasingly prominent [16,17]. At present, the primary research paths on groundwater in the JB have been groundwater resource regulation [17], groundwater chemical characteristics and evolution [18,19,20], etc. The systematic research on the combination of groundwater chemical characteristics, water quality, and control factors are relatively limited. Thus, the regional variation characteristics, sources, water quality, and control factors of the main ions in the JB need to be further studied.
In this paper, the shallow groundwater in the JB, Gansu Province, was selected as the research object. We analyzed the groundwater chemical characteristics and controlling factors by Piper diagram, Gibbs diagram, ion ratio, and factor analysis, etc, based on the previous studies. The quality of shallow groundwater was evaluated by single index evaluation method, comprehensive evaluation method, and entropy-weighted water quality index method, aiming to provide the basis for the evolution of water chemistry and the construction of ecological environment in the JB.

2. Study Area

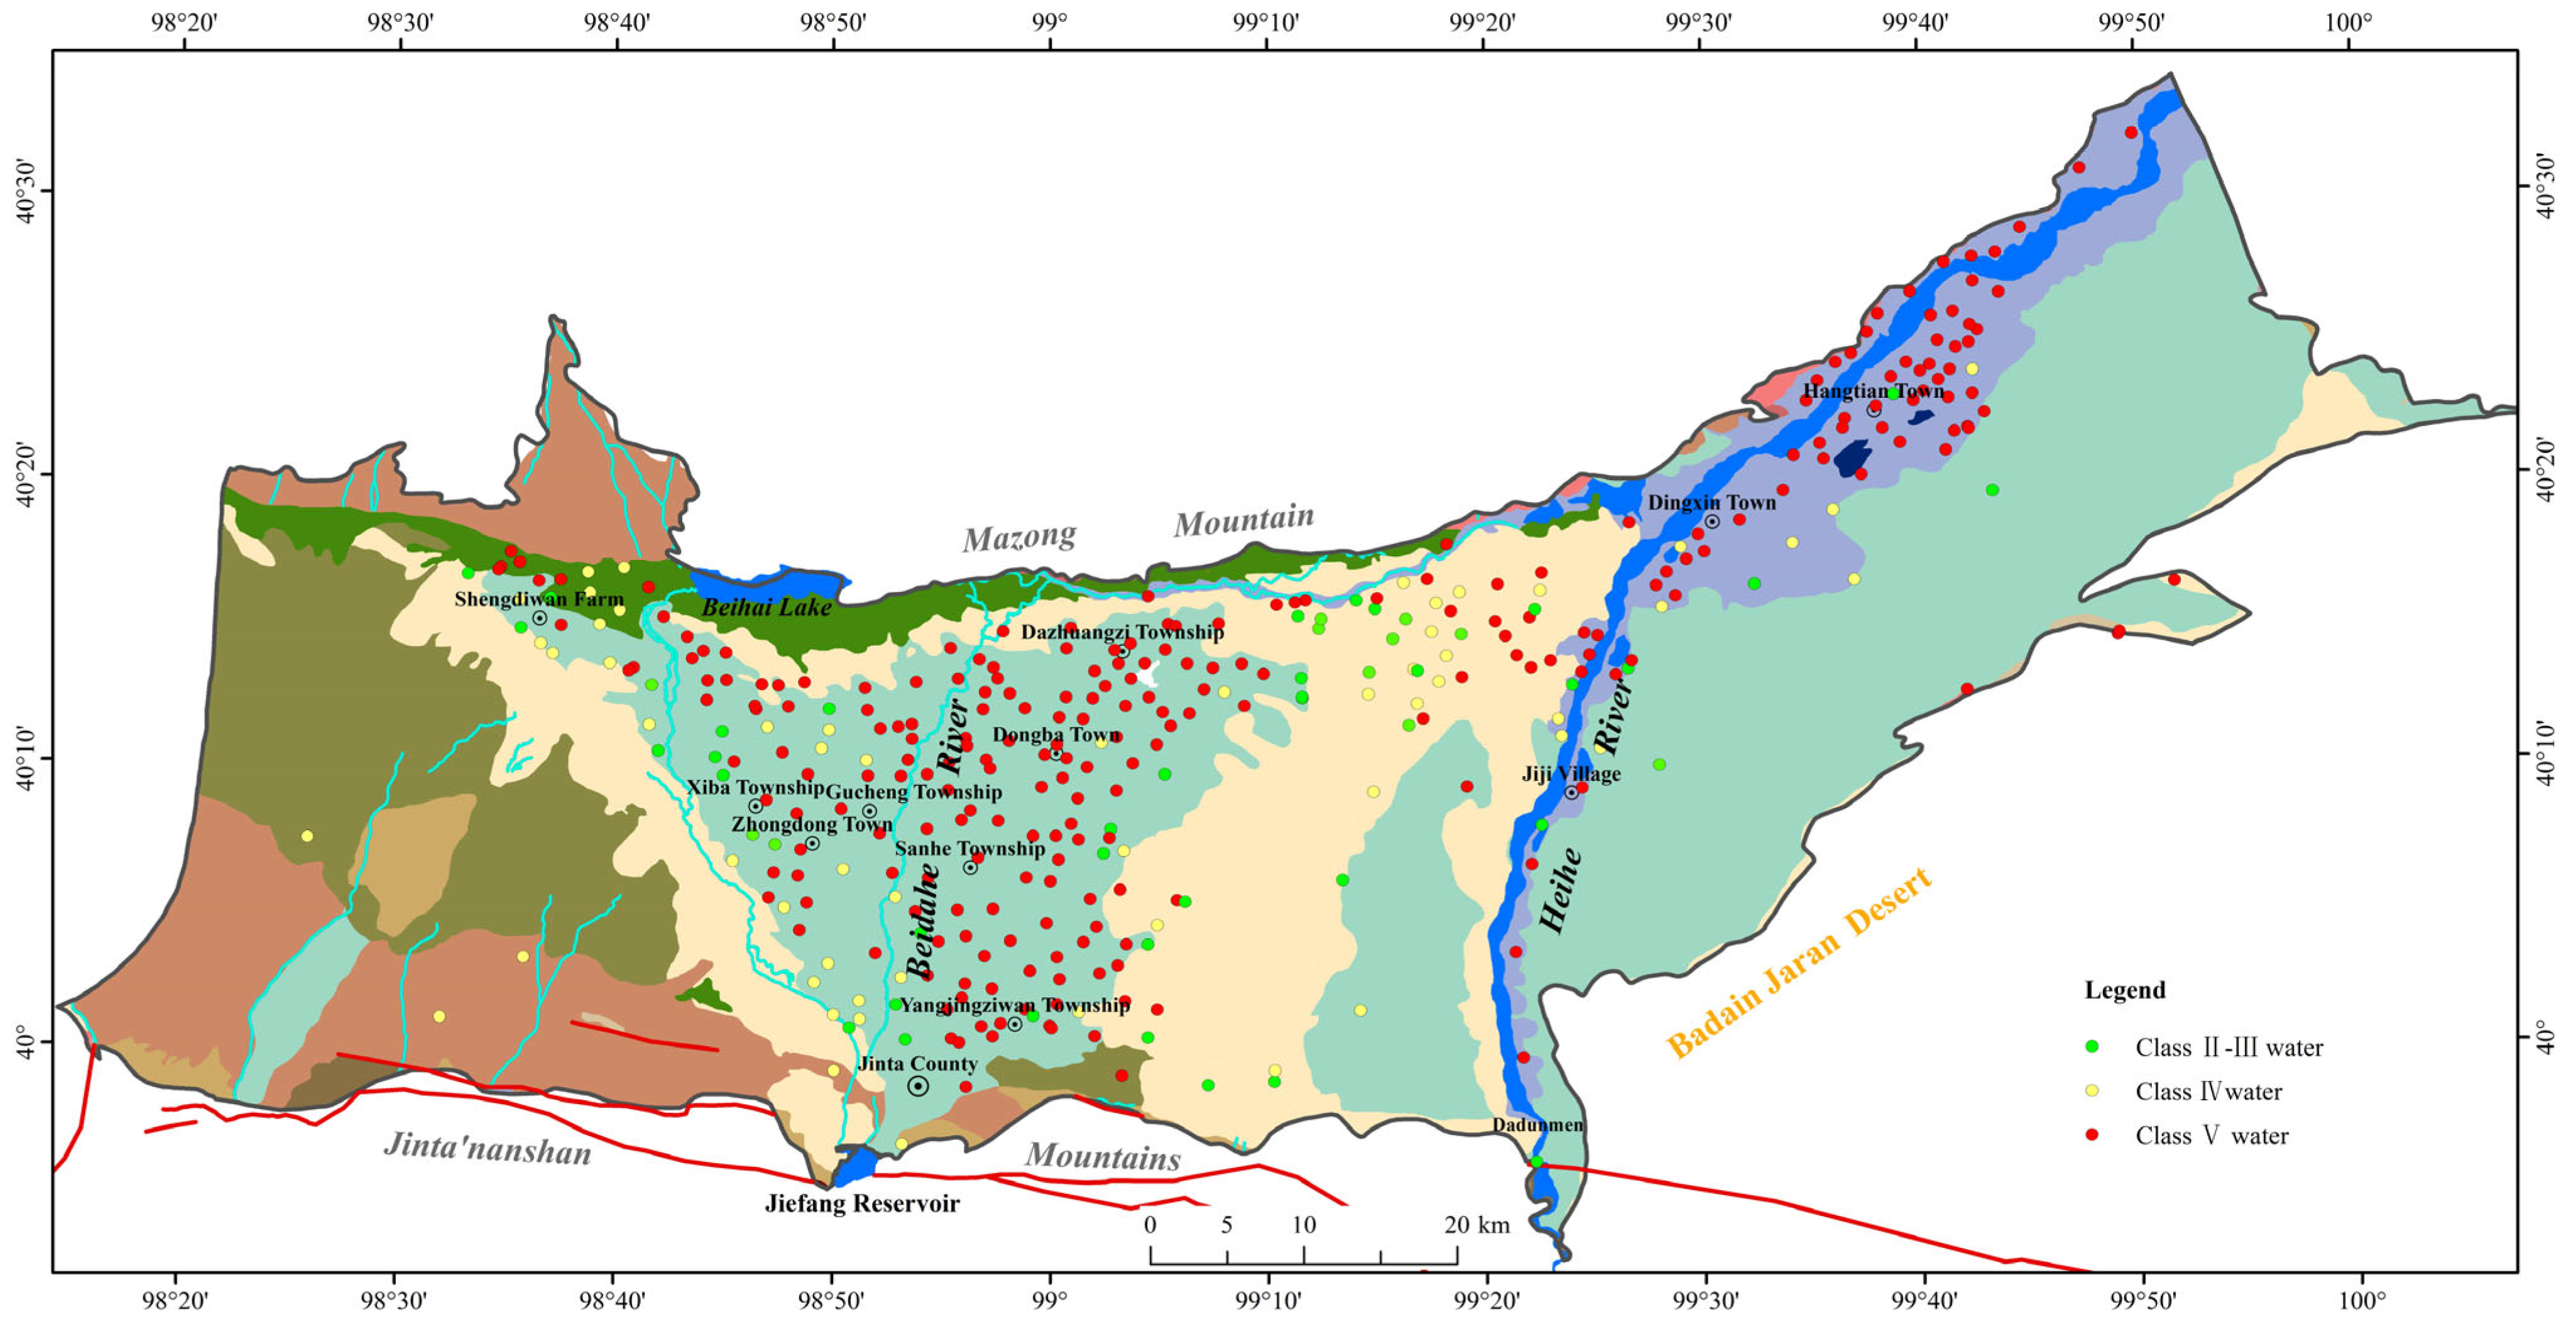
The JB is located in the lower reaches of the Heihe River Basin, extending from the Jinta’nanshan Mountains in the south to the Mazong Mountain in the north. It is adjacent to the Huahai Basin on the west, separated by a watershed, and connected to the Badain Jaran Desert on the east. The Yuanyangchi Irrigation area in the JB is situated in the fan-shaped plain area between the southern and northern mountains in the western part of the basin, with sand dunes and farmland interspersed distribution [17]. The JB belongs to Jinta County and includes towns and townships such as Jinta Town, Chengguan Town, Zhongdong Town, Dongba Town, Yangjingziwan Township, Sanhe Township, Gucheng Township, Xiba Township, Dazhuangzi Township, Shengdiwan Farm, Dingxin Town, and Hangtian Town (Figure 1).
The JB is located in the northwest inland hinterland, characterized by cold winters, hot summers, low rainfall, and high evaporation rates, which falls within the transitional zone from temperate desert climate to warm-humid climate. The annual average temperature is 9.1 °C, the highest temperature is 40.5 °C, and the lowest temperature is −29.6 °C. The annual average precipitation is 68 mm, while the annual average evaporation is 2538.6 mm. The region is traversed by two major rivers: the lower reaches of the Beidahe River, originating from the middle section of the Qilian Mountains, and the lower reaches of the Heihe River. The Beidahe River flows north from the northern side of Jiuquan City and enters the Yuanyangchi Reservoir, which then passes through the Jiefang Reservoir and the Bantan Reservoir before supplying water for agriculture irrigation, and human and livestock living in the JB. The Heihe River enters the JB from Dadunmen and flows through Jiji Village and Dingxin Valley before entering the Ejina Basin.
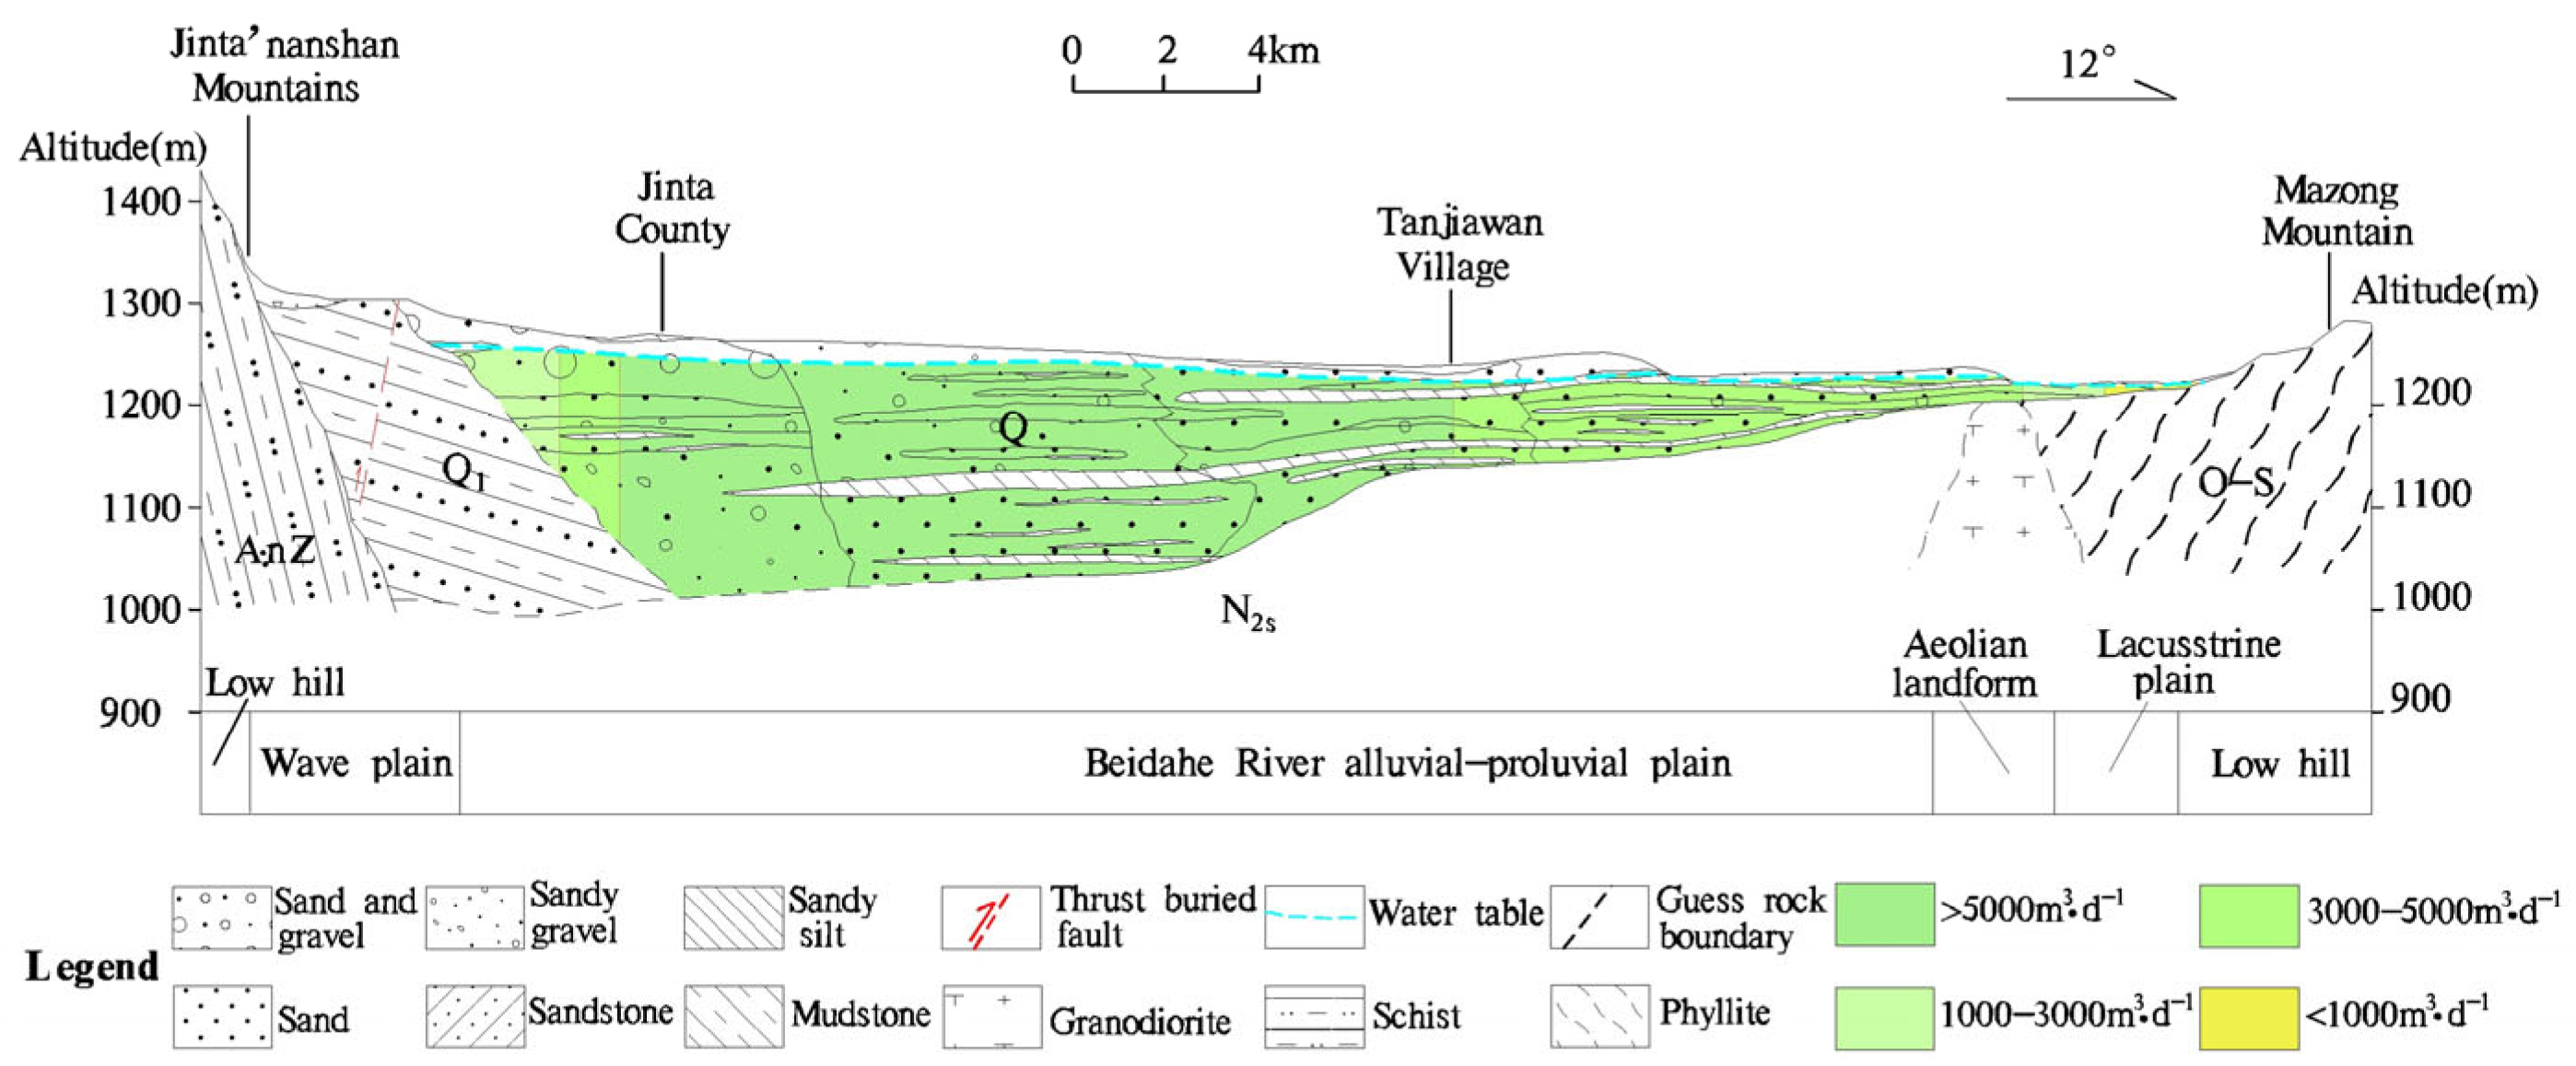
The JB is a typical fault basin with significant fault distributions along its margins. It has the Neogene as its basement, covered by relatively thin Quaternary sedimentary deposits [17]. The basin’s internal structure is shaped by the tectonic uplift and subsidence of basement blocks, resulting in a fan-shaped alluvial plain of the Beidahe River and aeolian landforms. The quaternary lithology in front of Jinta’nanshan Mountains is mainly sand-gravel and medium-fine sand, with coarser particles (Figure 2). The particles of aquifer become finer to the north, and the quaternary lithology of the north aquifer consists of gravel, medium-coarse sand, and silty clay interlayers. According to the drilling data, mineral composition in the strata mainly includes plagioclase, orthoclase, quartz, and mica, with a dominant component of aluminosilicate. The aquifer types in the study area transition from unconfined aquifers in the south to multi-layer structures with upper unconfined and lower confined aquifers as one moves northward. The water table depth in the JB ranges from 5 to 10 m, and groundwater generally flows from southwest to northeast (Figure 3). The water of Beidahe River and Heihe River are the primary sources of water supply for the JB, and they are closely related to the hydrochemical characteristics of groundwater in the basin [21].

3. Materials and Methods

3.1. Sample Collection and Processing

A total of 350 sets of shallow pore water samples were collected in the years 2017–2018 for this study. The distribution of sampling points is shown in Figure 1. The samples were collected from domestic wells and agricultural irrigation wells with depths ranged from 10 to 120 m and water table depths varying from 5 to 30 m. Prior to sampling, each well was left running for more than 30 min to ensure the flow of groundwater from the aquifers, and the sampling bottles were washed with water samples for 3 times. Two bottles of water samples were collected at each sampling point. One bottle of water sample was filtered and protected with nitric acid for cation test, and the other bottle was used for anion analysis. The water samples were sealed with sealing film, stored in the dark, and promptly sent for analysis. The samples were sent to the Gansu geological engineering laboratory for water quality testing analysis.
The concentrations of Na+, K+, Ca2+, and Mg2+ in the groundwater were determined using an inductively coupled plasma emission spectrometer (iCAP7000, Waltham, MA, USA). The concentrations of Cl, SO42−, and NO3 in the groundwater were determined using an ion chromatograph (IC-8628, Qingdao, China). The concentration of HCO3 was determined by the titration method. The pH value of groundwater samples was determined using the glass electrode method. TDS and total hardness (TH) were determined using the weight method and EDTA method, respectively. The test methods, relative deviation of precision and detection limits of each index in the laboratory are shown in Table 1. The ionic charge balance error (%CBE) of all groundwater samples was within the range of ±5%, indicating the reliability of the water quality data.
% C B E = c a t i o n a n i o n c a t i o n + a n i o n × 100 %

3.2. Water Quality Evaluation Index and Evaluation Method

In this study, the Chinese groundwater quality standard “GB/T 14848-2017” [22] was selected. Based on the test results of groundwater samples, this study selected nine indexes including pH, TH (CaCO3), TDS, sulfate, chloride, Na, Fe, nitrate, and fluoride to establish a quality evaluation system.
According to Chinese groundwater quality standards, the groundwater quality evaluation in the JB is compared with the Class III standard limits. Firstly, a single index evaluation is conducted by comparing each index against its respective Class III standard limit, and then a comprehensive evaluation of groundwater quality is performed following the principle of prioritizing the worse index. The results will indicate whether the water quality meets the standards, and any index exceeding the Class III water standards limit is considered to be above the acceptable limit of water for living and drinking. The over standard rate (%) of each index is obtained by the ratio of the number of test data exceeding the standard value to the total number of samples.
o v e r   s t a n d a r d   r a t e % = n u m b e r   o f   o v e r   s t a n d a r d   s a m p l e s n u m b e r   o f   t o t a l   s a m p l e s × %
Further, the Entropy-Weighted Water Quality Index (EWQI) was using to evaluate water quality, which is an objective weighing method that determines an index’s dispersion degree by computing the entropy value [23,24]. It was used to calculate the weights of the nine hydrochemical indexs. The groundwater quality was evaluated using the groundwater quality standard: excellent (WQI < 25), acceptable (25 < WQI < 50), medium (50 < WQI < 100), poor (100 < WQI < 150), or severely bad (WQI > 150) [20,21]. The EWQI is the product of wi and Cj (the concentration of j), and Sj (the standard value of j), and was calculated by Equation (3) [24,25]:
E W Q I = j = 1 m w i × C j S j

4. Results and Discussion

4.1. Groundwater Chemistry Characteristics

4.1.1. Characteristics of Water Chemical Composition

The collected water samples are all from Quaternary pore water from the JB, and the test results are shown in Table 2.

4.1.2. Hydrochemical Types of Groundwater

In the Beidahe River impact area (BIA), the pH of the pore water ranged from 7.23 to 8.91, with a mean value of 7.83, indicating weak alkaline water overall. The pH value had the smallest coefficient of variation (CV) at 4.22%, indicating that pH value was evenly distributed in space with little spatial variability. The CVs for NO3, Cl, and Na+ were high, indicating strong variability. The CVs for K+, Ca2+, Mg2+, and SO42− ranged from 67.50% to 98.06%, indicating moderate variability. The CV for HCO3 was 34.32%, indicating low variability. The TDS ranged from 328.4 to 12,400.0 mg·L−1, with a mean of 2088.46 mg·L−1, and the TH ranged from 157.6 to 6004.0 mg·L−1, with a mean of 1202.01 mg·L−1, indicating poor water quality and significant influence from evaporation and concentration. The CVs for TDS and TH were close, both indicating moderate variability and consistent spatial distribution characteristics.
In the transition area (TA), the pH of the pore water ranged from 7.21 to 8.99, with a mean value of 8.0, indicating weak alkaline water overall. The pH value had the smallest CV at 5.37%, indicating that pH value was evenly distributed in space with little spatial variability. The CVs for Cl, SO42−, and NO3 were high, indicating strong variability. The CVs for Na+, K+, Ca2+, and Mg2+ ranged from 72.30% to 96.50%, indicating moderate variability. The CV for HCO3 was 23.04%, indicating low variability. The TDS ranged from 372.70 to 3774.0 mg·L−1, with a mean of 902.49 mg·L−1, and TH ranged from 158.1 to 1972.0 mg·L−1. The water quality in the TA was obviously better than that in the BIA. The CVs for TDS and TH were close, both indicating moderate variability and consistent spatial distribution characteristics.
In the Heihe River impact area (HIA), the pH of the pore water ranged from 7.14 to 9.02, with a mean value of 7.64, indicating weak alkaline water overall. The pH value had the smallest CV at 4.71%, indicating that pH value was evenly distributed in space with little spatial variability. The CVs for Na+, K+, Ca2+, Mg2+, Cl, and NO3 were all high, indicating strong variability, with Cl exhibiting the strongest variability. The CVs for SO42− was 79.72%, indicating moderate variability. The CV for HCO3 was 49.22%, indicating low variability. The TDS ranged from 366.30 to 75,200.0 mg·L−1, with a mean of 2776.96 mg·L−1, and TH ranged from 150.60 to 20,860.0 mg·L−1, with a mean of 1130.82 mg·L−1, indicating poor water quality and significant influence from evaporation and concentration. Both TDS and TH had high CV, indicating strong variability.
In the BIA, the main anion in the pore water was SO42−, and the main cations were Na+ and Mg2+. The mean concentrations of SO42−, Na+ and Mg2+ were 1072.10 mg·L−1, 234.08 mg·L−1, and 218.27 mg·L−1, respectively. The mean values of cation concentration were in order of Na+ > Mg2+ > Ca2+ > K+ from high to low, while the average values of anion concentration from high to low were SO42− > HCO3 > Cl (Table 2). In addition, SO42− was the most abundant anion, accounting for 20.09% to 79.90% of the total anion concentration, with an average of 59.13%.
In the TA, the main anion in the pore water was SO42−, and the main cation was Na+. The mean concentrations of SO42− and Na+ were 404.15 mg·L−1 and 130.08 mg·L−1, respectively. The mean concentrations of major anions followed the order of SO42− > HCO3 > Cl, while the cation average concentration order was Na+ > Mg2+ > Ca2+ > K+ (Table 2).
In the HIA, the main anions in the pore water were SO42− and Cl, and the main cation was Na+. The mean concentrations of SO42−, Cl, and Na+ were 868.77 mg·L−1, 771.38 mg·L−1, and 537.98 mg·L−1, respectively. The concentrations of major anions followed the order of SO42− > Cl > HCO3, while the cation concentration order was Na+ > Mg2+ > Ca2+ > K+ (Table 2). Among the cations, Na+ was the dominant one, accounting for 24.20% to 78.71% of the total cation concentration, with an average of 50.58%.
Groundwater chemical composition characteristics and evolutionary patterns can be analyzed using the Piper diagram [26,27]. According to Figure 4, in the BIA, the predominant cation in the pore water was Mg2+, while the predominant anion was SO42−. From the top of the fan-shaped plain in the southern part of Jinta County to the northern front, the cations gradually changed from Mg2+ to Na+, and the anions shifted from HCO3 and SO42− to SO42− and Cl. In the TA, the major cations in pore water were Mg2+ and Na+, and the primary anions were SO42− and HCO3. Moving from south to north, the cations changed from Mg2+ to Na+, and the anions gradually shifted from HCO3 and SO42− to SO42−. In the HIA, the primary cation in pore water was Na+, while the primary anions were SO42− and Cl. Heading northeast from Dadunmen to Dingxin Town and then to the northeast of Hangtian Town, the cations gradually changed from Mg2+ to Na+, and the anions shifted from HCO3 and SO42− to SO42− and Cl.
From Figure 3, it can be observed that the hydrochemical types of shallow groundwater in the JB were quite diverse. In the BIA, the hydrochemical type of pore water gradually evolved from HCO3·SO4-Mg type and SO4·HCO3-Mg type to SO4-Mg·Na type. In addition, the continuous water–rock interaction in the process of groundwater runoff and the strong evaporation in the shallow buried area in the northern mountain front led to the emergence of SO4·Cl-Na·Mg water type. Therewith, TDS transitioned from less than 1 g·L−1 to 1–3 g·L−1, and in the shallow buried area in the northern mountain front TDS exceeded 5 g·L−1. In the TA, the hydrochemical type of pore water was primarily HCO3·SO4-Mg·Na type in the central belt, gradually transitioning towards SO4·HCO3-Mg·Na dominated types towards the periphery, with TDS less than 1 g·L−1. In the shallow buried area in the northern mountain front, the water type was SO4-Na·Mg, and TDS transitioned from less than 1 g·L−1 to 1–3 g·L−1. In the BIA, the hydrochemical types of pore water on the right bank of the Heihe River gradually evolved from HCO3·SO4-Mg·Na type and SO4·HCO3-Mg·Na type to SO4-Mg·Na type, SO4·Cl-Na·Mg type, and Cl·SO4-Na type as one moves towards the western, northeastern, and southeastern parts. TDS also transitioned from less than 1 g·L−1 to 1–3 g·L−1, and in the eastern desert fringe area TDS exceeded 3 g·L−1.

4.2. Groundwater Quality Status

4.2.1. Single Index Evaluation Results

The single index evaluation results showed that among 350 groups of shallow groundwater samples in the JB, 302 groups exceeded Class III standards, with an over standard rate of 86.3%. The statistics for the number and exceedance rate of water quality monitoring indicators in the JB groundwater are shown in Table 3. The results show that sulfate and TH were generally exceeded, with over standard rates of 81.43% and 66.29%, respectively; TDS, chloride, and sodium (Na) were exceeded in some areas, with over standard rates of 33.43%, 21.43%, and 17.43%, respectively; there were also minor exceedance occurrences for pH, fluoride, nitrate, and iron (Fe), with exceedance rates of 4.29%, 1.14%, 1.14%, and 0.57%, respectively.
Figure 5 shows a Sankey diagram depicting the contributions of exceeded components in the water quality evaluation of shallow groundwater in the JB. From the diagram, it can be observed that the main indicators affecting the water quality of shallow groundwater in the JB were sulfate, TH, and TDS. Additionally, Class IV and V waters were also influenced by exceedances of chloride, sodium (Na), pH, nitrate, fluoride, and iron (Fe) to a certain extent.

4.2.2. Comprehensive Evaluation Result

The comprehensive water quality category for each sample is determined based on the worst category from single index evaluation. The comprehensive evaluation results indicate that the overall water quality of shallow groundwater in the JB was relatively poor, with Class IV–V water being predominant. Specifically, Class V water accounted for 70.3%, Class IV water accounted for 16%, and Class II–III water accounted for 13.7%, with no Class I water observed. Figure 6 depicts the spatial distribution of groundwater quality categories in the JB. Class II–III water was sparsely distributed within the region, mainly found in the southwestern part of the Beidahe River Basin oasis, TA, and around the Heihe River channel. Class IV–V water is widely distributed within the region, primarily in the northern part of the Jinta County oasis influenced by the Beidahe River and the northwestern part of the Heihe River impact area. Overall, groundwater quality deteriorates gradually from the southwest to the northeast direction in the JB.

4.2.3. Groundwater Quality Based on EWQI

The results showed that most of the samples were of poor quality (Figure 7). The EWQI value ranges from 33.1 to 3233, with an average value of 222.3. There is no good high-quality water in the study area. The good quality water accounting for 7.7%, which is useful for a variety of applications. The medium-grade water accounting for 26.9%, which is within the recommended drinking range [23]. The poor-grade water accounting for 15.4%, is unsuitable for drinking purposes [24]. The severely poor water accounting for 50%, which is absolutely not recommended for drinking purposes [24]. The distribution of water quality categories is basically consistent with the results of the comprehensive evaluation method.

4.3. Hydrochemical Origin Analysis

4.3.1. Analysis of Main Ion Sources in Groundwater Hydrochemistry

(1)
Water–rock Model
The characteristics of ion content in groundwater are jointly affected by multiple factors such as atmospheric precipitation, temperature, and surface lithology, which are also related to the regional hydrogeological environment [28,29]. Typically, Gibbs diagrams [30] are used to study the impact of water–rock interactions on groundwater chemistry, with three main categories of main formation mechanisms that control water chemistry: precipitation, evaporation, and rock weathering [26,31].
By analyzing groundwater samples from the JB using Gibbs diagrams, it was found that nearly 92% of the groundwater sample points in the JB fell within the range of TDS between 500 and 10,000 mg·L−1. In addition, most of the pore water points in the BIA and HIA fell into the rock weathering control zone and evaporative concentration control zone (Figure 8), which indicated that the primary ion composition of groundwater in the BIA and HIA was mainly controlled by rock weathering and evaporative concentration. However, most of the pore water points in the TA fell into the rock weathering control zone, suggesting that the primary ion composition of groundwater in the TA was mainly controlled by rock weathering. All gathered pore water samples from the different areas were far from the atmospheric precipitation control zone, indicating that the contribution of atmospheric precipitation to the primary ion composition of pore water in the study area was relatively small.
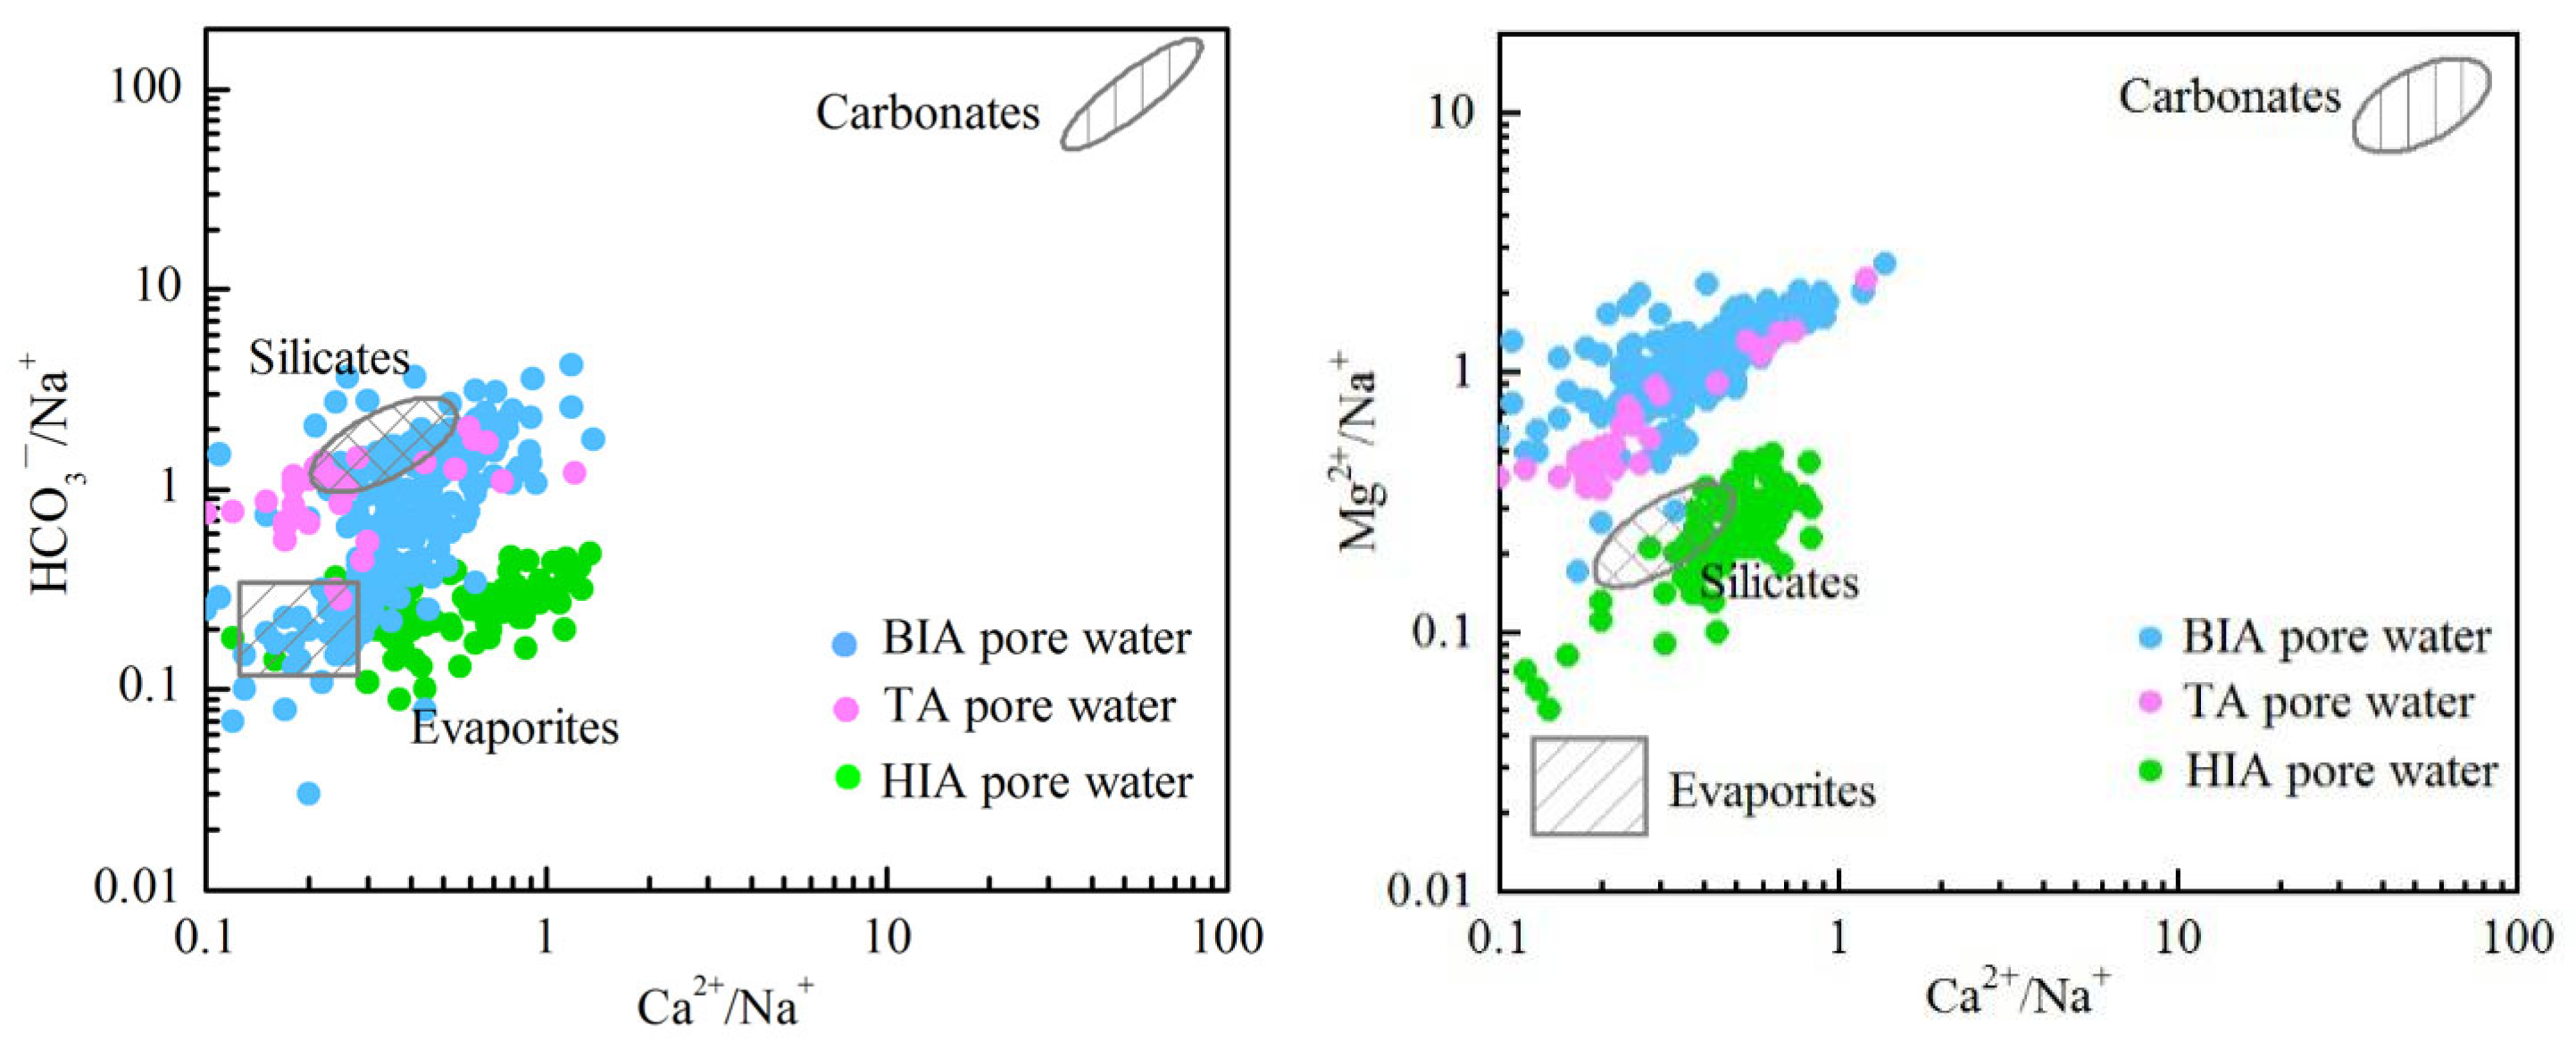
The molar concentration ratio relationships of Ca2+/Na+, Mg2+/Na+, and HCO3/Na+ in groundwater are commonly used to study the origin of ions in groundwater [26,28,29]. As shown in Figure 9, pore water samples in the BIA and TA were mainly located the action interval of the silicate rocks, with a few samples extending in the direction of both action intervals of carbonate rocks and evaporite rocks. Combined with the hydrogeological condition and lithologic characteristics in and around the BIA and TA, we can draw a preliminary conclusion that the formation of groundwater chemical characteristics in the BIA and TA is mainly related to the filtration and dissolution of silicate rocks, while carbonate rocks and evaporite rocks also contribute to some extent. Meanwhile, pore water samples in the HIA were mainly located the action interval of the silicate rocks and evaporite rocks, suggesting that the composition of pore water in the HIA was primarily influenced by the filtration and dissolution of silicate rocks and evaporite rocks.
(2)
Cation Exchange
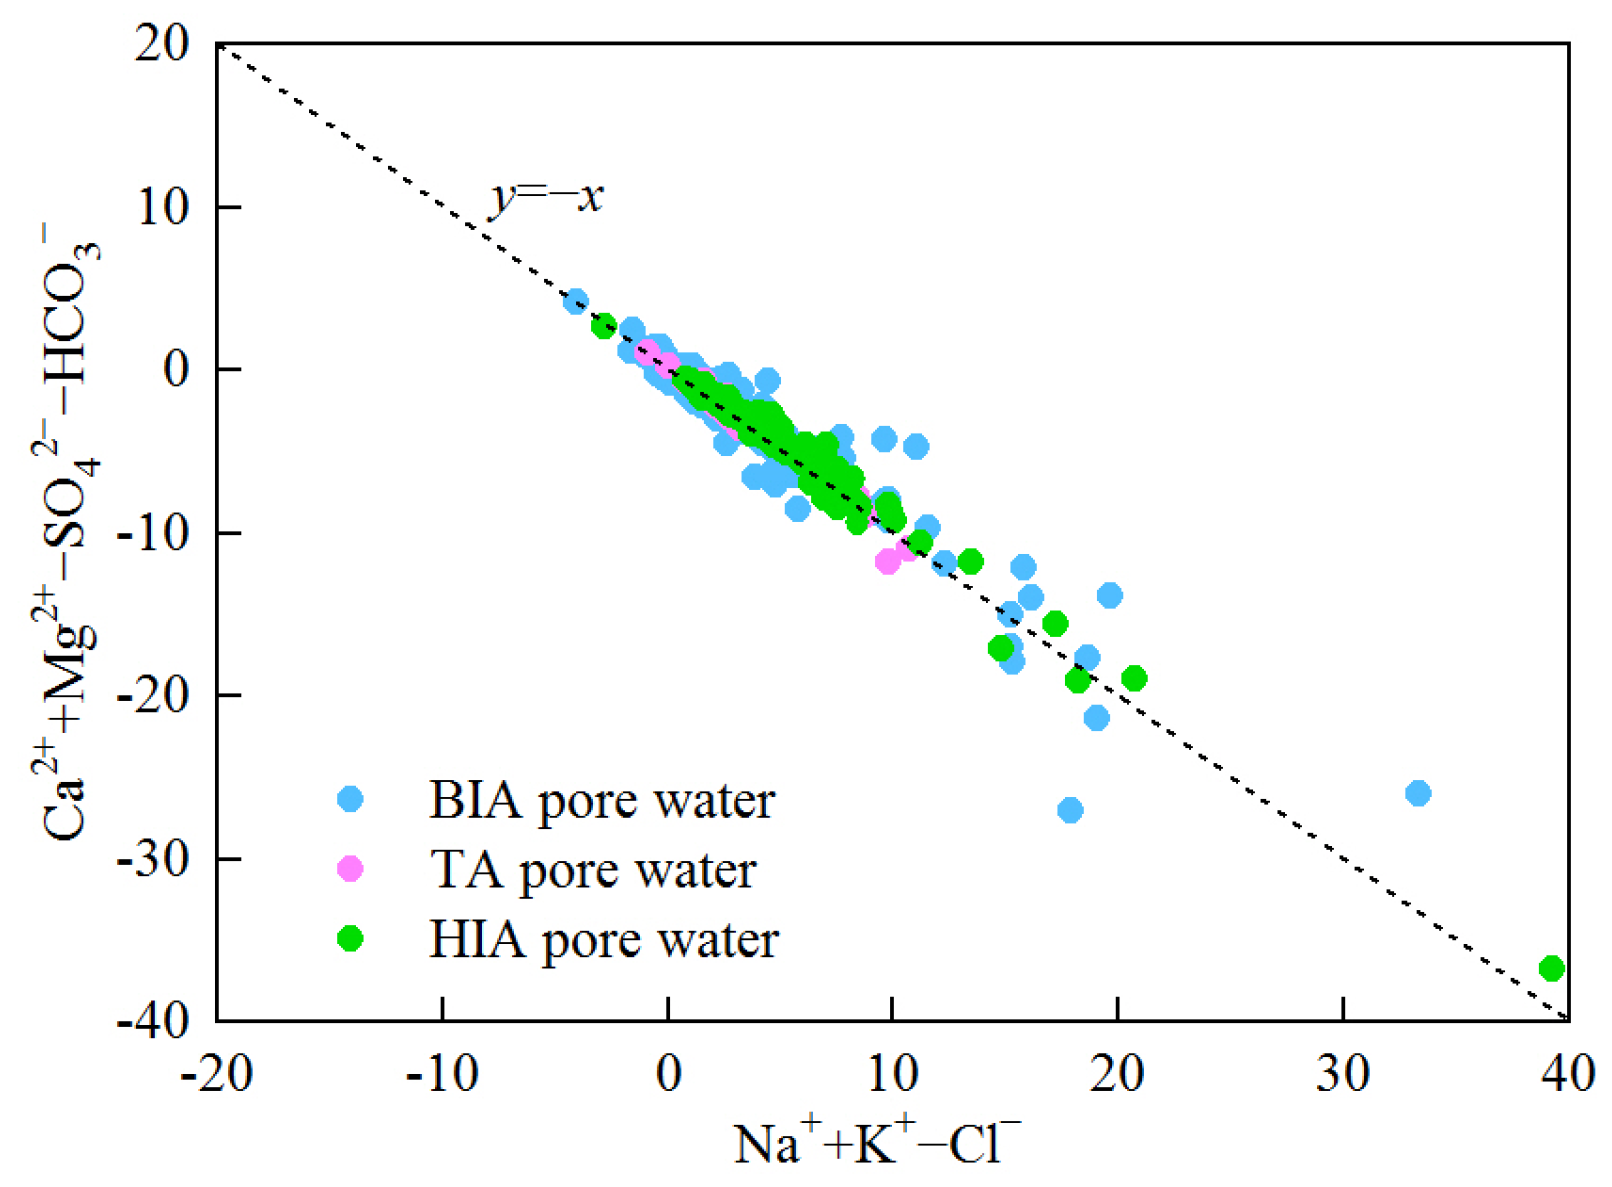
In the long-term interaction process between groundwater and subsurface geological formation lithology, cation exchange adsorption plays a significant role in the formation and evolution of groundwater chemical compositions [32], which is generally reflected using the linear relationship between (Ca2+ + Mg2+ − SO42− − HCO3) and (Na+ + K+ − Cl). If the ration of its linear relationship is around −1, it indicates that cation exchange is an important factor affecting the main composition characteristics of groundwater [33,34]. In the groundwater of the JB, there was a strong correlation between (Ca2+ + Mg2+ − SO42− − HCO3) and (Na+ + K+ − Cl), with most pore water sample points distributed along the y/x= −1 line (Figure 10). This indicated the presence of some cation exchange activity in the groundwater system in the region.
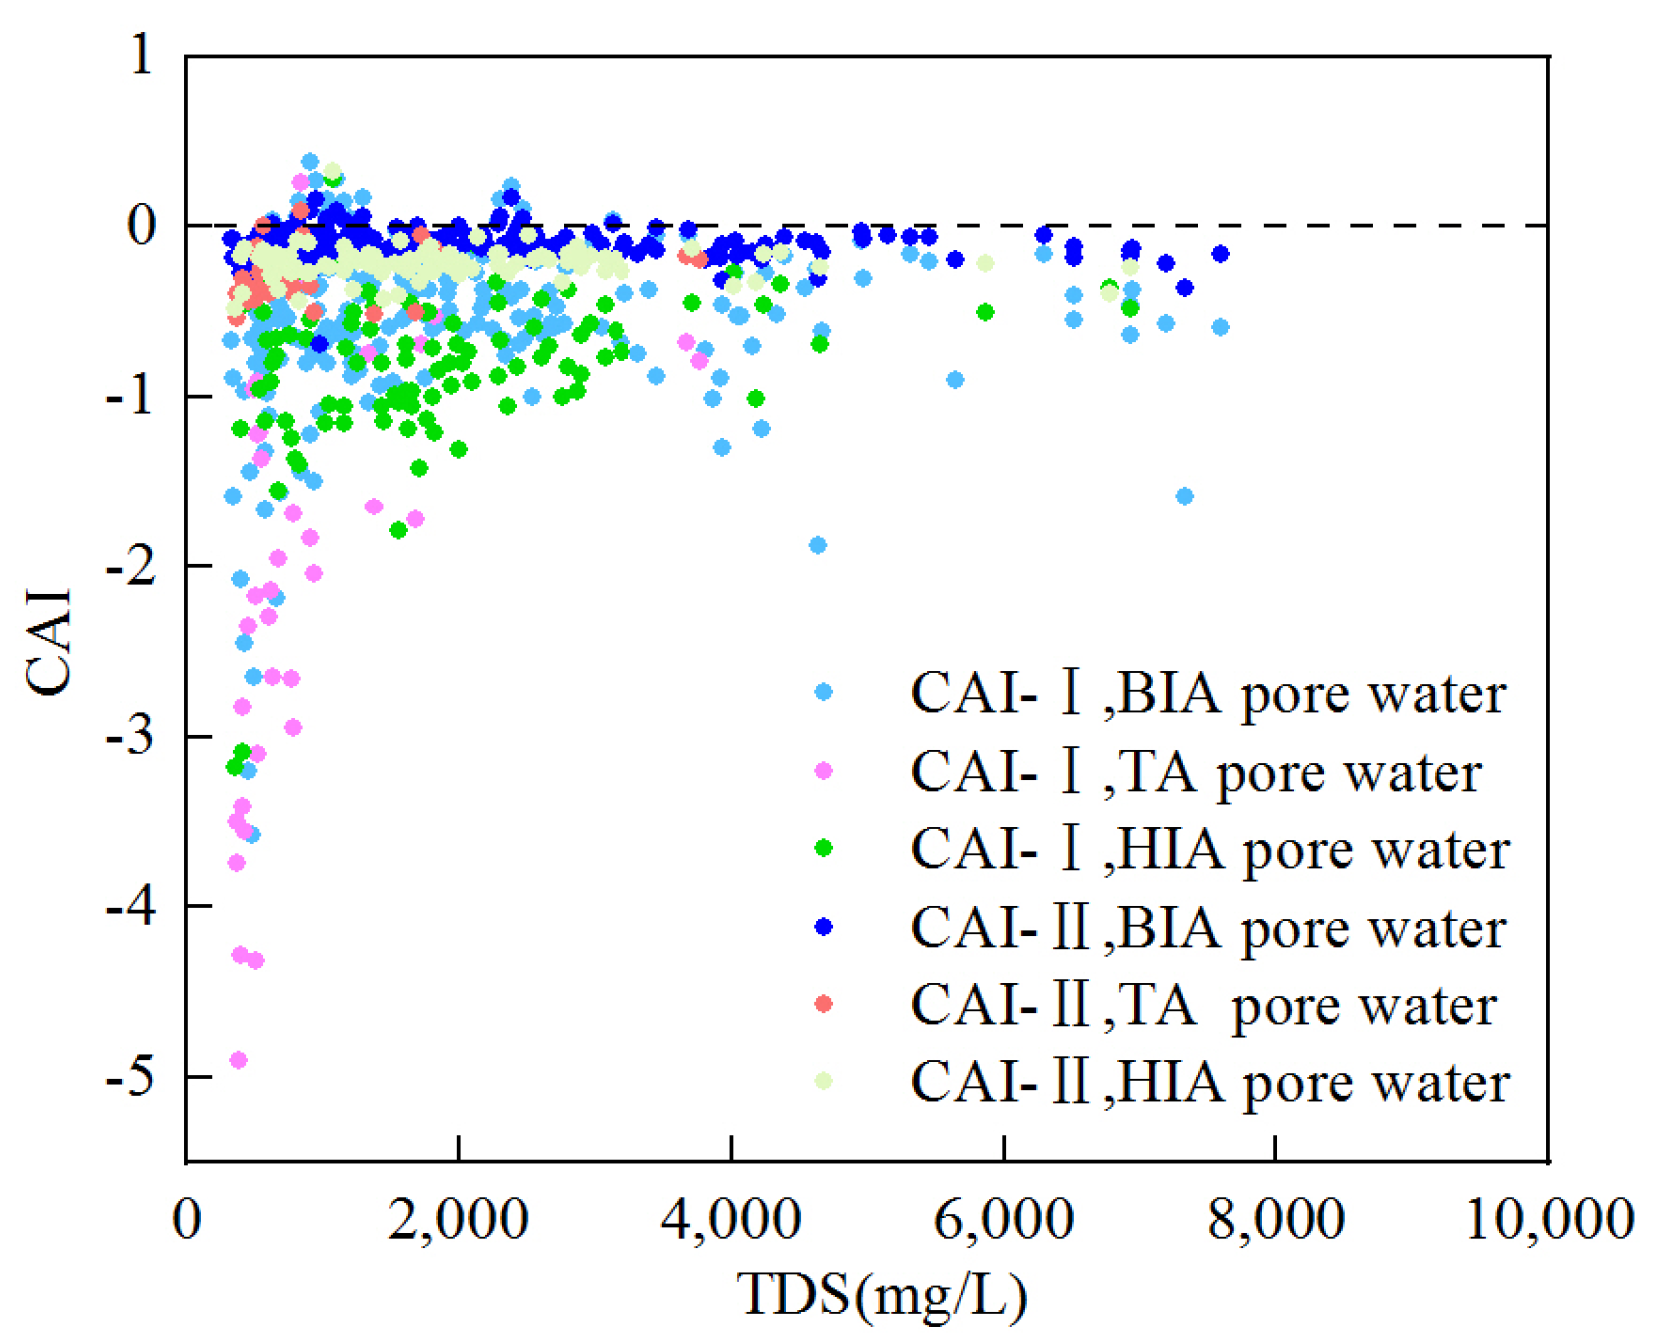
Further, the direction and intensity of cation exchange can be identified using the chlor-alkali index (CAI) [35,36,37]. The calculation methods of CAI-Ⅰ and CAI-Ⅱ are shown in the Equations (4) and (5). Generally, when Ca2+ and Mg2+ in groundwater exchange with Na+ and K+ adsorbed on the surfaces of aquifer particles, positive cation exchange occurs, resulting in negative values for CAI-Ⅰ and CAI-Ⅱ. Conversely, CAI-Ⅰ and CAI-Ⅱ values will be positive when the opposite exchange occurs [26]. As shown in Figure 11, 94.5% of groundwater sample points had negative CAI values, indicating that positive cation exchange was the primary process occurring in the groundwater system in the JB. This process led to an increase in Na+ and K+ concentrations in the groundwater while decreasing the concentrations of Ca2+ and Mg2+.
CAI-Ⅰ = (Cl − Na+ − K+)/Cl
CAI-Ⅱ = (Cl − Na+ − K+)/(SO42− + HCO3 + CO32− + NO3)
(3)
Analysis of Main Ion Sources in Groundwater Hydrochemistry
The ratio relationships between ions are often used to reveal the sources of ions in groundwater and hydrogeochemical processes [37,38]. The ratio of (Na+ + K+) to Cl can be used to determine the primary sources of Na+ and K+ in groundwater. When dissolution of rock salt occurs, the value of (Na+ + K+)/Cl = 1, whereas when weathering of silicate rock occurs, the value of (Na+ + K+)/Cl > 1 [37,39]. As observed in Figure 12a, most of the pore water sample points in the region fell above the rock salt dissolution line, and the majority of sample points deviated significantly from the (Na+ + K+)/Cl = 1 line. This indicated that groundwater in the JB was not only influenced by rock salt dissolution but also strongly influenced by silicate rock weathering processes.
The main sources of Ca2+ and Mg2+ in natural groundwater are typically the weathering of carbonate rocks and silicate rocks, as well as the dissolution of evaporite rocks (such as gypsum). Therefore, the sources of Ca2+, Mg2+, HCO3, and SO42− in groundwater are usually analyzed using the ratio relationship of (Ca2+ + Mg2+) to (HCO3 + SO42−). If HCO3, SO42−, Ca2+, and Mg2+ in groundwater all originate from the weathering of carbonate rocks and the dissolution of evaporite minerals, the groundwater sample points should distribute along the (Ca2+ + Mg2+)/(HCO3 + SO42−) = 1 line [40]. As seen in Figure 12b, most groundwater sample points distributed along the (Ca2+ + Mg2+)/(HCO3 + SO42−) = 1 line, indicating that in the region, HCO3, SO42−, Ca2+, and Mg2+ in groundwater primarily originated from the weathering and dissolution of carbonate rocks and evaporite rocks. However, some groundwater sample points distributed below the (Ca2+ + Mg2+)/(HCO3 + SO42−) = 1 line, suggesting the need for additional cations such as Na+ and K+ to balance the anions. This indicated that positive cation exchange was also occurring in the region simultaneously [38].
The Mg2+/Ca2+ to HCO3 ratio model is commonly used to analyze the contribution of the weathering and dissolution of carbonate minerals (calcite and dolomite) to the major constituents of groundwater [35,41]. When only dolomite dissolves in groundwater, Mg2+/Ca2+ = 1. When only calcite dissolves in groundwater, Mg2+/Ca2+ = 0. While when both minerals participate in dissolution, Mg2+/Ca2+ = 0.5 [42]. In Figure 12c, all the groundwater sampling points distributed above the Mg2+/Ca2+ = 0.5 line, indicating that dolomite was the primary mineral component involved in the dissolution of carbonate rocks in the JB.
(Ca2+ + Mg2+)/HCO3 and SO42−/HCO3 ratios are generally used to analyze the involvement of carbonate and sulfate in the dissolution of carbonate rocks in groundwater. When only carbonate involves in the dissolution of carbonate rocks, (Ca2+ + Mg2+)/HCO3 = 1, and SO42−/HCO3 = 0 [43]. When only sulfate involves in the dissolution of carbonate rocks, SO42−/HCO3 = 1, and (Ca2+ + Mg2+)/HCO3 = 2 [44,45]. As shown in Figure 12d, most groundwater sampling points in the region were located above (Ca2+ + Mg2+)/HCO3 = 2 and were distributed along the gypsum dissolution line. This indicated that sulfate played a significantly larger role than carbonate in the dissolution of carbonate minerals in groundwater.

4.3.2. Chemical Controlling Mechanisms in Groundwater

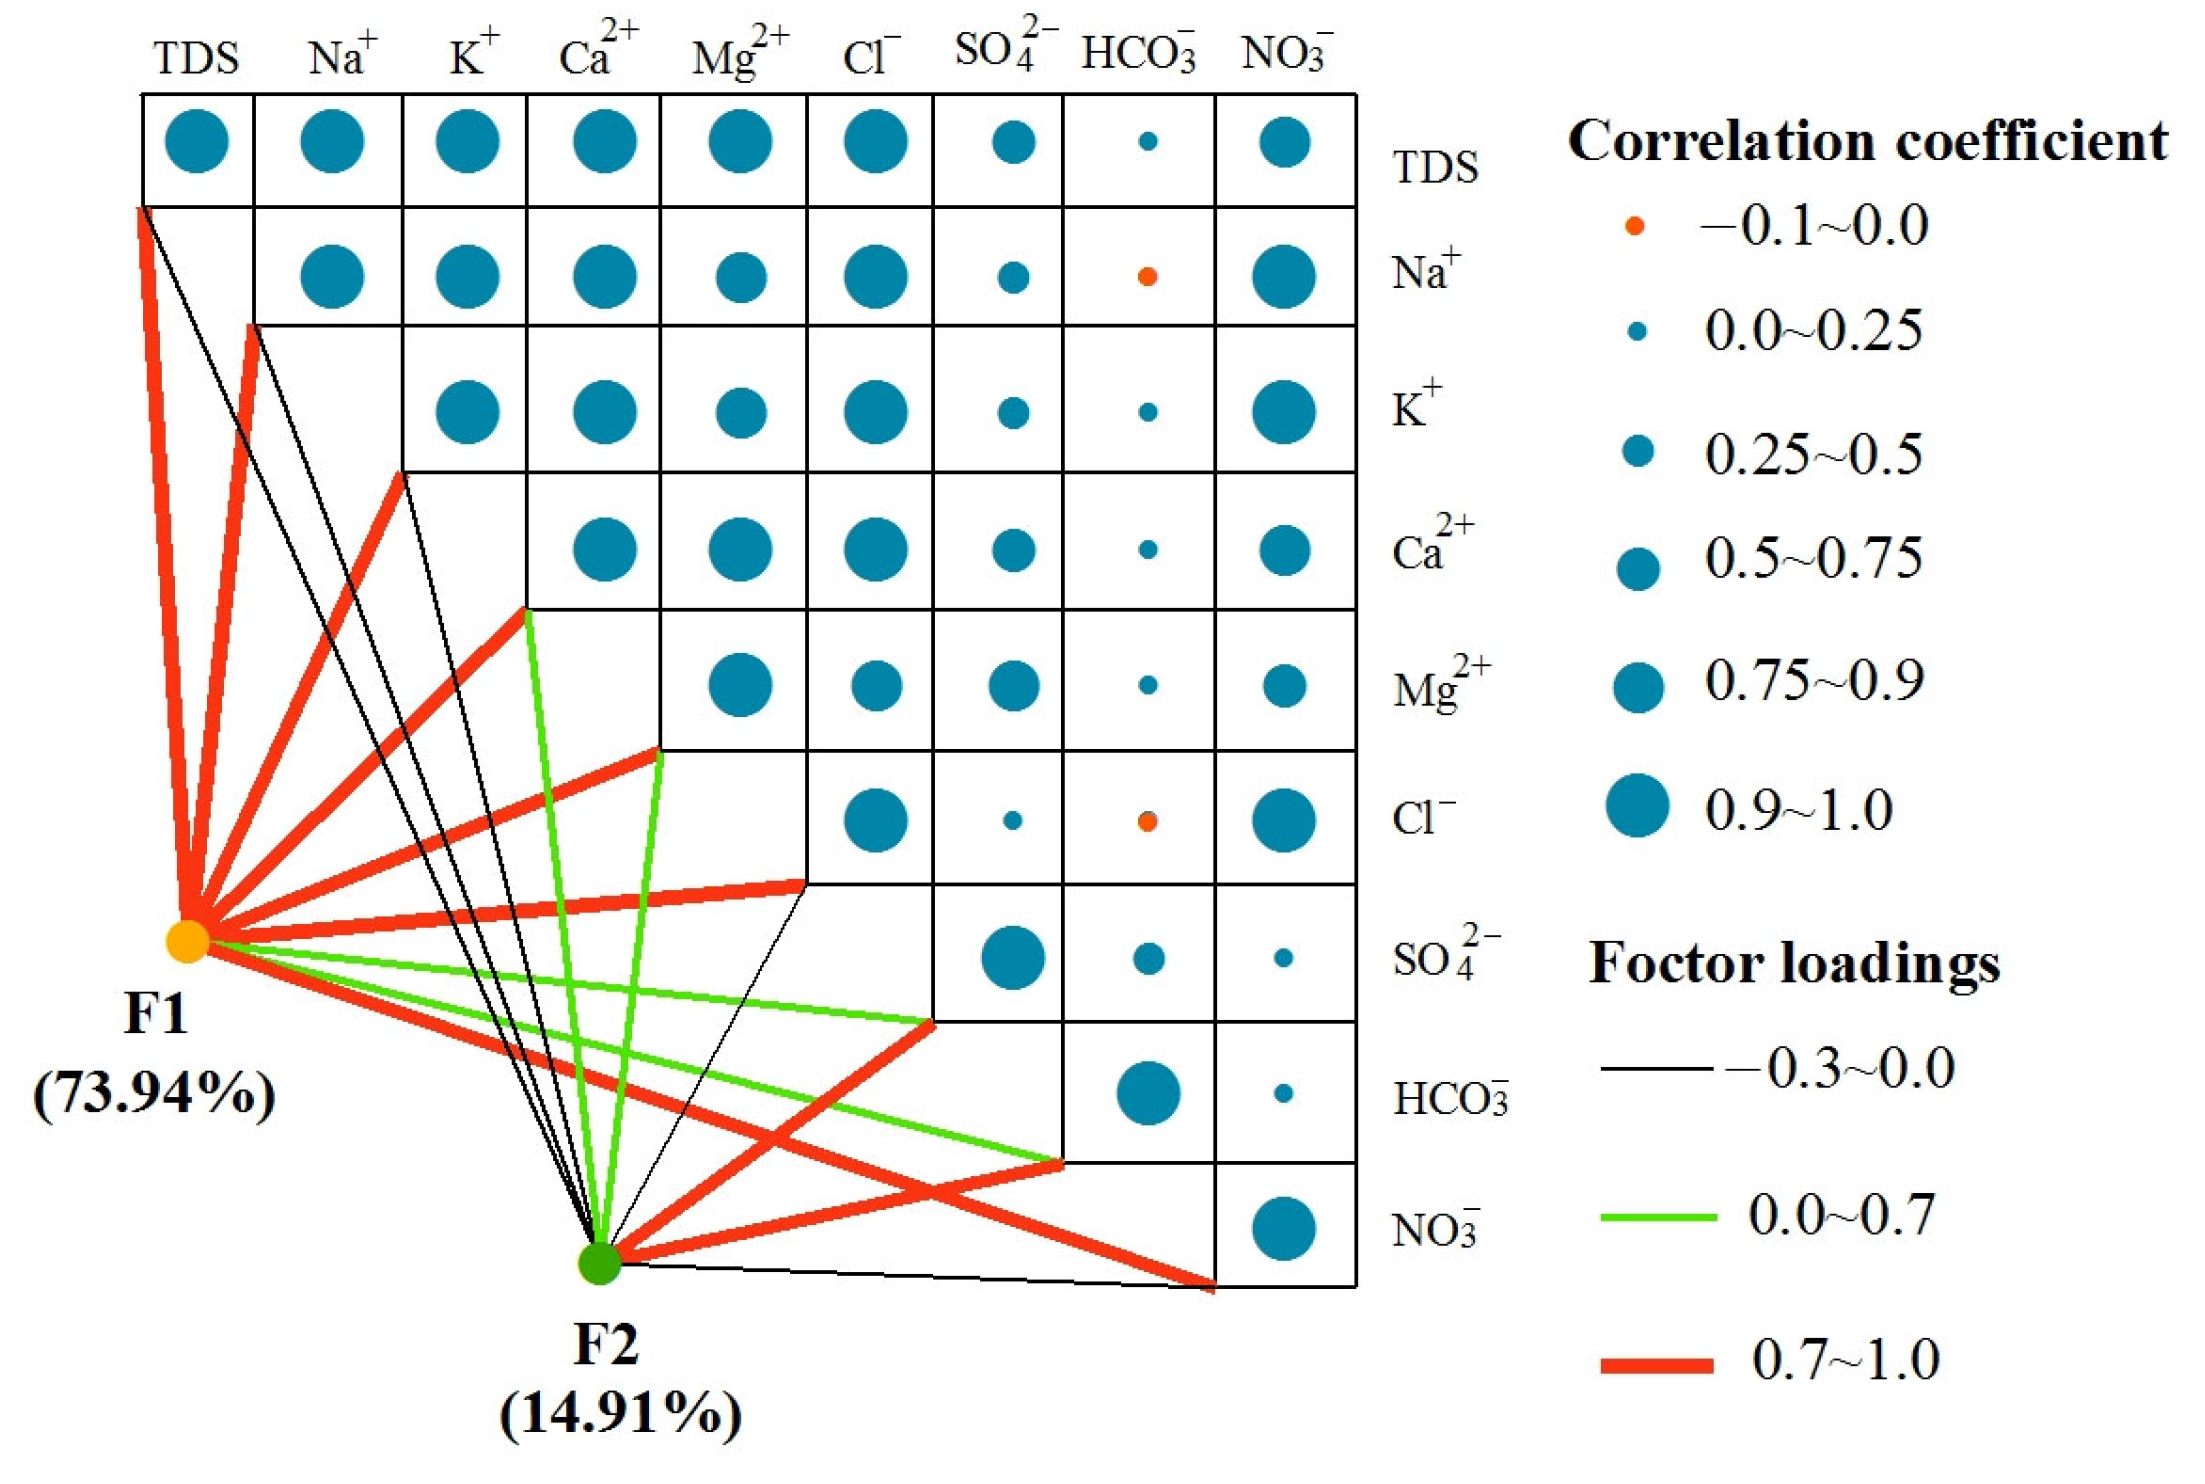
Pearson correlation analysis combined with factor analysis is commonly used to study the relationships between variables and to further extract relevant variables to explain the controlling factors and their impact on groundwater chemical characteristics [46,47,48,49]. In this study, nine indicators including TDS, K+, Na+, Ca2+, Mg2+, Cl, SO42−, HCO3, and NO3 were selected to analyze the correlations between major ions in shallow pore water in the JB. The result was shown in Figure 11. The correlation analysis revealed significant positive correlations (p < 0.01) between TDS and Na+, K+, Ca2+, Mg2+, Cl, and NO3, with correlation coefficients all above 0.75, indicating that these ions were major contributors to TDS. Especially, the correlation coefficients of Na+, K+, Ca2+, Mg2+, and Cl were larger than 0.90, suggesting a substantial contribution of these ions to TDS. There were also significant positive correlations (p < 0.01) between Na+ and K+, Ca2+, Mg2+, and Cl, with correlation coefficients all above 0.75. This indicated that these six ions might have a common source, primarily from the dissolution of silicate rocks such as sodium feldspar, potassium feldspar, and evaporite salts like gypsum, mirabilite, and rock salt [50].
The variance contribution of F1 was 73.94%, making it the primary influencing factor for the chemical composition of shallow pore water in the region. For F1, the main loads were Ca2+, Mg2+, K+, Na+, Cl, NO3, and TDS. The region was rich in silicate minerals (such as potassium feldspar, sodium feldspar, and mica) and evaporite minerals (such as gypsum) [51]. Furthermore, silicate and evaporite rocks weathering and dissolution played a major controlling role in groundwater circulation. During groundwater runoff, TDS values increased continuously due to groundwater filtration and evaporation. Na+, K+, and Cl ions gradually became the major components in groundwater during the runoff process. The higher factor loadings of Ca2+ and Mg2+ were likely due to the significant contribution of calcite to the dissolution of carbonate rocks in the region. NO3 can indirectly reflect the degree of human impact on groundwater [47]. The study area was characterized by frequent agricultural activities, and nitrogen-containing fertilizers, pesticides, as well as untreated human and livestock excrement and sewage, could have an impact on groundwater. In the BIA, around Jinta County and major townships with dense populations, as well as in the Dingxin and Hangtian townships in the HIA, NO3 had a more significant impact on groundwater [19]. Therefore, F1 represented the processes of leaching, evaporative concentration, as well as the influence of anthropogenic activities on groundwater.
The variance contribution of F2 was 14.91%, and the main loads were SO42− and HCO3. In the region, SO42− and HCO3 in the groundwater primarily originated from the weathering and dissolution of sulfate rock minerals and carbonate rock minerals. Therefore, F2 represented the processes of sulfate rock and carbonate rock minerals weathering and dissolution.

5. Conclusions

The hydrochemical characteristics of groundwater in JB, Northwest China, were analyzed using Piper diagram, Gibbs plot, ion ratio relationship and factor analysis. At the same time, the water quality was evaluated by multiple methods. The main conclusions are summarized below.
(1)
In the shallow groundwater of the JB, the main cations were Na+ and Mg2+, the main anions were SO42− and Cl. The ranges of TDS in the BIA, the TA, and the HIA were 328.4–12,400 mg·L−1, 372.70–3774.0 mg·L−1, and 366.30–75,200.0 mg·L−1, respectively. Overall, the groundwater in the region was weakly alkaline.
(2)
The chemical types of shallow pore water in the JB were mainly HCO3·SO4-Mg type, SO4·HCO3-Mg type, SO4-Mg·Na type, SO4·Cl-Na·Mg type, and Cl-Na type. The groundwater chemistry in the BIA and the HIA was primarily controlled by a combination of rock weathering and evaporative concentration processes. While in the TA, it was mainly controlled by rock weathering processes. The major ions in the groundwater in the JB originated from the weathering and dissolution of silicate and carbonate minerals. Na+ and K+ were mainly derived from the dissolution of silicate rocks, while SO42−, HCO3, Mg2+, and Ca2+ mainly came from the weathering of carbonate rocks like calcite and the dissolution of sulfate minerals. Furthermore, alternate cation adsorption processes were widespread in the groundwater.
(3)
Overall, the water quality of shallow groundwater in the JB was poor, with Class IV-V water being predominant. The EWQI value classified the groundwater as good (7.7%), medium (26.9%), poor (15.4%), and severely poor (50%). There was no good high-quality water in the study area. The good and medium quality water accounted for 34.6%, which were within the recommended drinking range. The poor and severely poor water accounted for 65.4%, which were unsuitable for drinking purposes. The results show that sulfate, TH, TDS, chloride, and Na were the main influencing factors of poor water quality.
(4)
The results of correlation analysis and factor analysis showed that the chemical characteristics of shallow groundwater in the JB were primarily influenced by two controlling factors: F1 (leaching, evaporative concentration, and anthropogenic activities) and F2 (sulfate rock and carbonate rock dissolution), with contribution rates of 73.94% and 14.91%, respectively.
According to the research results, in order to promote the ecological groundwater environment balance in the JB, it is necessary to further strengthen the monitoring of groundwater quality in the region, continue to optimize the development and utilization of regional groundwater resources and strengthen the protection of groundwater environment of the JB.

Author Contributions

Conceptualization, X.W. (Xiaoyan Wang) and M.Z.; methodology, X.W. (Xiaoyan Wang) and S.W.; validation, D.Y. and S.W.; investigation, D.Y. and H.C.; writing—original draft preparation, X.W. (Xiaoyan Wang); writing—review and editing, X.W. (Xiaoyan Wang) and S.H.; project administration, X.W. (Xi Wu) and Y.A.; funding acquisition, X.W. (Xiaoyan Wang) and S.H. All authors have read and agreed to the published version of the manuscript.

Funding

This research was funded by the National Key R&D Program of China (2022YFC2503001) and Geological survey projects of China Geological Survey (DD20230077 and 12120114018401).

Data Availability Statement

Data are contained within the article.

Acknowledgments

We thank Yinzhu Zhou, Tao Zhang, and Tao Ma for their valuable advice and guidance during the writing of this paper.

Conflicts of Interest

The authors declare no conflict of interest.

References

  1. Li, W.; Hao, A. The formation and evolution model of groundwater and its significance in inland arid basin, northwest China. Hydrogeol. Eng. Geol. 1999, 26, 28–32. [Google Scholar]
  2. Guo, X.; Feng, Q.; Liu, W.; Li, Z.; Wen, X.; Si, J.; Xi, H.; Guo, R.; Jia, B. Stable isotopic and geochemical identification of groundwater evolution and recharge sources in the arid Shule River Basin of Northwestern China. Hydrol. Process. 2015, 29, 4703–4718. [Google Scholar] [CrossRef]
  3. Ren, C.; Zhang, Q. Groundwater chemical characteristics and controlling factors in a region of northern China with intensive human activity. Int. J. Environ. Res. Public Health 2020, 17, 9126. [Google Scholar] [CrossRef] [PubMed]
  4. Xiao, Y.; Zhang, J.; Long, A.; Xu, S.; Guo, T.; Gu, X.; Deng, X.; Zhang, P. Hydrochemical characteristics and formation mechanism of quaternary groundwater in Baoshan Basin, western Yunnan, China. Water 2023, 15, 2736. [Google Scholar] [CrossRef]
  5. Jiang, L.; Yao, Z.; Liu, Z.; Wang, R.; Wu, S. Hydrochemistry and its controlling factors of rivers in the source region of the Yangtze River on the Tibetan Plateau. J. Geochem. Explor. 2015, 155, 76–83. [Google Scholar] [CrossRef]
  6. Gong, Z.; Tian, X.; Fu, L.; Niu, H.; Xia, Z.; Ma, Z.; Chen, J.; Zhou, Y. Chemical characteristics groundwater in Chahannur Basin. Water 2023, 15, 1524. [Google Scholar] [CrossRef]
  7. Yidana, S.; Bawoyobie, P.; Sakyi, P.; Fynn, O. Evolutionary analysis of groundwater flow: Application of multivariate statistical analysis to hydrochemical data in the Densu Basin, Ghana. J. Afr. Earth Sci. 2018, 138, 167–176. [Google Scholar] [CrossRef]
  8. Pazand, K.; Khosravi, D.; Ghaderi, M. Identification of the hydrogeochemical processes and assessment of groundwater in a semi-arid region using major ion chemistry: A case study of Ardestan basin in Central Iran. Groundw. Sustain. Dev. 2018, 6, 245–254. [Google Scholar] [CrossRef]
  9. Wu, X.; An, Y.; Wei, S.; Yin, D.; Cui, H.; Wang, X.; Wang, X. Hydrochemical characteristics and evolution of shallow groundwater in Dingxin valley, lower reaches of Heihe River. J. Arid Land Res. Environ. 2021, 35, 103–109. [Google Scholar]
  10. Wang, W.; Li, W.; Cai, Y.; An, Y.; Shao, X.; Wu, X.; Yin, D. The hyrogeochemical evolution of groundwater in the middle reaches of the Heihe River Basin. Earth Sci. Front. 2021, 28, 184–193. [Google Scholar]
  11. Kreins, P.; Henseler, M.; Anter, J.; Herrmann, F.; Wendland, F. Quantification of climate change impact on regional agricultural irrigation and groundwater demand. Water Resour. Manag. 2015, 29, 3585–3600. [Google Scholar] [CrossRef]
  12. Hao, A.; Kang, W.; Li, Z. The aquiferʾs capability of regulating water resources in Zhangye Basin, Hexi Corridor, Gansu Province, China. Earth Sci. Front. 2010, 17, 208–214. [Google Scholar]
  13. Guler, C.; Thyne, G. Hydrologic and geologic factors controlling surface and groundwater chemistry in Indian Wells-Owens Valley area, southeastern California, USA. J. Hydrol. 2004, 285, 177–198. [Google Scholar] [CrossRef]
  14. Ma, R.; Shi, J.; Liu, J.; Gui, C. Combined use of multivariate statistical analysis and hydrochemical analysis for groundwater quality evolution: A case study in North Chain Plain. J. Earth Sci. 2014, 25, 587–597. [Google Scholar] [CrossRef]
  15. Wang, D.; Zhang, L.; Pei, L.; Li, X.; Yang, Y.; Chen, Z.; Liang, L. Chemical characteristics and controlling factors of shallow groundwater in the lower reaches of Changhua River Basin, HainanIsland, China. Water 2023, 15, 3508. [Google Scholar] [CrossRef]
  16. He, S.; Ge, S. The change of underground water in Jinta Yuanyangchi Irrigation area and its influence on the environment. J. Dessert Res. 1986, 6, 37–51. [Google Scholar]
  17. Li, S. Study on Water Resources Carrying Capacity and Regulation Model in Jinta Basin. Ph.D. Thesis, Lanzhou University, Lanzhou, China, 2017. [Google Scholar]
  18. He, J.; Fu, S.; Ma, J.; Zhang, Q. Groundwater recharge and geochemical evolution in quaternary aquifer of Beidahe River watershed. J. Desert Res. 2011, 31, 1630–1638. [Google Scholar]
  19. Zhou, K.; Ma, J.; Wei, G.; Zhu, X. Geochemical characteristics and evolution of groundwater in Jiuquan-Jinta Basin. J. Lanzhou Univ. Nat. Sci. 2009, 45, 31–36. [Google Scholar]
  20. Zhang, Q.; Zhang, Y.; Zhao, Y.; Ma, J. Geochemical evolution of groundwater and hydrogeochemical modeling in Jinta Basin. Arid Land Geogr. 2011, 34, 772–778. [Google Scholar]
  21. Wang, X.; Han, S.; Zhang, M.; Yin, D.; Wu, X.; An, Y. Hydrochemical characteristics and control factors of groundwater in Yuanyangchi Irrigation area, Jinta Basin. Environ. Sci. 2024, 45, 866–878. [Google Scholar] [CrossRef]
  22. GB/T 14848-2017; Standard for Groundwater Quality. Standardization Administration of the People’s Republic of China: Beijing, China, 2017.
  23. Adimalla, N. Application of the entropy weighted water quality index (EWQI) and the pollution index of groundwater (PIG) to assess groundwater quality for drinking purposes: A case study in a rural area of Telangana State, India. Arch. Environ. Contam. Toxicol. 2021, 80, 31–40. [Google Scholar] [CrossRef] [PubMed]
  24. Zhang, T.; Wang, P.; He, J.; Liu, D.; Wang, M.; Wang, M.; Xia, S. Hydrochemical characteristics, water quality, and evolution of groundwater in Northeast China. Water 2023, 15, 2669. [Google Scholar] [CrossRef]
  25. Wang, M.; Zhang, W.; Yang, P.; Feng, J.; Zhang, R.; Gao, Z.; Jin, H.; Song, X.; Gao, X. Hydrogeochemical characteristics, water quality, and human health risks of groundwater in Wulian, North China. Water 2023, 15, 359. [Google Scholar] [CrossRef]
  26. Zhang, M.; Han, S.; Wang, Y.; Wang, Z.; Li, H.; Wang, X.; Liu, J.; Li, C.; Gao, Z. Characteristics and controlling factors of groundwater hydrochemistry in Dongzhi Tableland area of the Loess Plateau of eastern Gansu—A case study of Ning County area, north China. Water 2022, 14, 3601. [Google Scholar] [CrossRef]
  27. He, J.; Zhang, Y.; Zhao, Y.; Han, S.; Liu, Y.; Zhang, T. Hydrochemical characteristics and possible controls of groundwater in the Xialatuo Basin Section of the Xianshui River. Environ. Sci. 2019, 40, 1236–1244. [Google Scholar]
  28. Fan, B.; Zhao, Z.; Tao, F.; Liu, B.; Tao, Z.; Gao, S.; Zhang, L. Characteristics of carbonate, evaporite and silicate weathering in Huanghe River basin: A comparison among the upstream, midstream and downstream. J. Asian Earth Sci. 2014, 96, 17–26. [Google Scholar] [CrossRef]
  29. Gao, Z.; Li, Q.; Liu, J.; Su, Q. Hydrochemical characterizations and groundwater quality assessment in the coastal region of the Jiaodong peninsula, North China. Mar. Pollut. Bull. 2023, 196, 115596. [Google Scholar] [CrossRef] [PubMed]
  30. Gibbs, R. Mechanisms controlling world water chemistry. Science 1970, 170, 1088–1090. [Google Scholar] [CrossRef]
  31. Andres, M.; Paul, S. Groundwater chemistry and the Gibbs Diagram. Appl. Geochem. 2018, 97, 209–212. [Google Scholar]
  32. Shen, Z.; Zhu, W.; Zhong, Z. Fundamentals of Hydrogeochemistry, 1st ed.; Geological Publishing House: Beijing, China, 1993; pp. 45–51. [Google Scholar]
  33. Mohammed, A.; Refaee, A.; El-Din, G.; Harb, S. Hydrochemical characteristics and quality assessment of shallow groundwater under intensive agriculture practices in arid region, Qena, Egypt. Appl. Water Sci. 2022, 12, 92. [Google Scholar] [CrossRef]
  34. Xiao, J.; Jin, Z.D.; Wang, J.; Zhang, F. Hydrochemical characteristics, controlling factors and solute sources of groundwater within the Tarim River Basin in the extreme arid region, NW Tibetan Plateau. Quat. Int. 2015, 380–381, 237–246. [Google Scholar] [CrossRef]
  35. Dong, W.H.; Meng, Y.; Wang, Y.S.; Wu, X.C.; Lü, Y.; Zhao, H. Hydrochemical characteristics and formation of the shallow groundwater in Fujin, Sanjiang Plain. J. Jilin Univ. Earth Sci. Ed. 2017, 47, 542–553. [Google Scholar]
  36. Thakur, T.; Rishi, M.S.; Naik, P.K.; Sharma, P. Elucidating hydrochemical properties of groundwater for drinking and agriculture in parts of Punjab, India. Environ. Earth Sci. 2016, 75, 1–15. [Google Scholar] [CrossRef]
  37. Shao, Y.; Yan, B.; Liu, L.; Yu, X.; Feng, G.; Zhang, K.; Gong, K. Hydrochemical characteristics and quality evaluation of irrigation and drinking water in Bangong Co Lake Watershed in northwest Tibetan Plateau. Water 2023, 15, 2655. [Google Scholar] [CrossRef]
  38. Zhang, J.; Shi, Z.; Wang, G.; Jiang, J.; Yang, B. Hydrochemical characteristics and evolution of groundwater in the Dachaidan area, Qaidam Basin. Earth Sci. Front. 2021, 28, 194–205. [Google Scholar]
  39. Mukherjee, A.; Fryar, A. Deeper groundwater chemistry and geochemical modeling of the arsenic affected western Bengal basin, west Bengal, India. Appl. Geochem. 2008, 23, 863–894. [Google Scholar] [CrossRef]
  40. Ma, R.; Wang, Y.; Sun, Z.; Zheng, C.; Ma, T.; Prommer, H. Geochemical evolution of groundwater in carbonate aquifers in Taiyuan, northern China. Appl. Geochem. 2011, 26, 884–897. [Google Scholar] [CrossRef]
  41. Liu, J.; Gao, Z.; Zhang, Y.; Sun, Z.; Sun, T.; Fan, H.; Wu, B.; Li, M.; Qian, L. Hydrochemical evaluation of groundwater quality and human health risk assessment of nitrate in the largest peninsula of China based on high-density sampling: A case study of Weifang. J. Clean. Prod. 2021, 322, 129164. [Google Scholar] [CrossRef]
  42. Pu, J.; Yuan, D.; Xiao, Q.; Zhao, H. Hydrogeochemical characteristics in karst subterranean streams: A case history from Chongqing, China. Carb. Evaporite 2015, 30, 307–319. [Google Scholar] [CrossRef]
  43. Yang, X.; Jia, C.; Yang, F.; Yang, H.; Yao, Y. Spatio-temporal variation of groundwater pollution in urban wetlands and management strategies for zoning. J. Environ. Manag. 2023, 342, 118318. [Google Scholar] [CrossRef]
  44. Huang, Q.; Qin, X.; Liu, P.; Zhang, L.; Su, C. Influence of sulfuric acid to karst hydrochemical and δ13CDIC in the upper and middle reaches of the Wujiang River. Environ. Sci. 2015, 36, 3220–3229. [Google Scholar]
  45. Wang, P.; Jin, M.; Lu, D. Hydrogeochemistry characteristics and formation mechanism of shallow groundwater in Yongcheng City, Henan Province. Earth Sci. 2020, 45, 2232–2244. [Google Scholar]
  46. Yang, W.; Zhao, Y.; Wang, D.; Wu, H.; Lin, A.; He, L. Using principal components analysis and IDW Interpolation to determine spatial and temporal changes of surface water quality of Xin’anjiang River in Huangshan, China. Int. J. Environ. Res. Public Health 2020, 17, 2942. [Google Scholar] [CrossRef] [PubMed]
  47. Yin, Z.; Luo, Q.; Wu, J.; Xu, S.; Wu, J. Identification of the long-term variations of groundwater and their governing factors based on hydrochemical and isotopic data in a river basin. J. Hydrol. 2020, 592, 125604. [Google Scholar] [CrossRef]
  48. Gang, S.; Jia, T.; Deng, Y.; Xing, L.; Gao, S. Hydrochemical characteristics and formation mechanism of groundwater in Qingdao City, Shandong Province, China. Water 2023, 15, 1348. [Google Scholar] [CrossRef]
  49. Liu, C.; Yu, K.; Zhang, Y.; Jing, J.; Liu, J. Characteristics and driving mechanisms of shallow groundwater chemistry in Xining City. Environ. Sci. 2023, 44, 3228–3236. [Google Scholar]
  50. Yang, X.C.; Shen, Z.L.; Wen, D.G.; Hou, G.C.; Zhao, Z.H.; Wang, D. Hydrochemical characteristics and sources of sulfate in groundwater of the Ordos Cretaceous Groundwater Basin. Acta Geosci. Sin. 2008, 29, 553–562. [Google Scholar]
  51. Chen, J.L. Hydrochemical Characteristics and Its Evolution Modeling of Groundwater in Jinta Basin, Gansu. Ph.D. Thesis, Lanzhou University, Lanzhou, China, 2019. [Google Scholar]
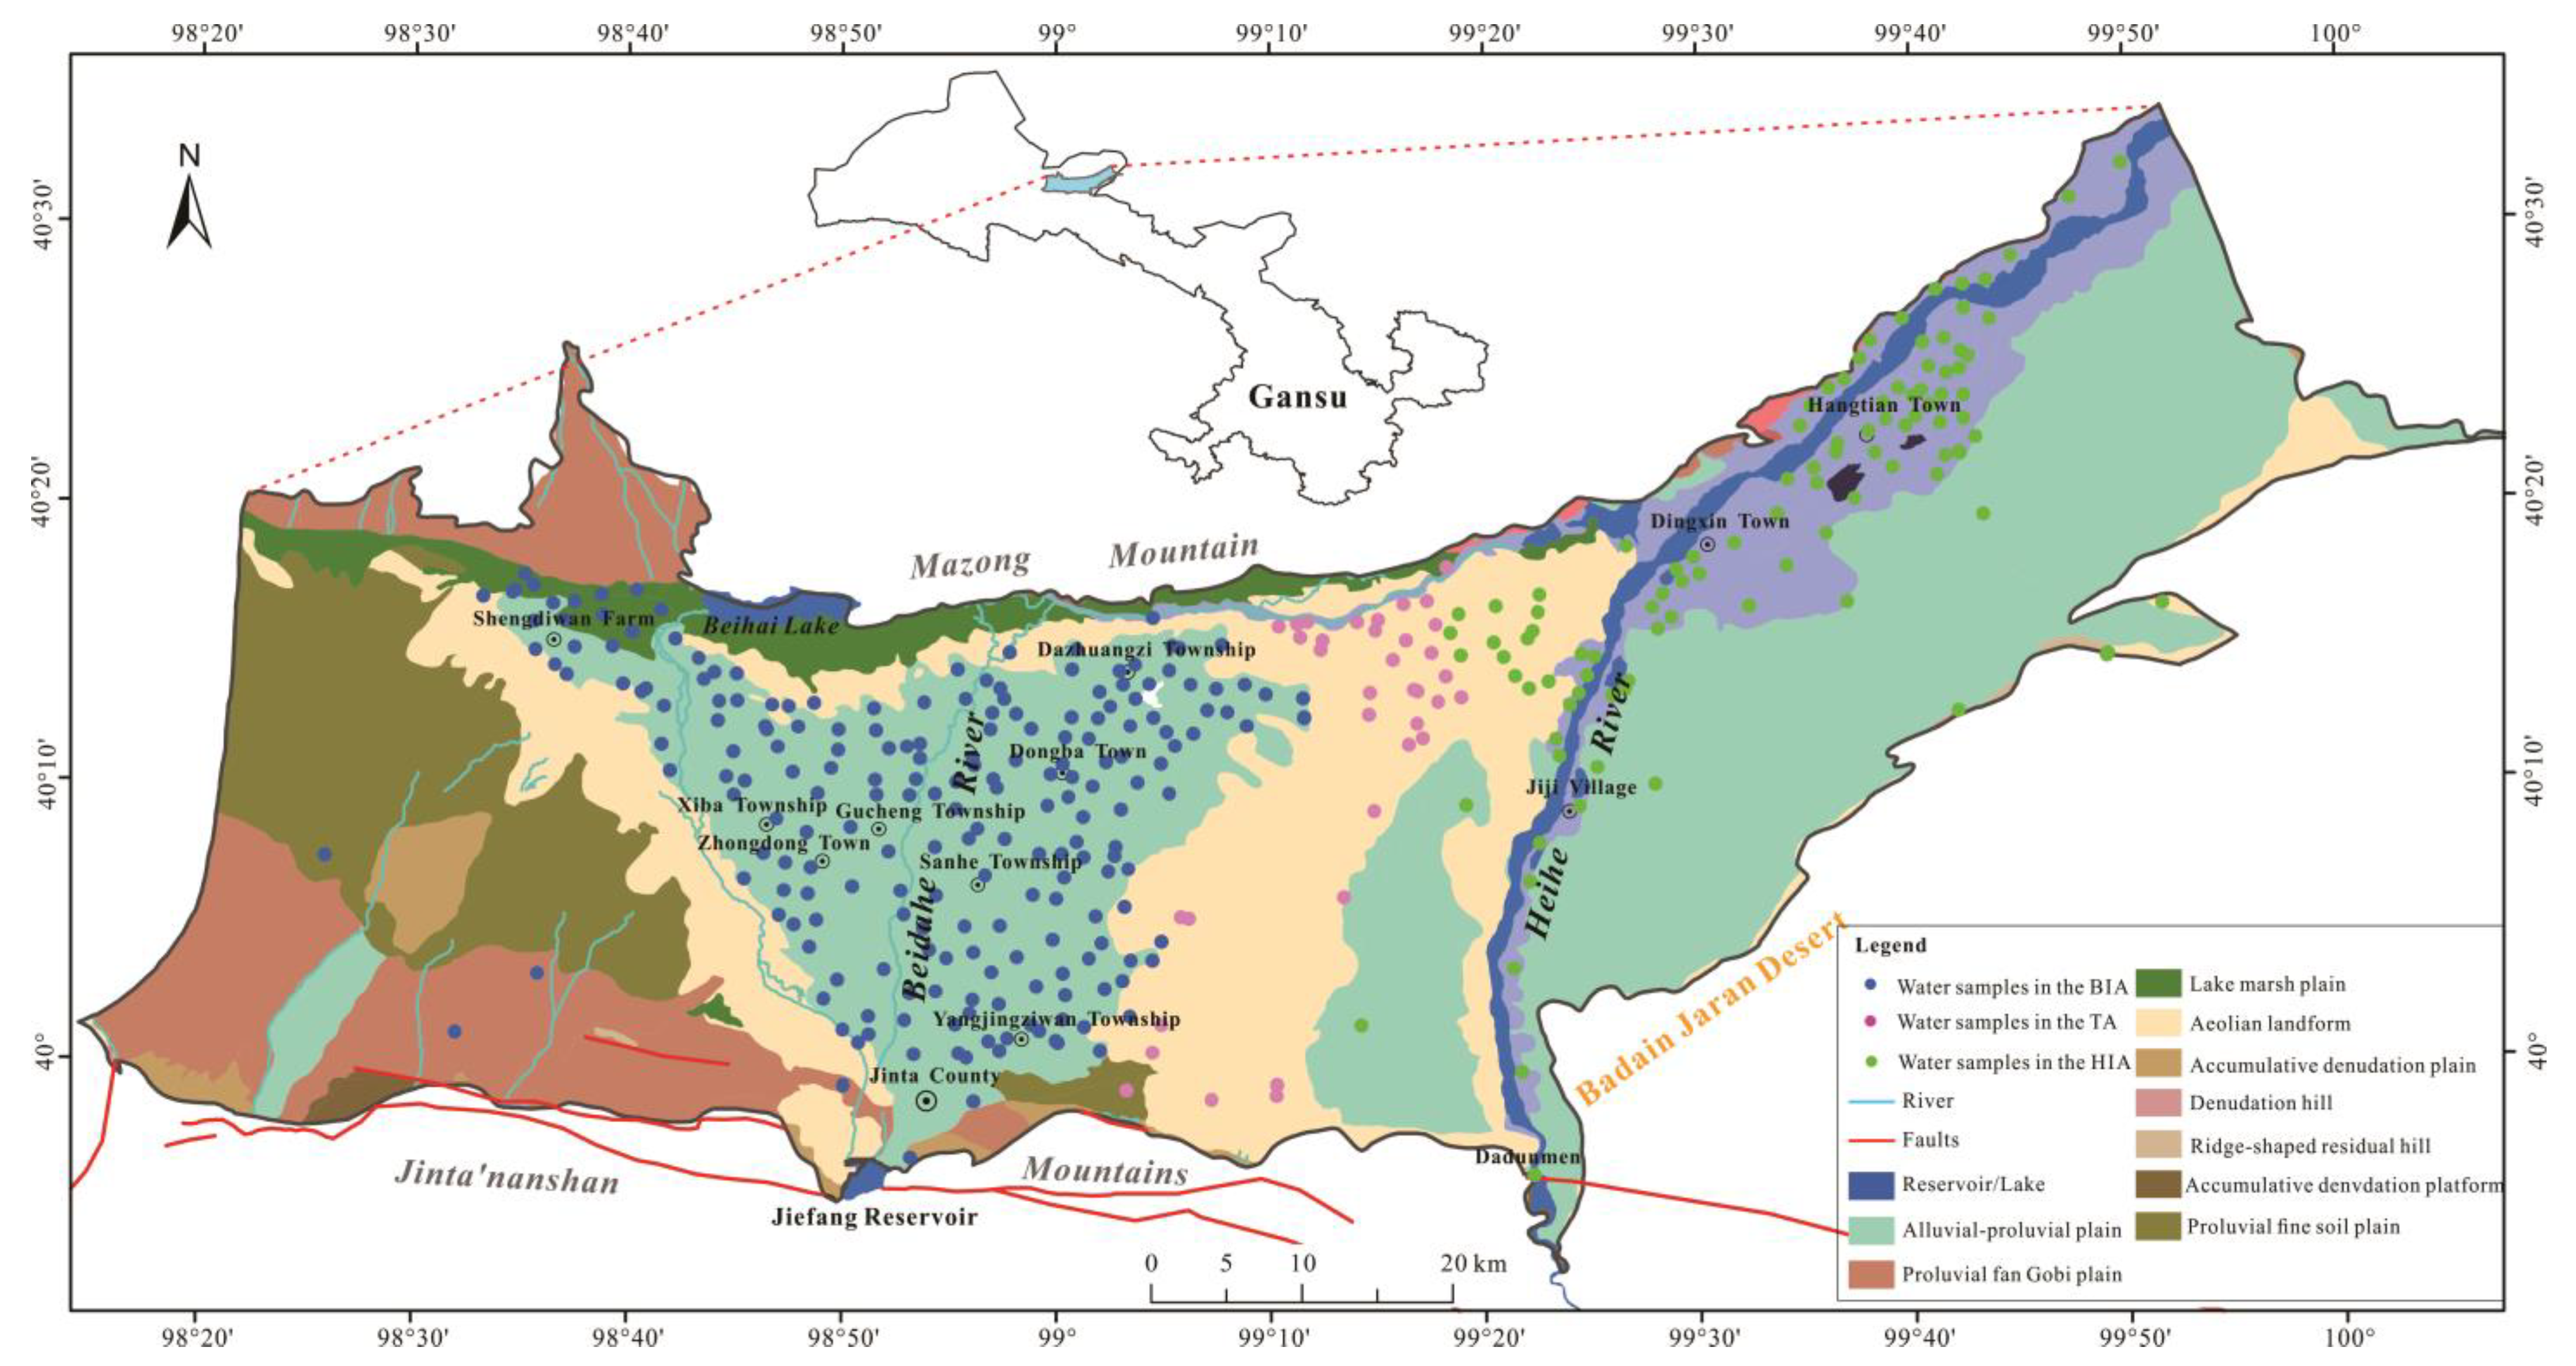
Figure 1. Distribution of groundwater sampling locations of the JB.
Water 15 04171 g001
Figure 2. Hydrogeological profile for the study area.
Water 15 04171 g002
Figure 3. Map of the water table and flow direction in the study area.
Water 15 04171 g003
Figure 4. Piper trilinear diagram of groundwater.
Water 15 04171 g004
Figure 5. The Sankey diagram of decisive indicators’ contributions in groundwater quality evaluation (Class III, IV, and V).
Water 15 04171 g005
Figure 6. Spatial distribution of groundwater quality categories in the JB.
Water 15 04171 g006
Figure 7. Spatial distribution of groundwater quality based on EWQI.
Water 15 04171 g007
Figure 8. Gibbs diagrams of groundwater hydrochemistry TDS vs. Cl/(Cl+HCO3) (a) TDS vs. Na+/(Na++ Ca2+) (b).
Water 15 04171 g008
Figure 9. Plots of HCO3/Na+ versus Ca2+/Na+ and Mg2+/Na+ versus Ca2+/Na+.
Water 15 04171 g009
Figure 10. Plot of relationship between Mg2+ + Ca2+ − SO42− − HCO3 and Na+ − Cl in groundwater.
Water 15 04171 g010
Figure 11. Relationship between CAI and TDS of groundwater.
Water 15 04171 g011
Figure 12. Relationship between ion concentrations of groundwater (a) N(Na+ + K+) vs. N(Cl) (b) N(Ca2+ + Mg2+) vs. N(HCO3 + SO42−) (c) N(Mg2+)/N(Ca2+) vs. N(HCO3) (d) N(Ca2+ + Mg2+)/N(HCO3) vs. N(SO42−)/N(HCO3).
Water 15 04171 g012
Figure 13. Identify the correlations between ions by combining correlation analysis and factor analysis.
Water 15 04171 g013
Table 1. Statistics of test methods and parameters in the laboratory.
IndexTest MethodRelative Deviation of Precision (%)Detection Limit (mg/L)
Ca2+Inductively coupled plasma emission spectrometry1.560.06
Mg2+Inductively coupled plasma emission spectrometry1.020.09
Na+Inductively coupled plasma emission spectrometry0.810.2
K+Inductively coupled plasma emission spectrometry0.000.3
ClIon chromatography0.270.03
SO42−Ion chromatography0.230.07
NO3Ion chromatography0.500.02
HCO3Titration method 5
TDSWeight method1.0210
THEDTA method1.235
Table 2. Statistics of hydrochemical parameters of groundwater (unit: mg/L, except for pH).
TypeParameterpHNa+K+Ca2+Mg2+ClSO42−HCO3NO3THTDS
BIA pore water
(n = 213)
Max8.912023.062.20550.901124.02508.06519.0702.9075.116004.0012,400.0
Min7.2318.403.6023.4014.5017.7093.7068.300.00157.60328.40
Mean7.83234.0814.09121.48218.27257.851072.1290.799.711202.012088.46
SD0.33267.249.5186.20181.46297.331051.399.8011.91946.551867.54
CV4.22114.1767.5070.9683.14115.3198.0634.32122.6978.7589.42
TA pore water
(n = 36)
Max8.99492.4034.70218.00360.40436.102077.0402.7016.061972.003774.0
Min7.2143.503.4013.4026.4019.10106.60150.100.00158.10372.70
Mean8.00130.087.8753.2577.5788.12404.15239.903.70452.34902.49
SD0.43112.885.6947.4874.8599.78457.4355.283.79424.06794.52
CV5.3786.7872.3089.1696.50113.23113.1823.04102.5393.7588.04
HIA pore water
(n = 101)
Max9.0220,360.0475.02885.03317.044,210.04262.0907.901018.020,860.075,200
Min7.1444.003.2018.9025.2026.20110.0036.600.00150.60366.30
Mean7.64537.9820.55150.08183.63771.38868.77376.7240.201130.822776.96
SD0.362037.4549.23284.72331.124394.93692.58185.44107.102063.427485.0
CV4.71378.72239.6189.71180.32569.7579.7249.22266.39182.47269.54
Note: Min is the minimum value, Max is the maximum value, Mean is the Mean, SD is the standard deviation, and CV (%) is the coefficient of variation.
Table 3. The number and rate of exceeding the standard of indicators of the groundwater in the JB.
SulfateTHTDSChlorideNapHFluorideNitrateFe
The number of over standard (group)285232117756115442
The rate of over standard (%)81.4366.2933.4321.4317.434.291.141.140.57
Disclaimer/Publisher’s Note: The statements, opinions and data contained in all publications are solely those of the individual author(s) and contributor(s) and not of MDPI and/or the editor(s). MDPI and/or the editor(s) disclaim responsibility for any injury to people or property resulting from any ideas, methods, instructions or products referred to in the content.