Article

Groundwater Hydrogeochemical Processes and Potential Threats to Human Health in Fengfeng Coal Mining Area, China

1
Chinese Academy of Geological Sciences, Beijing 100037, China
2
School of Resources and Environmental Engineering, Hefei University of Technology, Hefei 230009, China
3
Hebei Province Collaborative Innovation Center for Sustainable Utilization of Water Resources and Optimization of Industrial Structure, Hebei GEO University, Shijiazhuang 050031, China
4
School of Environmental Studies, China University of Geosciences, Wuhan 430074, China
5
Center for Hydrogeology and Environmental Geology Survey, CGS, Baoding 071051, China
*
Author to whom correspondence should be addressed.
These authors contributed equally to this work.
Water 2023, 15(22), 4024; https://doi.org/10.3390/w15224024
Submission received: 23 October 2023 / Revised: 13 November 2023 / Accepted: 17 November 2023 / Published: 20 November 2023
(This article belongs to the Special Issue Soil-Groundwater Pollution Investigations)

Abstract

:
The Fengfeng mining area is in the transition zone between the North China Plain and the Taihang Mountains, and groundwater is the main source of water supply in the district. Under the combined influence of human activities and natural geological conditions, the quality of different types of groundwater varies greatly, posing a potential threat to the safety of drinking water. In this study, hydrogeochemical processes in different types of groundwater were analyzed using multivariate statistical analysis methods with ion–ratio relationships, and a groundwater quality and health risk assessment model was developed. The research findings show that the main chemical components and TDS in the groundwater have obvious spatial distribution characteristics, i.e., the content of deep karst water (DKW) in the west is significantly lower than that of shallow pore water (SPW) in the east, and the hydrochemical type has changed from HCO3–Ca to SO4–Ca. The chemical components of SPW and DKW are mainly derived from silicates and carbonates, accompanied by weathering dissolution of sulphidic minerals, especially SPW. The chemical components of the groundwater was also influenced by the cation exchange reaction and human activities. The quality of the SPW was significantly worse than that of the DKW, and the nitrates in SPW carry a high non-carcinogenic risk, especially to children. The shallow pore water is not suitable for drinking water. This study can provide guidance on the safety of drinking water in the Fengfeng coal mining area and other areas with intensive industrial, mining, and agricultural activities.

1. Introduction

As an important component of water resources, groundwater is the main water source for agriculture, industry, mining, and cities. Groundwater environmental problems have become a major issue of global concern. With socio-economic development, the increasing degradation of groundwater quality not only exacerbates water scarcity, but also poses serious threats to human health [1,2,3]. For example, there is a positive correlation between the Mg2+ and Ca2+ content of drinking water and the incidence of kidney stones [4], the nitrate content of drinking water is closely associated with diseases such as vomiting and stomach cancer [5], the arsenic contamination of drinking water in India’s Ganges Plain has caused severe skin diseases [6,7,8], and the high fluorine groundwater in the Loess Plateau area of China seriously restricts the safety of drinking water and social and economic development [9,10]. Therefore, the assessment of groundwater health risks and quality is important for the safety of drinking water.
Under the influence of factors such as rock weathering, aquifer lithology, cation exchange, and human activities, the chemical components of groundwater undergo significant changes during the cycle from the recharge zone to the discharge zone [11,12,13]. The chemical characteristics of groundwater determine its water quality status. The identification of the hydrogeochemical processes involved in the groundwater cycle provides insight into the causes of groundwater quality degradation and is the basis for groundwater quality evaluation.
Groundwater is vital to the Fengfeng coal mining area’s residential life and industrial and agricultural production. Groundwater is the main source of drinking water in the Fengfeng coal mining area [14]. In the last few years, the intensity of human activities such as coal mining, agricultural fertilizers, and domestic sewage discharges has increased, leading to a deterioration of groundwater quality [15,16,17,18]. Previous studies have focused on the characterization and evolutionary mechanisms of karst groundwater chemistry. For example, Liu [19] analyzed the major factors controlling water chemical components in the study area using stable isotopes, and the results showed that the water’s chemical components are influenced by a combination of natural and anthropogenic factors. Hao [20] carried out the evolutionary mechanism of karst water chemistry in this area based on a long series of water quality analysis data (1980–2017), and the results showed that the hydrogeochemical processes varied markedly from period to period. During 1980–1996, the karst water chemistry mainly originated from the dissolution of dolomite and rock salt, while, during 2012–2017, the dissolution of gypsum and other minerals, in addition to the dissolution of dolomite and rock salt, had a greater influence on water chemistry. Wang [21] analyzed the hydrochemical characteristics in this area using machine learning and isotopes, and concluded that the oxidation of sulfurous iron ore in sandstone aquifers is the main factor contributing to the elevated SO42− concentration in groundwater. Gao [22] analyzed the source of groundwater using isotopes such as δ2H, δ18O, and δ34S, and the results showed that the groundwater mainly originated from precipitation and that the high SO42− in the groundwater was mainly related to the dissolution of gypsum. The results of previous research have provided us with guidance in understanding the evolutionary processes of karst water. However, the safety of drinking water quality has been neglected in this area and the potential threats to human health have not been fully elucidated. According to the results of this water quality survey, there is a wide disparity between the quality of shallow pore water (SPW) and deep karst water (DKW), with most SPW being of poor quality, with sulfate, total hardness, and total dissolved solids exceeding the Standards for Groundwater Quality of China (SGQC). Therefore, on the basis of a full analysis of the impact of the human activities and natural geological conditions on the chemical characteristics of different types of groundwaters, the establishment of an assessment model for water quality and human health risks will not only help us to determine the status of the water environment of different types of groundwaters, but also help us to analyze the causes of the deterioration of the groundwater environment.
This study provides an interesting case study because of the wide variation in the quality of different types of groundwater in the Fengfeng mining area in China. Based on 32 sets of groundwater samples, including 15 sets of SPW and 17 sets of DKW, the study is the first to provide a comprehensive analysis of the hydrogeochemistry of the various types of aquifers and the potential threats to human health. The main objectives were to comprehensively identify the hydrogeochemical processes and analyze the main controlling factors of water quality deterioration; on this basis, a water quality evaluation model and a human health risk evaluation model were developed to fully elucidate groundwater quality and its non-carcinogenic risk to children and adults.

2. Materials and Methods

2.1. Study Area

The study area is located in the eastern foothills of the Taihang Mountains, which are the transition zone between the North China Plain and Taihang Mountains, covering an area of 394.09 km2 in the west of Handan City, Hebei Province (Figure 1). The study area has a predominantly East Asian monsoon climate with distinct seasonal characteristics. The mean annual temperature and precipitation in the study area were 13.5 °C and 548.9 mm, respectively, and rainfall was mainly concentrated in the rainy season from June to September. The altitude ranged from 883.0 m above sea level (m.a.s.l.) in the west to 125.5 m.a.s.l. in the east. The eastern part of the study area, on both sides of the Fuyang River, is flat, with mainly villages, farmlands, and coal processing plants, and is the main gathering area for human activities.
The main exposed strata in the study area are Ordovician (O) and Quaternary (Q), and the aquifers include Ordovician limestone aquifer and Quaternary sediments aquifer. The Ordovician limestone aquifer is widely distributed in the western part of the study area, with a lithology of brecciated limestone and thick-layered flower mottled limestone, etc. The groundwater is deeply buried and abundant, and it is also the main water supply layer. Karst groundwater receives recharge from atmospheric precipitation in the western mountains and runs off to the east. The Quaternary sediments aquifer is mainly distributed along the Fuyang River, and the lithology is gravel and sand, with a thickness of 0–60 m, and the groundwater is shallowly buried. The eastern part of the study area (Cishan Town to Pengcheng Town) is rich in coal resources and is the main mining area of the Fengfeng coal mine. The main coal-bearing strata are the Upper Carboniferous Taiyuan Formation and the Lower Permian Shanxi Formation, with a total thickness of 170–250 m, and the mining method is underground coal mining.

2.2. Sampling and Analytical Techniques

The study involved the collection of 32 water samples from pumping wells in September 2022, including 15 SPW and 17 DKW (Figure 1). The sampling depths of the SPW and DKW were 2.82–23.88 m and 110.58–273.72 m, respectively. The sampled wells were production wells for irrigation and domestic supply. Prior to sampling, the well was pumped until water quality parameters such as pH, dissolved oxygen, and electrical conductivity were stable. Total dissolved solids (TDS), temperature, and pH were determined in situ, employing a portable multi-parameter analyzer (DZB-718, Shanghai Yidian Scientific Instruments Co., Ltd., Shanghai, China). The major cations (K+, Na+, Ca2+, and Mg2+) and total hardness (TH) were analyzed using inductively coupled plasma mass spectrometry (ICP-MS, Thermo Fisher Scientific, Waltham, MA, USA). Anions (Cl, SO42−, F, and NO3) were analyzed using ion chromatography. The determination of bicarbonate (HCO3) was carried out using the titration method. To verify the accuracy of the test results, all the water chemistry test results were calculated using ion balance errors [23], and the formula is as follows:
E = c a t i o n s a n i o n s c a t i o n s + a n i o n s × 100 % ,
The concentrations of all cations and anions were expressed in milliequivalents per liter. It was verified that the ion balance errors (E) of all the samples were within the accepted ±10% [24], thus meeting the analytical requirements.

2.3. Objective Combined Weight Water Quality Index (OCWQI)

The objective combination weighting method is a novel approach in water quality assessment that takes into account the consistency and advantages of different weighting methods. The objective combination weighting method is a harmonic optimization of multiple weighting methods, which is more accurate than single weighting. The water quality assessment based on the objective combination weighting method is described as follows [25,26]:
(1) Determination of the entropy weight
Entropy weighting is an objective weighting method widely applied in environmental, astrophysical, and life sciences [27,28]. The proposed method is grounded in information theory, utilizing information entropy to compute the entropy weight for each index. Subsequently, this entropy weight is employed to rectify the weights of individual indices, thereby yielding a more objective measure. The entropy weighting method, however, fails to consider the intercorrelation among indicators. The process of determining weights with the entropy weighting method depends mainly on the decision matrix, which is expressed as follows:
X = x 11 x 12 x 21 x 22 x 1 n x 2 n x m 1 x m 2 x m m ,
y i j = x i j ( x i j ) m i n ( x i j ) m a x ( x i j ) m i n ,
Y = y 11 y 12 y 21 y 22 y 1 n y 2 n y m 1 y m 2 y m m ,
P i j = y i j i = 1 m y i j ,
e j = 1 ln m i = 1 m P i j ln P i j ,
W e j = 1 e j j = 1 n ( 1 e j ) ,
where X represents a data matrix of m water samples and n water quality indicators. Formulas (3) and (4) are the data standardization processing method and the standardization matrix, respectively. Equations (5)–(7) were used for the calculation of the weight, where ej and Wej refer to the information entropy and the entropy weight. For a given indicator, the information entropy (ej) can be used to determine its degree of dispersion. The smaller the information entropy (ej) and the greater the degree of dispersion of the indicator, the greater the entropy weight (Wej), which means that the indicator provides useful information for decision makers.
(2) Calculation of the weight according to the coefficient of variation method
The coefficient of variation method is an objective approach to assigning weights that utilizes the information contained in each indicator and calculates the weight of the indicator directly. The fundamental principle of this method is that indicators with larger value differences are more challenging to attain, and such indicators can better reflect the disparity of the evaluated unit. Therefore, they should be assigned higher weights. The main advantage of the coefficient of variation method is that it eliminates the influence of each index dimension. However, if the index value in the water sample changes only slightly, the calculated weight is not of reference significance. The variation coefficient weight is calculated with [29]:
v j = σ j x ¯ j ,
W c j = v j j = 1 n v j ,
where x ¯ j and σj refer to the mean and standard deviation of xj (j = 1, 2, …, n), respectively, x is the water quality indicators, and n is the sample size. Wcj refers to the weight of the coefficient of variation.
(3) Calculation of objective combined weight
According to the principle of minimum relative information entropy, the difference between two probability distribution functions can be expressed as the difference between the entropy of the two probability distribution functions. Based on this, the deviation function of the combination weights can be constructed as:
m i n F = j = 1 n W o j ( ln W o j ln W e j ) + j = 1 n W o j ( ln W o j ln W c j ) ,
where Woj and F are the objective combined weight and the objective function of the minimum information entropy model, respectively.
The solution can be obtained through the utilization of the Lagrange multiplier method as follows:
W o j = W e j · W c j j = 1 n W e j · W c j ,
This suggests that of all the combination weights taking the geometric mean requires the least amount of information, while all other forms of combination weights add, to some extent, other information that is not actually obtained.
(4) The OCWQI is expressed as:
O C W Q I = j = 1 n W o j C j S j ,
where Cj and Sj represent the measured concentration (mg/L) and the standard limit (mg/L) of the water quality indicators, respectively.
According to OCWQI, groundwater quality is divided into 5 categories [26], as shown in Table 1.

2.4. Human Health Risk Assessment (HHRA) Model

The health risk assessment model, which is based on the harmful effects of different pollutants on human health, is an effective way of assessing the potential harm of pollutants on human health [30,31,32]. The HHRA model recommended by the United States Environmental Protection Agency (USEPA) has been widely used to quantitatively assess the health risks of environmental contaminants. This assessment method consists of four parts: hazard identification, dose–response relationship, exposure assessment, and risk characterization. In this study, nitrates are utilized as the main indicator of risk in drinking water. The US Environmental Protection Agency considers this to be a non-carcinogenic pollutant. The HHRA model is expressed as follows:
H Q = A D D R f D ,
A D D = C P W × I R × E D × E F A B W × A E T ,
where HQ is the non-carcinogenic hazard index (dimensionless), ADD is NO3 [mg/(kg·d)], RfD is the reference dose for non-carcinogens [mg/(kg·d)], CPW is the concentration of contaminants (mg/L), IR is the amount of water consumed per unit time (L/day), ED is the exposure duration (year), EF is the exposure frequency (days/year), ABW is the average weight of the person (kg), and AET is the average exposure time (days). Table 2 lists the values of the related parameters [30].

3. Results

3.1. Descriptive Statistics

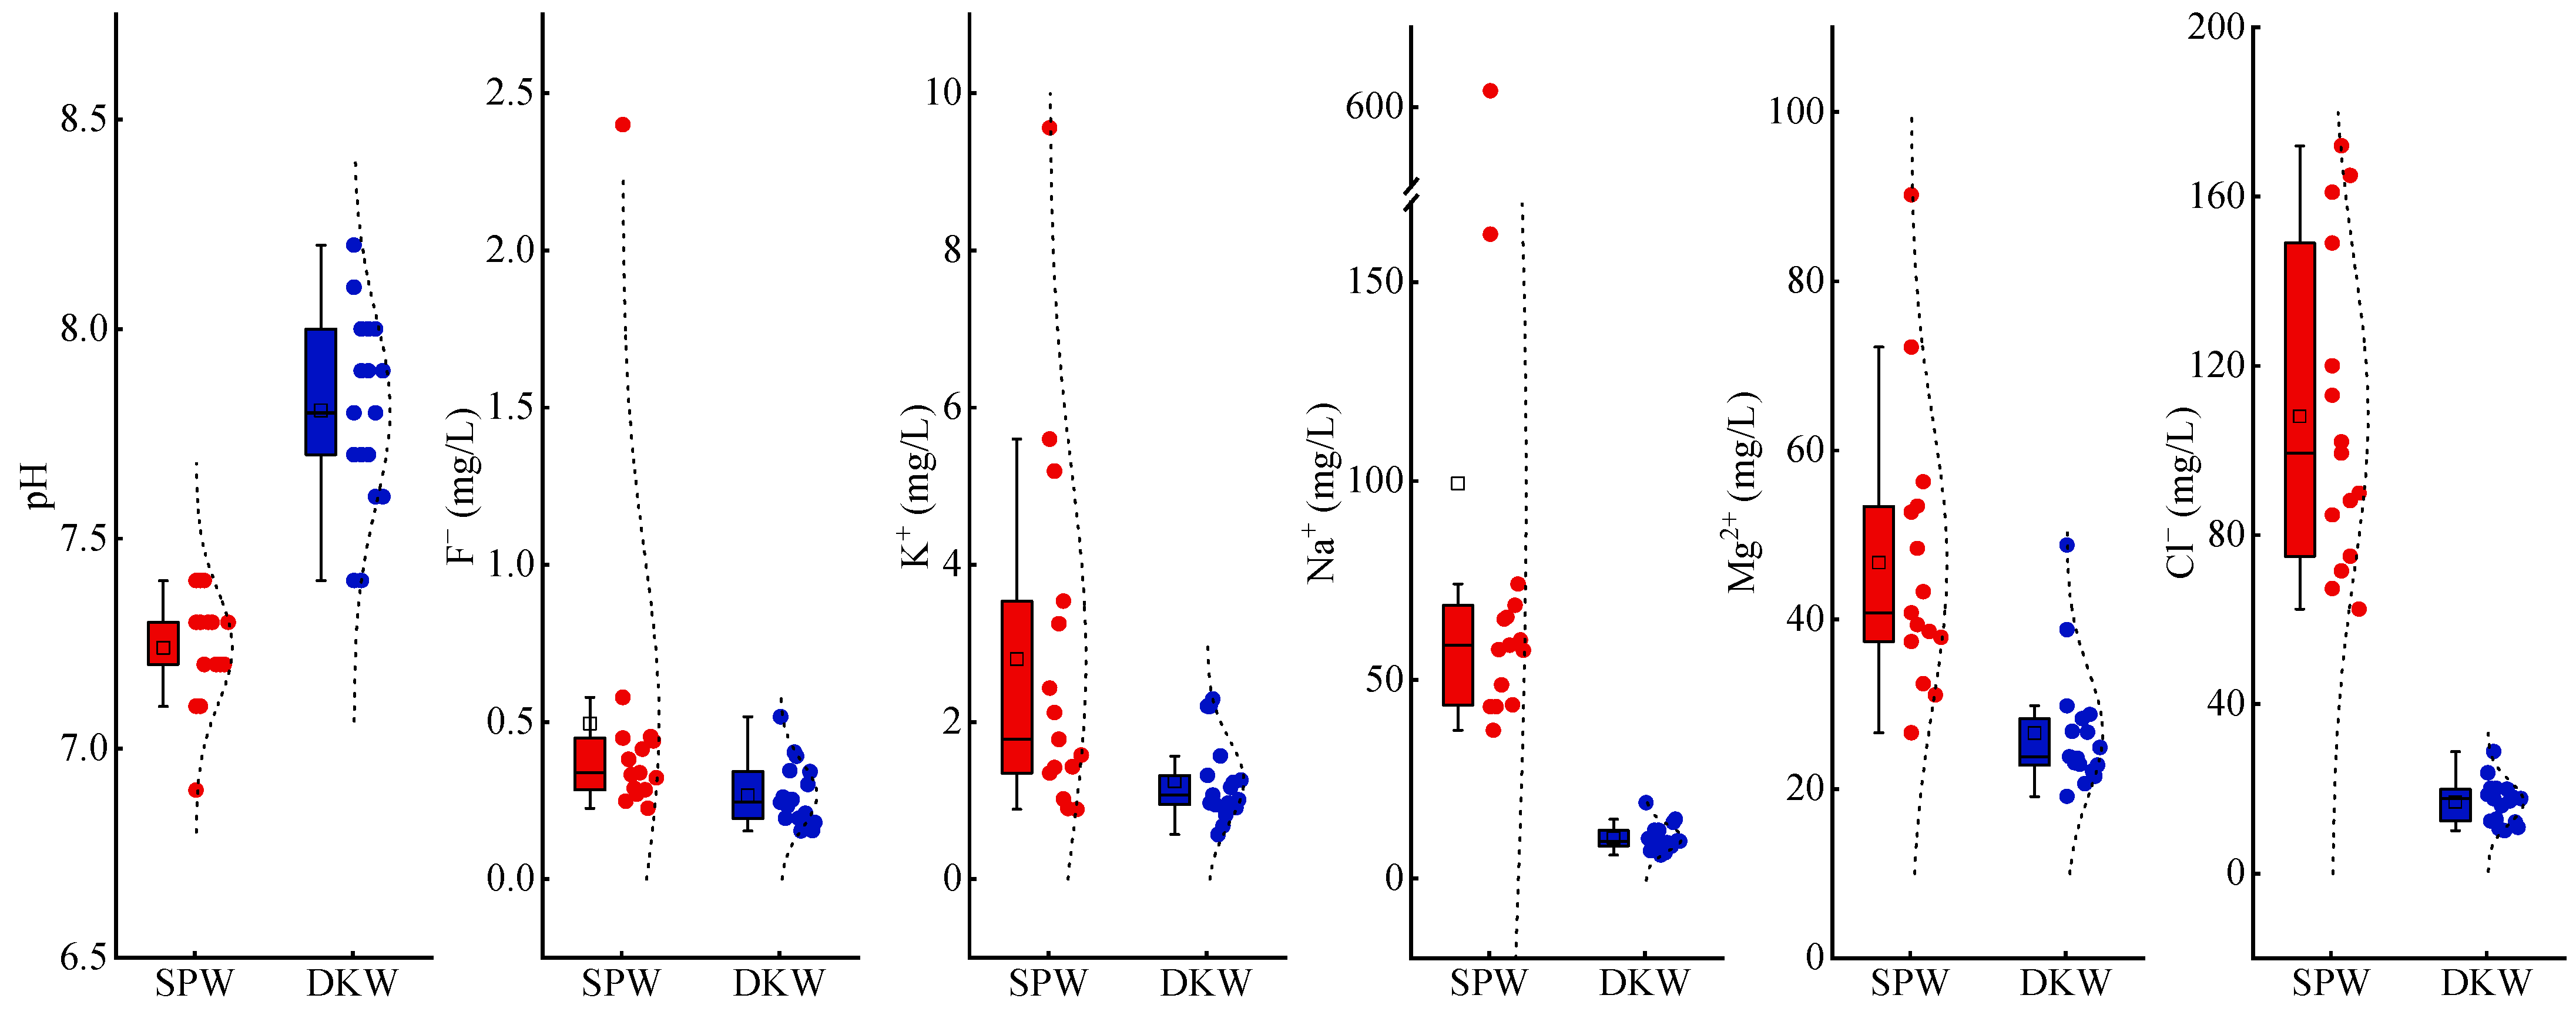
The statistical findings of the chemical components of the groundwater samples are presented in Table 3. The findings indicate that the pH values of SPW and DKW are 6.9–7.4 and 7.4–8.2, respectively, with averages of 7.24 and 7.81. The groundwater in the study area is primarily characterized by a weak alkaline nature.
As can be seen in Figure 2, the concentration of anions and cations in the SPW samples is significantly higher compared to that in the DKW samples. In total, 94.12% of the DKW samples had TDS less than 1000 mg/L with an average of 452.24 mg/L and were mainly fresh water, while 73.33% of the SPW samples had TDS greater than 1000 mg/L with an average of 1447.87 mg/L and were mainly brackish water. The order of anions and cations in the SPW samples was SO42− > HCO3 > Cl and Ca2+ > Na+ > Mg2+ > K+, and the order of anions and cations in the DKW samples was HCO3 > SO42− > Cl and Ca2+ > Mg2+ > Na+ > K+. The chemical components of SPW are mainly dominated by SO42− (267.00–1810.00 mg/L) and Ca2+ (191.00–496.00 mg/L), and that of DKW is mainly dominated by HCO3 (189.00–316.00 mg/L) and Ca2+ (62.20–243.00 mg/L). The NO3 concentration in the SPW was 16.30–244.01 mg/L, with an average of 107.60 mg/L, which significantly exceeds that found in the DKW, where the NO3 concentration was 1.73–57.57 mg/L with an average of 33.33 mg/L. The differences in the fluoride concentration between the SPW and DKW were minimal, with average values of 0.50 mg/L and 0.27 mg/L, respectively. The higher coefficients of variation observed for Na+ and F in the SPW, as well as for SO42− in the DKW, indicate a greater degree of spatial variability in the distribution patterns of their concentrations.

3.2. Hydrochemical Types

Piper diagrams provide a visual representation of water chemistry types and characteristics and are widely used in hydrogeochemical studies. The Ca2+ concentration accounted for 64.42% of the total cation concentration, and the SO42− concentration accounted for 59.29% of the total anion concentration (in meq/L), which were the major cation and anion in the SPW (Figure 3). In the DKW, the main ionic components were Ca2+ and HCO3, which accounted for 67.40% and 58.64% of the total cation and anion concentrations (in meq/L), respectively. A total of 66.67% of the SPW samples exhibited a water chemistry type characterized by SO4·HCO3-Ca, whereas, in the DKW samples, HCO3·SO4–Ca·Mg and HCO3–Ca were predominantly observed in 35.29% and 23.53% of the samples, respectively.

3.3. Correlation Analysis

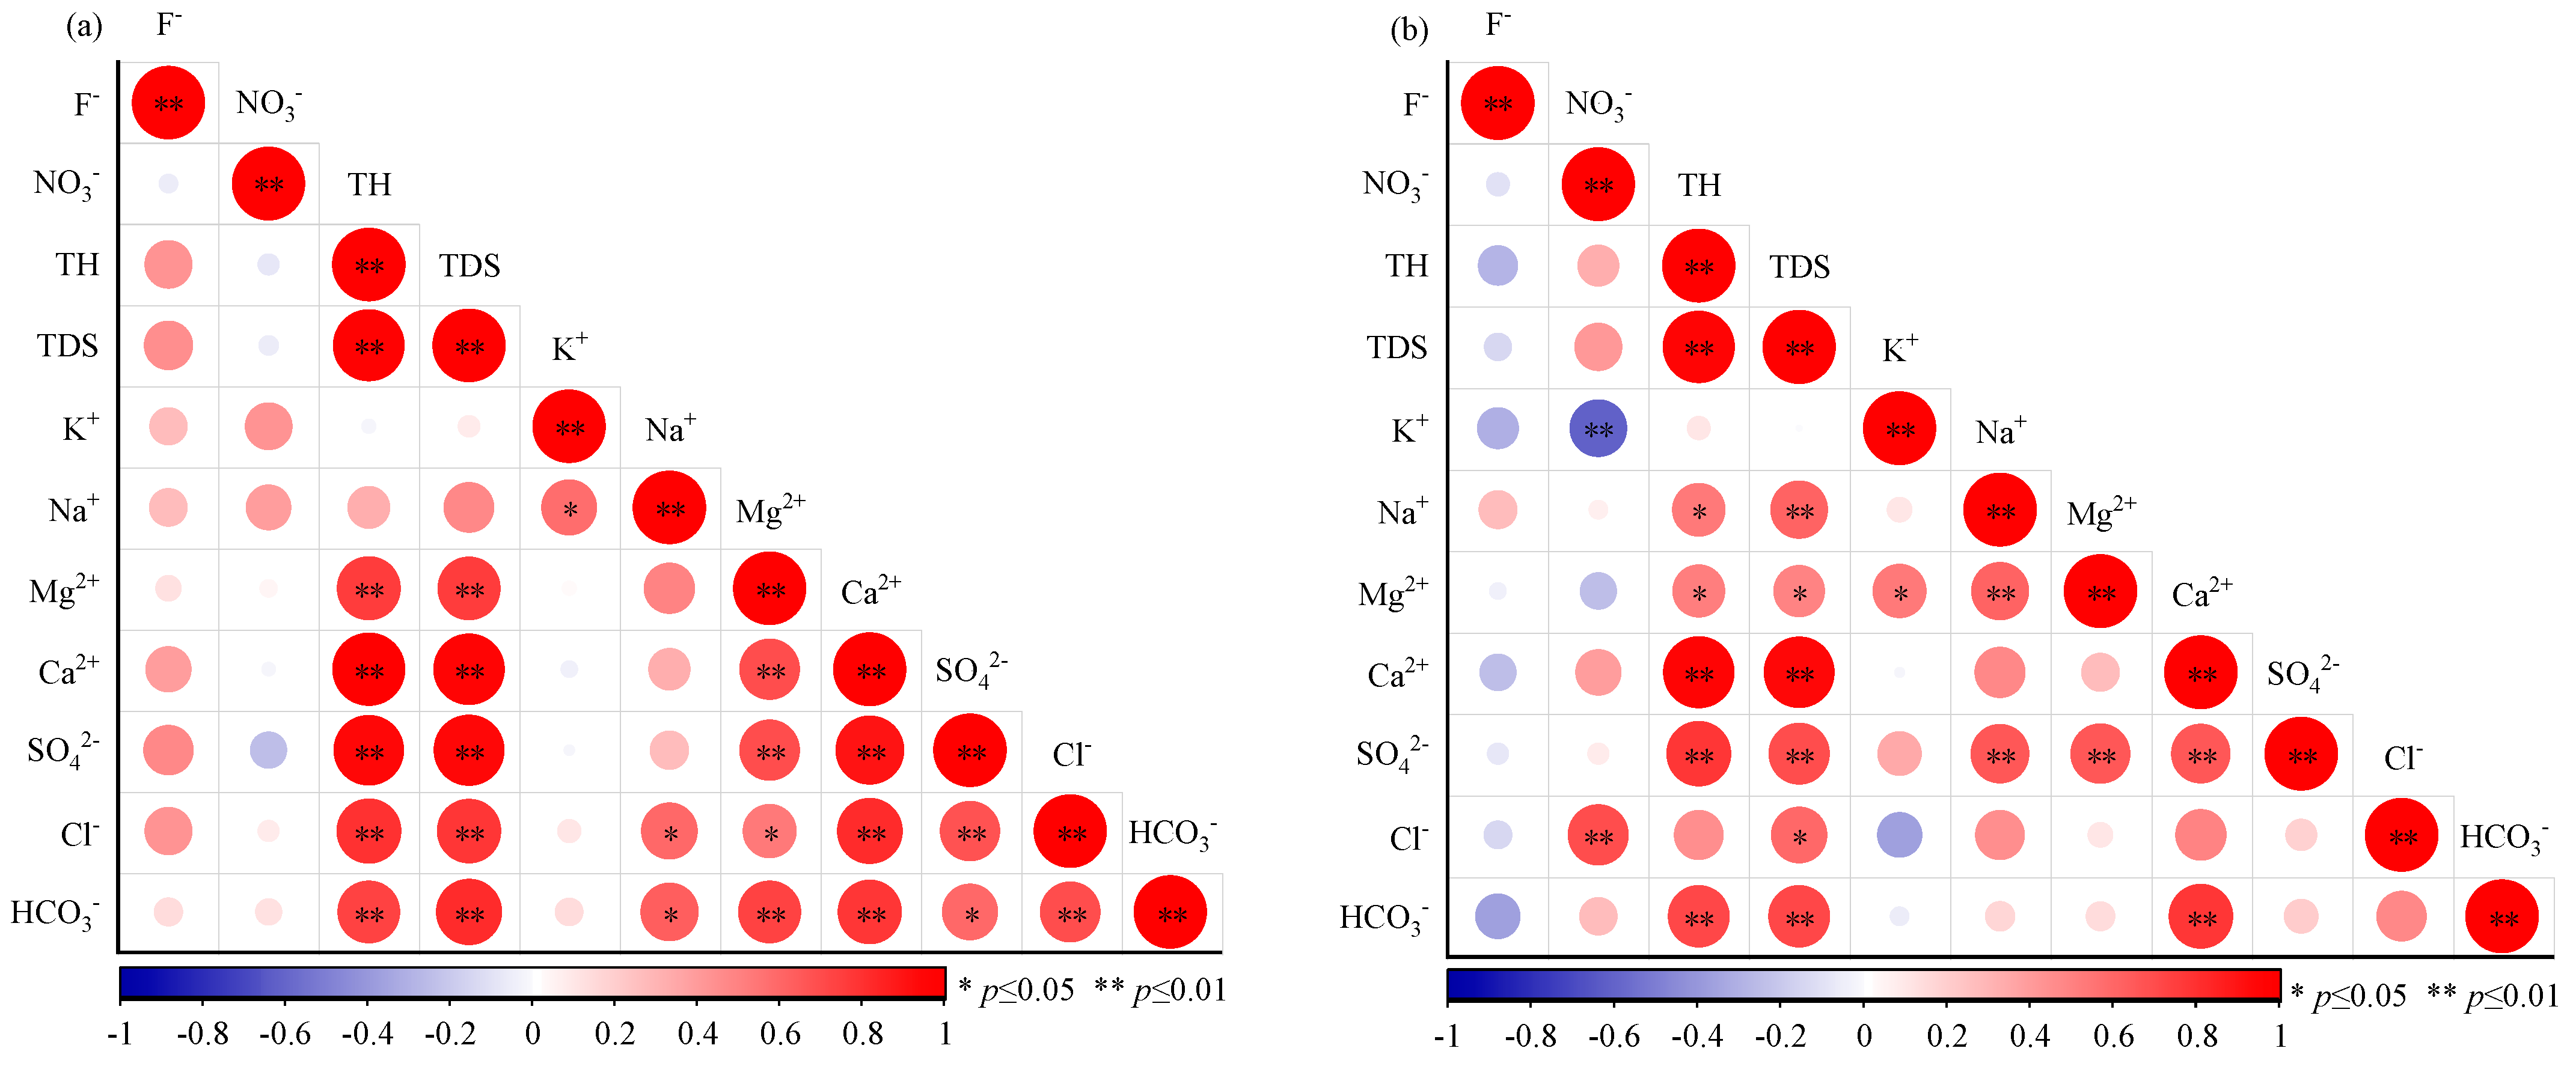
The water chemistry data were subjected to a correlation analysis in order to identify the factors that influenced the groundwater quality and its source (Figure 4). A wide variety of hydrogeochemical relationships were revealed by the correlation matrix of 11 hydrochemical components. A significant correlation was found between TDS and Ca2+, SO42−, Cl, and Mg2+, in the SPW at a significance level (p) of ≤0.01. In the DKW, TDS was significantly correlated with Ca2+, SO42−, and Na+. This reflects the contribution of these components to the groundwater salinity. A strong positive correlation between Ca2+ and SO42− in the DKW and SPW samples indicated a possible common source, such as gypsum dissolution.

4. Discussion

4.1. Hydrogeochemical Processes Identification

4.1.1. Rock Weathering Processes

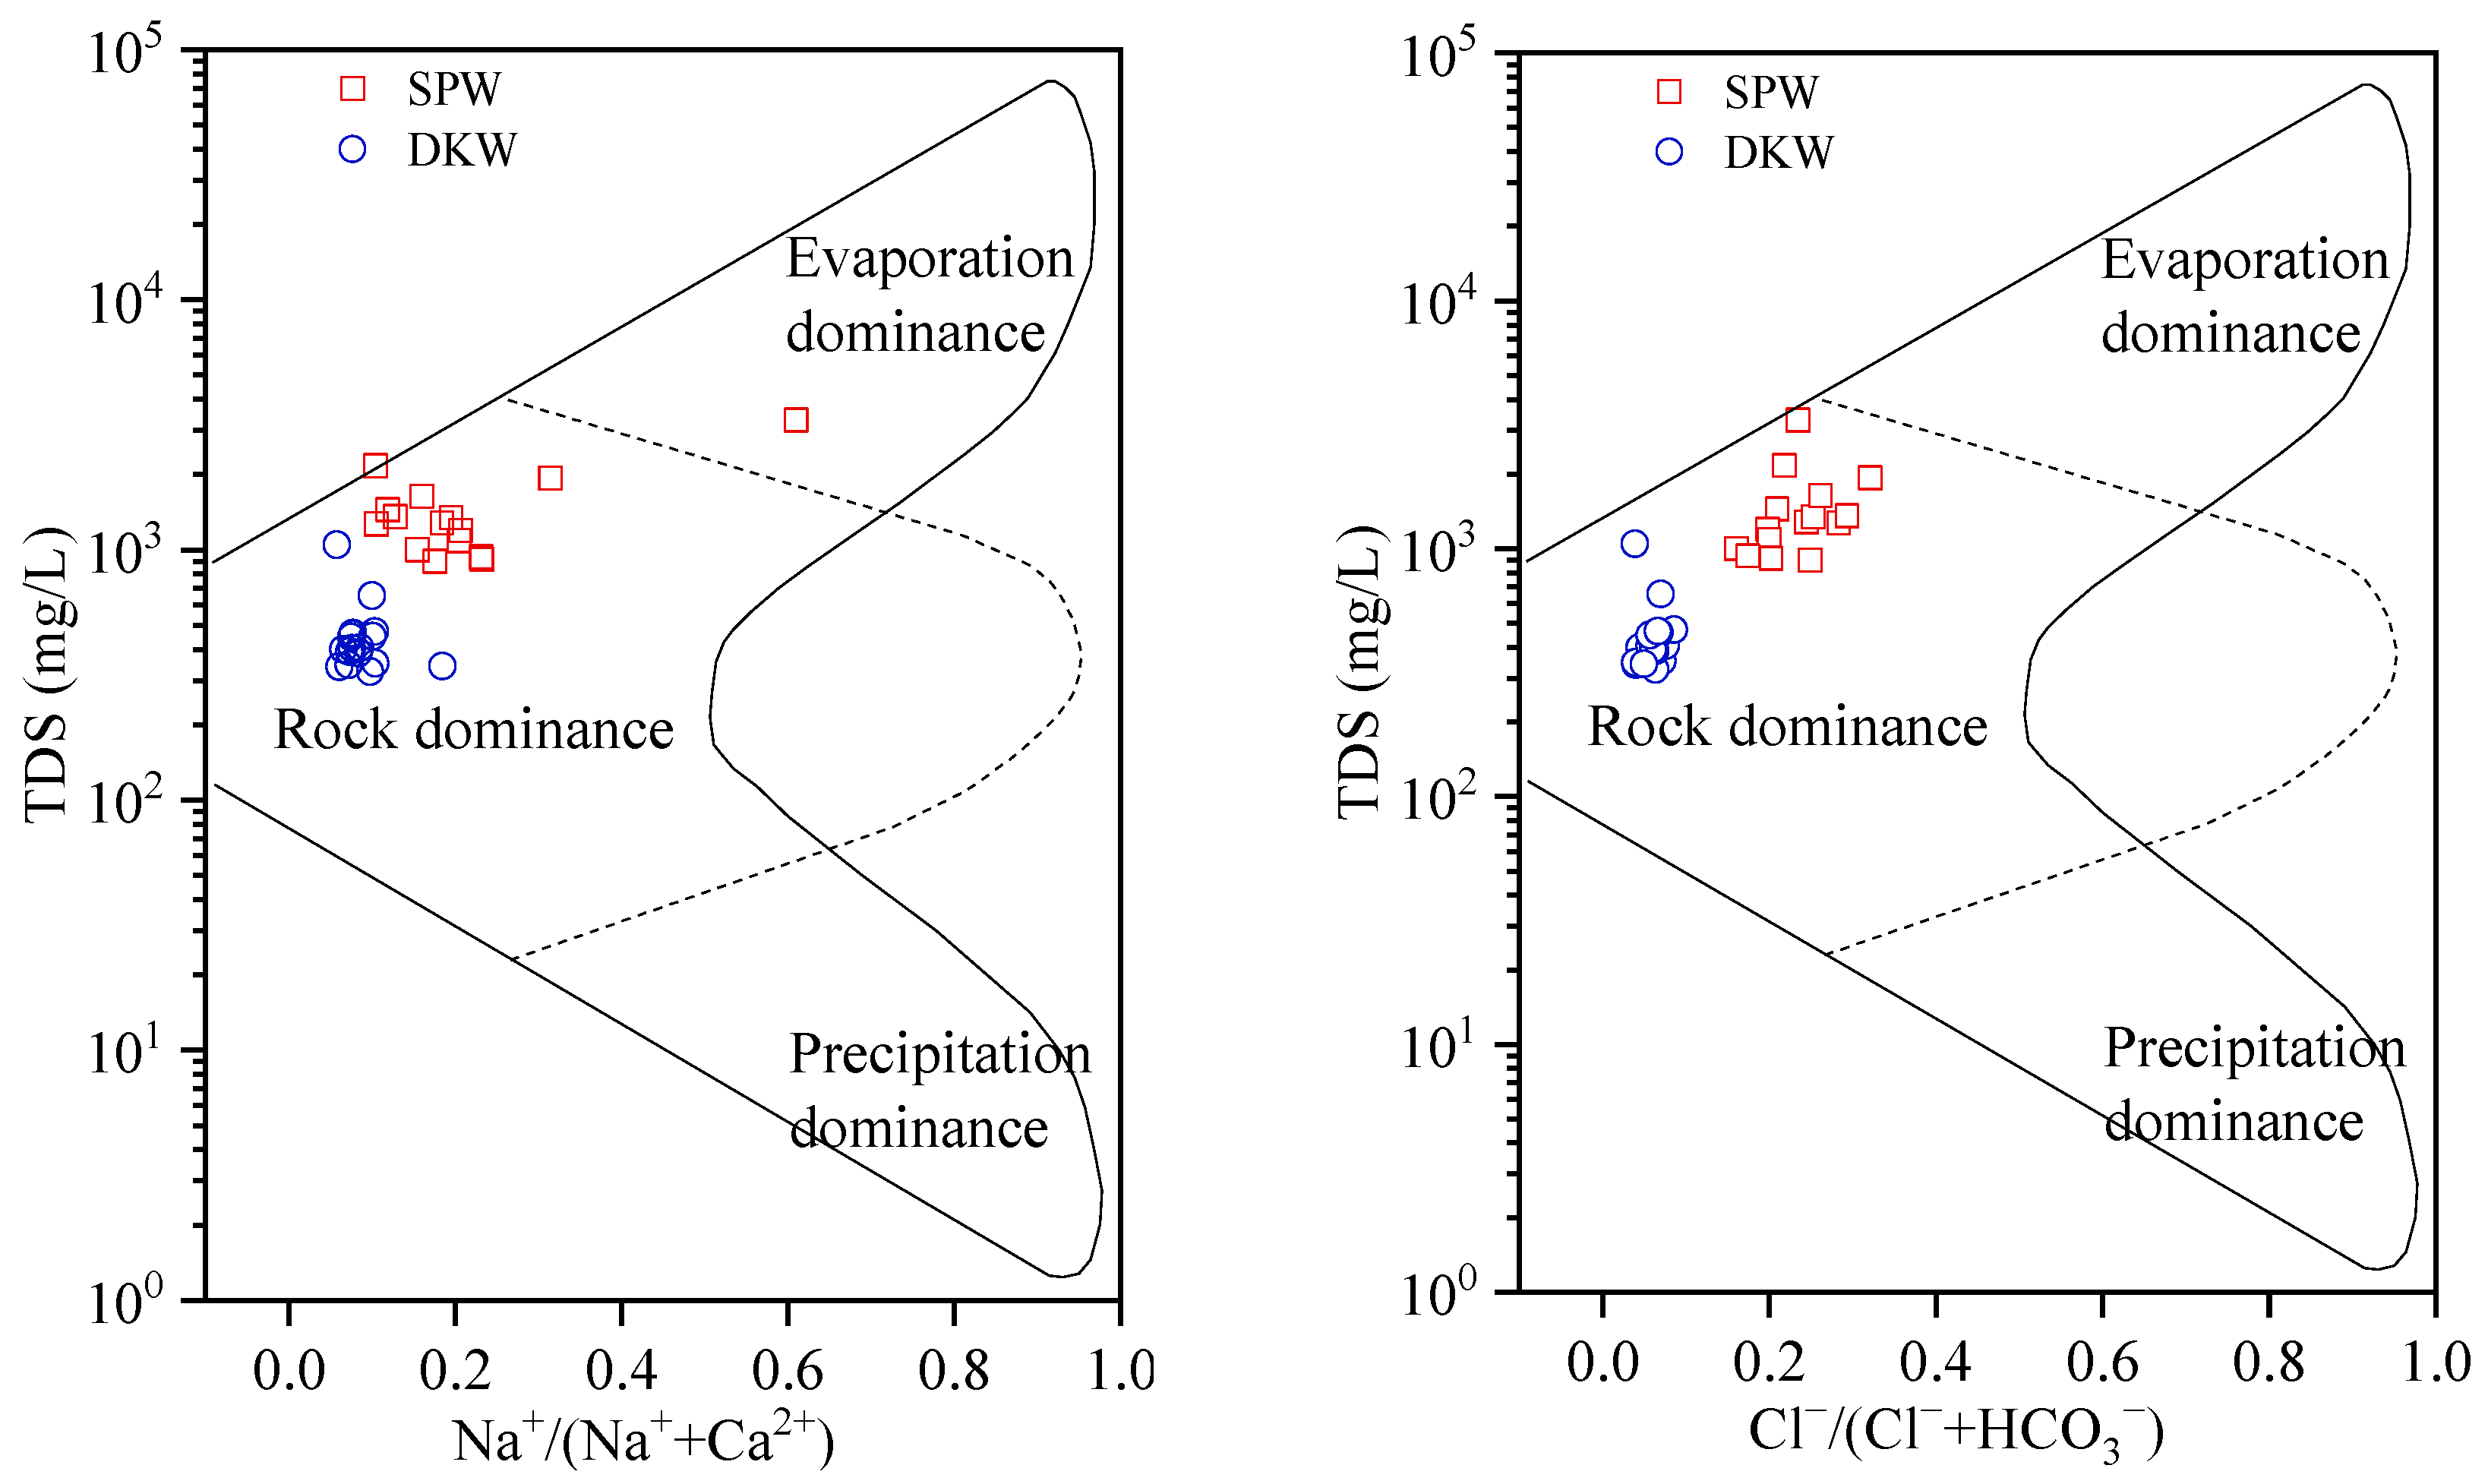
Gibbs diagrams are the primary means of illustrating water–rock interactions in groundwater [33,34]. In general, the relative relationship between Na+/(Na+ + Ca2+), Cl/(Cl + HCO3), and TDS can reveal the dominant factors in the evolution of groundwater chemistry, i.e., atmospheric precipitation, rock weathering, and evaporative crystallization [35]. A Gibbs diagram (Figure 5) shows that the chemical components of groundwater in the study area are primarily influenced by rock weathering, as evidenced by both the SPW and DKW samples falling within the range associated with this process. This suggests that both the SPW and DKW had experienced a long period of hydrologic processes. Compared to the DKW, the SPW was affected by some degree of evapotranspiration.
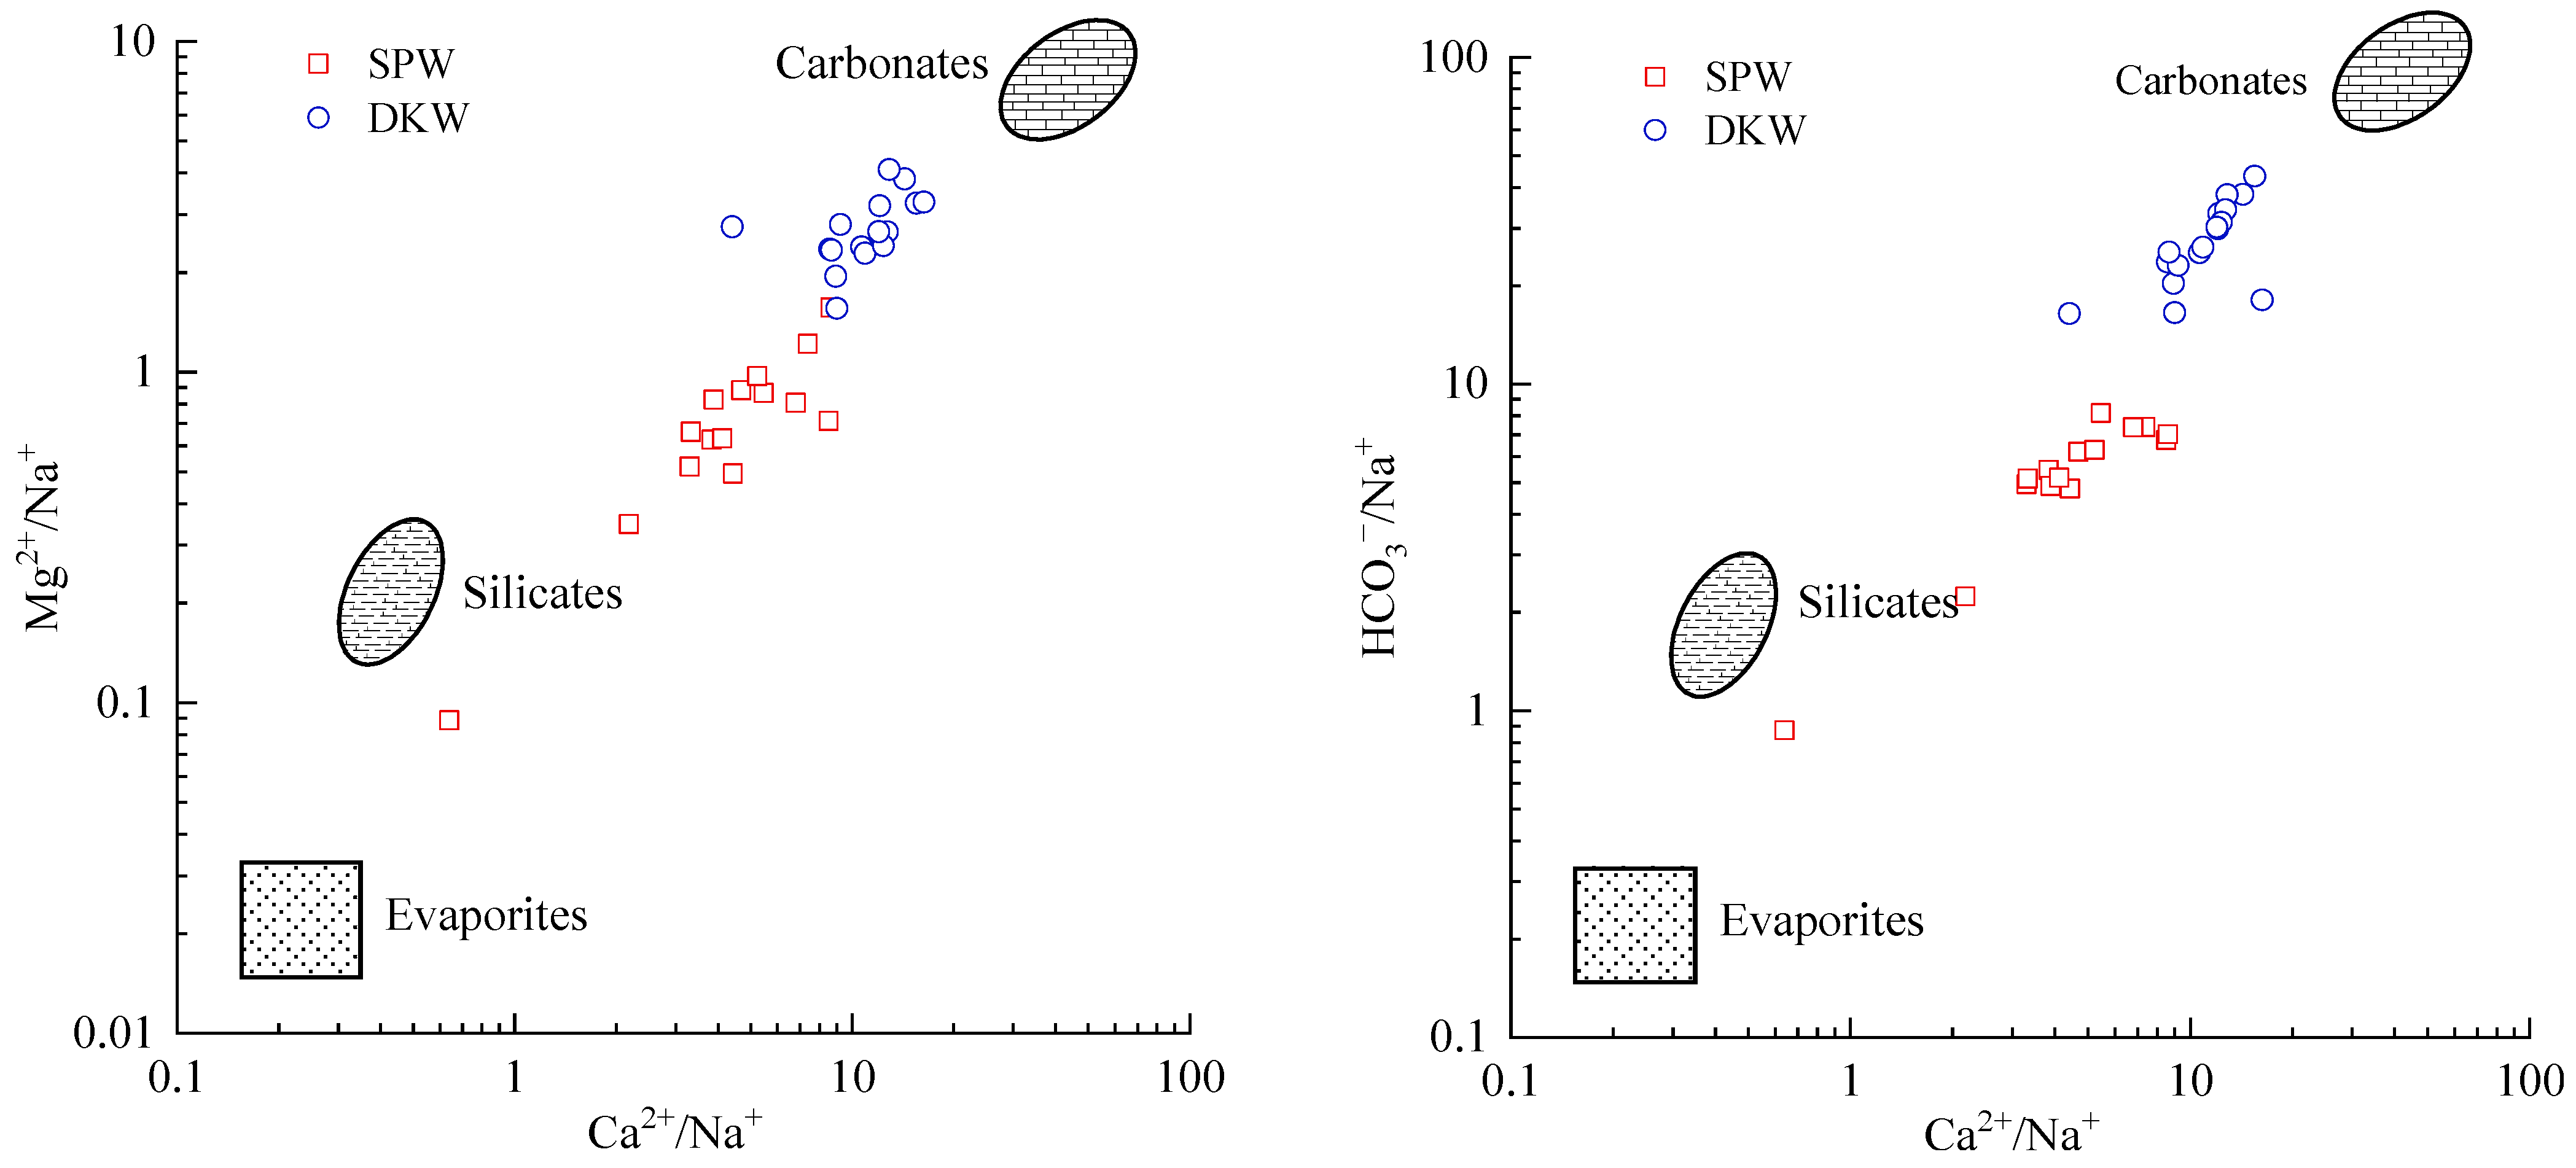
Many studies have shown that dissolutions of carbonate, evaporite, and silicate rocks are the major factors affecting the chemical components of groundwater [36,37]. To further reveal the degree of influence of weathering and the dissolution of different rocks on the chemical components, the relationships between Mg2+/Na+ and Ca2+/Na+, HCO3/Na+ and Ca2+/Na+ were analyzed. The results showed that the majority of water samples were between carbonates and silicates (Figure 6). The DKW was skewed toward the carbonate end of the spectrum, while the SPW was skewed toward silicate.
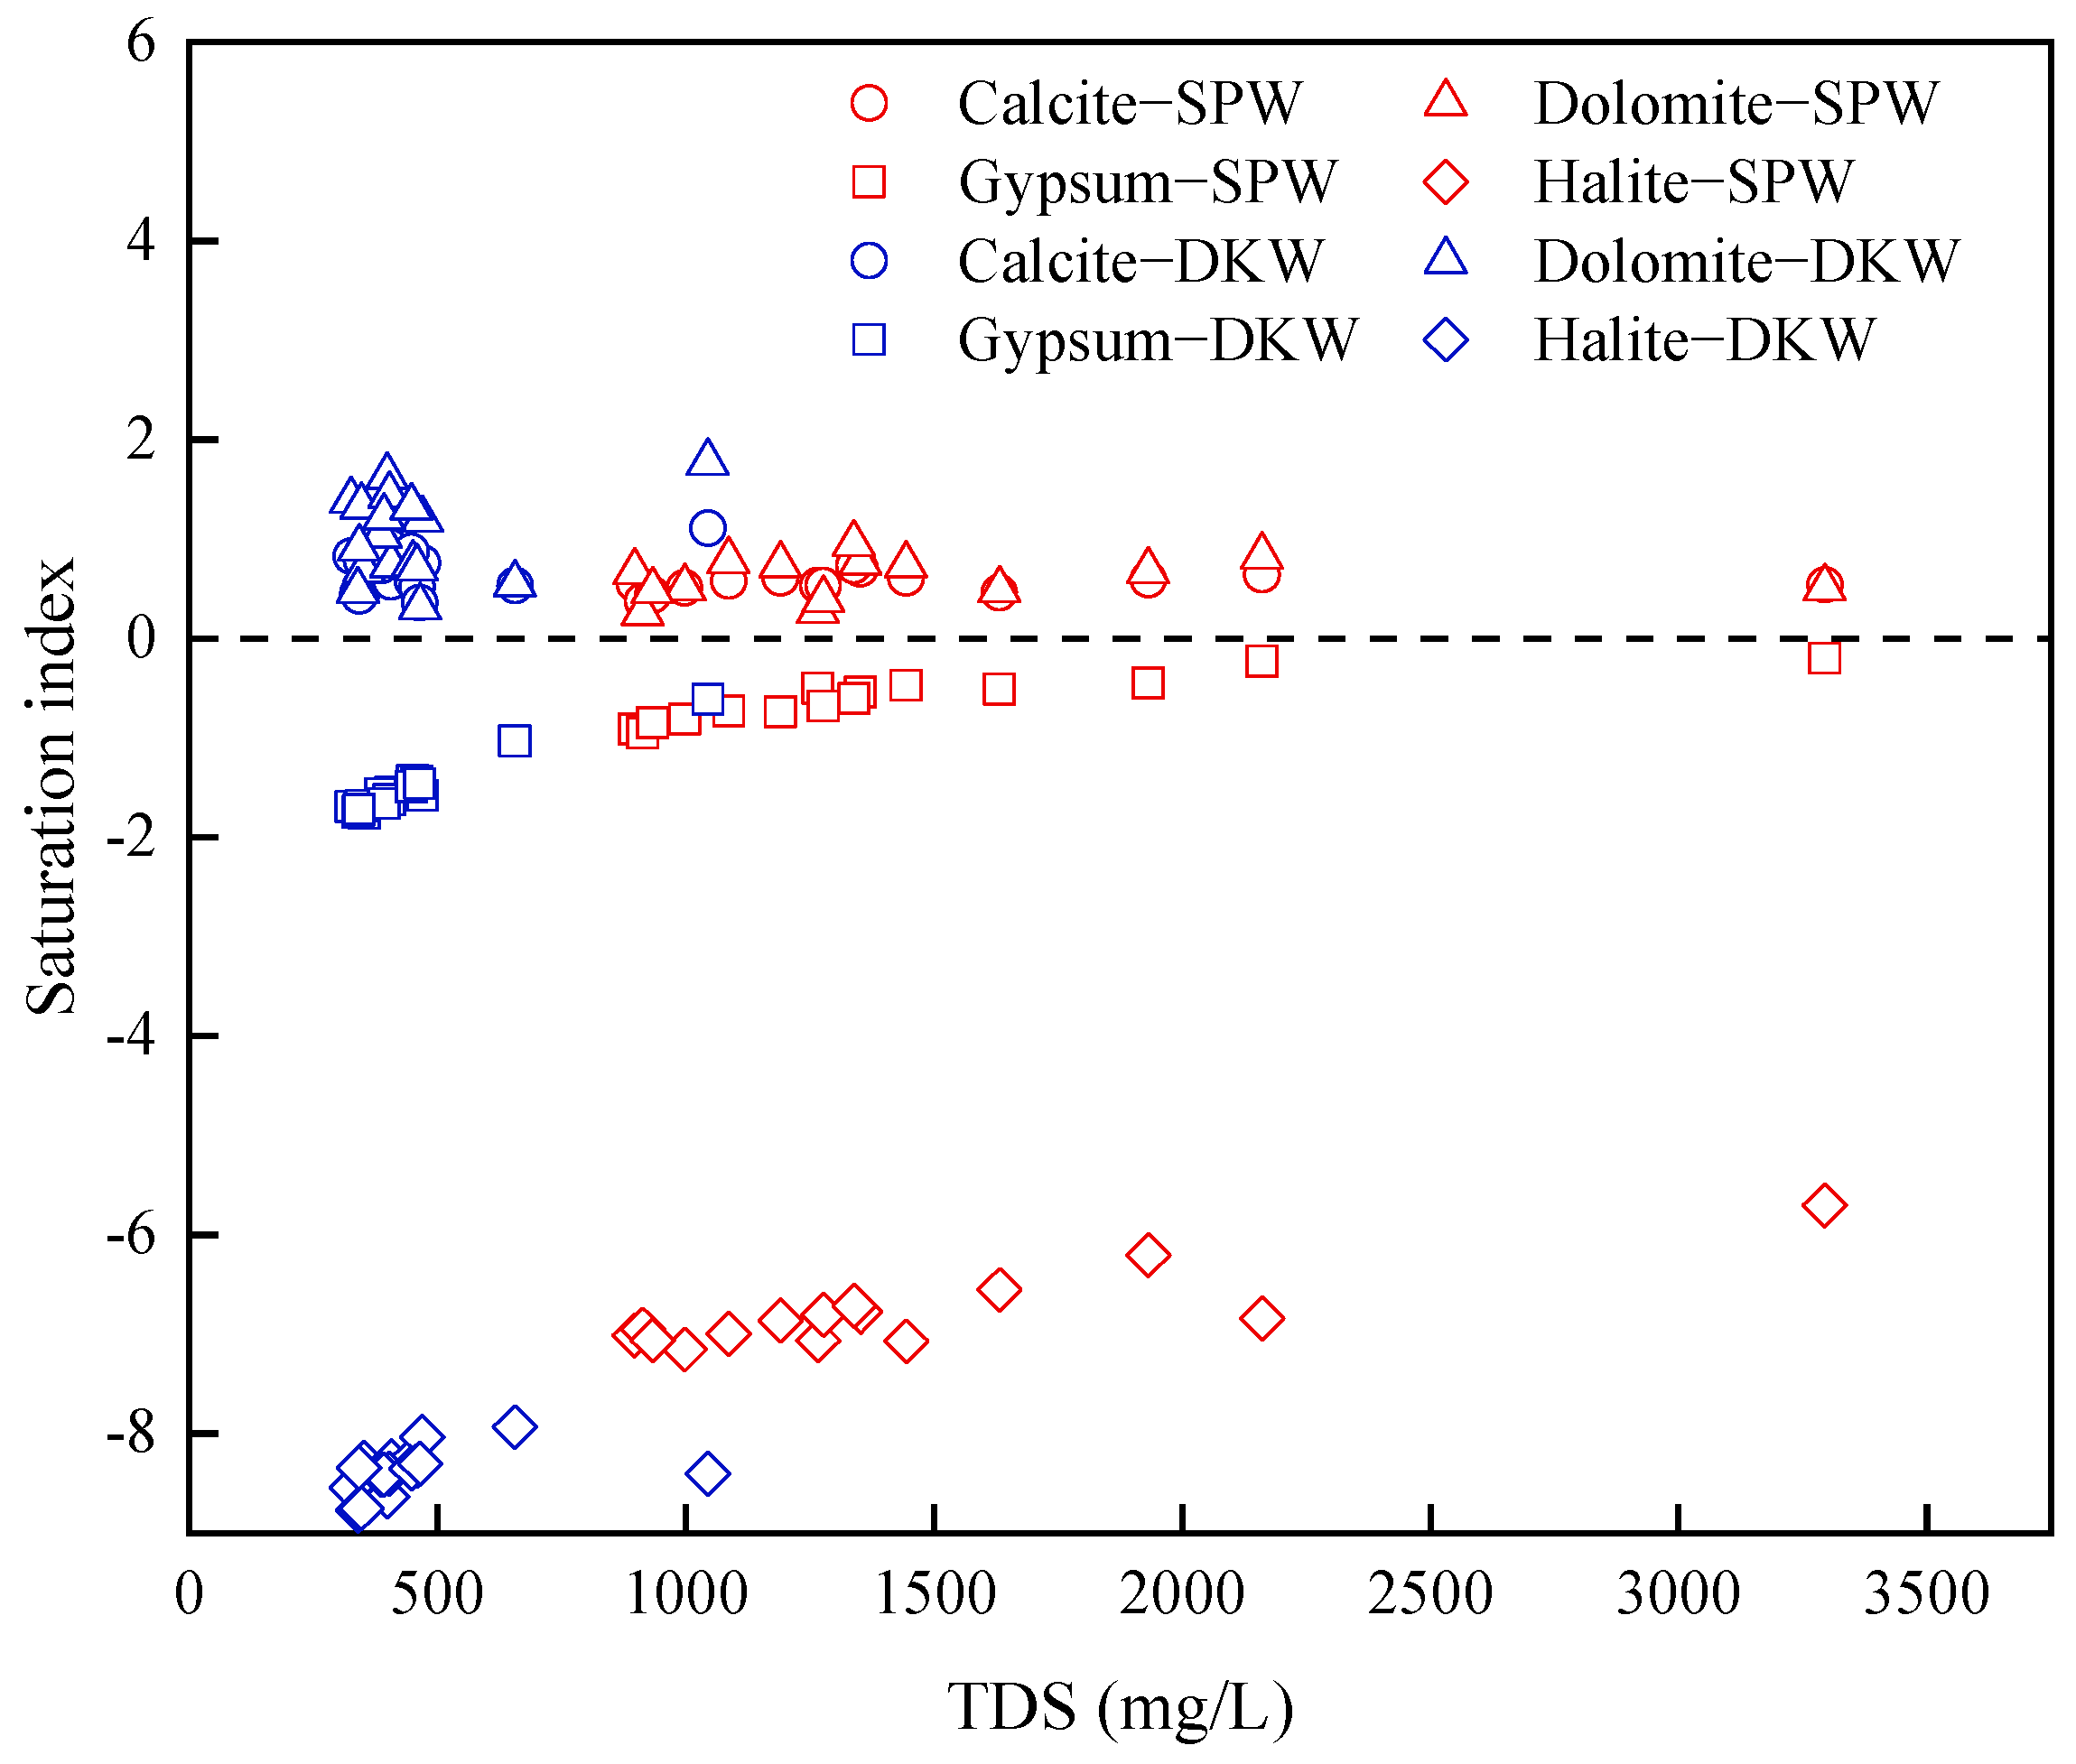
The calculation results of the groundwater saturation index are presented in Figure 7. The saturation indexes of calcite, dolomite, gypsum, and halite in the SPW samples were located in [0.38, 0.73], [0.26, 0.95], [−0.95,−0.20], and [−7.15, −5.70], respectively, while, in DKW samples, they were located in [0.36, 1.11], [0.32, 1.77], [−1.76, −0.61], and [−8.77, −7.93], respectively. These results show that calcite and dolomite were supersaturated in both samples, while gypsum and rock salt were unsaturated.
Many studies have shown that the dissolution process of carbonate rocks is often accompanied by sulfuric acid [38,39,40]. According to the relationships between Ca2+ + Mg2+ and HCO3, HCO3 + SO42−, and Ca2+ + Mg2+, the hydrogeochemical processes of carbonates and sulfates were analyzed. Assuming that the dissolution of carbonate minerals involves both carbonates and sulfuric acid, the dissolution process of carbonate rocks can be expressed as follows:
C a α M g 1 α C O 3 + H 2 C O 3 = α C a 2 + + 1 α M g 2 + + 2 H C O 3 ,
2 C a α M g 1 α C O 3 + H 2 S O 4 = 2 α C a 2 + + 2 ( 1 α ) M g 2 + + 2 H C O 3 + S O 4 2
3 C a α M g 1 α C O 3 + H 2 C O 3 + H 2 S O 4 = 3 α C a 2 + + 3 1 α M g 2 + + 4 H C O 3 + S O 4 2
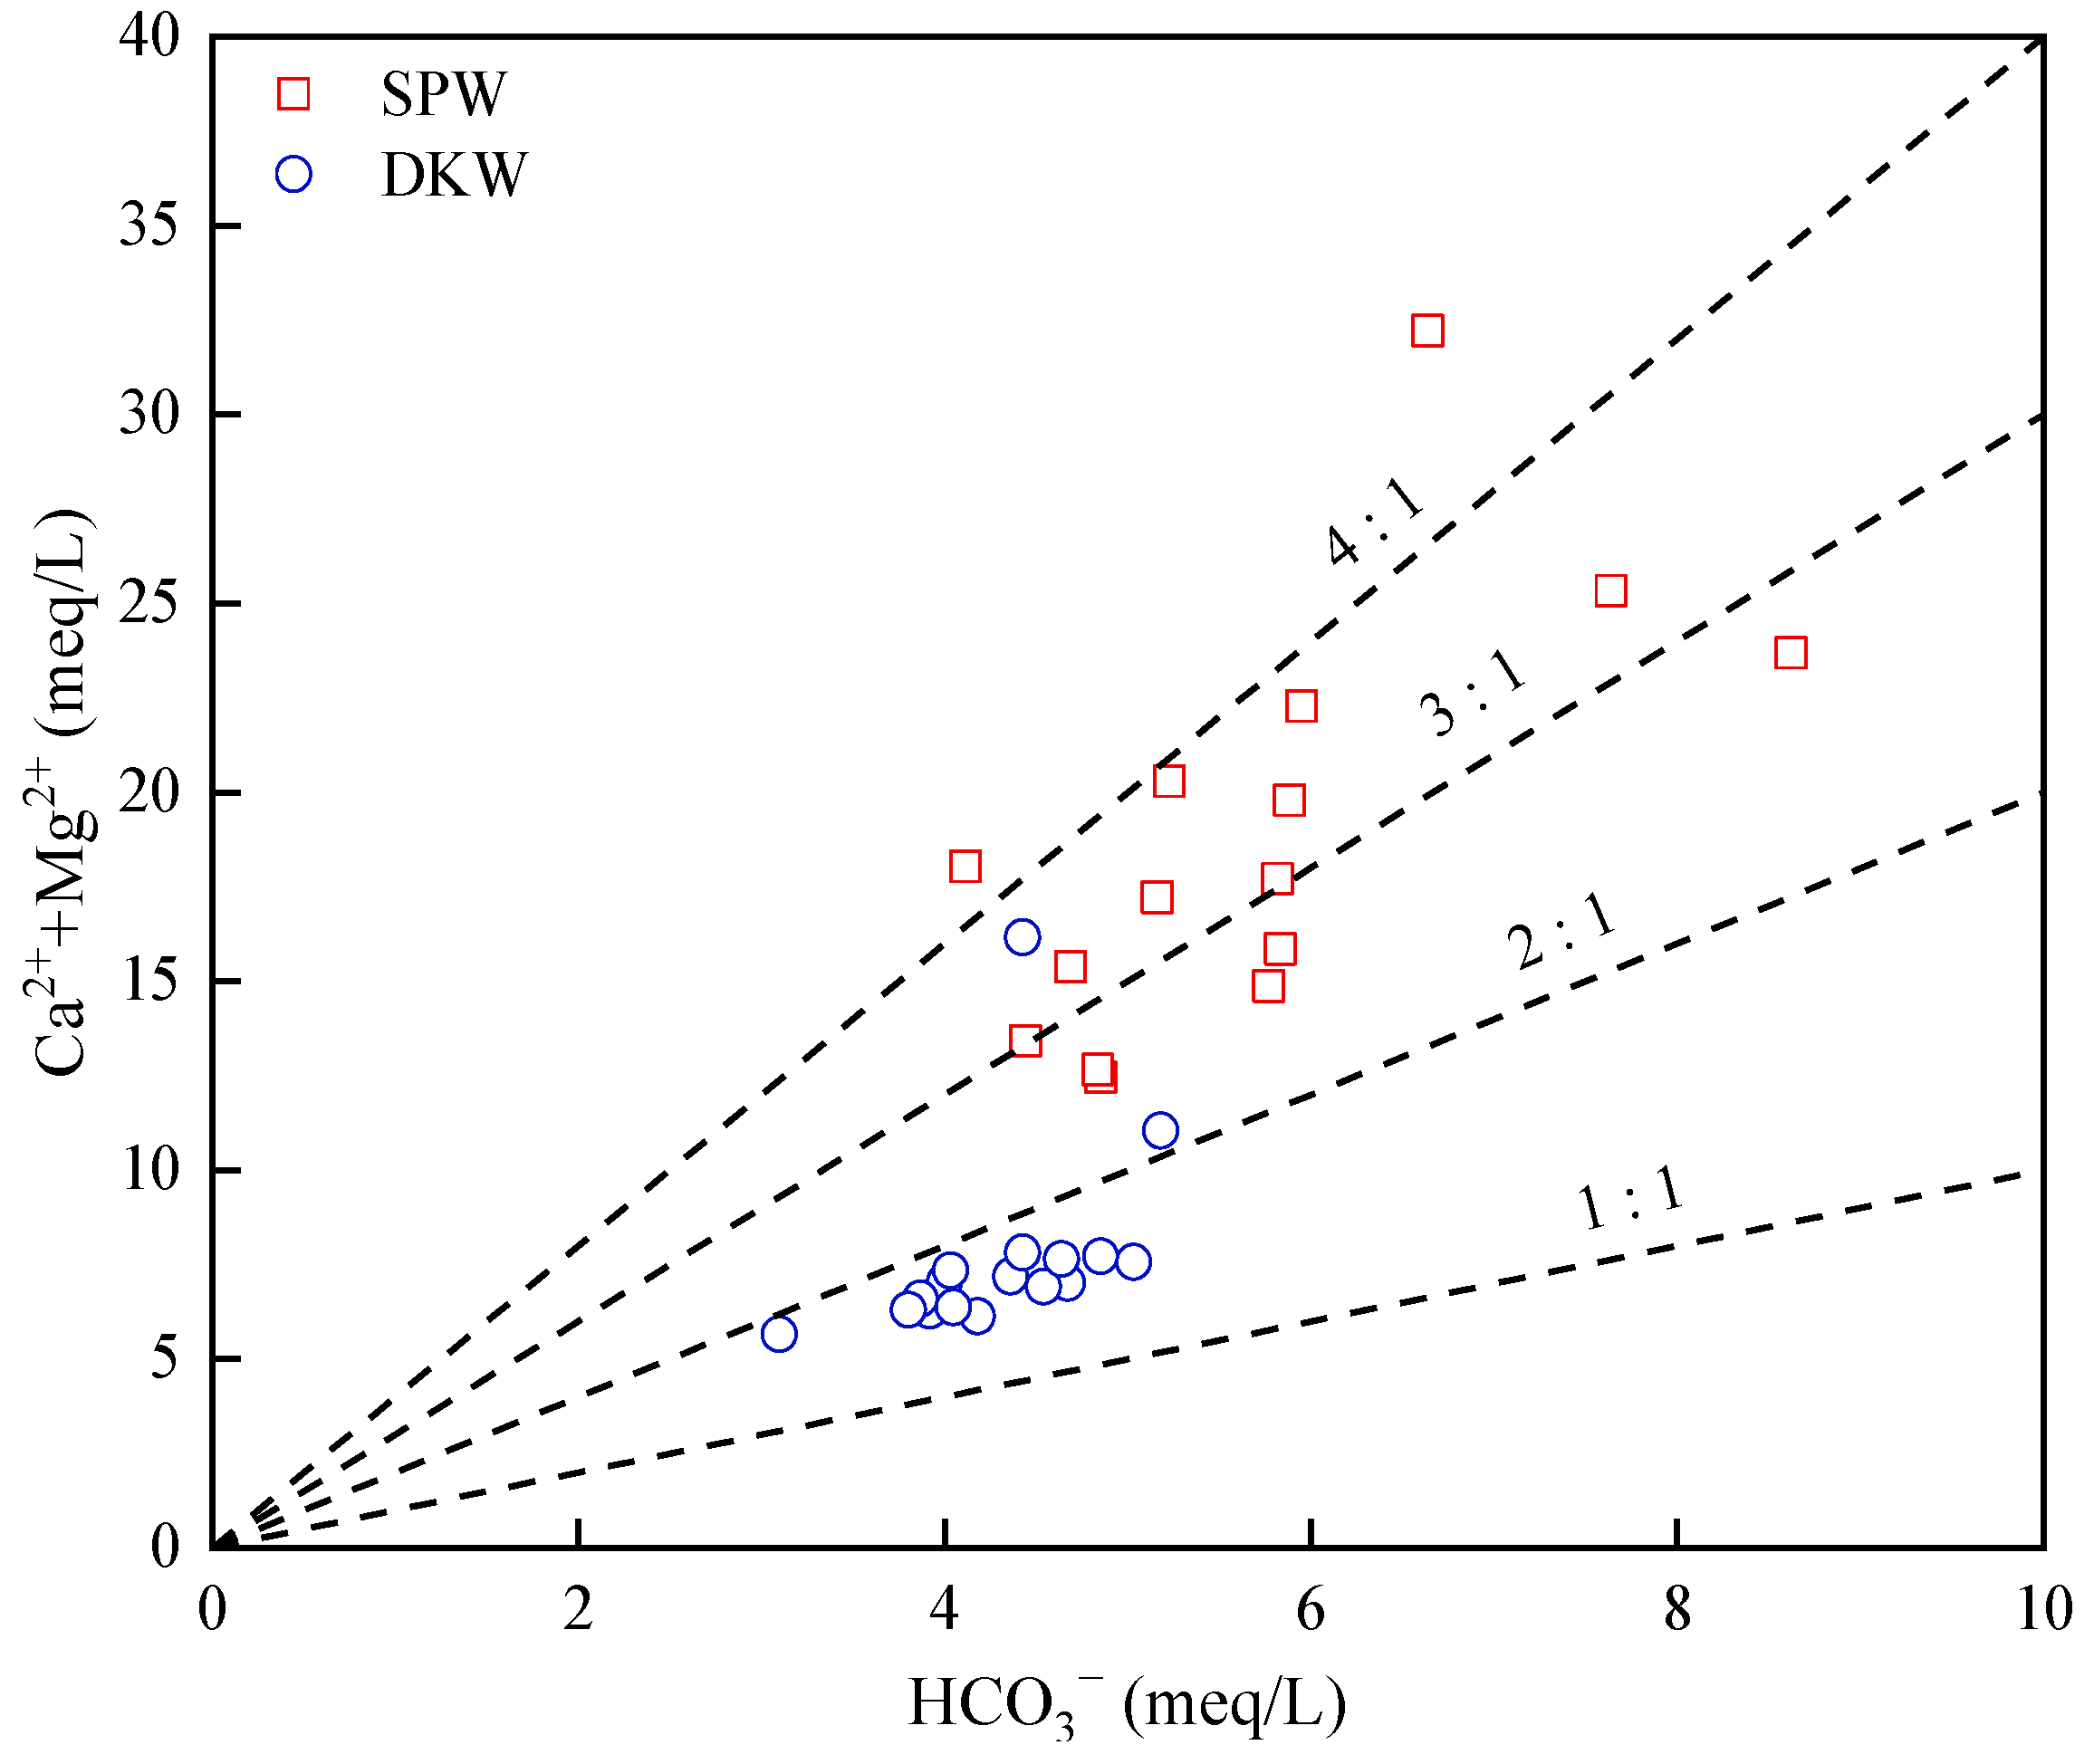
According to Equation (15), the equivalent ratio of (Ca2+ + Mg2+)/HCO3 is 1 and that of SO42−/HCO3 is 0 when only carbonic acid is involved in the weathering dissolution of carbonate rocks. As shown in Equation (16), all the carbon in HCO3 comes from the carbonate only when sulfuric acid is involved in the weathering of the carbonate rock, the equivalent ratio of (Ca2+ + Mg2+)/HCO3 is 2, and that of SO42−/HCO3 is 1. Equation (17) demonstrates that the equivalent ratios of one (Ca2+ + Mg2+)/HCO3 and SO42−/HCO3 are 1.5 and 0.5, respectively, when carbonic acid and sulfuric acid participate in the weathering of carbonate rocks in a molar ratio of 1:1.
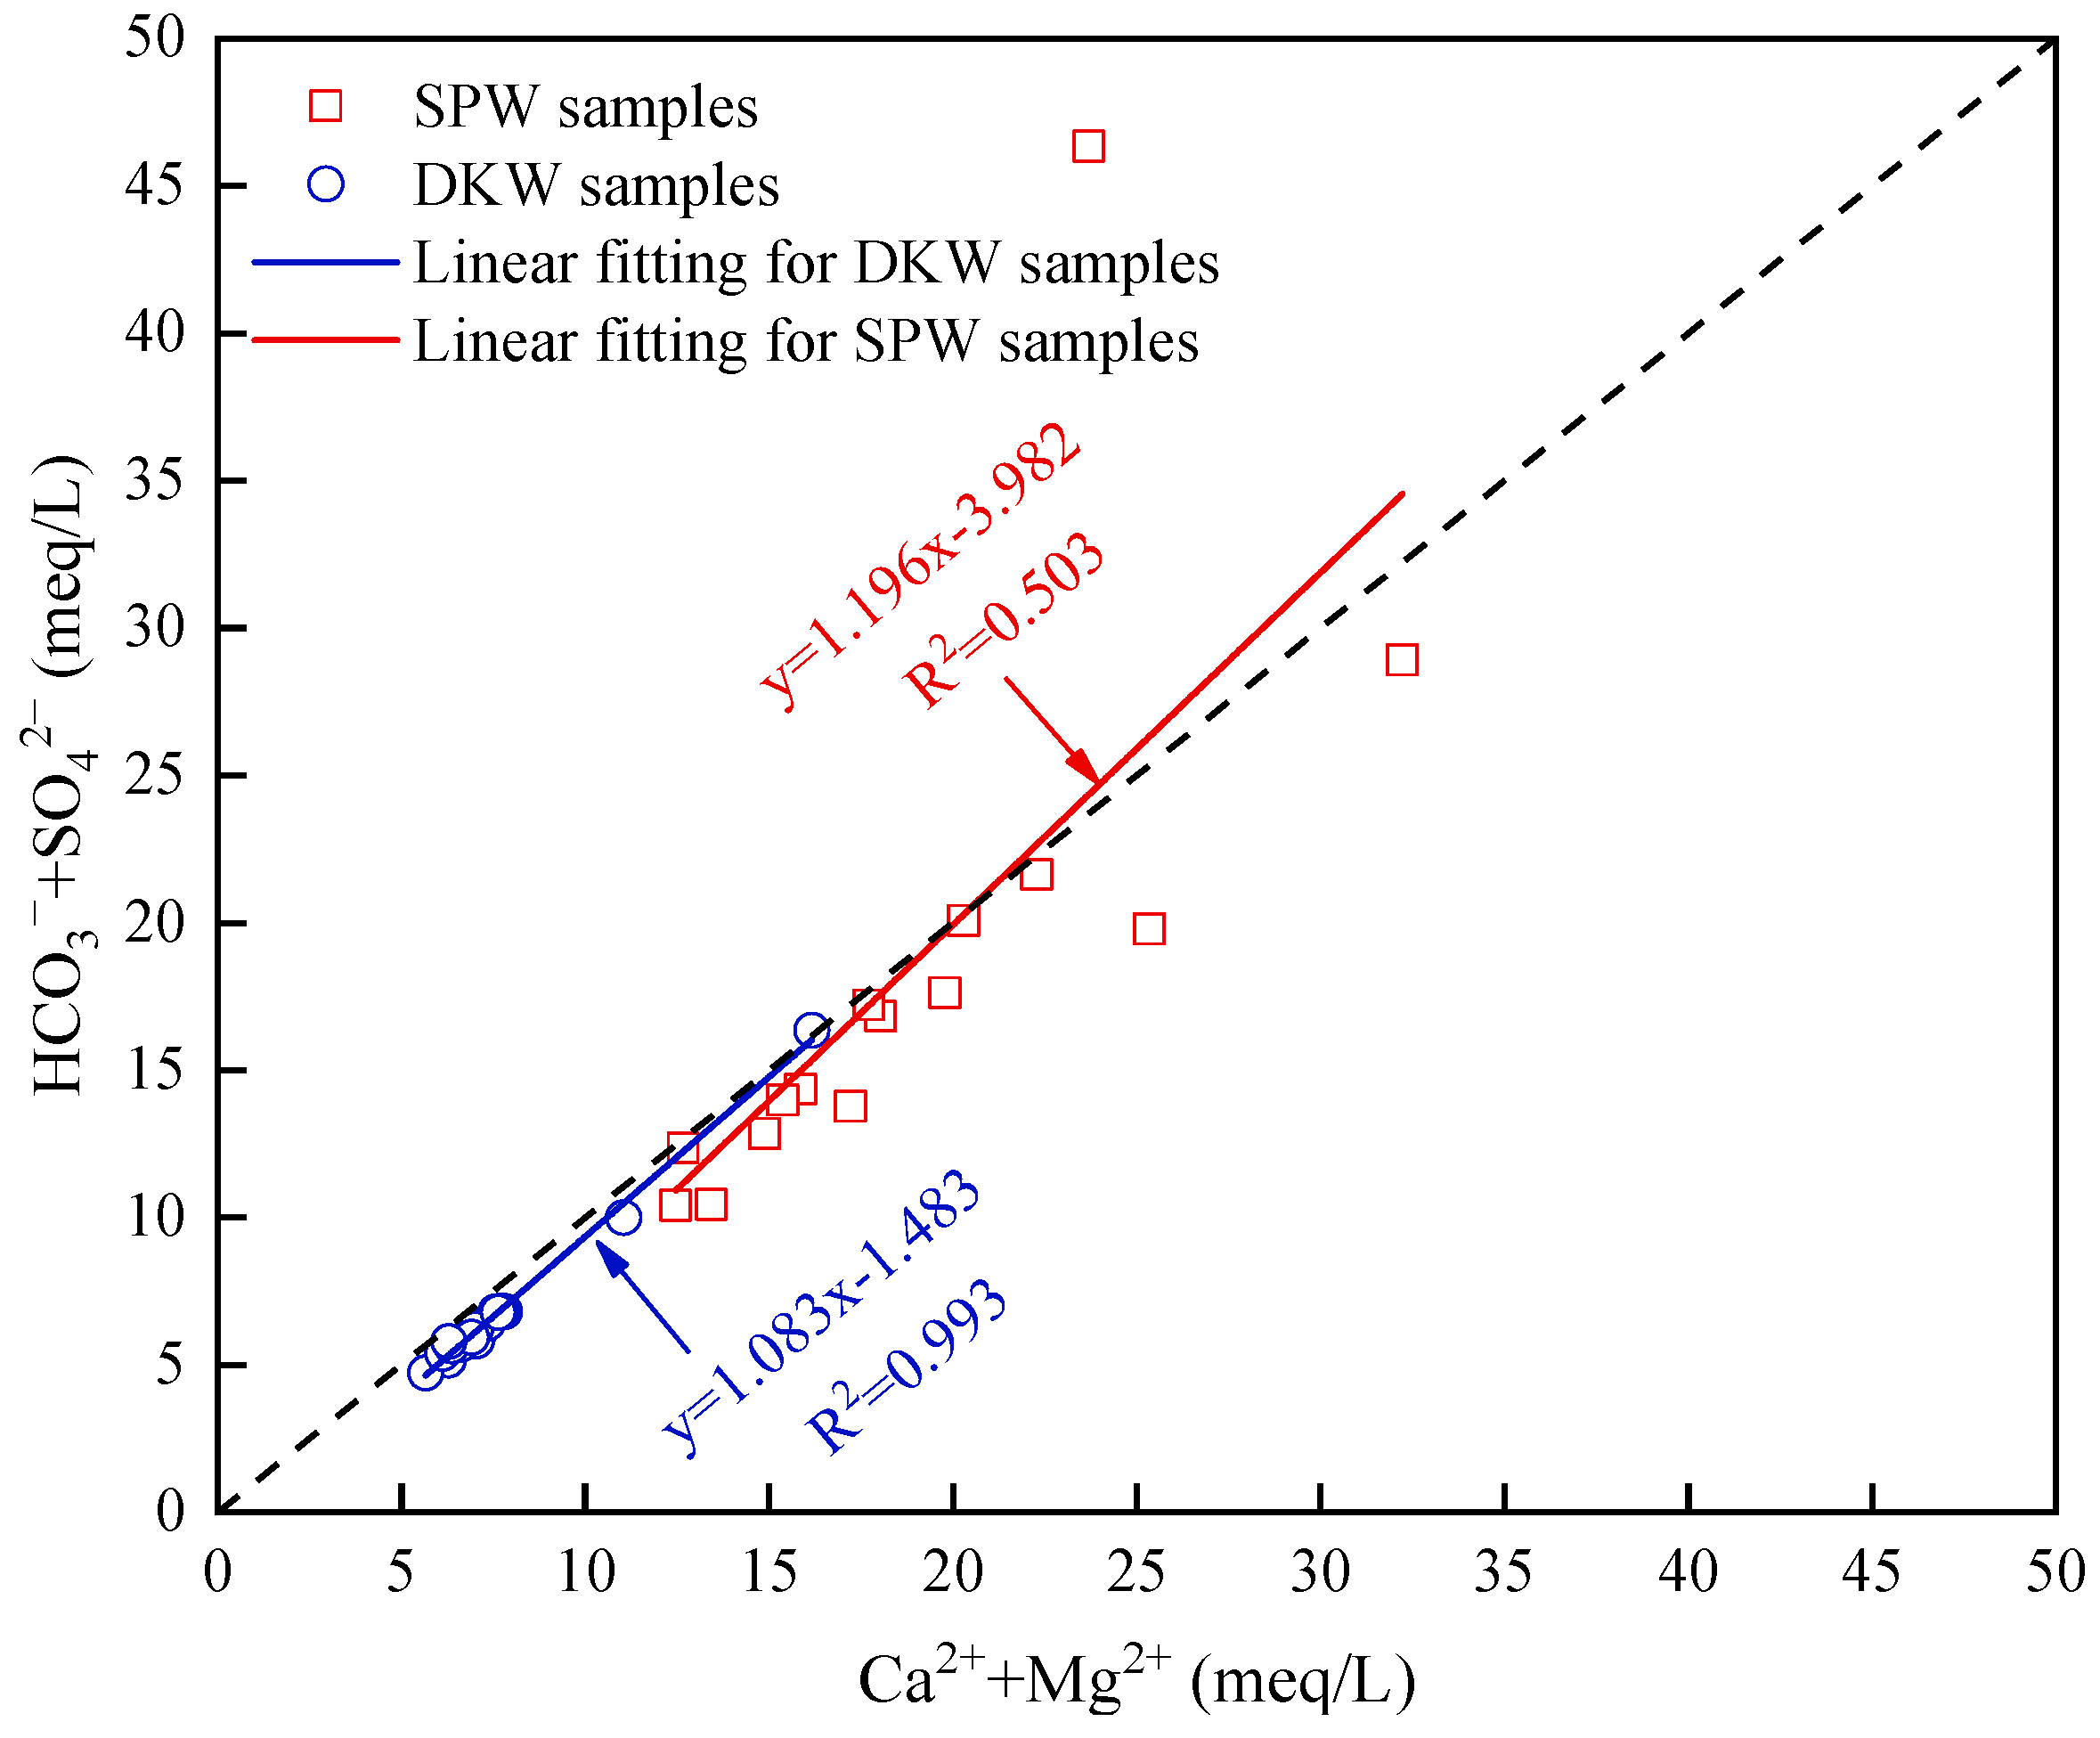
Figure 8 shows that the equivalent ratio of (Ca2+ + Mg2+)/HCO3 in the SPW and DKW samples ranged from 2.57 to 4.85 and 1.47 to 3.65, respectively, with averages of 3.30 and 1.79. The equivalent ratios of (HCO3 + SO42−)/(Ca2+ + Mg2+) in the SPW and DKW samples ranged from 0.78 to 1.96 and 0.82 to 1.01, respectively, with averages of 0.96 and 0.88 (Figure 9). These results suggest that the excess Ca2+ and Mg2+ are balanced by SO42−. Therefore, the hydrogeochemical evolution of SPW and DKW is accompanied by sulfate dissolution. The equivalent ratio of SO42−/HCO3 in the SPW samples was greater than 1, with an average of 2.15. Considering that the SPW samples were mainly distributed in coal mining areas, the oxidation of pyrite and dissolution of gypsum in coal-bearing strata were the major factors contributing to the increase in the SO42− concentration. In addition, the discharge of mine water also caused serious pollution to the SPW. According to Huang (2018), in the 1990s, mine water discharges in the region had reached 40% of the water resources extracted [41]. The discharge of large volumes of mine water increases the SO42− concentration of surface water and shallow groundwater.

4.1.2. Cation Exchange

In order to analyze the impact of the cation exchange process on the chemical components of the SPW and DKW, the correlation between (Ca2+ + Mg2+) − (SO42− + HCO3) and (Na+ + K+) − Cl was plotted (Figure 10). The (Na+ + K+) − Cl represents changes in the Na+ + K+ levels, as well as the dissolution of halite and sylvite, and (Ca2+ + Mg2+) − (SO42− + HCO3) indicates an increase or decrease in Ca2+ + Mg2+ as well as the dissolution of calcite, dolomite, and gypsum [39]. Figure 10 shows that the SPW and DKW samples were predominantly located above the 1:−1 contour. This finding indicates the existence of cation exchange reactions in the SPW and DKW, although it was not the major factor governing the chemical components of the groundwater.

4.1.3. Anthropogenic Activities

With population growth, human activities, especially industrial and agricultural production, have increasingly polluted the groundwater environment. A large number of studies have found that NO3, Cl, and SO42− can serve as indicators of the impact of human activities on the groundwater environment [42,43,44]. To further analyze the influence of anthropogenic activities on groundwater, a relationship between NO3/Na+ and Cl/Na+ was plotted (Figure 11). Groundwater with serious anthropogenic pollution is often accompanied by high NO3/Na+ and Cl/Na+, representing agricultural end-member. Rock weathering contributes little to NO3 and Cl in groundwater, and low NO3/Na+ and Cl/Na+ are defined as weathering end-members of carbonate and silicate. The findings indicate that the samples were mainly distributed near the agricultural end-member, denoting that the groundwater was significantly impacted by agricultural activities.
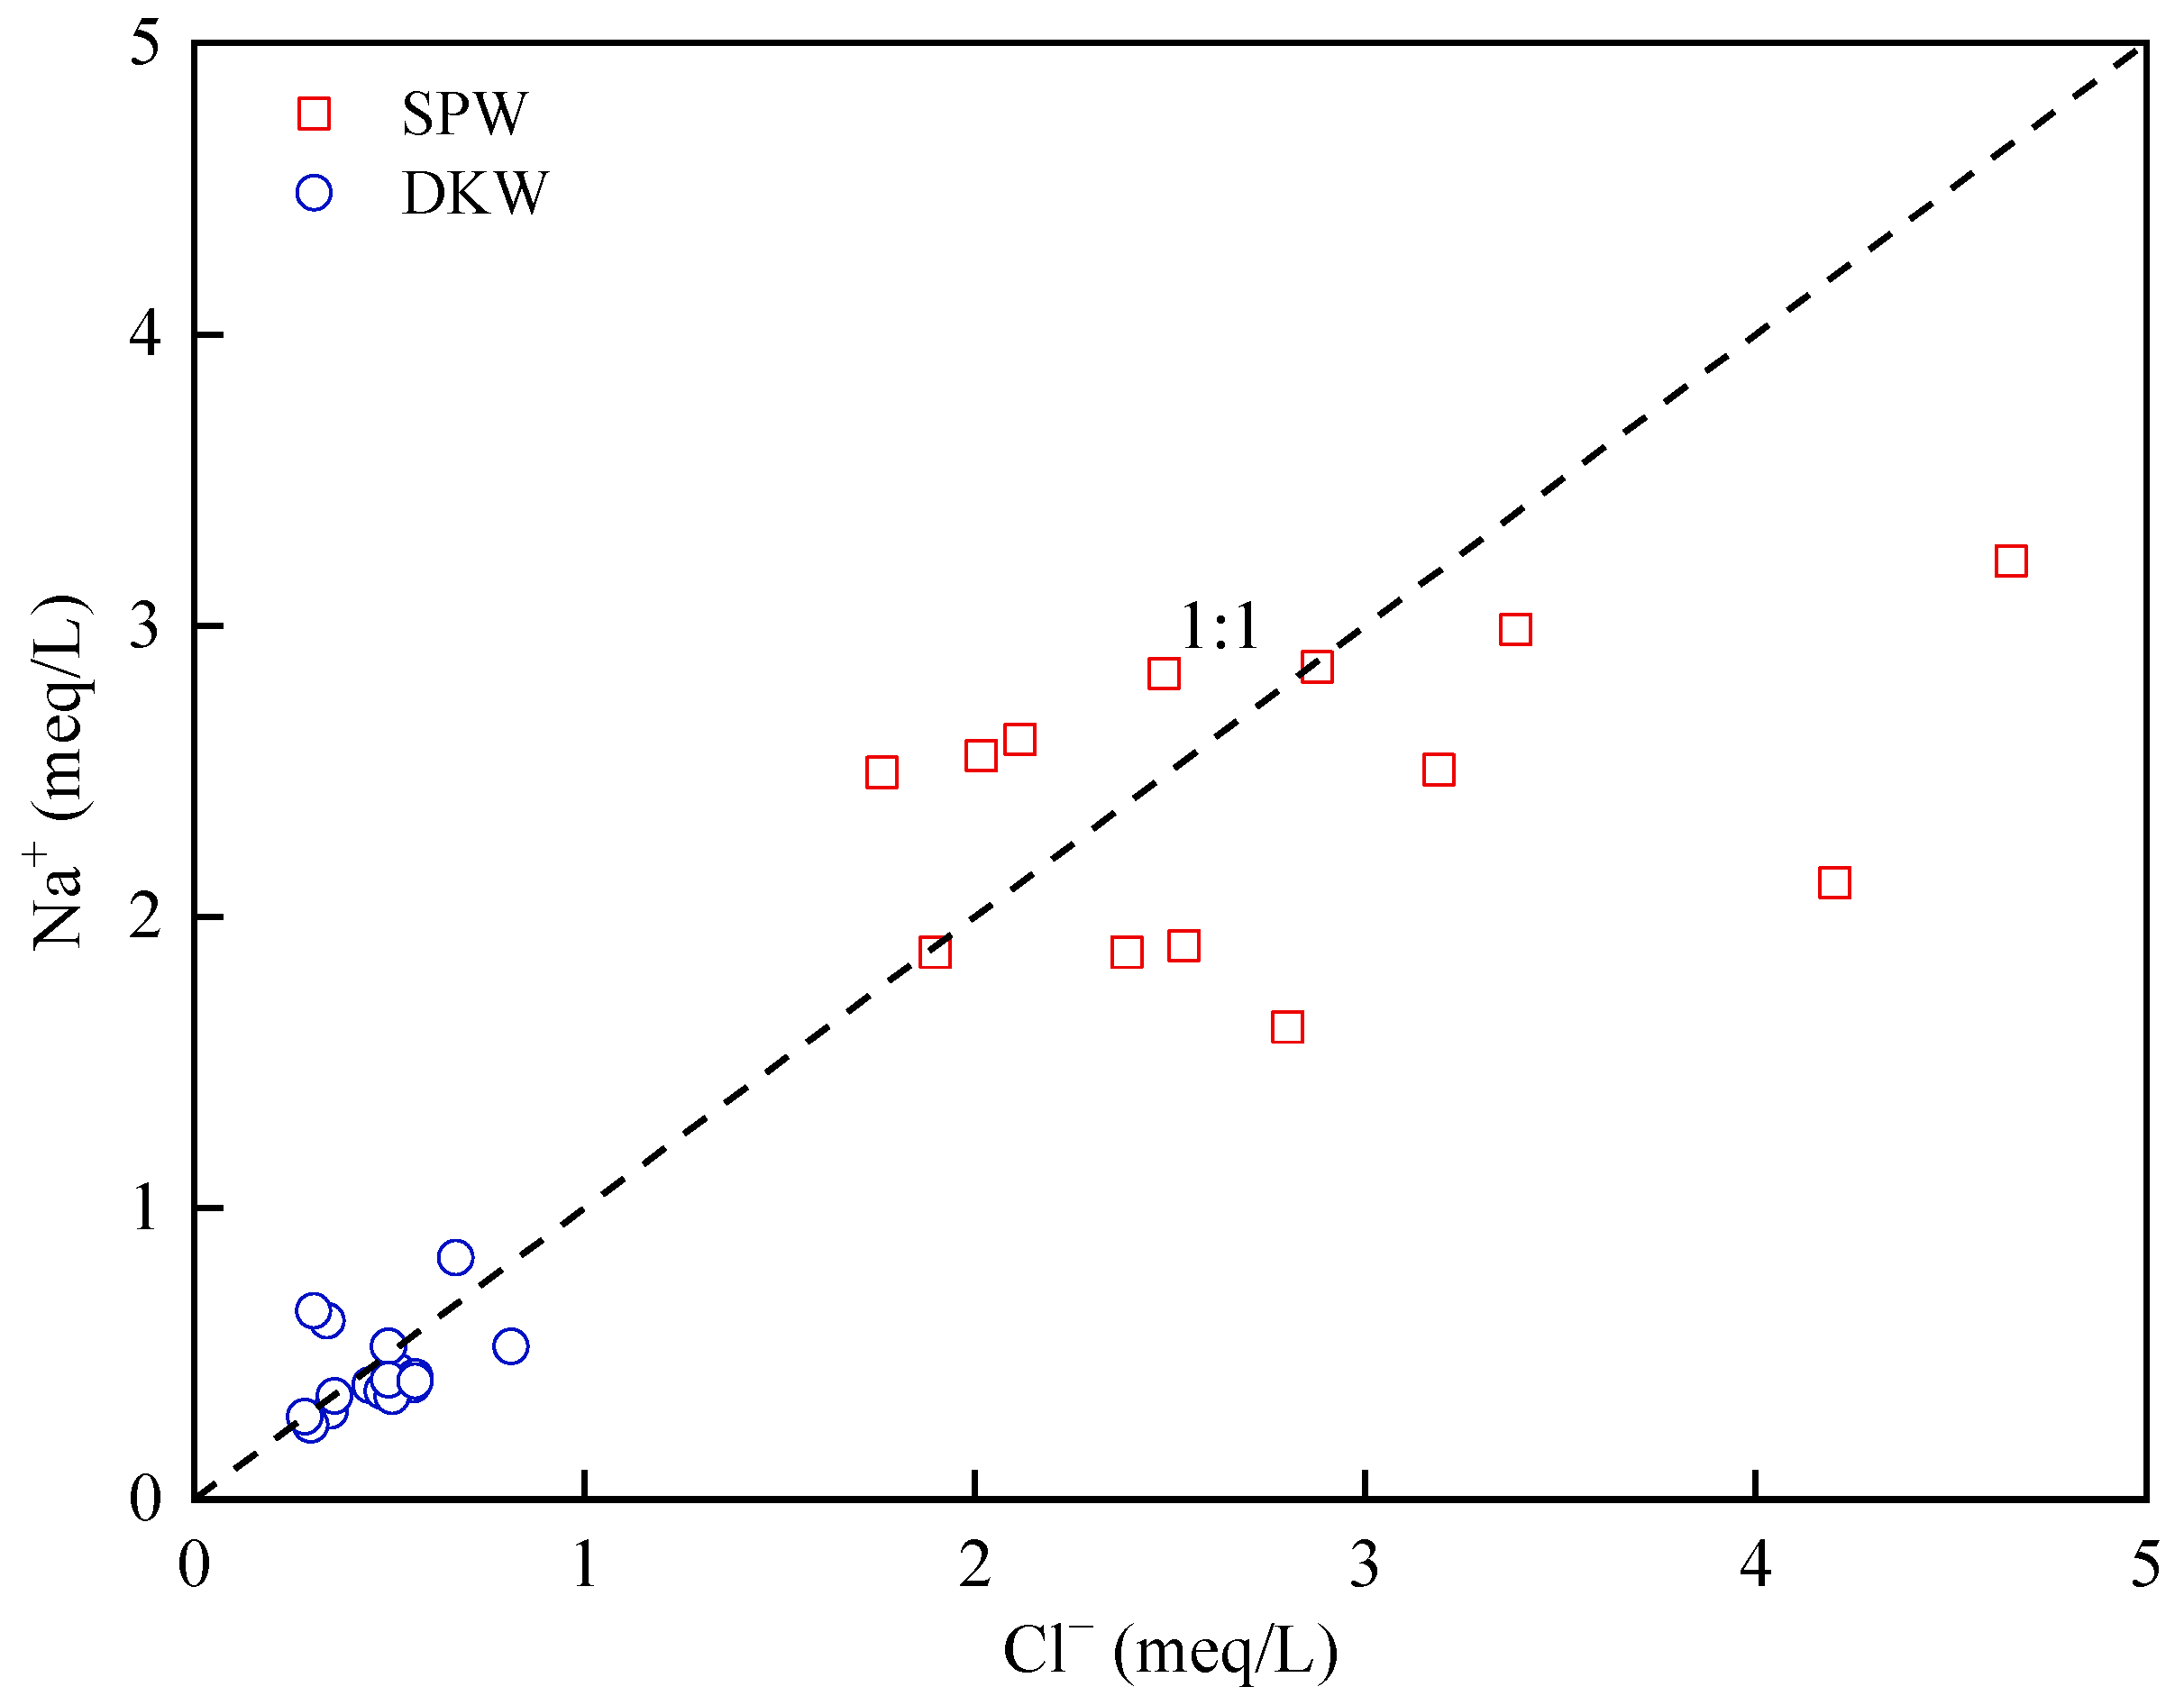
Generally, the equivalent ratio of Na+/Cl should be 1 if the Na+ and Cl in groundwater are completely derived from the dissolution of halite. Figure 12 shows the relative relationship between Na+ and Cl. The results showed that the DKW samples were mainly distributed near the 1:1 contour, while most of the SPW samples were distributed below the 1:1 contour, and the excess Cl may be related to human activities, especially domestic sewage discharges.

4.2. Groundwater Quality Assessment

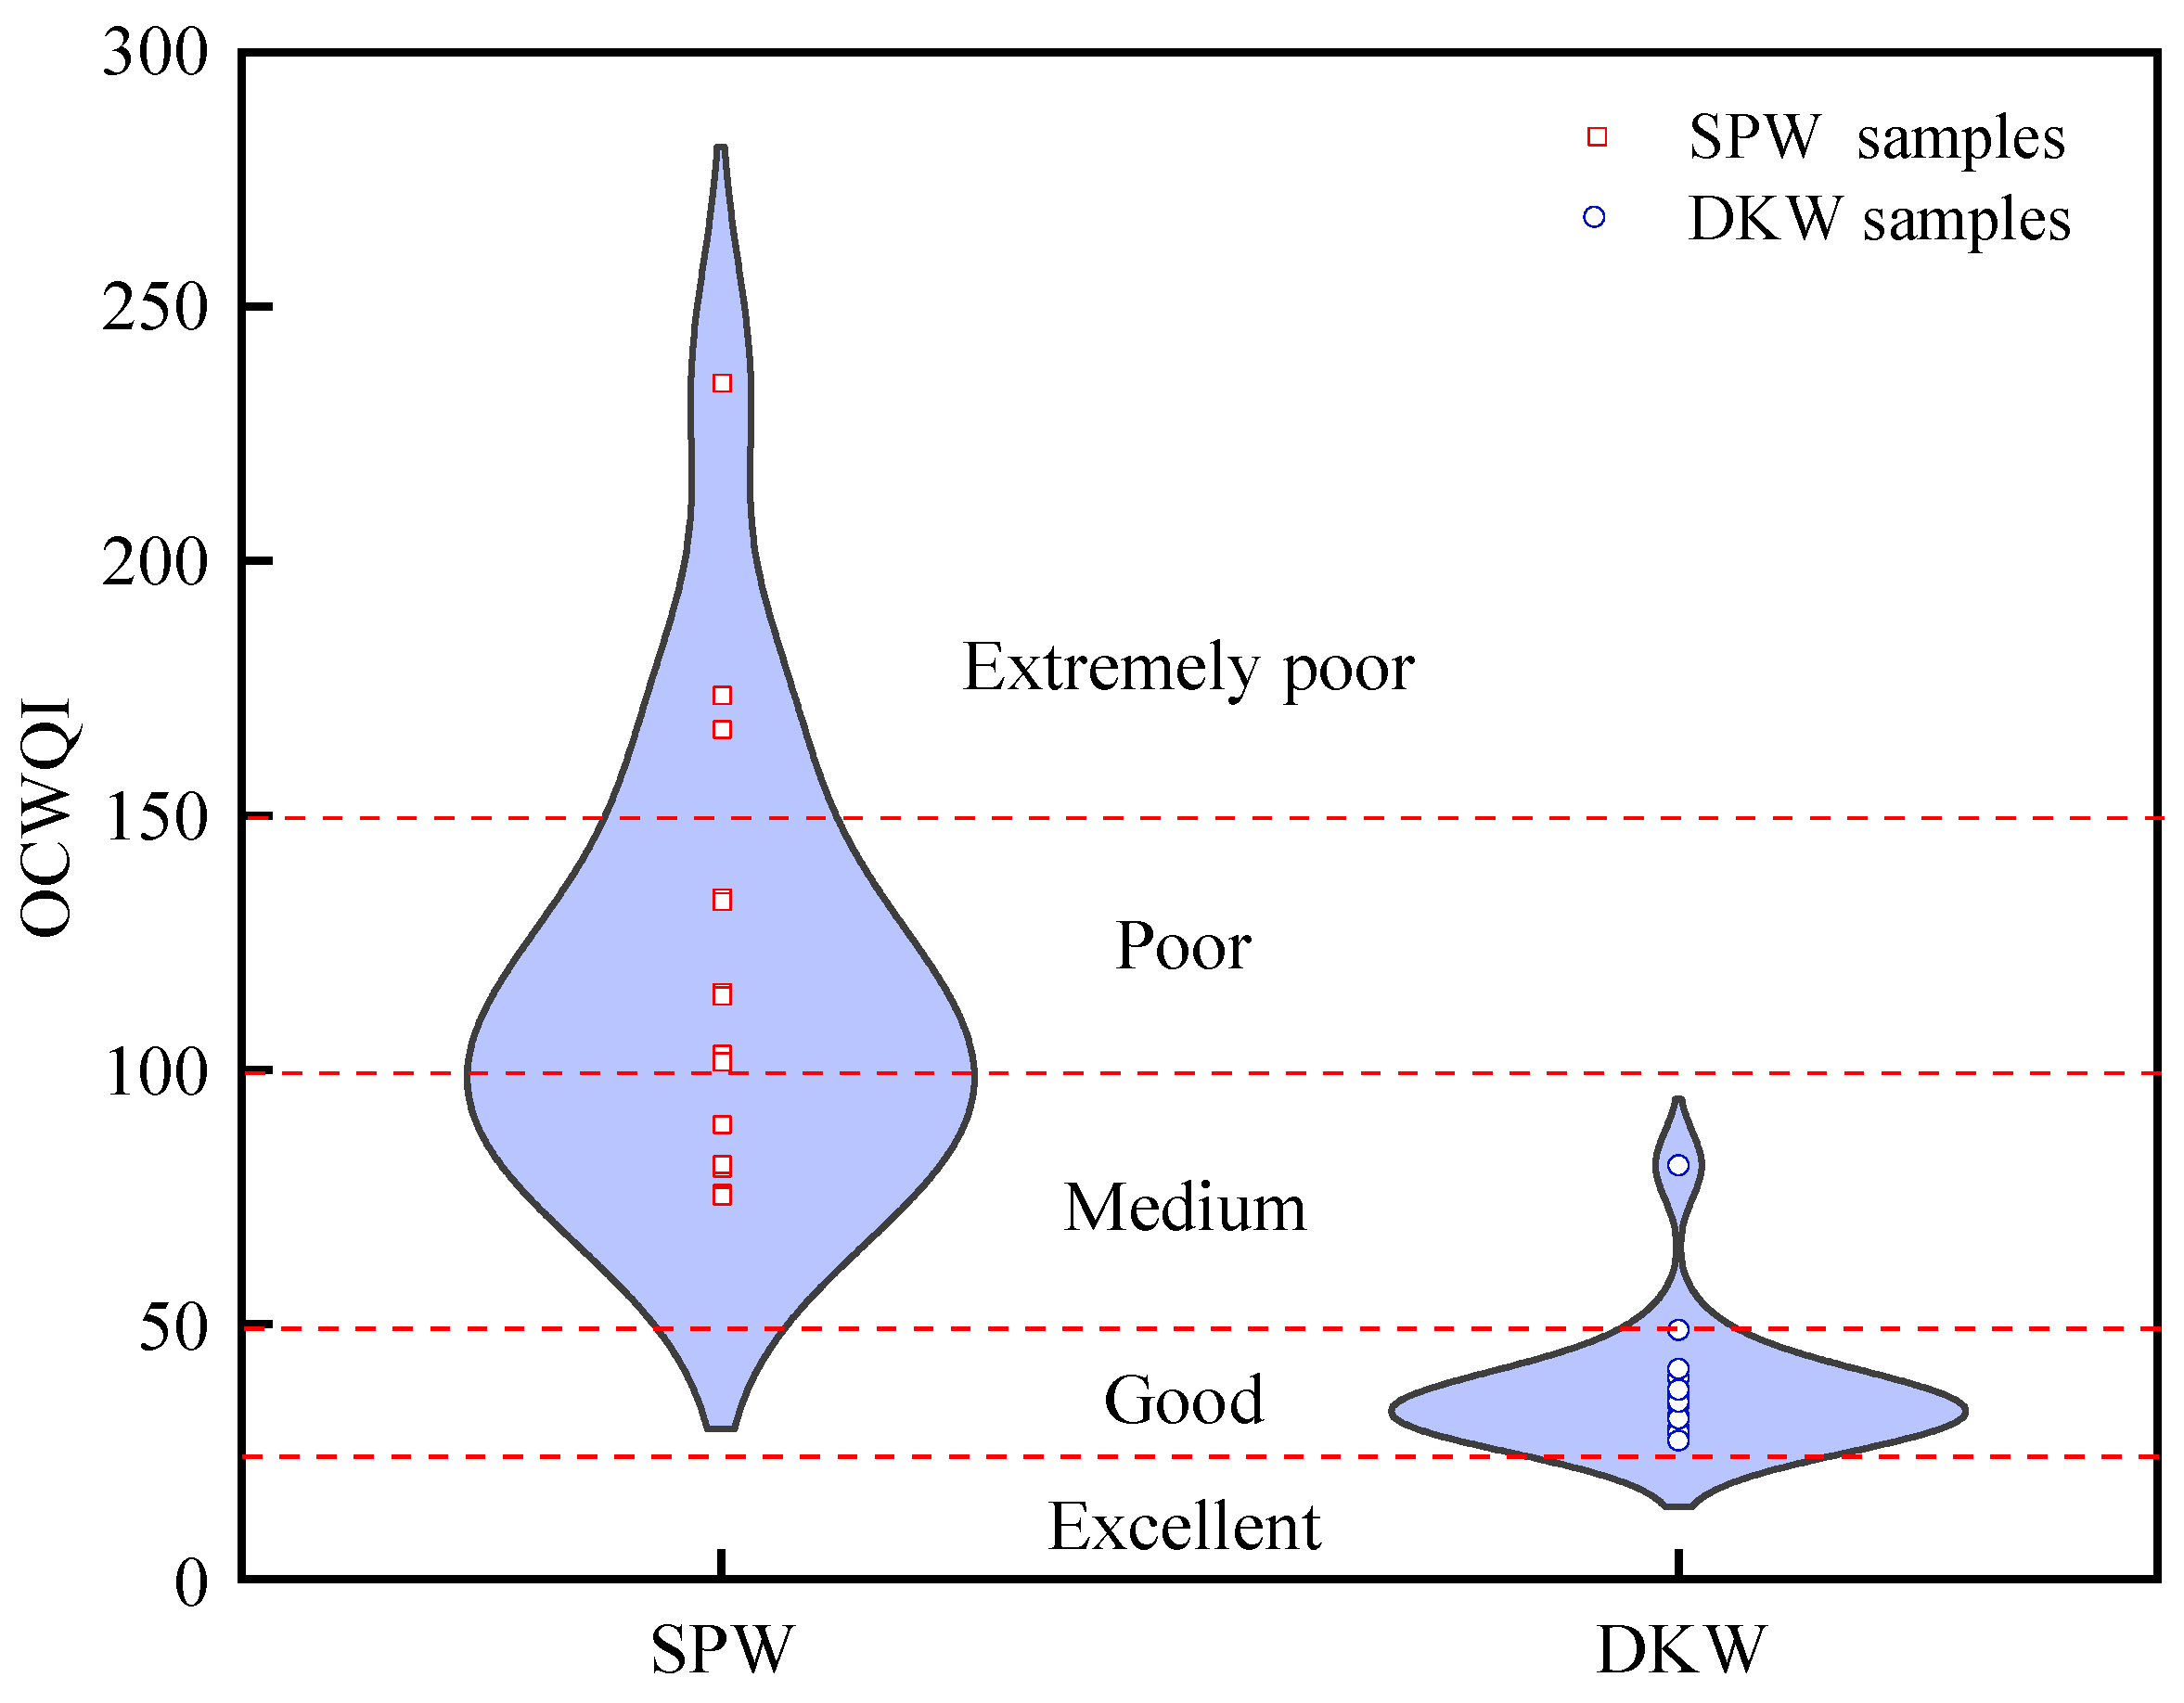
The water quality of the SPW and DKW in the study area was evaluated using the OCWQI method. Table 4 shows the combined weights of the main water quality indicators. The Cl, Na+, and NO3 had relatively large weights, which were 0.2024, 0.1482, and 0.1384, respectively.
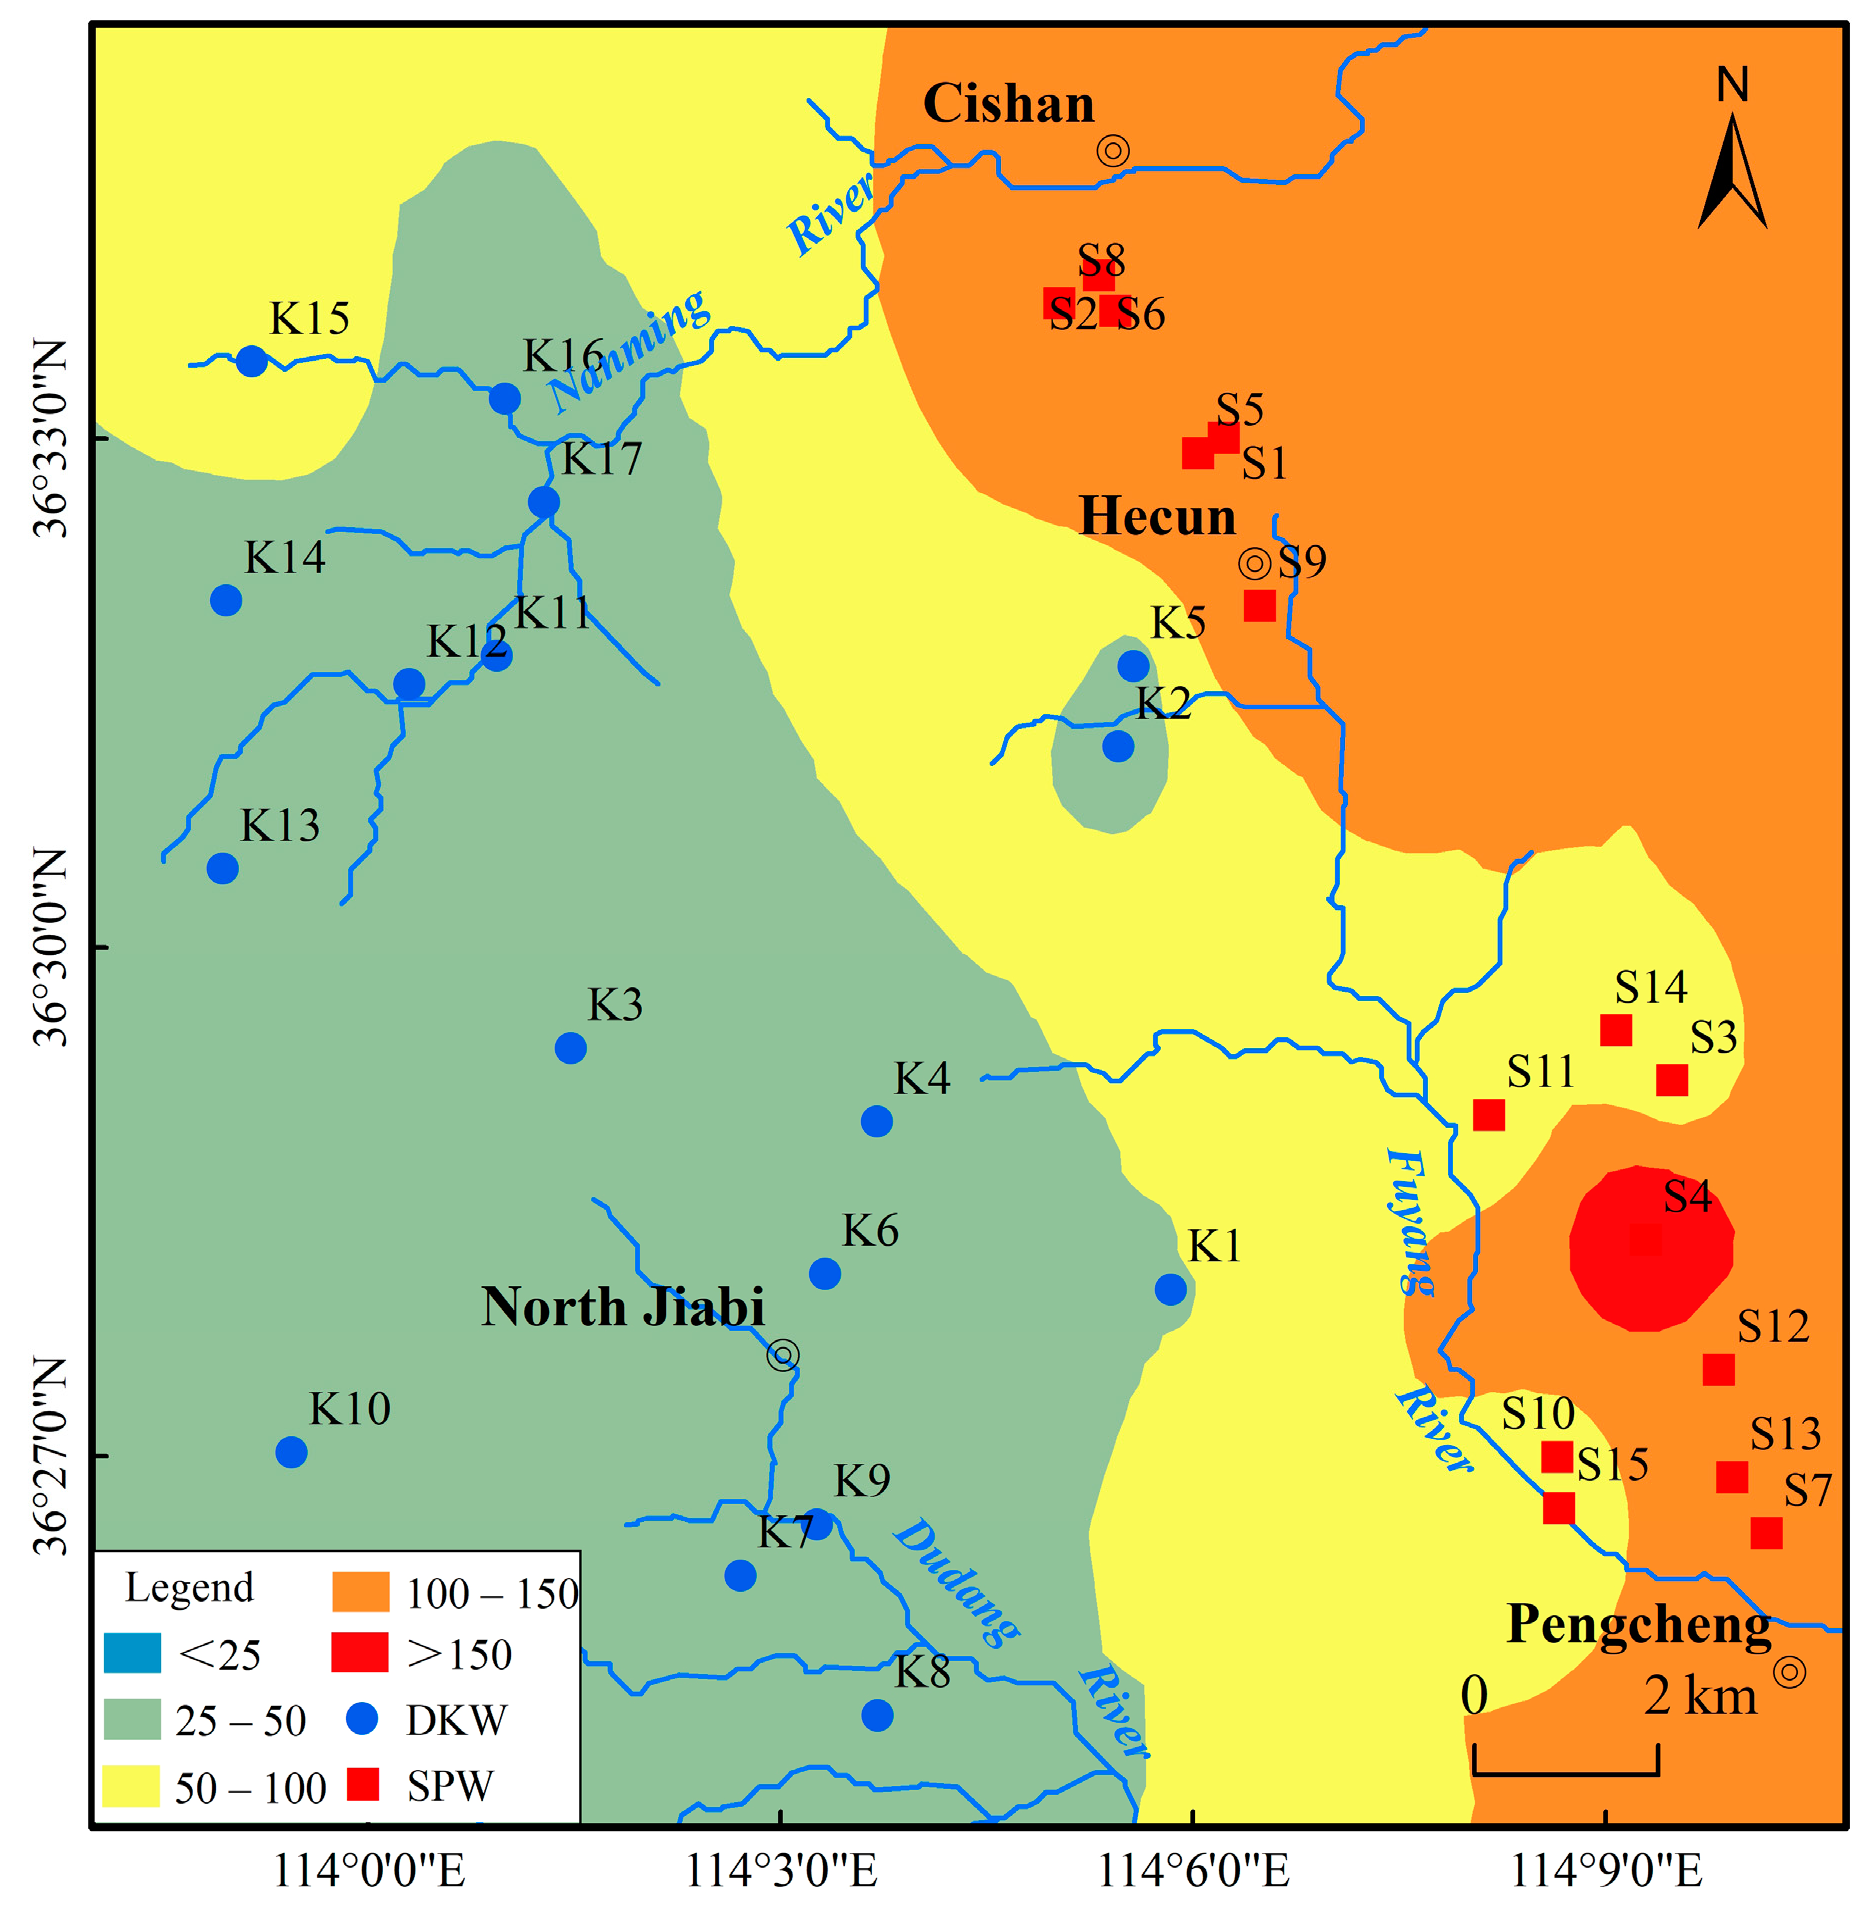
Figure 13 shows the groundwater quality classification based on the OCWQI. The results of the water quality assessment indicated the SPW samples were medium, poor, and very poor, representing 33.33%, 46.67%, and 20.00%, respectively. However, most of the DKW samples were classified as good, representing 94.12% of the total samples, and only one sample was classified as medium. The quality of the pore water was generally worse than that of the karst water (Figure 14). The area from Cishan to Pengcheng is a coal mining area, and the chemical type is mainly SO4·HCO3-Ca. The water quality of the SPW in the east is obviously worse than that of DKW in the west. The primary cause for the deterioration of shallow pore water quality is attributed to the dissolution of sulphides within the coal seam. In addition, human activities are intensive in the eastern part of the study area, and domestic sewage and agricultural fertilizers are also important factors causing shallow pore water pollution. Karst groundwater, which is less affected by human activity, is more deeply buried and its water quality is generally better, making it more suitable for drinking.

4.3. Health Risk Assessment

Assessments of the health risks associated with groundwater can effectively guide water resource management and water pollution prevention. The nitrate concentration in the groundwater within this study area was generally elevated, particularly in the eastern SPW samples. Nitrate has also been recognized as a non-carcinogenic pollutant by the USEPA. The HHRA model was developed to assess the risk of nitrate contamination of groundwater.
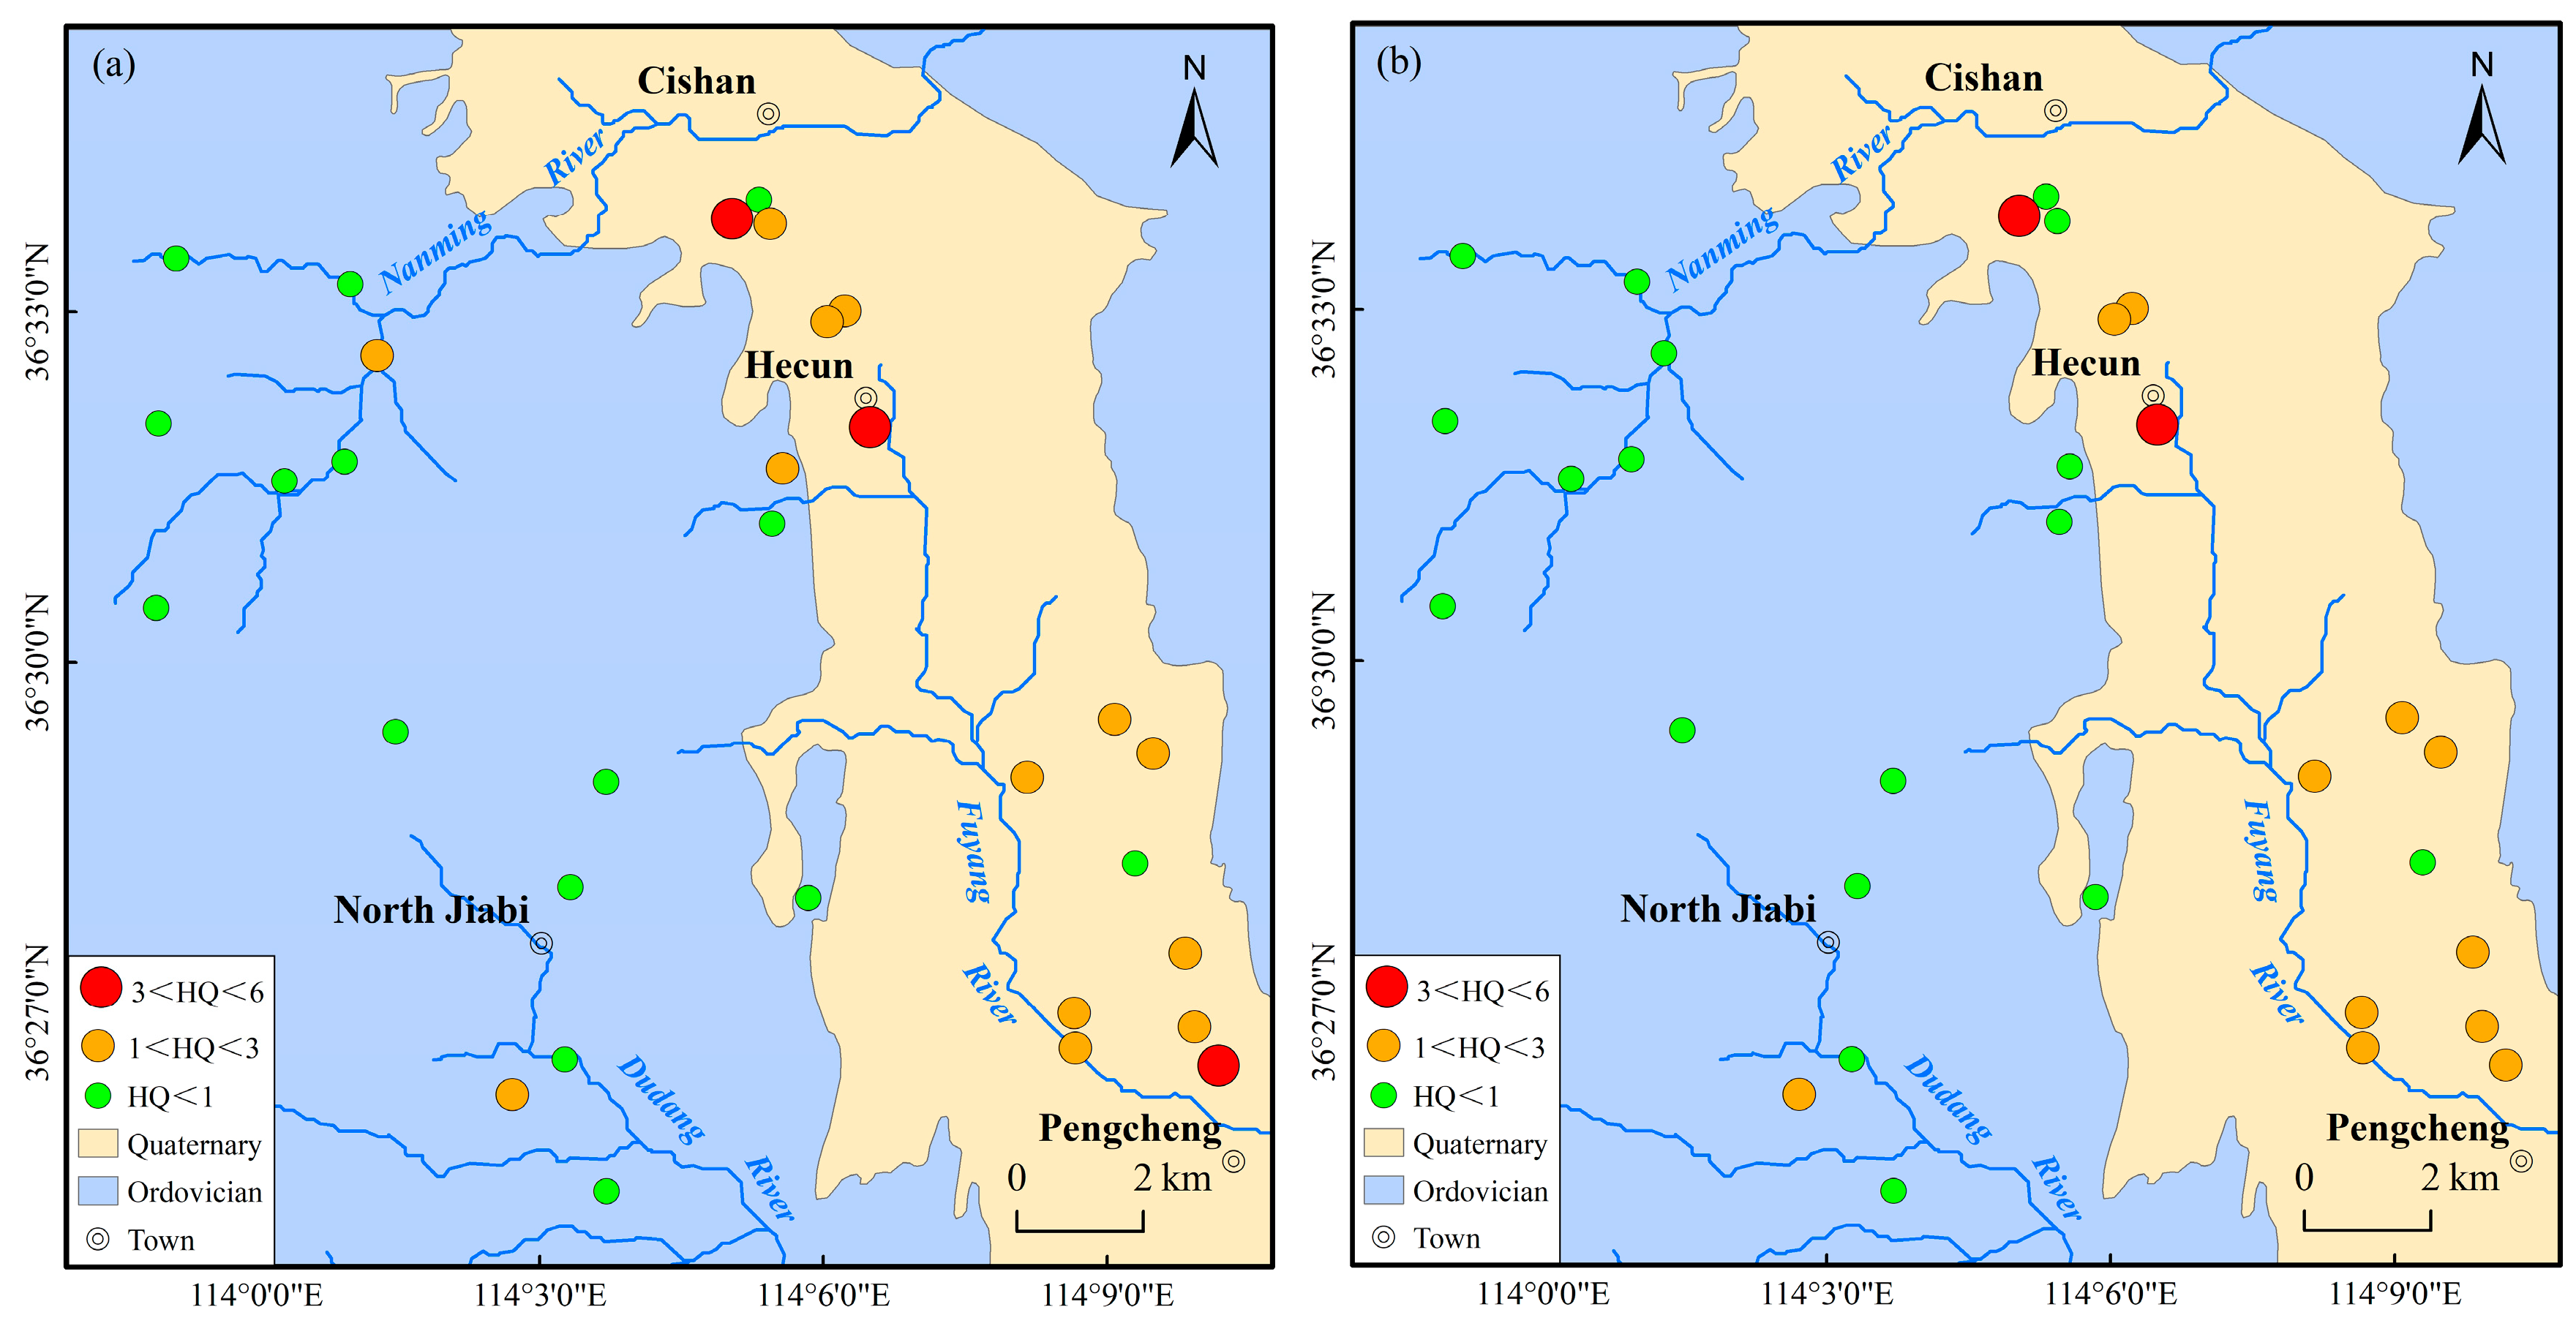
The findings showed that the Hazard Quotient (HQ) of nitrate for children ranged from 0.04 to 5.08, with an average value of 1.42, while, for adults, it ranged from 0.03 to 4.36, with an average value of 1.22. For children, of the 32 water samples evaluated (15 SPW and 17 DKW), 16 samples had HQ values less than 1 and were considered to be no risk, while 13 and 3 samples were considered to be low risk (1 < HQ ≤ 3) and high risk (3 < HQ ≤ 6), representing 40.62% and 9.38% of the samples, respectively (Figure 15a). For adults, the no-risk, low-risk, and high-risk samples were 19, 11, and 2, representing 59.38%, 34.38%, and 6.25%, respectively (Figure 15b). Children are therefore more sensitive to nitrate contamination and require higher-quality drinking water. The spatial distribution of the HQ values characterizes the generally higher non-carcinogenic risk of nitrate in the SPW samples. The SPW water samples were collected in the eastern region and were shallowly buried and more sensitive to environmental pollutants, and pollutants from human activities (agricultural fertilizers and domestic sewage) can easily enter the aquifer. From the perspective of human health, the shallow pore water in the east is no longer suitable for drinking, and the future should focus on the exploitation and protection of karst water in the west.

5. Conclusions

The groundwater in the Fengfeng coal mining area plays a crucial role as the primary water source, supporting various industries, agriculture, and the daily lives of residents. In this study, 15 SPW samples and 17 DKW samples were used to reveal the hydrogeochemical processes in groundwater systems. On this basis, an assessment of groundwater quality and its potential impact on human health was conducted. The main conclusions are as follows:
(1) The concentrations of the major water chemical components in the SPW samples were significantly elevated compared to those in the DKW samples, especially nitrate. The SPW and DKW were weakly alkaline brackish water and weakly alkaline fresh water, respectively. The water chemistry type changed from SO4·HCO3-Ca in the western recharge zone to HCO3·SO4-Ca·Mg and HCO3·Ca in the eastern discharge zone.
(2) The major mechanism controlling the groundwater chemistry as rock weathering, and the chemical components in the SPW and DKW mainly originated from the dissolution of silicates and carbonates. The oxidation of pyrite and dissolution of gypsum had a more obvious change in the chemical components of the SPW and DKW. Cation exchange reactions and human activities also influenced the groundwater chemistry, although they were not dominant factors.
(3) The groundwater quality of the SPW samples was medium, poor, and extremely poor, accounting for 33.33%, 46.67%, and 20.00%, respectively. However, most of the DKW samples were classified as good, accounting for 94.12%. The evaluation results of water quality indicated that the SPW was obviously worse than the DKW, which was related to the intensive human activities in the east.
(4) The non-carcinogenic risk associated with groundwater nitrate pollution was found to be higher in children, with an average Hazard Quotient (HQ) of 1.42 compared to 1.22 for adults. The spatial distribution of HQ corresponded to groundwater quality. Agricultural fertilizers and domestic sewage contributed more nitrate to the SPW.
(5) The eastern region has a high population density and intensive agricultural, industrial, and mining activities, and SPW is easily contaminated. The findings from the assessment of groundwater quality and health risks indicated that the SPW is not suitable for consumption. The department of water resources management should prioritize the conservation of groundwater resources and ensure the safety of potable water.

Author Contributions

Conceptualization, Z.Z., H.L. and F.Z.; methodology, Z.Z., H.L. and F.Z.; software, F.D.; validation, Z.Z., H.L., F.Z. and J.Q.; formal analysis, Z.Z. and H.L.; investigation, Z.Z. and H.L.; resources, F.Z.; data curation, S.H.; writing—original draft preparation, Z.Z. and H.L.; writing—review and editing, Z.Z. and H.L.; visualization, Z.Z. and H.L.; supervision, S.H.; project administration, F.Z.; funding acquisition, F.Z., F.D. and J.Q. All authors have read and agreed to the published version of the manuscript.

Funding

This research was funded by the China Geological Survey Project (DD20230077, DD20221754), the National Natural Science Foundation of China (41831289), the S&T Program of Hebei (22373601D), and the Natural Science Foundation of Hebei Province (E2021403001).

Data Availability Statement

Data are contained within the article.

Conflicts of Interest

The authors declare no conflict of interest.

References

  1. Baciocchi, R.; Berardi, S.; Verginelli, I. Human health risk assessment: Models for predicting the effective exposure duration of on-site receptors exposed to contaminated groundwater. J. Hazard. Mater. 2010, 181, 226–233. [Google Scholar] [CrossRef] [PubMed]
  2. Hu, K.; Huang, Y.; Li, H.; Li, B.; Chen, D.; White, R.E. Spatial variability of shallow groundwater level, electrical conductivity and nitrate concentration, and risk assessment of nitrate contamination in North China Plain. Environ. Int. 2005, 31, 896–903. [Google Scholar] [CrossRef]
  3. Xu, Y.; Xue, X.; Dong, L.; Nai, C.; Liu, Y.; Huang, Q. Long-term dynamics of leachate production, leakage from hazardous waste landfill sites and the impact on groundwater quality and human health. Waste Manag. 2018, 82, 156–166. [Google Scholar] [CrossRef] [PubMed]
  4. Panhwar, A.H.; Kazi, T.G.; Afridi, H.I.; Shaikh, H.R.; Arain, S.A.; Arain, S.S.; Brahman, K.D. Evaluation of Calcium and Magnesium in Scalp Hair Samples of Population Consuming Different Drinking Water: Risk of Kidney Stone. Biol. Trace Elem. Res. 2013, 156, 67–73. [Google Scholar] [CrossRef]
  5. Rani, A.; Parashar, K.; Meena, R.; Sharma, S.K.; Tiwari, K.K.; Ajaykumar, V.; Mondal, N.C. Hydrochemical characteristics and potential health risks of nitrate, fluoride, and uranium in Kota district, Rajasthan, India. Environ. Sci. Pollut. Res. 2023, 30, 82485–82505. [Google Scholar] [CrossRef]
  6. Chakraborti, D.; Rahman, M.M.; Ahamed, S.; Dutta, R.N.; Pati, S.; Mukherjee, S.C. Arsenic contamination of groundwater and its induced health effects in Shahpur block, Bhojpur district, Bihar state, India: Risk evaluation. Environ. Sci. Pollut. Res. 2016, 23, 9492–9504. [Google Scholar] [CrossRef]
  7. Janardhana Raju, N. Arsenic exposure through groundwater in the middle Ganga plain in the Varanasi environs, India: A future threat. J. Geol. Soc. India 2012, 79, 302–314. [Google Scholar] [CrossRef]
  8. Chakraborti, D.; Rahman, M.M.; Das, B.; Chatterjee, A.; Das, D.; Nayak, B.; Pal, A.; Chowdhury, U.K.; Ahmed, S.; Biswas, B.K.; et al. Groundwater arsenic contamination and its health effects in India. HydJ 2017, 25, 1165–1181. [Google Scholar] [CrossRef]
  9. Li, P.; He, X.; Li, Y.; Xiang, G. Occurrence and Health Implication of Fluoride in Groundwater of Loess Aquifer in the Chinese Loess Plateau: A Case Study of Tongchuan, Northwest China. Expo. Health 2019, 11, 95–107. [Google Scholar] [CrossRef]
  10. Dong, S.; Liu, B.; Shi, X.; Zhang, W.; Li, Z. The spatial distribution and hydrogeological controls of fluoride in the confined and unconfined groundwater of Tuoketuo County, Hohhot, Inner Mongolia, China. Environ. Earth Sci. 2015, 74, 325–335. [Google Scholar] [CrossRef]
  11. Li, X.; Han, G.; Liu, M.; Song, C.; Zhang, Q.; Yang, K.; Liu, J. Hydrochemistry and Dissolved Inorganic Carbon (DIC) Cycling in a Tropical Agricultural River, Mun River Basin, Northeast Thailand. Int. J. Environ. Res. Public Health 2019, 16, 3410. [Google Scholar] [CrossRef] [PubMed]
  12. Nadler, A.; Magaritz, M.; Mazor, E. Chemical reactions of sea water with rocks and freshwater: Experimental and field observations on brackish waters in Israel. Geochim. Cosmochim. Acta 1980, 44, 879–886. [Google Scholar] [CrossRef]
  13. Kim, Y.; Kim, J.-Y.; Kim, K. Geochemical characteristics of fluoride in groundwater of Gimcheon, Korea: Lithogenic and agricultural origins. Environ. Earth Sci. 2011, 63, 1139–1148. [Google Scholar] [CrossRef]
  14. Mao, H.; Wang, C.; Qu, S.; Liao, F.; Wang, G.; Shi, Z. Source and evolution of sulfate in the multi-layer groundwater system in an abandoned mine—Insight from stable isotopes and Bayesian isotope mixing model. Sci. Total Environ. 2023, 859, 160368. [Google Scholar] [CrossRef]
  15. Jiang, C.; Zhao, Q.; Zheng, L.; Chen, X.; Li, C.; Ren, M. Distribution, source and health risk assessment based on the Monte Carlo method of heavy metals in shallow groundwater in an area affected by mining activities, China. Ecotoxicol. Environ. Saf. 2021, 224, 112679. [Google Scholar] [CrossRef] [PubMed]
  16. Sheng, D.; Meng, X.; Wen, X.; Wu, J.; Yu, H.; Wu, M. Contamination characteristics, source identification, and source-specific health risks of heavy metal(loid)s in groundwater of an arid oasis region in Northwest China. Sci. Total Environ. 2022, 841, 156733. [Google Scholar] [CrossRef]
  17. Morgenstern, U.; Daughney, C.J. Groundwater age for identification of baseline groundwater quality and impacts of land-use intensification—The National Groundwater Monitoring Programme of New Zealand. JHyd 2012, 456–457, 79–93. [Google Scholar] [CrossRef]
  18. Ben Moussa, A.; Mzali, H.; Zouari, K.; Hezzi, H. Hydrochemical and isotopic assessment of groundwater quality in the Quaternary shallow aquifer, Tazoghrane region, north-eastern Tunisia. Quat. Int. 2014, 338, 51–58. [Google Scholar] [CrossRef]
  19. Liu, F.; Wang, S.; Wang, L.; Shi, L.; Song, X.; Yeh, T.-C.J.; Zhen, P. Coupling hydrochemistry and stable isotopes to identify the major factors affecting groundwater geochemical evolution in the Heilongdong Spring Basin, North China. J. Geochem. Explor. 2019, 205, 106352. [Google Scholar] [CrossRef]
  20. Hao, C.-M.; Huang, Y.; Ma, D.-J.; Fan, X. Hydro-geochemistry evolution in Ordovician limestone water induced by mountainous coal mining: A case study from North China. J. Mt. Sci. 2020, 17, 614–623. [Google Scholar] [CrossRef]
  21. Wang, C.; Liao, F.; Wang, G.; Qu, S.; Mao, H.; Bai, Y. Hydrogeochemical evolution induced by long-term mining activities in a multi-aquifer system in the mining area. Sci. Total Environ. 2023, 854, 158806. [Google Scholar] [CrossRef]
  22. Gao, M.; Li, X.; Qian, J.; Wang, Z.; Hou, X.; Fu, C.; Ma, J.; Zhang, C.; Li, J. Hydrogeochemical Characteristics and Evolution of Karst Groundwater in Heilongdong Spring Basin, Northern China. Water 2023, 15, 726. [Google Scholar] [CrossRef]
  23. Al-Omran, A.M.; Aly, A.A.; Al-Wabel, M.I.; Sallam, A.S.; Al-Shayaa, M.S. Hydrochemical characterization of groundwater under agricultural land in arid environment: A case study of Al-Kharj, Saudi Arabia. Arab. J. Geosci. 2015, 9, 68. [Google Scholar] [CrossRef]
  24. Li, P.; Qian, H.; Wu, J.; Chen, J.; Zhang, Y.; Zhang, H. Occurrence and hydrogeochemistry of fluoride in alluvial aquifer of Weihe River, China. Environ. Earth Sci. 2014, 71, 3133–3145. [Google Scholar] [CrossRef]
  25. Wang, Z.; Wang, C.; Wang, Z. The Hazard Analysis of Water Inrush of Mining of Thick Coal Seam Under Reservoir Based on Entropy Weight Evaluation Method. Geotech. Geol. Eng. 2018, 36, 3019–3028. [Google Scholar] [CrossRef]
  26. Liu, J.; Gao, Z.; Feng, J.; Wang, M. Identification of the hydrochemical features, genesis, water quality and potential health hazards of groundwater in Dawen River Basin, North China. Ecol. Indic. 2023, 149, 110175. [Google Scholar] [CrossRef]
  27. Feng, Y.; Fanghui, Y.; Li, C. Improved Entropy Weighting Model in Water Quality Evaluation. Water Resour. Manag. 2019, 33, 2049–2056. [Google Scholar] [CrossRef]
  28. Abdo, H.G.; Almohamad, H.; Al Dughairi, A.A.; Ali, S.A.; Parvin, F.; Elbeltagi, A.; Costache, R.; Mohammed, S.; Al-Mutiry, M.; Alsafadi, K. Spatial implementation of frequency ratio, statistical index and index of entropy models for landslide susceptibility mapping in Al-Balouta river basin, Tartous Governorate, Syria. Geosci. Lett. 2022, 9, 45. [Google Scholar] [CrossRef]
  29. Sun, Y.; Liang, X.; Xiao, C. Assessing the influence of land use on groundwater pollution based on coefficient of variation weight method: A case study of Shuangliao City. Environ. Sci. Pollut. Res. 2019, 26, 34964–34976. [Google Scholar] [CrossRef]
  30. Zhang, Q.; Xu, P.; Qian, H. Groundwater Quality Assessment Using Improved Water Quality Index (WQI) and Human Health Risk (HHR) Evaluation in a Semi-arid Region of Northwest China. Expo. Health 2020, 12, 487–500. [Google Scholar] [CrossRef]
  31. Li, P.; Li, X.; Meng, X.; Li, M.; Zhang, Y. Appraising Groundwater Quality and Health Risks from Contamination in a Semiarid Region of Northwest China. Expo. Health 2016, 8, 361–379. [Google Scholar] [CrossRef]
  32. Adimalla, N. Groundwater Quality for Drinking and Irrigation Purposes and Potential Health Risks Assessment: A Case Study from Semi-Arid Region of South India. Expo. Health 2019, 11, 109–123. [Google Scholar] [CrossRef]
  33. Guo, Y.; Zhang, C.; Xiao, Q.; Bu, H. Hydrogeochemical characteristics of a closed karst groundwater basin in North China. J. Radioanal. Nucl. Chem. 2020, 325, 365–379. [Google Scholar] [CrossRef]
  34. Lu, S.; Chen, J.; Zheng, X.; Liang, Y.; Jia, Z.; Li, X. Hydrogeochemical characteristics of karst groundwater in Jinci spring area, north China. Carbonates Evaporites 2020, 35, 68. [Google Scholar] [CrossRef]
  35. Ma, L.; Huang, T.; Qiu, H.; Yang, Z.; He, X.; Qian, J. Hydrogeochemical characteristic evaluation and irrigation suitability assessment of shallow groundwater in Dangshan County, China. Geosci. J. 2021, 25, 731–748. [Google Scholar] [CrossRef]
  36. Liu, J.; Gao, Z.; Wang, M.; Li, Y.; Shi, M.; Zhang, H.; Ma, Y. Hydrochemical characteristics and possible controls in the groundwater of the Yarlung Zangbo River Valley, China. Environ. Earth Sci. 2019, 78, 76. [Google Scholar] [CrossRef]
  37. Ryu, J.-S.; Lee, K.-S.; Chang, H.-W. Hydrochemistry and isotope geochemistry of Song Stream, a headwater tributary of the South Han River, South Korea. Geosci. J. 2007, 11, 157–164. [Google Scholar] [CrossRef]
  38. Li, S.; Gaillardet, J.; Han, G.; Calmels, D.; Liu, C. Sulfuric acid as a weathering agent of carbonate weathering constrained by δ13C: Examples from Southwest China. Chin. J. Geochem. 2006, 25, 270–271. [Google Scholar] [CrossRef]
  39. Guo, Y.; Wei, J.; Gui, H.; Zhang, Z.; Hu, M. Evaluation of changes in groundwater quality caused by a water inrush event in Taoyuan coal mine, China. Environ. Earth Sci. 2020, 79, 528. [Google Scholar] [CrossRef]
  40. Qian, J.; Tong, Y.; Ma, L.; Zhao, W.; Zhang, R.; He, X. Hydrochemical Characteristics and Groundwater Source Identification of a Multiple Aquifer System in a Coal Mine. Mine Water Environ. 2018, 37, 528–540. [Google Scholar] [CrossRef]
  41. Huang, D.; Liu, Z.; Wang, W. Evaluating the Impaction of Coal Mining on Ordovician Karst Water through Statistical Methods. Water 2018, 10, 1409. [Google Scholar] [CrossRef]
  42. Martín del Campo, M.A.; Esteller, M.V.; Expósito, J.L.; Hirata, R. Impacts of urbanization on groundwater hydrodynamics and hydrochemistry of the Toluca Valley aquifer (Mexico). Environ. Monit. Assess. 2014, 186, 2979–2999. [Google Scholar] [CrossRef] [PubMed]
  43. Liu, J.; Peng, Y.; Li, C.; Gao, Z.; Chen, S. An investigation into the hydrochemistry, quality and risk to human health of groundwater in the central region of Shandong Province, North China. J. Clean. Prod. 2021, 282, 125416. [Google Scholar] [CrossRef]
  44. Huang, S.; Guo, J.; Xie, Y.; Bian, R.; Wang, N.; Qi, W.; Liu, H. Distribution, sources, and potential health risks of fluoride, total iodine, and nitrate in rural drinking water sources of North and East China. Sci. Total Environ. 2023, 898, 165561. [Google Scholar] [CrossRef] [PubMed]
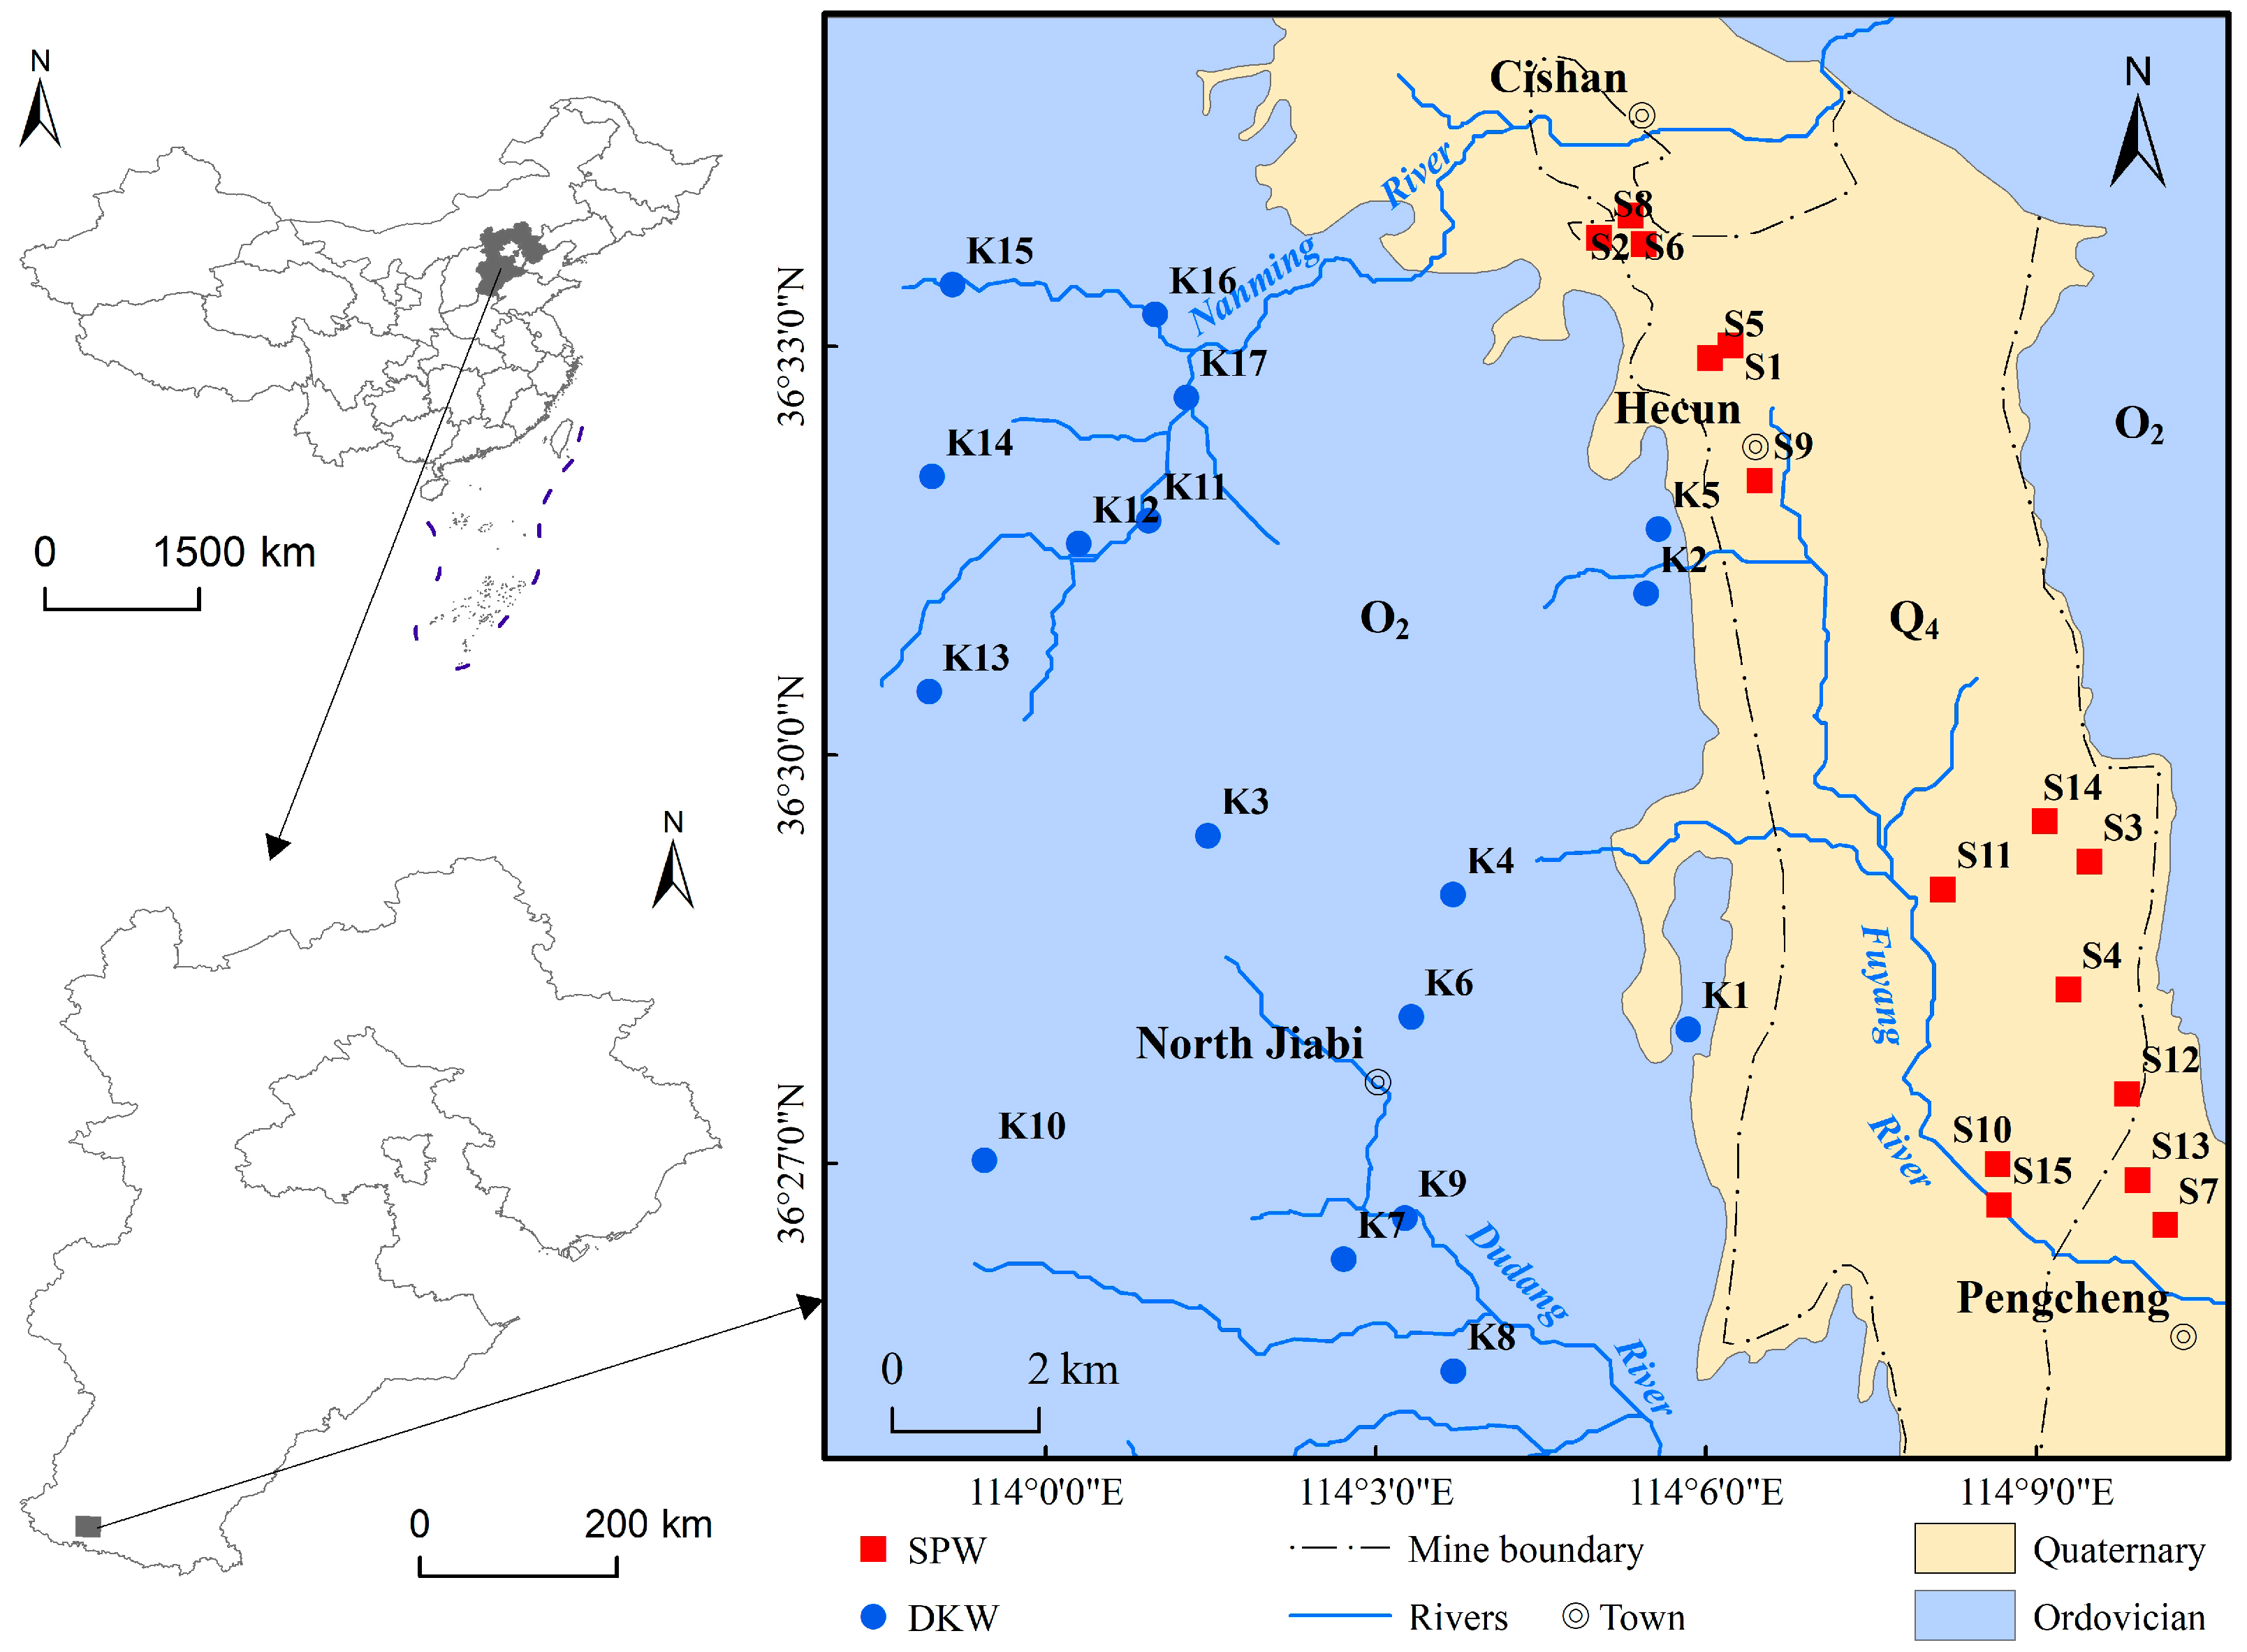
Figure 1. Location of study area, showing sampling sites for groundwater. S1–S15 and K1–K17 are SPW and DKW, respectively.
Water 15 04024 g001
Figure 2. A box plot depicting the primary chemical components in SPW and DKW.
Water 15 04024 g002aWater 15 04024 g002b
Figure 3. Piper plots for SPW samples and DKW samples.
Water 15 04024 g003
Figure 4. Correlation matrix of chemical components in (a) SPW and (b) DKW.
Water 15 04024 g004
Figure 5. Gibbs diagram for SPW and DKW.
Water 15 04024 g005
Figure 6. End-member diagram for SPW and DKW.
Water 15 04024 g006
Figure 7. Saturation index of SPW and DKW.
Water 15 04024 g007
Figure 8. Plot of Ca2+ + Mg2+ versus HCO3.
Water 15 04024 g008
Figure 9. Plot of HCO3 + SO42− versus Ca2+ + Mg2+.
Water 15 04024 g009
Figure 10. Plot of (Ca2+ + Mg2+) − (SO42− + HCO3) versus (Na+ + K+) − Cl.
Water 15 04024 g010
Figure 11. The relative relationship between NO3/Na+ and Cl/Na+.
Water 15 04024 g011
Figure 12. Plot of Na+ versus Cl.
Water 15 04024 g012
Figure 13. Violin graph of OCWQI for SPW and DKW.
Water 15 04024 g013
Figure 14. Spatial distribution of water quality based on OCWQI.
Water 15 04024 g014
Figure 15. Spatial distribution of HQ values for (a) children and (b) adults.
Water 15 04024 g015
Table 1. Groundwater quality categories based on OCWQI.
OCWQI<2525–5050–100100–150>150
ClassificationsExcellentGoodMediumPoorExtremely poor
Table 2. The parameters of the HHRA model.
ParametersAdultsChildren
IR (in L/day)1.50.78
ED (in year)3012
EF (in days/year)365365
AWB (in kg)6515
AET (in days)10,9504380
Table 3. Statistical results of the main chemical components in SPW and DKW. (All components are expressed in mg/L, with the exception of pH).
ComponentsMinMaxMeanMediumSDCV
SPWDKWSPWDKWSPWDKWSPWDKWSPWDKWSPWDKW
pH6.907.407.408.207.247.817.307.800.140.230.020.03
TH622.00283.001610.00808.00936.13384.24885.00351.00270.08123.890.290.32
TDS897.00326.003295.001045.001447.87452.241277.00403.00628.16171.450.430.38
K+0.890.579.562.292.801.251.781.072.380.530.850.42
Na+37.305.89604.0019.1099.3010.1858.709.35142.683.371.440.33
Ca2+191.0062.20496.00243.00298.13110.17291.00103.0085.1041.130.290.37
Mg2+26.6019.1090.2048.8046.7126.6140.8023.8016.697.320.360.28
Cl62.5010.10172.0028.80108.0216.8699.3017.7037.355.040.350.30
SO42−267.0058.001810.00572.00611.40122.74547.0087.70391.95122.080.640.99
HCO3251.00189.00526.00316.00347.67262.24352.00266.0073.6631.350.210.12
NO316.301.73244.0157.57107.6033.3395.6634.6861.2014.020.570.42
F0.230.152.400.520.500.270.340.250.540.101.080.38
Table 4. Weight calculation results based on OCWQI.
ComponentsWejWcjWoj
pH0.24650.00630.0472
F0.05350.14390.1046
NO30.11580.11620.1384
TH0.13020.07500.1179
TDS0.08930.10180.1137
Na+0.05420.28520.1482
SO42−0.07740.14780.1276
Cl0.23300.12360.2024
Disclaimer/Publisher’s Note: The statements, opinions and data contained in all publications are solely those of the individual author(s) and contributor(s) and not of MDPI and/or the editor(s). MDPI and/or the editor(s) disclaim responsibility for any injury to people or property resulting from any ideas, methods, instructions or products referred to in the content.