Article

Water and Salinity Variation along the Soil Profile and Groundwater Dynamics of a Fallow Cropland System in the Hetao Irrigation District, China

1
College of Water Conservancy and Civil Engineering, Inner Mongolia Agricultural University, Hohhot 010018, China
2
High Efficiency Water-Saving Technology and Equipment and Soil and Water Environment Effect, Engineering Research Center of Inner Mongolia Autonomous Region, Hohhot 010018, China
3
School of Materials Science and Engineering, Beihang University, Beijing 100191, China
*
Authors to whom correspondence should be addressed.
These authors contributed equally to this work.
Water 2023, 15(23), 4098; https://doi.org/10.3390/w15234098
Submission received: 31 October 2023 / Revised: 17 November 2023 / Accepted: 23 November 2023 / Published: 26 November 2023
(This article belongs to the Special Issue Design and Management of Agricultural Drainage Systems)

Abstract

:
Managing soil salinity has always been a difficult problem for agriculture. Balancing water and salt while maintaining crop quality and yield is a key issue for agricultural sustainability. The Hetao lrrigation District in China has a complex mix of cultivated and uncultivated land which plays a crucial role in soil salinization processes. To investigate the dynamic properties of soil moisture and salinity, soil ions and groundwater, cultivated and fallow soils in the Hetao lrrigation District were analyzed, side by side, using a combination of field and laboratory tests, with data processed using univariate and multivariate statistical approaches. The results showed that soil moisture increased with increasing soil depth in both cultivated and fallow soils. Salinity showed an increasing trend in 2022 and 2023 from April to September. The soil ions were mainly sulfate in the cultivated soils and chloride in the fallow soils. The characteristic factors affecting salt accumulation in cultivated soils are Na++K+, Cl, SSC, SO42−, HCO3, and pH, and the characteristic factors affecting salt accumulation in fallow soils are Na++K+, Cl, SSC, HCO3, and pH. Water table depth varied with irrigation and precipitation and was strongly influenced by external environmental factors. Groundwater salinity remained stable throughout the study period. This study provides a theoretical basis for the prevention and control of soil salinization in arid and semiarid areas through the “dry drainage salt” measure.

1. Introduction

Soil salinization is one of the most important factors restricting grain yield and sustainable agricultural development [1,2], threatening at least 20% of global cultivated land [3]. The degree of soil salinization is especially severe in arid and semiarid areas with low precipitation and high evaporation rates [4]. Salinized soils can inhibit crop growth, reduce food production, and reduce fertilizer-use efficiency, seriously affecting sustainable agricultural development [5].
The Hetao Irrigation District, situated in the Yellow River Basin of China, is a large irrigation district that uses the Yellow River for its irrigation needs. Large quantities of salts are introduced into the area when Yellow River water is utilized for irrigation purposes. The accumulation of salts in the soil is exacerbated by inadequate drainage conditions, resulting in a more severe degree of salinization inside the irrigation district compared to other areas [6]. It has been noted that the wasteland situated within the interior of the irrigation district exhibits a unique land use type due to its close proximity to cultivated land, sand, and the sea. Fallow blocks absorb excess water and salt from cultivated land and are an important drainage and salt discharge area that plays an important role in regulating the regional water–salt balance [7]. When cultivated land is irrigated, the resulting hydraulic gradient causes groundwater to migrate towards the fallow blocks, carrying excess water and salt into the fallow blocks, which is known as “dry drainage salinity”. Dry drainage salinity has a positive effect on controlling soil salinization in irrigation areas.
Numerous scholars at both the domestic and international levels have studied the effects of dry drainage salt. Gowing and Wyseure [8] were the first to propose the use of a “dry drainage salt” program to control soil salinity in areas of high evaporation. Ansari et al. [9] investigated the effect of dry drainage on soil solute transport using physical modelling and found that dry salt drainage transfers soil salt ions from irrigated to fallow areas, with a large transfer of sodium ions. F. Konukcu et al. [10] modelled the performance of a dry drainage system with different cropping patterns and water table depths in the Indus River Basin. The results show that about 50% of the potentially irrigable land should be assigned for use as an evaporative sink. Soltani et al. [11] used a combination of indoor experiments and the Hydrus-2D model to assess the capacity for dry drainage and showed that increasing the ratio of planted to unplanted widths resulted in an increase in soil salinity in the planted root zone and an unstable salt concentration. Li et al. [12] used the Hydrus-1D model to analyze the vertical transport of water and salt in the wasteland of a river-loop irrigation area. Their findings revealed that cultivated land consistently experiences salt accumulation during the reproductive period, while salt loss occurs during the autumn watering period. Ren et al. [13] formulated a water–salt balance equation to investigate the migration direction of irrigation-introduced salts. Their findings revealed that wastelands absorbed 40% of the total introduced salts, while agricultural land accommodated 39% of the total introduced salts. Wang et al. [14] analyzed the water and salt transport patterns in sand dunes and wastelands and found that the soils in these areas experienced a water -deficit state during the reproductive period and a slight salt accumulation state throughout the year. Wei et al. [15] used a Modflow model to simulate the regional configuration of various locations and different groups of cultivated wasteland area ratios in order to evaluate the effect of dry salt drainage. The results indicated that the implementation of a plug-shaped wasteland arrangement could enhance the capability of dry salt drainage measures in wasteland. Furthermore, the authors identified a critical value associated with the area ratio of cultivated wasteland, which signifies that point beyond which dry salt drainage effectiveness is reduced. The aforementioned researchers have analyzed the water and salt transport between cultivated and wastelands and examined the function of field-based dry drainage of wastelands or fallow blocks on a small scale.
Wang et al. [16] calculated the water–salt balance in the Hetao Irrigation District from 1987 to 1997. They determined that the entire irrigation area was in a state of salt accumulation and proposed the use of dry drainage measures on barren land and depressions to mitigate the salinization of cultivated soils. Yue et al. [17] investigated the Yichang Irrigation Area of the Hetao Irrigation District. They established a water and salt transport and balance model using the following components: agricultural area, nonagricultural area, and watershed. The results revealed that 53% of the accumulated salts in the agricultural area were discharged into the wasteland, while 22% were discharged into the watershed. Wu et al. [18] evaluated the role of dry salt drainage measures in mitigating excessive salt accumulation in irrigated land between 1973 and 2006. They measured spatial and temporal variations in soil salinity using a water balance equation and a river-loop irrigation area as the study area. Their findings indicated that dry salt drainage could contribute to the achievement of sustainable development by discharging salts from cultivated land. Wang et al. [19] conducted a 5-year field observation experiment on a river-loop irrigation area situated within the Yonglian irrigation domain. Their results showed that the fallow area functioned as a drainage storage reservoir, proving that dry salt drainage measures are viable techniques for controlling soil salinity by maintaining salinity balance, facilitating drainage, and removing salinity. Yu et al. [20] established a remote-sensing evapotranspiration-based model to assess the water and salt balance of irrigated and nonirrigated land. Moreover, they analyzed the roles of drought and salt drainage in a river-loop irrigation area and discovered that the average annual salt migration from irrigated to nonirrigated land was 1,517,000 t. All of the aforementioned research has showcased the effectiveness of dry drainage salinity measures when implemented on a large scale, such as in the context of irrigation districts. However, there is limited research regarding the relationship between the soil salt ion composition and groundwater system changes in cultivated and fallow blocks.
This study aims to investigate small and medium-sized fallow blocks in a river-loop irrigation area and its adjacent cultivated land. Classical statistical methods, correlation analysis, and principal component analysis were employed to examine the water and salt dynamics in the typical cultivation practices of the wasteland. In addition, we analyzed the composition of soil salt ions and changes in groundwater characteristics. The findings of this research are anticipated to contribute to the development of a theoretical basis for the prevention and control of soil salinization in irrigation areas.

2. Materials and Methods

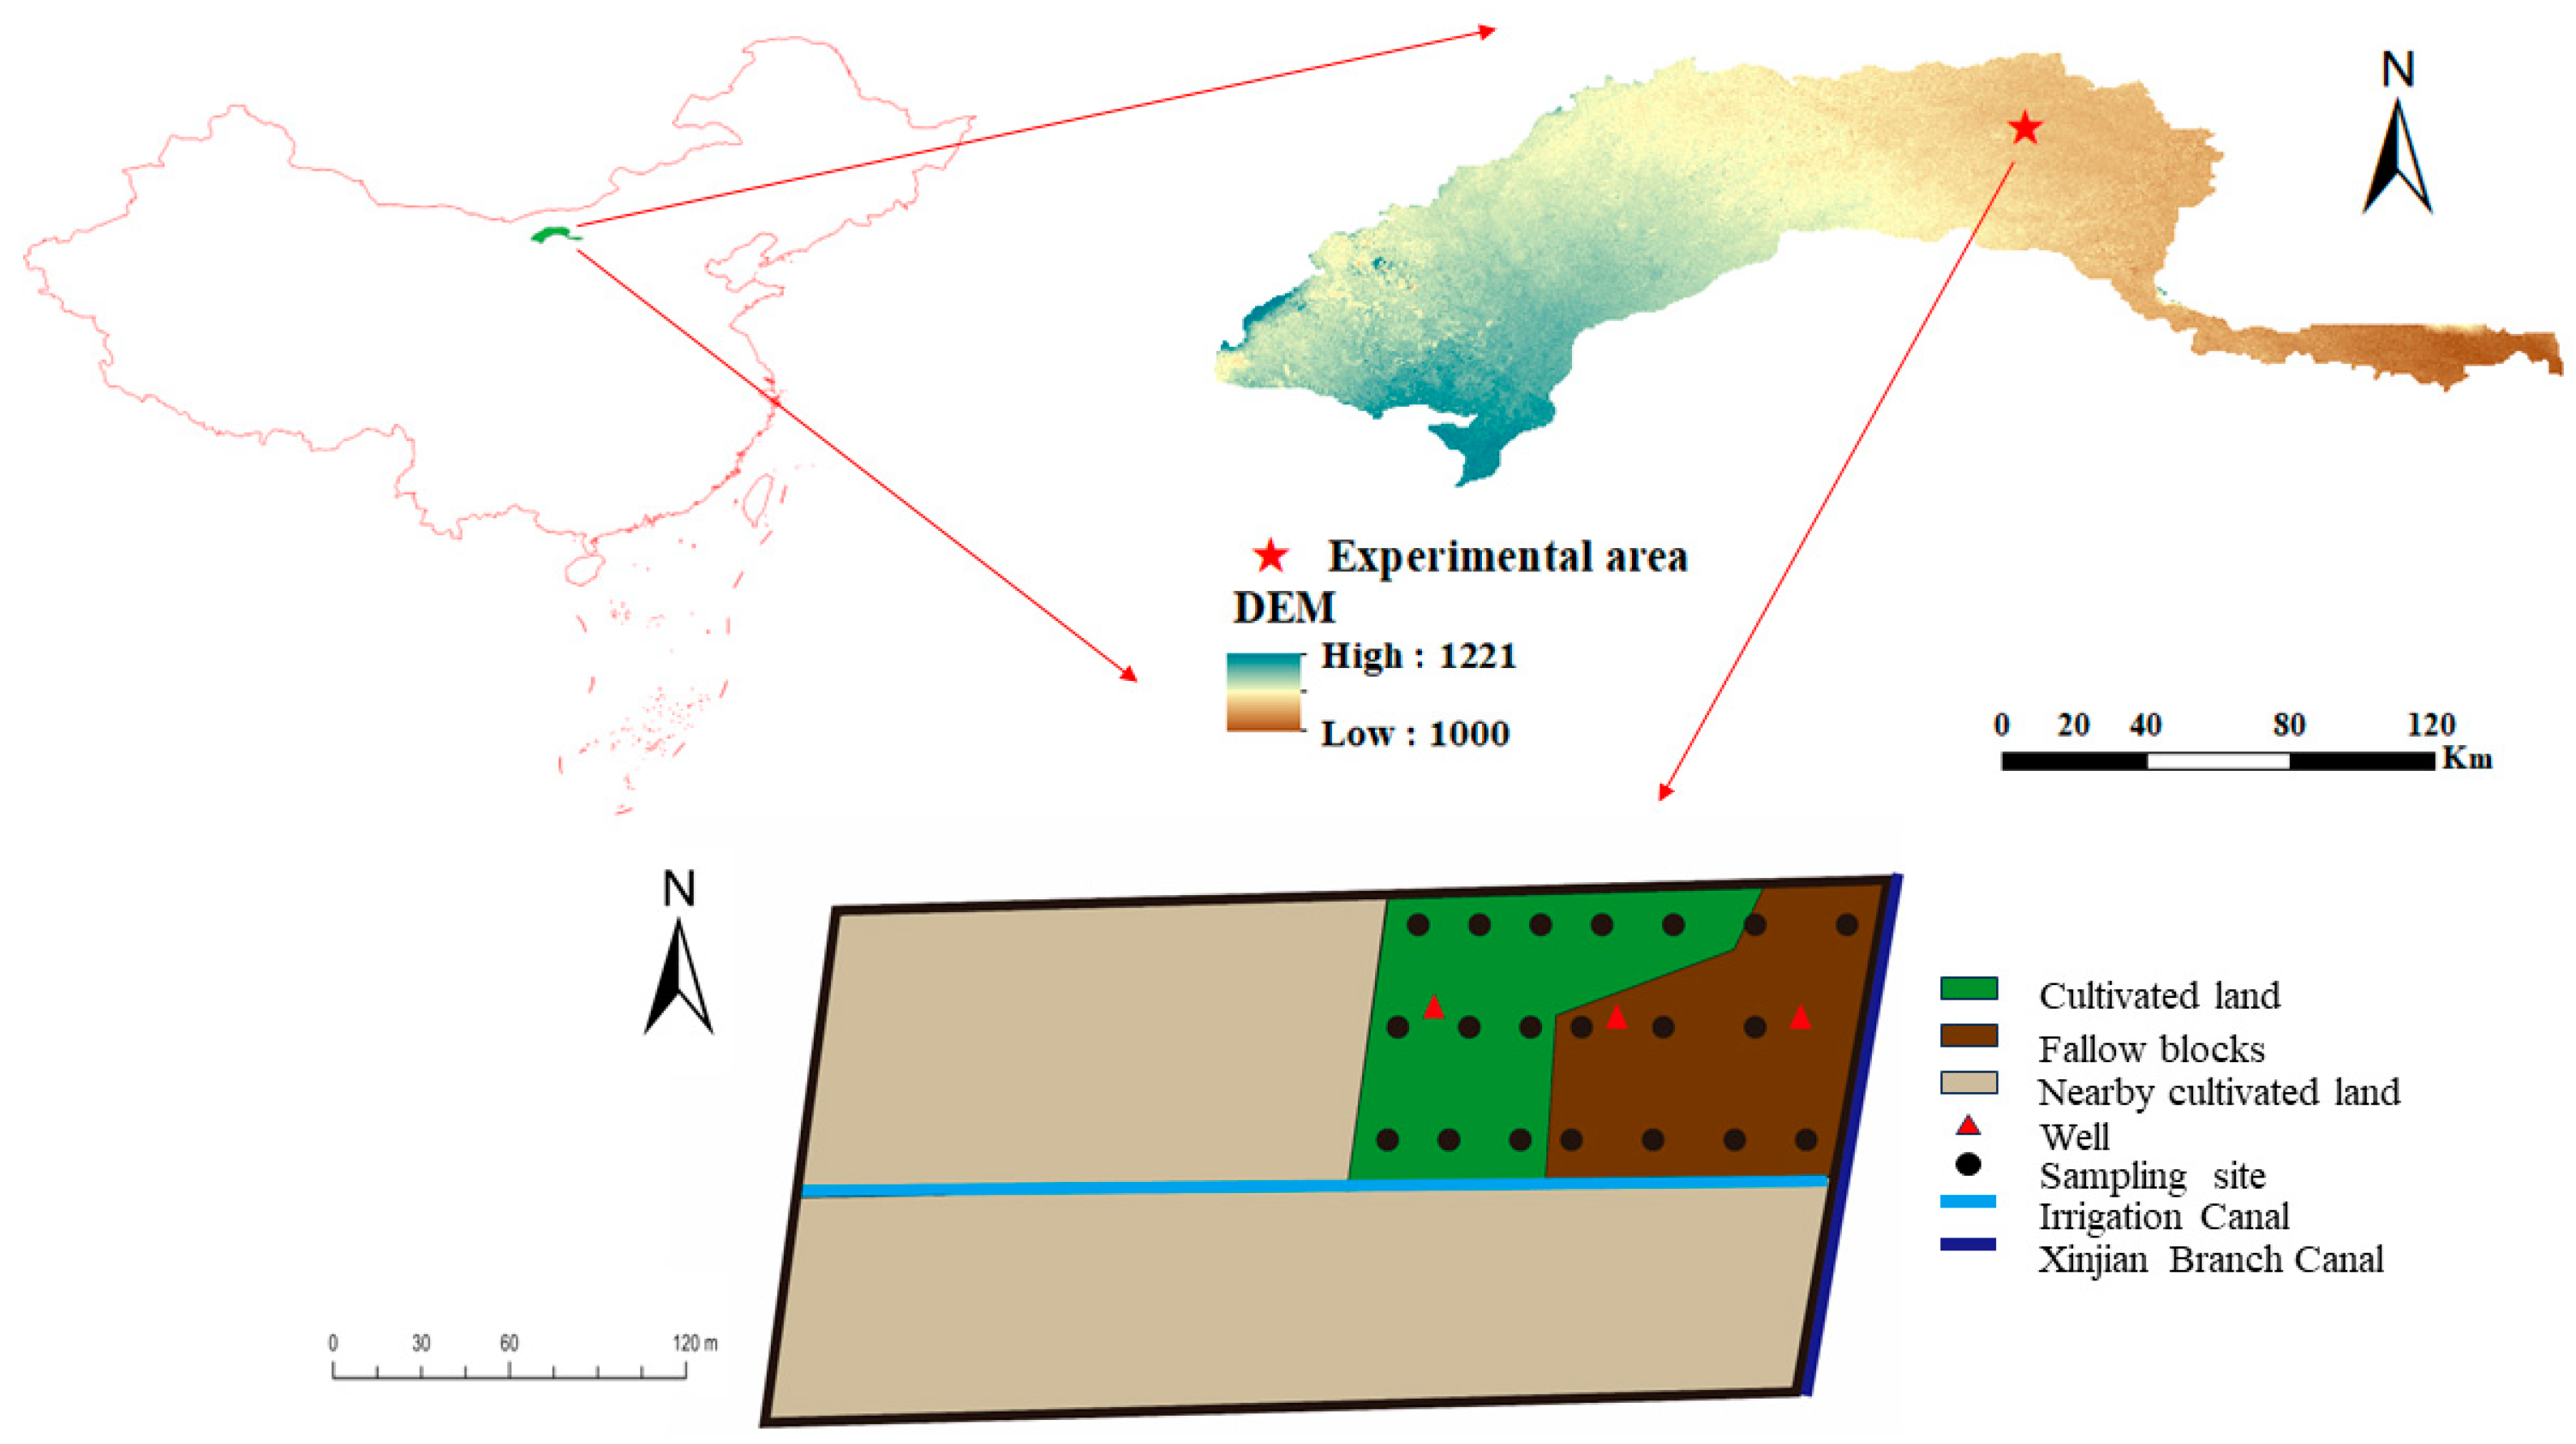
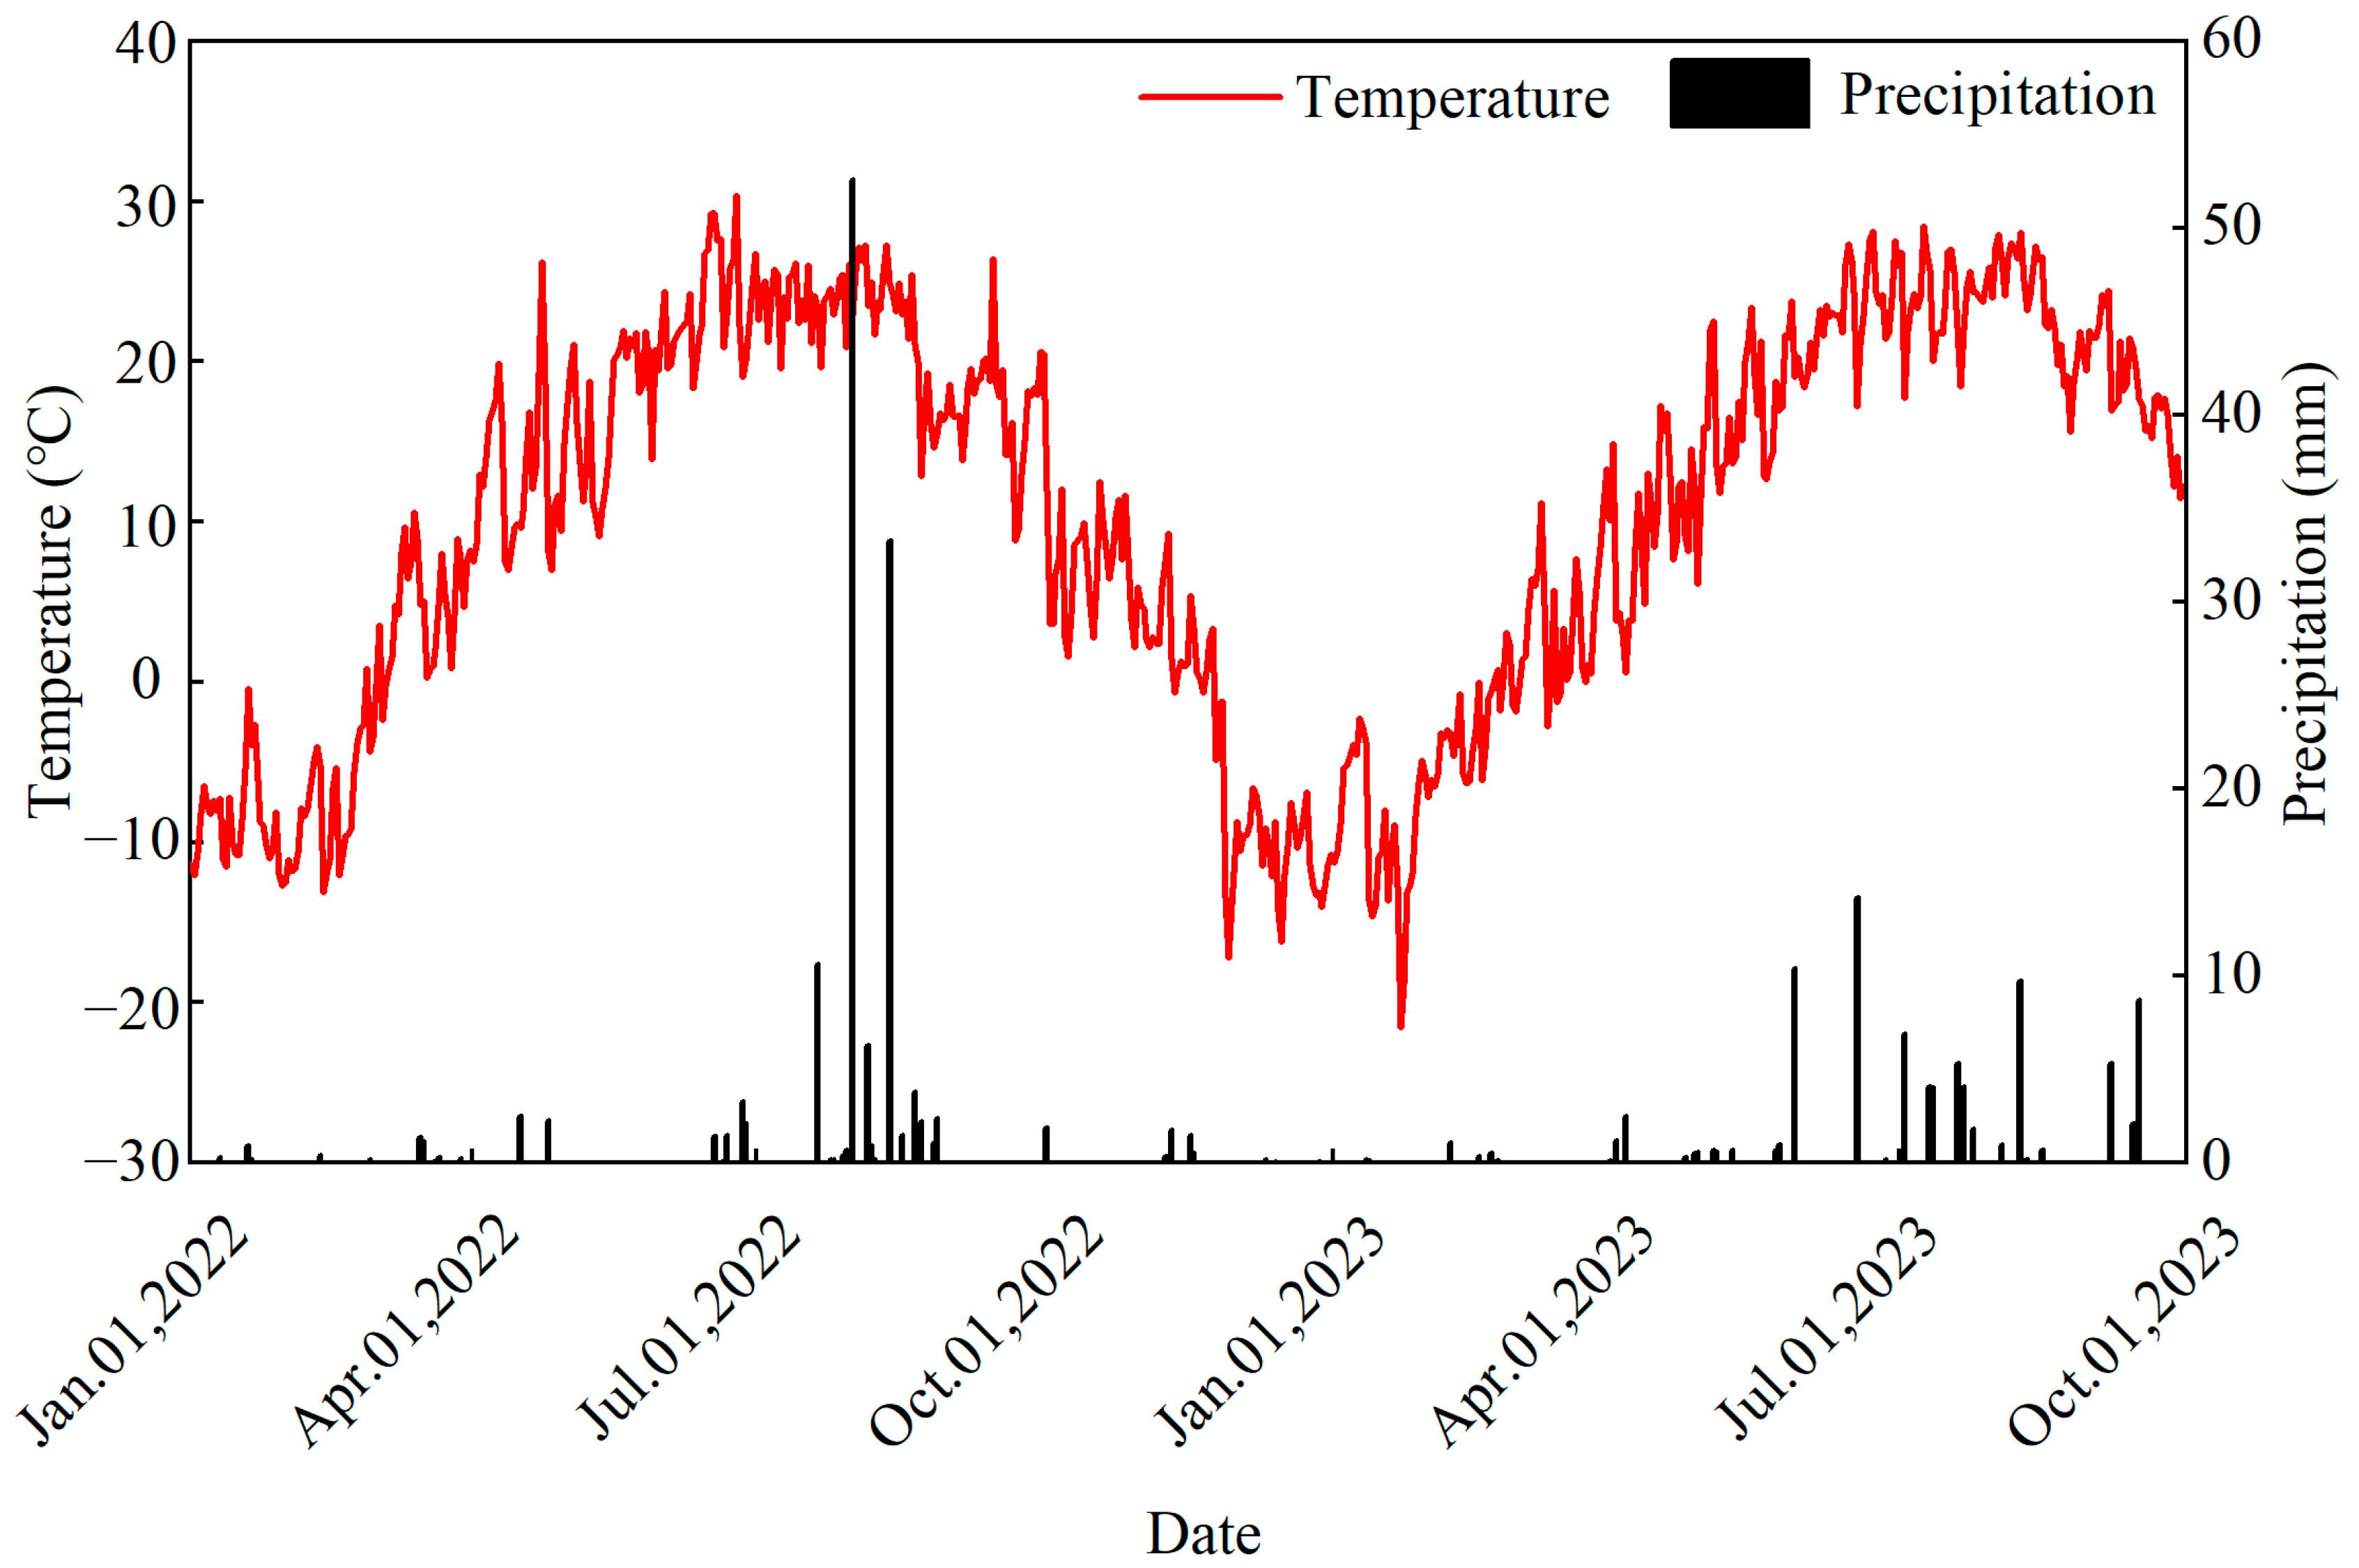
2.1. Description of the Experimental Site

The study area is located in the Zuo Er Branch Canal of the Yichang Irrigation Domain of the Hetao Irrigation District in the southern part of Tongxinquan Village, Longxingchang Town, Wuyuan County, Bayannur City, Inner Mongolia Autonomous Region (41°7′ N, 108°21′ E, 1020 m above sea level). The study area is approximately 70 m in width from east to west and 130 m in length from north to south, with a total land area of approximately 1 hm2. The location of the study area is shown in Figure 1. The study area has a mid-temperate semiarid continental climate, which is characterized by variable temperatures, dry and windy conditions, abundant sunlight, abundant light energy, low precipitation, strong evaporation, and a relatively brief frost-free period. The average rainfall is approximately 160 mm, whereas the average evaporation is approximately 2240 mm. Soil freezing commences in mid–late November each year, and thawing starts in mid-April. There are two main land -use types, namely cultivated land and wasteland, with cultivated land accounting for 50% of the total area. The study area is lined with bucket drains in the east and agricultural drains in the south, adjacent to roads. The cultivated wasteland in the study area exhibits a distinct pattern, with cultivated land occupying the western part and bordering the wasteland. Sunflower is the main crop type, and border irrigation is the primary irrigation method. The experimental period spanned from April 2022 to September 2023. Temperatures and precipitation are shown in Figure 2.

2.2. Experimental Treatments and Design

Based on the actual conditions of the study area, the sampling points were arranged in a grid of 20 m × 20 m, with a total of 21 sampling points, and the field coordinates were determined using a handheld Global Positioning System (TZ08-G138BD, Beijing, China) locator. Soil samples were obtained in layers using soil augers at soil sampling sites from April 2022 to September 2023 in six strata (0–10 cm, 10–20 cm, 20–40 cm, 40–60 cm, 60–80 cm, and 80–100 cm). The soil was evenly mixed and crushed and subsequently passed through a 1 mm mesh sieve. Following this, the soil and water were combined in an extraction solution at a mass ratio of 1:5. Soil CO32−, HCO3, Na++K+, Cl, Ca2+, Mg2+, SO42−, pH, and EC were determined. Specifically, pH was determined using a glass electrode method; Ca2+, Mg2+, and SO42− were determined by EDTA titration; CO32− and HCO3 were determined by acid titration; Cl was determined by silver nitrate titration; Na++K+ was determined by flame photometry; and EC was determined using a conductivity meter (DDS307A, Shanghai, China). A drying method was used to determine the soil moisture content.
Three groundwater level observation wells were deployed in cultivated and wasteland areas: cultivated land (j1), junction (j2), and fallow block (j3). The observation wells were 6 m long, 70 mm diameter PVC pipes buried vertically in the ground at a 5.7 m depth. The buried section was perforated and wrapped in a filter cloth, and the three observation wells were equipped with pressure transducers (DATA-6216, Beijing, China) for continuous hourly observations, which were calibrated every 7–10 days, and retrieved to measure the EC and pH of the groundwater.
A laser particle size analyzer was used to test the particle size distributions of the ground and sieved soil samples (HELOS & RODOS, Sympatec, Clausthal, Germany). The U.S. Department of Agriculture soil particle grading standard was used for the analysis. The physical properties of the soil are shown in Table 1.
The cultivated crop in the experimental area was sunflower. In 2022, sunflowers were sown on May 30 and harvested on September 15. Autumn irrigation was carried out on October 12, with an irrigation quota of about 250 mm. In 2023, sunflowers were sown on June 9 and harvested on September 23. Spring irrigation was carried out on May 12, with an irrigation quota of about 150 mm. The cultivated crop was the sunflower variety Ao 33, which was planted at a row spacing of 60 cm and plant spacing of 20 cm. Fallow block is bare land that is not ploughed, partially covered with weeds, and not irrigated.

2.3. Research Method

The formula for converting soil conductivity to total soil salinity is as follows:
C = 3.7657 E C 1 : 5 0.2405
where C represents the total soil salinity (g/kg), and EC1:5 denotes the electrical conductivity (dS/m) of the soil leachate with a soil–water ratio of 1:5.
Soil salt accumulation rate: The soil salt accumulation rate is the rate of increase in soil salinity in a certain period of time compared with the previous period in the soil profile from 0 to 100 cm and is calculated via the following formula:
t = W i W i 1 W i × 100 %
where t represents the soil salt accumulation rate (%); Wi denotes the soil salt content in period i (g/kg); and W(i−1) indicates the soil salt content in period i − 1 (g/kg).
Calculation of the soil desalination rate: The soil desalination rate is the percentage of reduction in the total salt content of the soil profile from 0 to 100 cm from the initial value and is calculated as follows:
n = S i 1 S i S i 1 × 100 %
where n represents the soil desalination rate (%); Si−1 denotes the total soil salt content before irrigation (g/kg); and Si indicates the total soil salt content after irrigation (g/kg).
The conversion formula [21] of the EC and the total dissolved solids (TDS) is as follows:
TDS = 0.69 EC

2.4. Data Analysis

Microsoft Excel 2021 and Origin 2021 were used for plotting, and ESRI ArcGIS 10.8 software was used to create the location map of the study area. The Pearson correlation coefficient (r) was used to examine the linear relationships between the variables. PCA was used to reduce the dataset into new variables, which are called principal components (PCs), as well as to avoid multicollinearity between the original variables. These PCs explain most of the variation present in the original variables. IBM SPSS 26 was used for correlation analysis and principal component analysis of soil salt ions, SSC, and pH.

3. Results

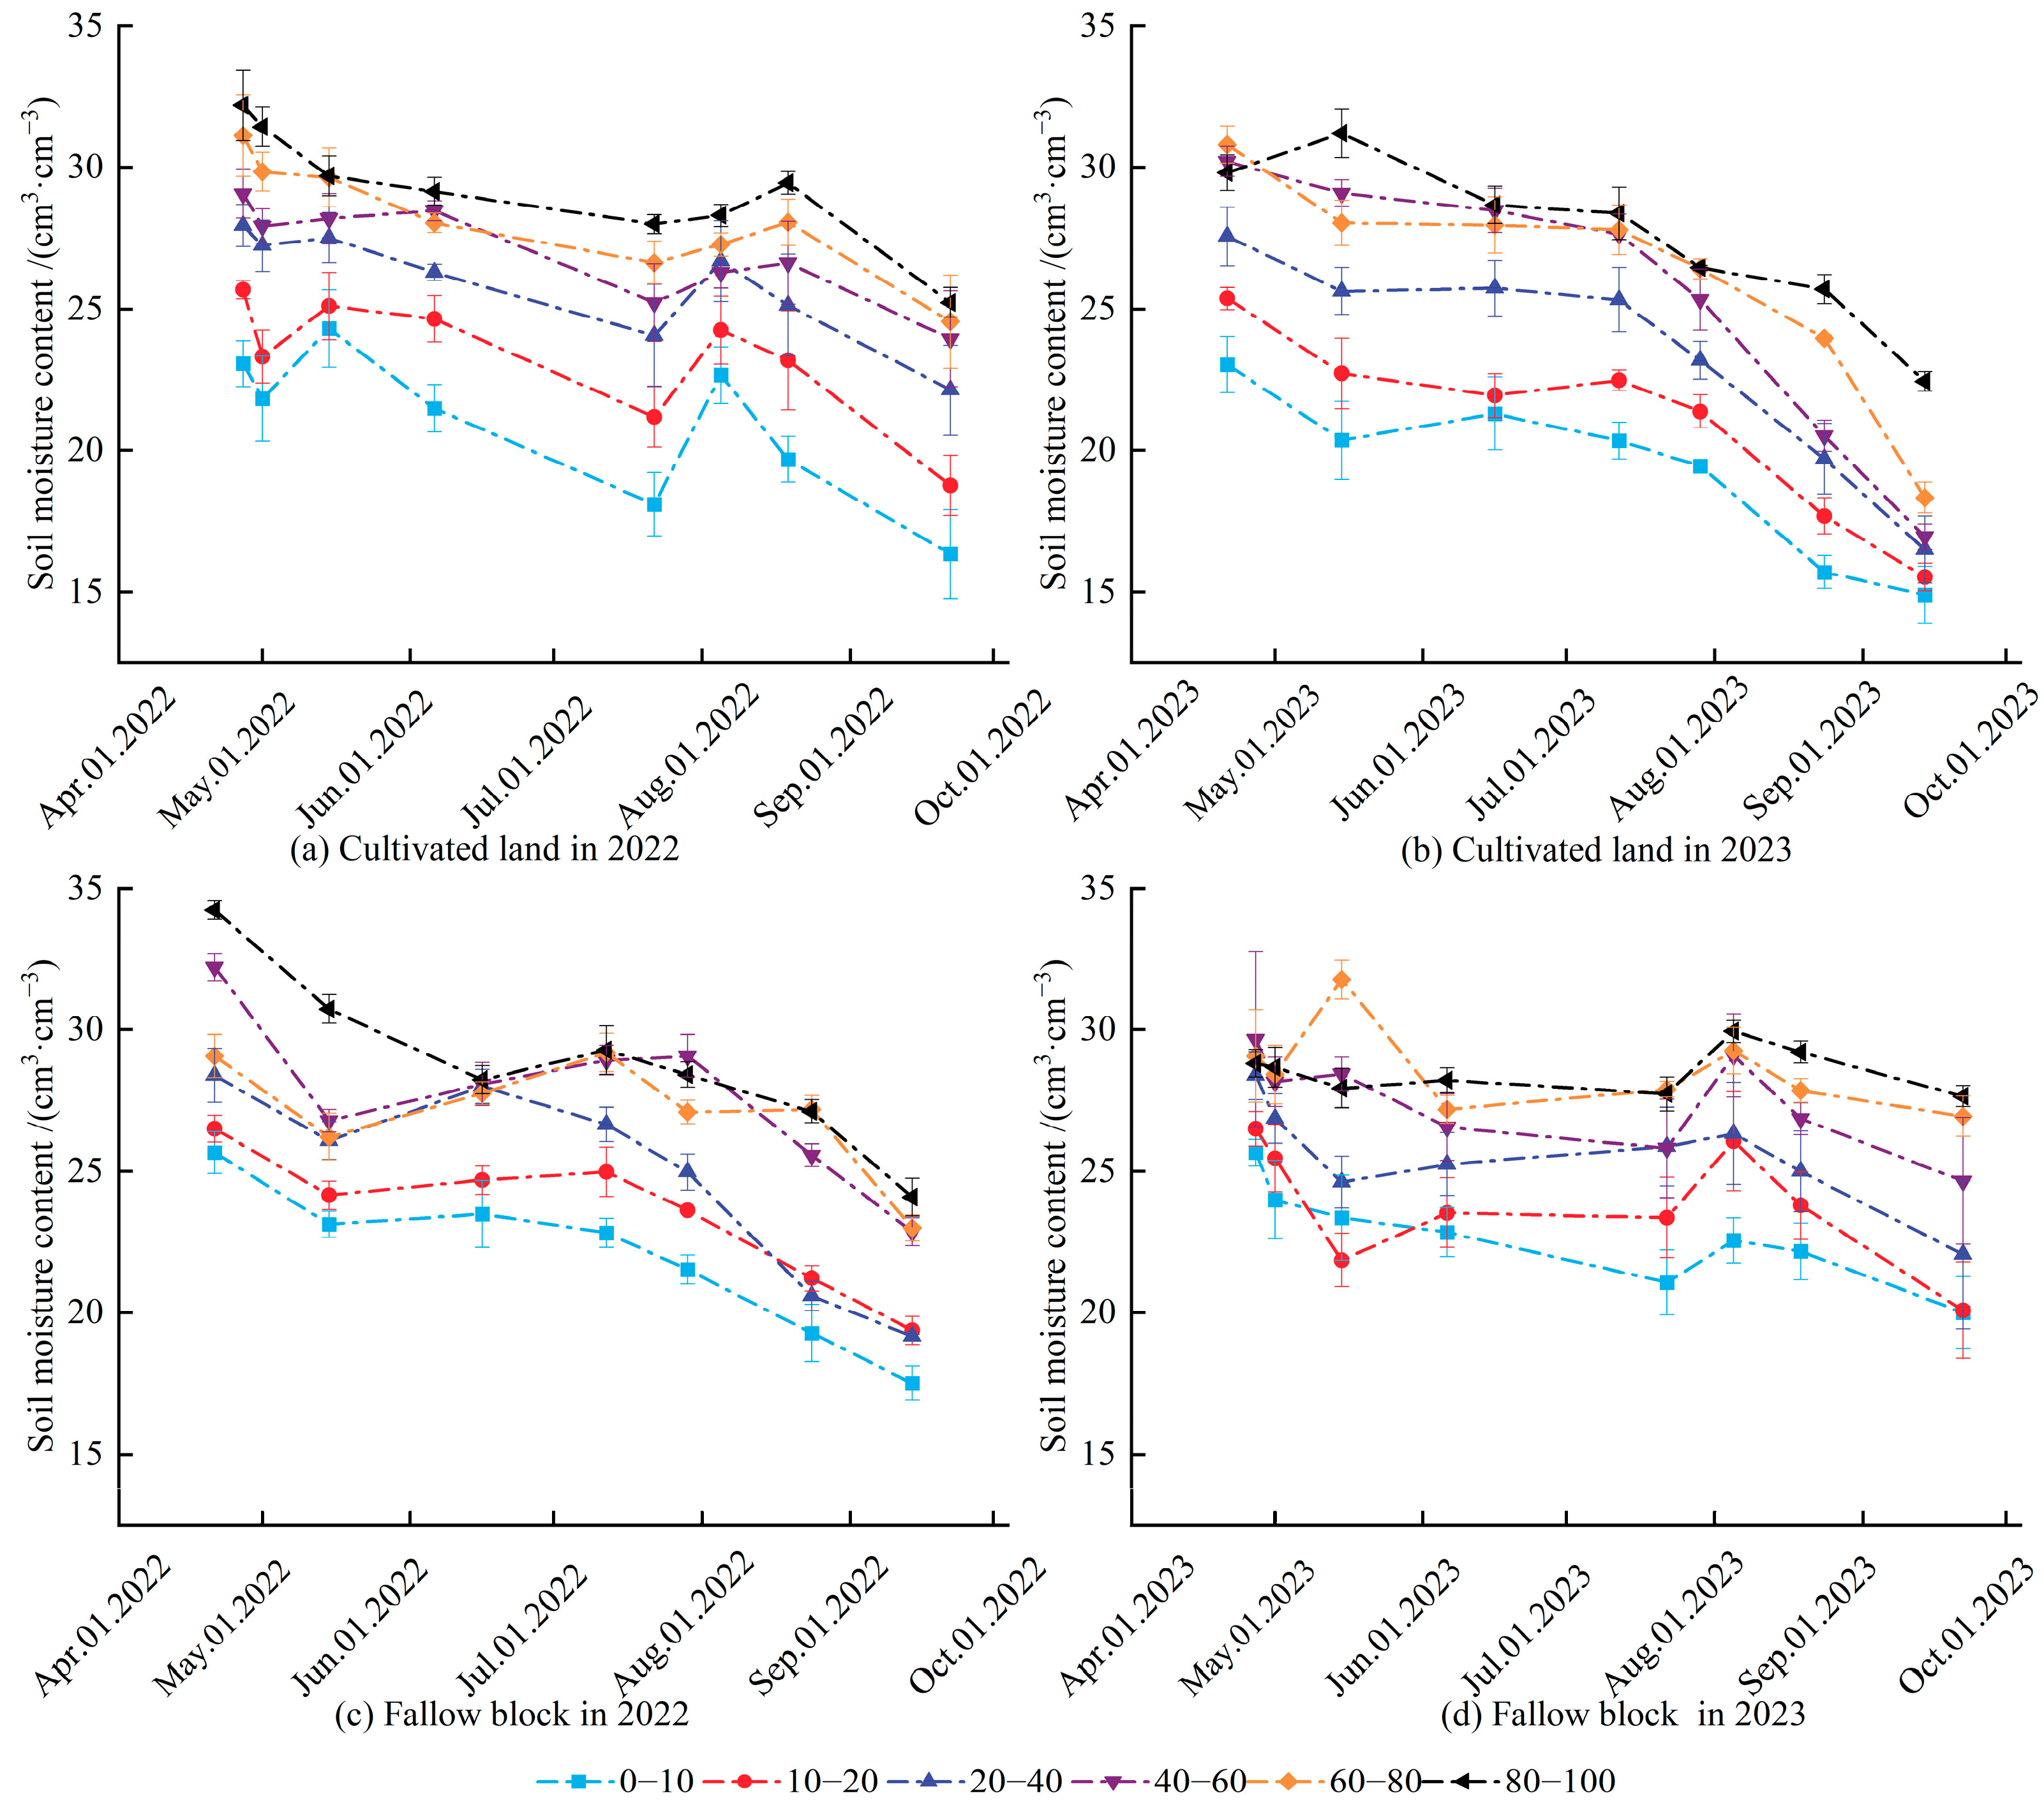
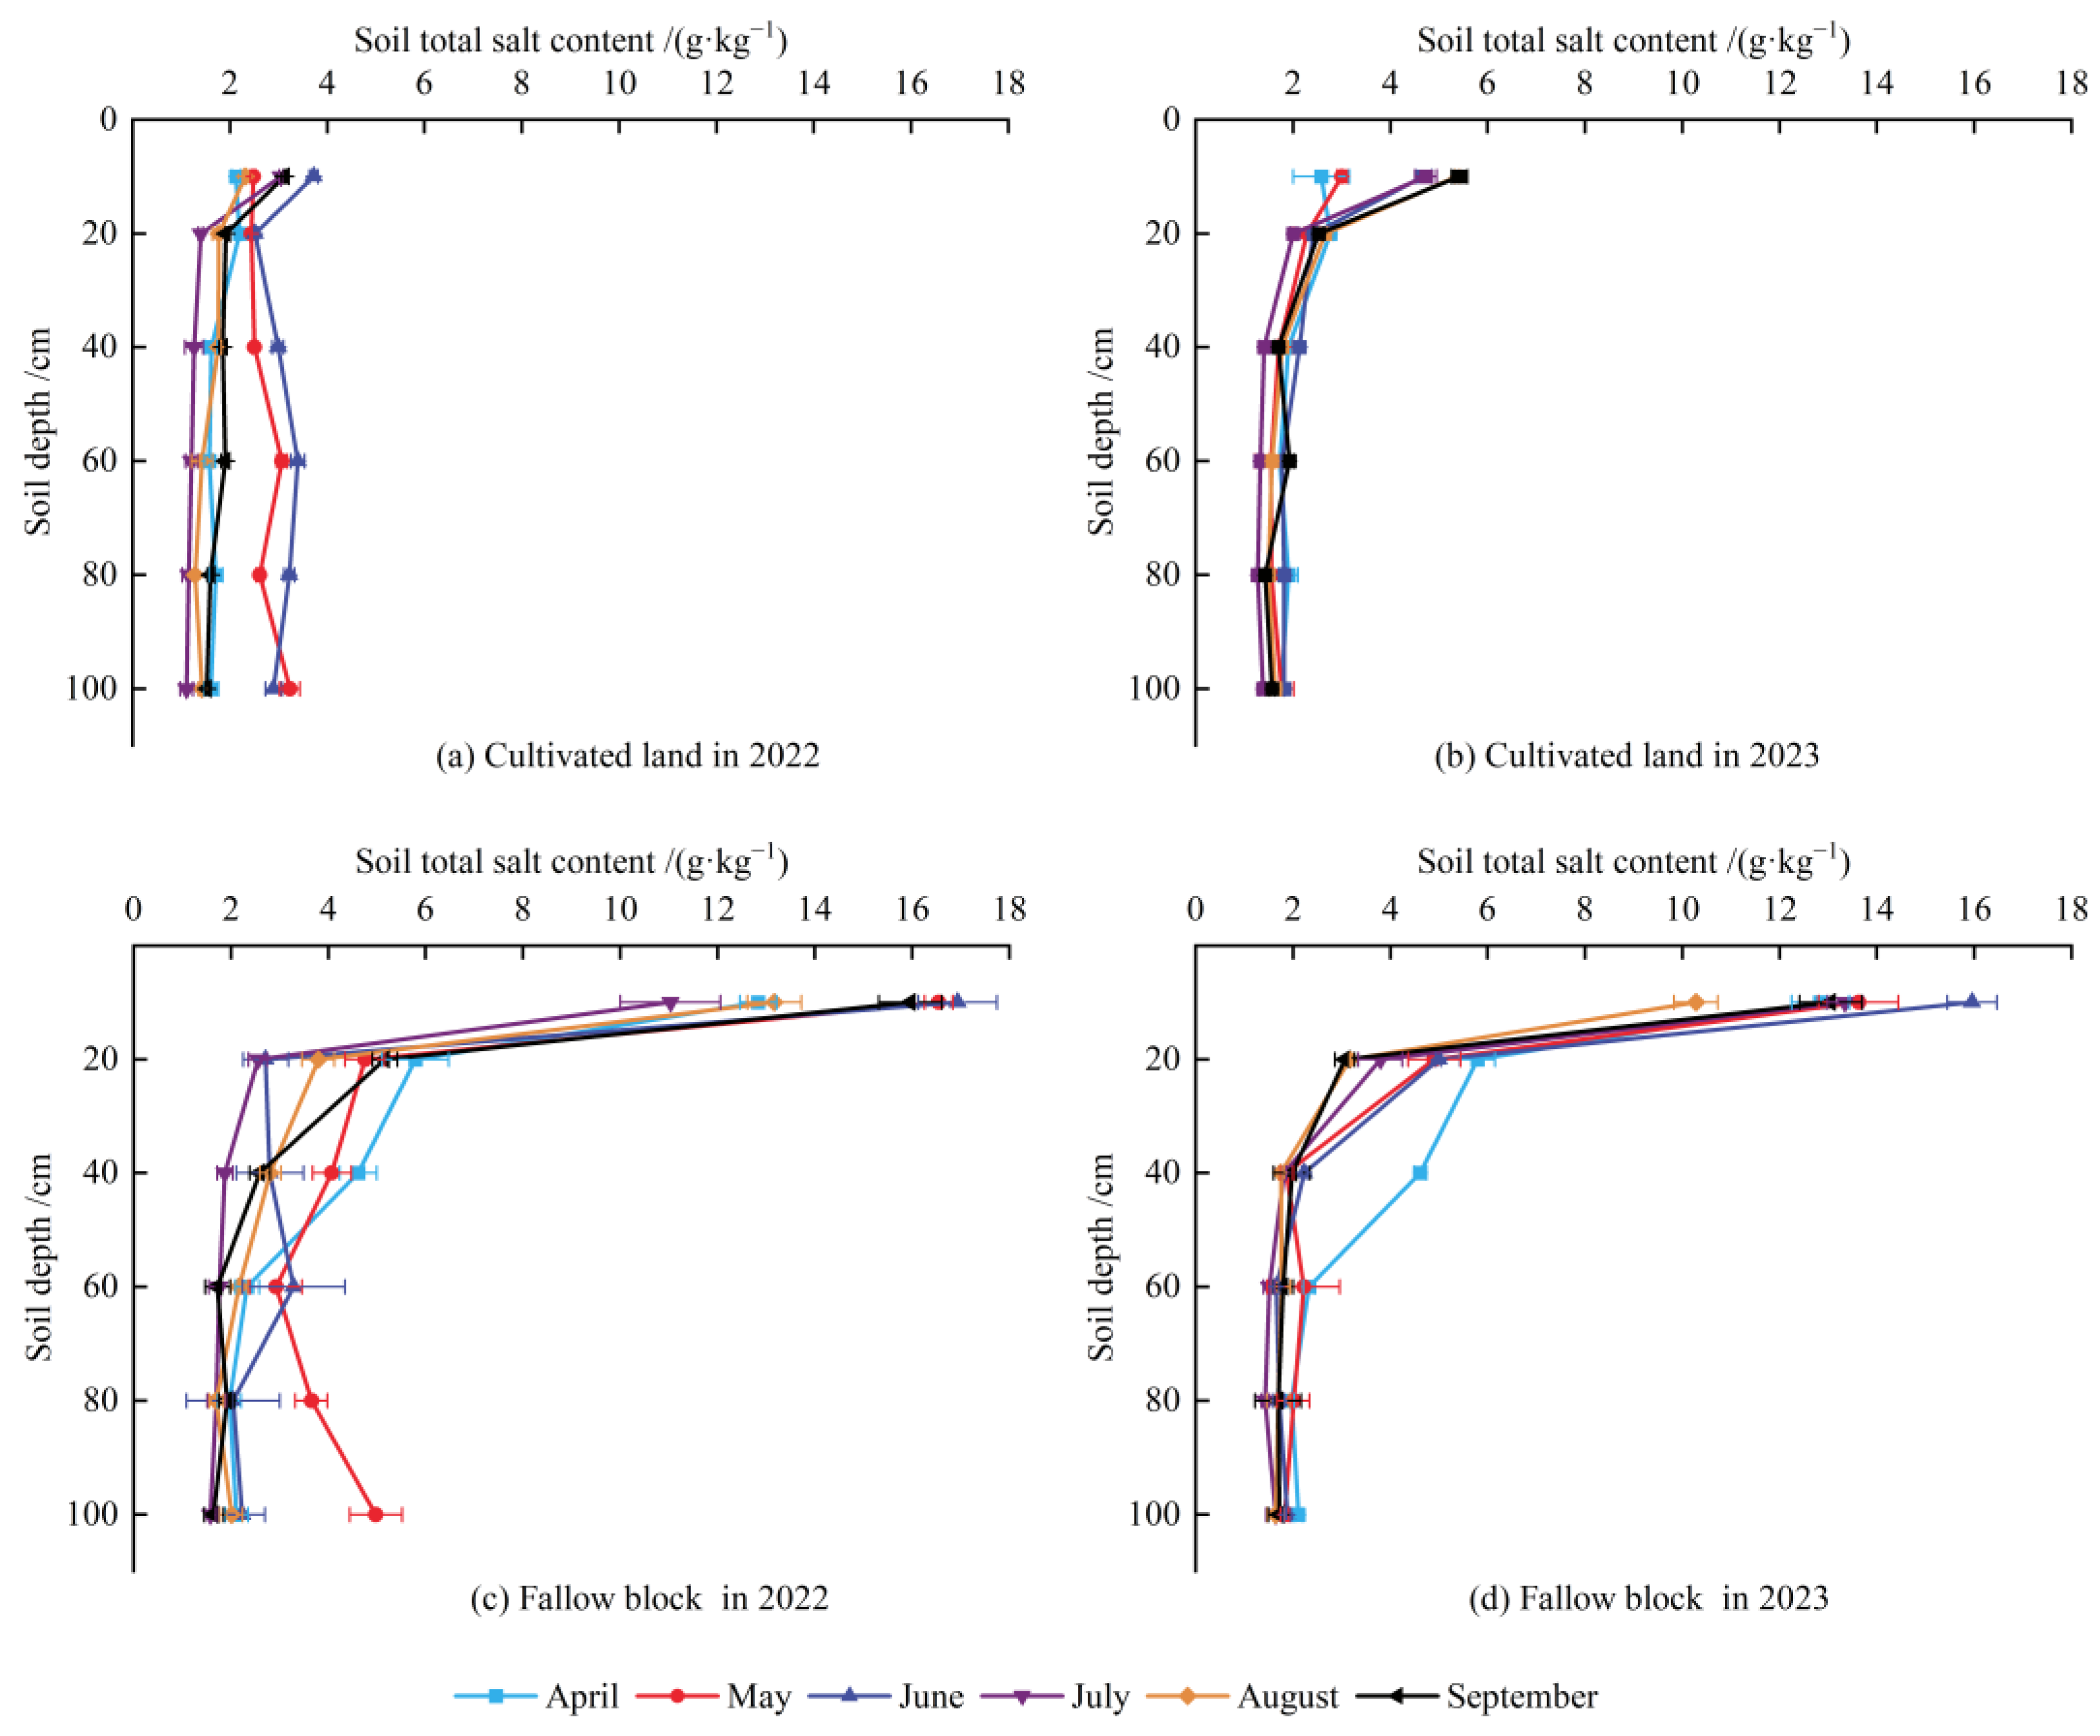
3.1. Distribution Characteristics of Water and Salt in Cultivated Wasteland

The typical soil profile water content of cultivated and fallow block in 2022 and 2023 is depicted in Figure 3. The distribution pattern of soil water content in cultivated land and fallow block was that the soil surface water content was the lowest, and as soil depth increased, the soil water content gradually increased, with the water content of the 0–10 cm soil layer being the lowest and the water content of the 80–100 cm soil layer being the highest. The degree of change in soil water content was found to be more pronounced in the 0–40 cm soil layer than in the 40–100 cm soil layer. This disparity could be attributed to the greater susceptibility of the surface soil layer (0–40 cm) to external influences such as precipitation, irrigation, plant root absorption, transpiration, evaporation, and anthropogenic activities. The temporal progression of soil water content was similar in 2022 and 2023. As soil temperature increased in April and soil evaporation increased in conjunction with the continuous thawing of the permafrost layer, the soil water content was relatively high. Reduced precipitation and irrigation prevented the recharging of soil moisture in September, resulting in the lowest soil water content of the year. As illustrated in Figure 3, the water content of the cultivated land soil was more notable and fluctuated more than that of fallow soil.
The total soil salinity for various periods in 2022 and 2023 is shown in Figure 4. In general, the difference in total soil salinity between the cultivated land and fallow block was large, and the salt content of the fallow block was much higher than that of the cultivated land, with the average value of total soil salinity in cultivated land being 2.22 g/kg and that in fallow block being 4.09 g/kg, and the soil salinity of fallow block in a 1 m soil body being approximately 1.85 to 2 times that of cultivated land. Post-harvest salt accumulation was observed in the soil of cultivated land as a result of sunflower cultivation without irrigation throughout the entire reproductive period. The salt accumulation rates of cultivated land were 10.2% and 15.2% in 2022 and 2023, respectively, whereas the salt accumulation rates of fallow block were 25.1% and 31.7% in 2022 and 2023, respectively. Total soil salinity exhibited a consistent increasing trend throughout the observation period, with a slight variation observed between 2023 and 2022. In 2023, the study area underwent spring irrigation prior to sunflower planting. Figure 3b illustrates that the salinity decreased substantially in July following irrigation. Additionally, the rate of desalination of salts from the 1 m soil body was recorded as 17.2%. The salinity levels of the cultivated and fallow block in the study area are susceptible to the influence of irrigation practices on adjacent cultivated land. The area dedicated to sunflower cultivation in the neighboring area of the study area increased in 2023, resulting in a decrease in the amount of diverted irrigation water during the reproductive period and a decrease in the lateral inflow of water into the cultivated land and fallow block. As a consequence of these changes, the salinity levels showed a continuous accumulation throughout the entire period of observation. Fallow block, being a distinct category of land, serves the dual purpose of drainage and salt removal. Fallow blocks are characterized by a lack of vegetation cover, leading to a rapid accumulation of salt. As water evaporated from the deep layers of the soil, it constantly brought salts to the surface of the soil. Consequently, the salt content in the surface layer of the soil increased significantly. Specifically, 56.2% of the salt present in the 1 m soil body was aggregated within the 0–10 cm soil surface layer.

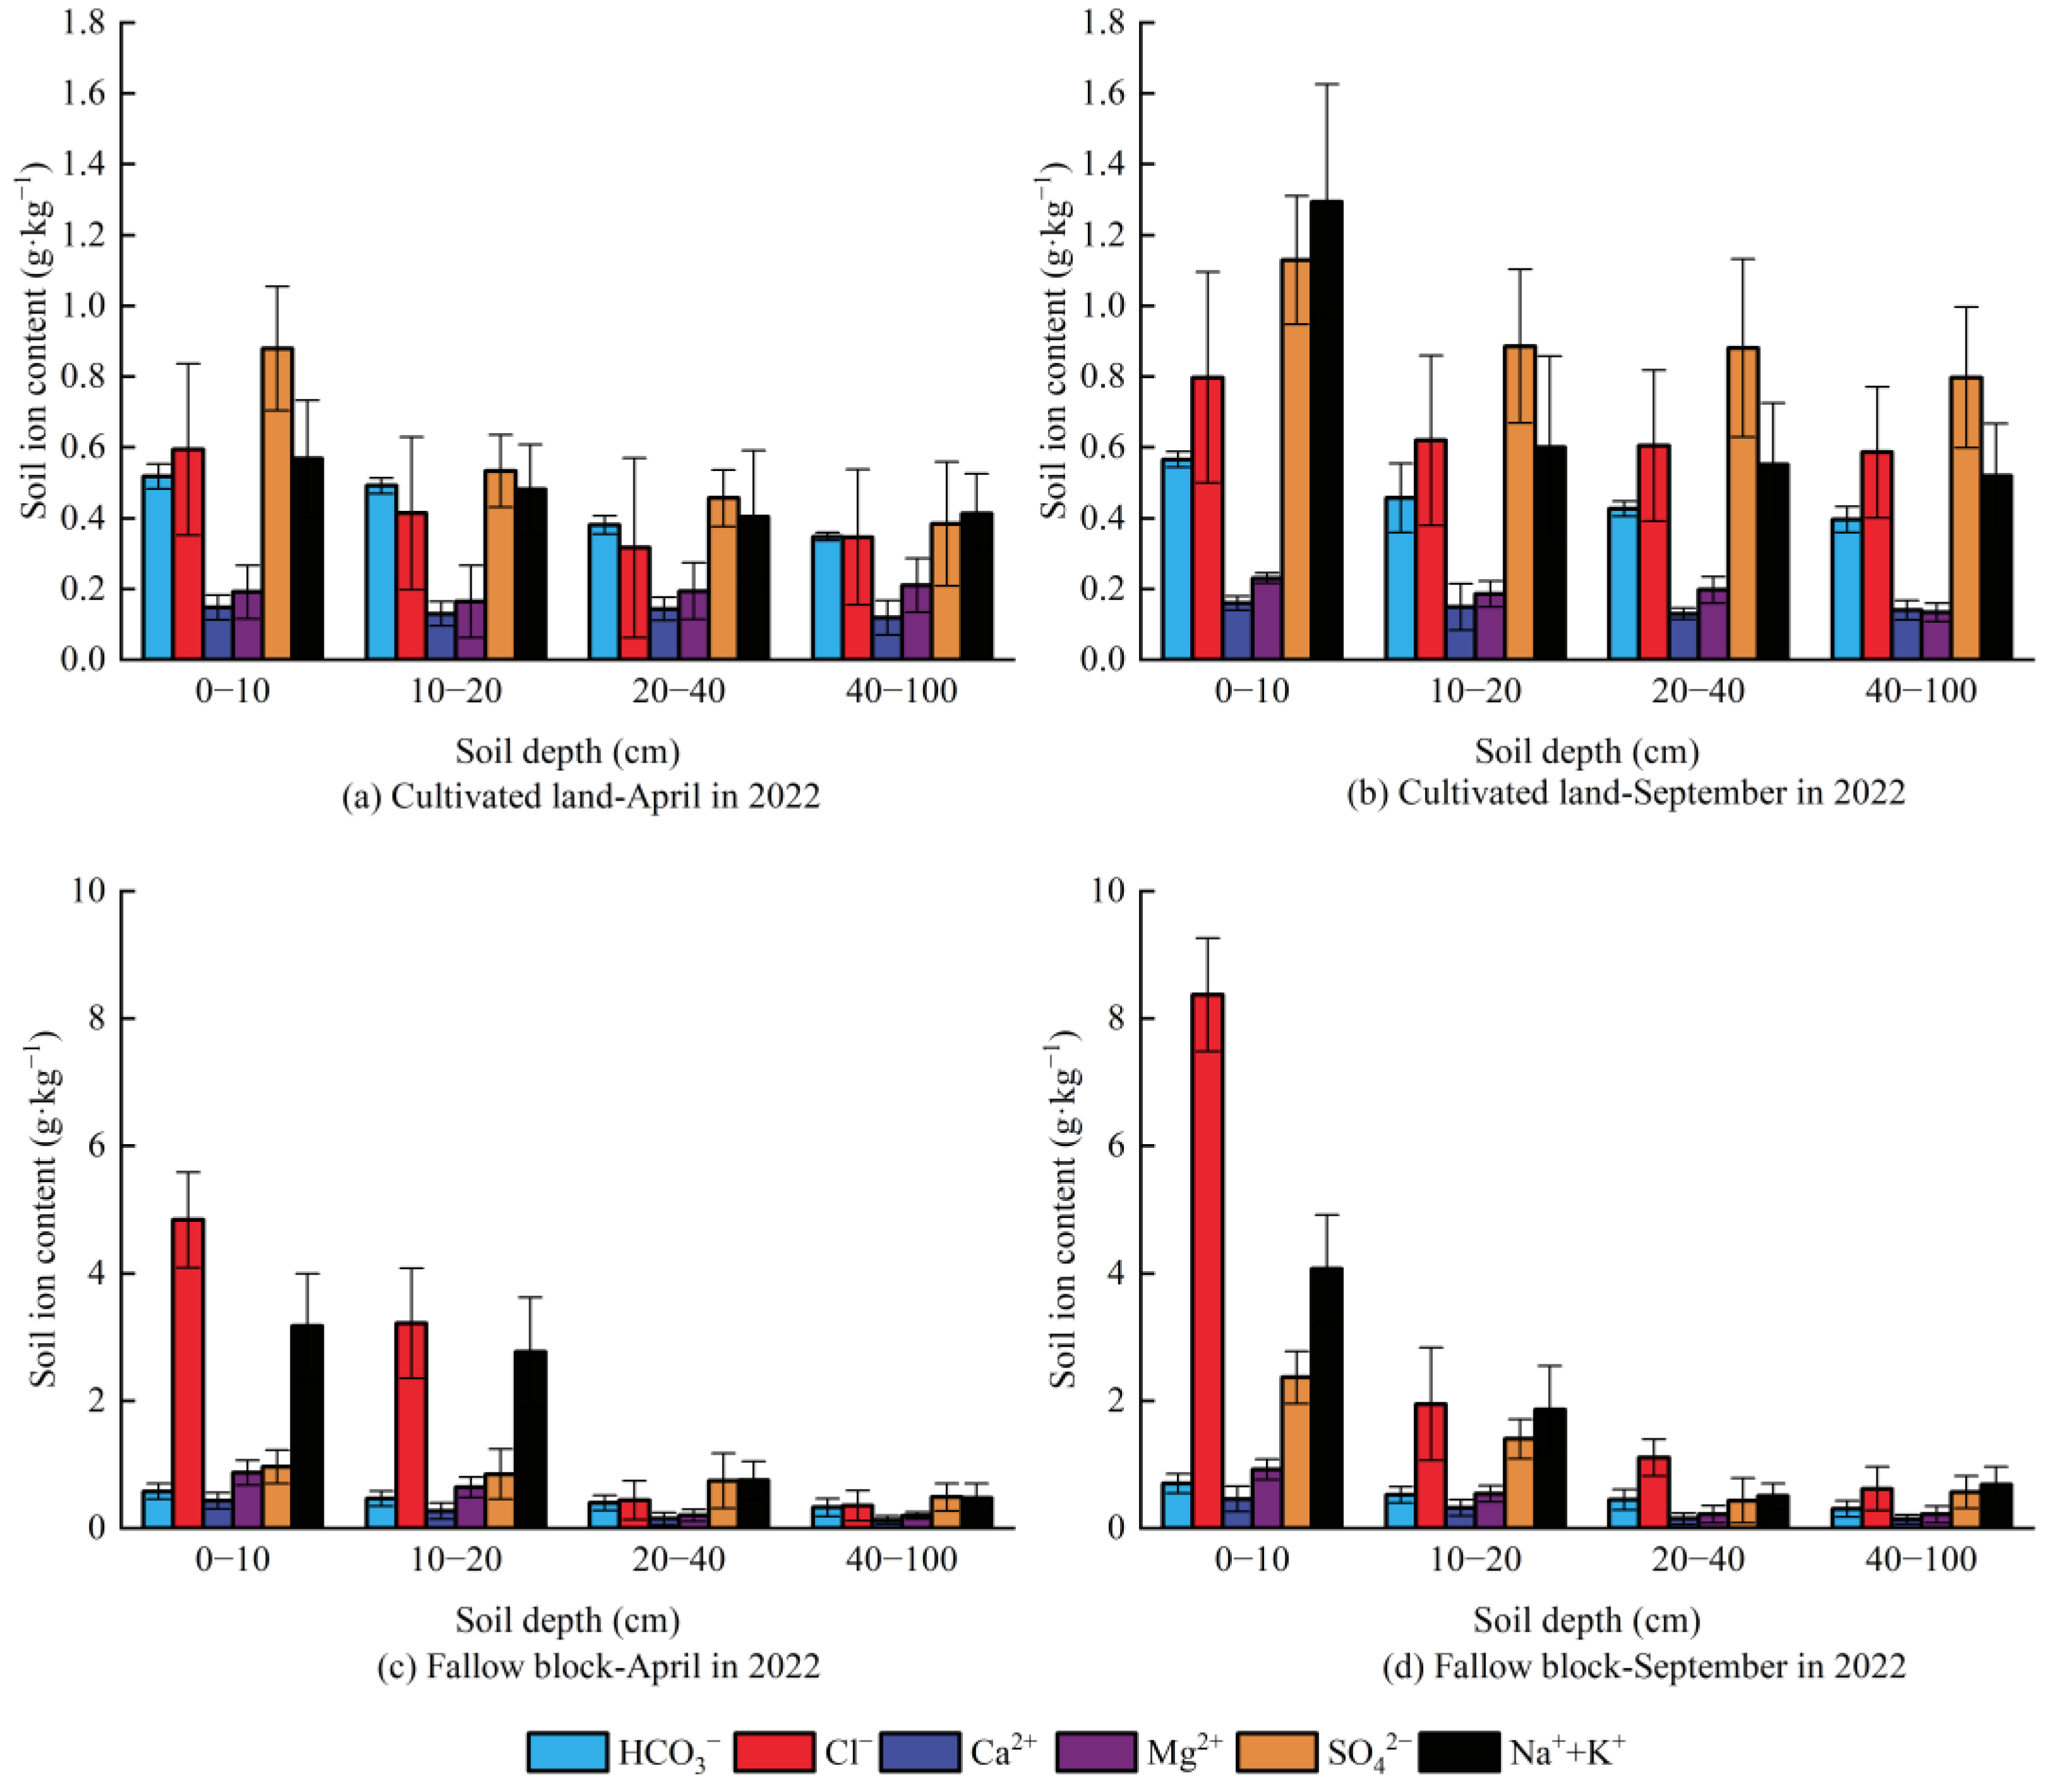
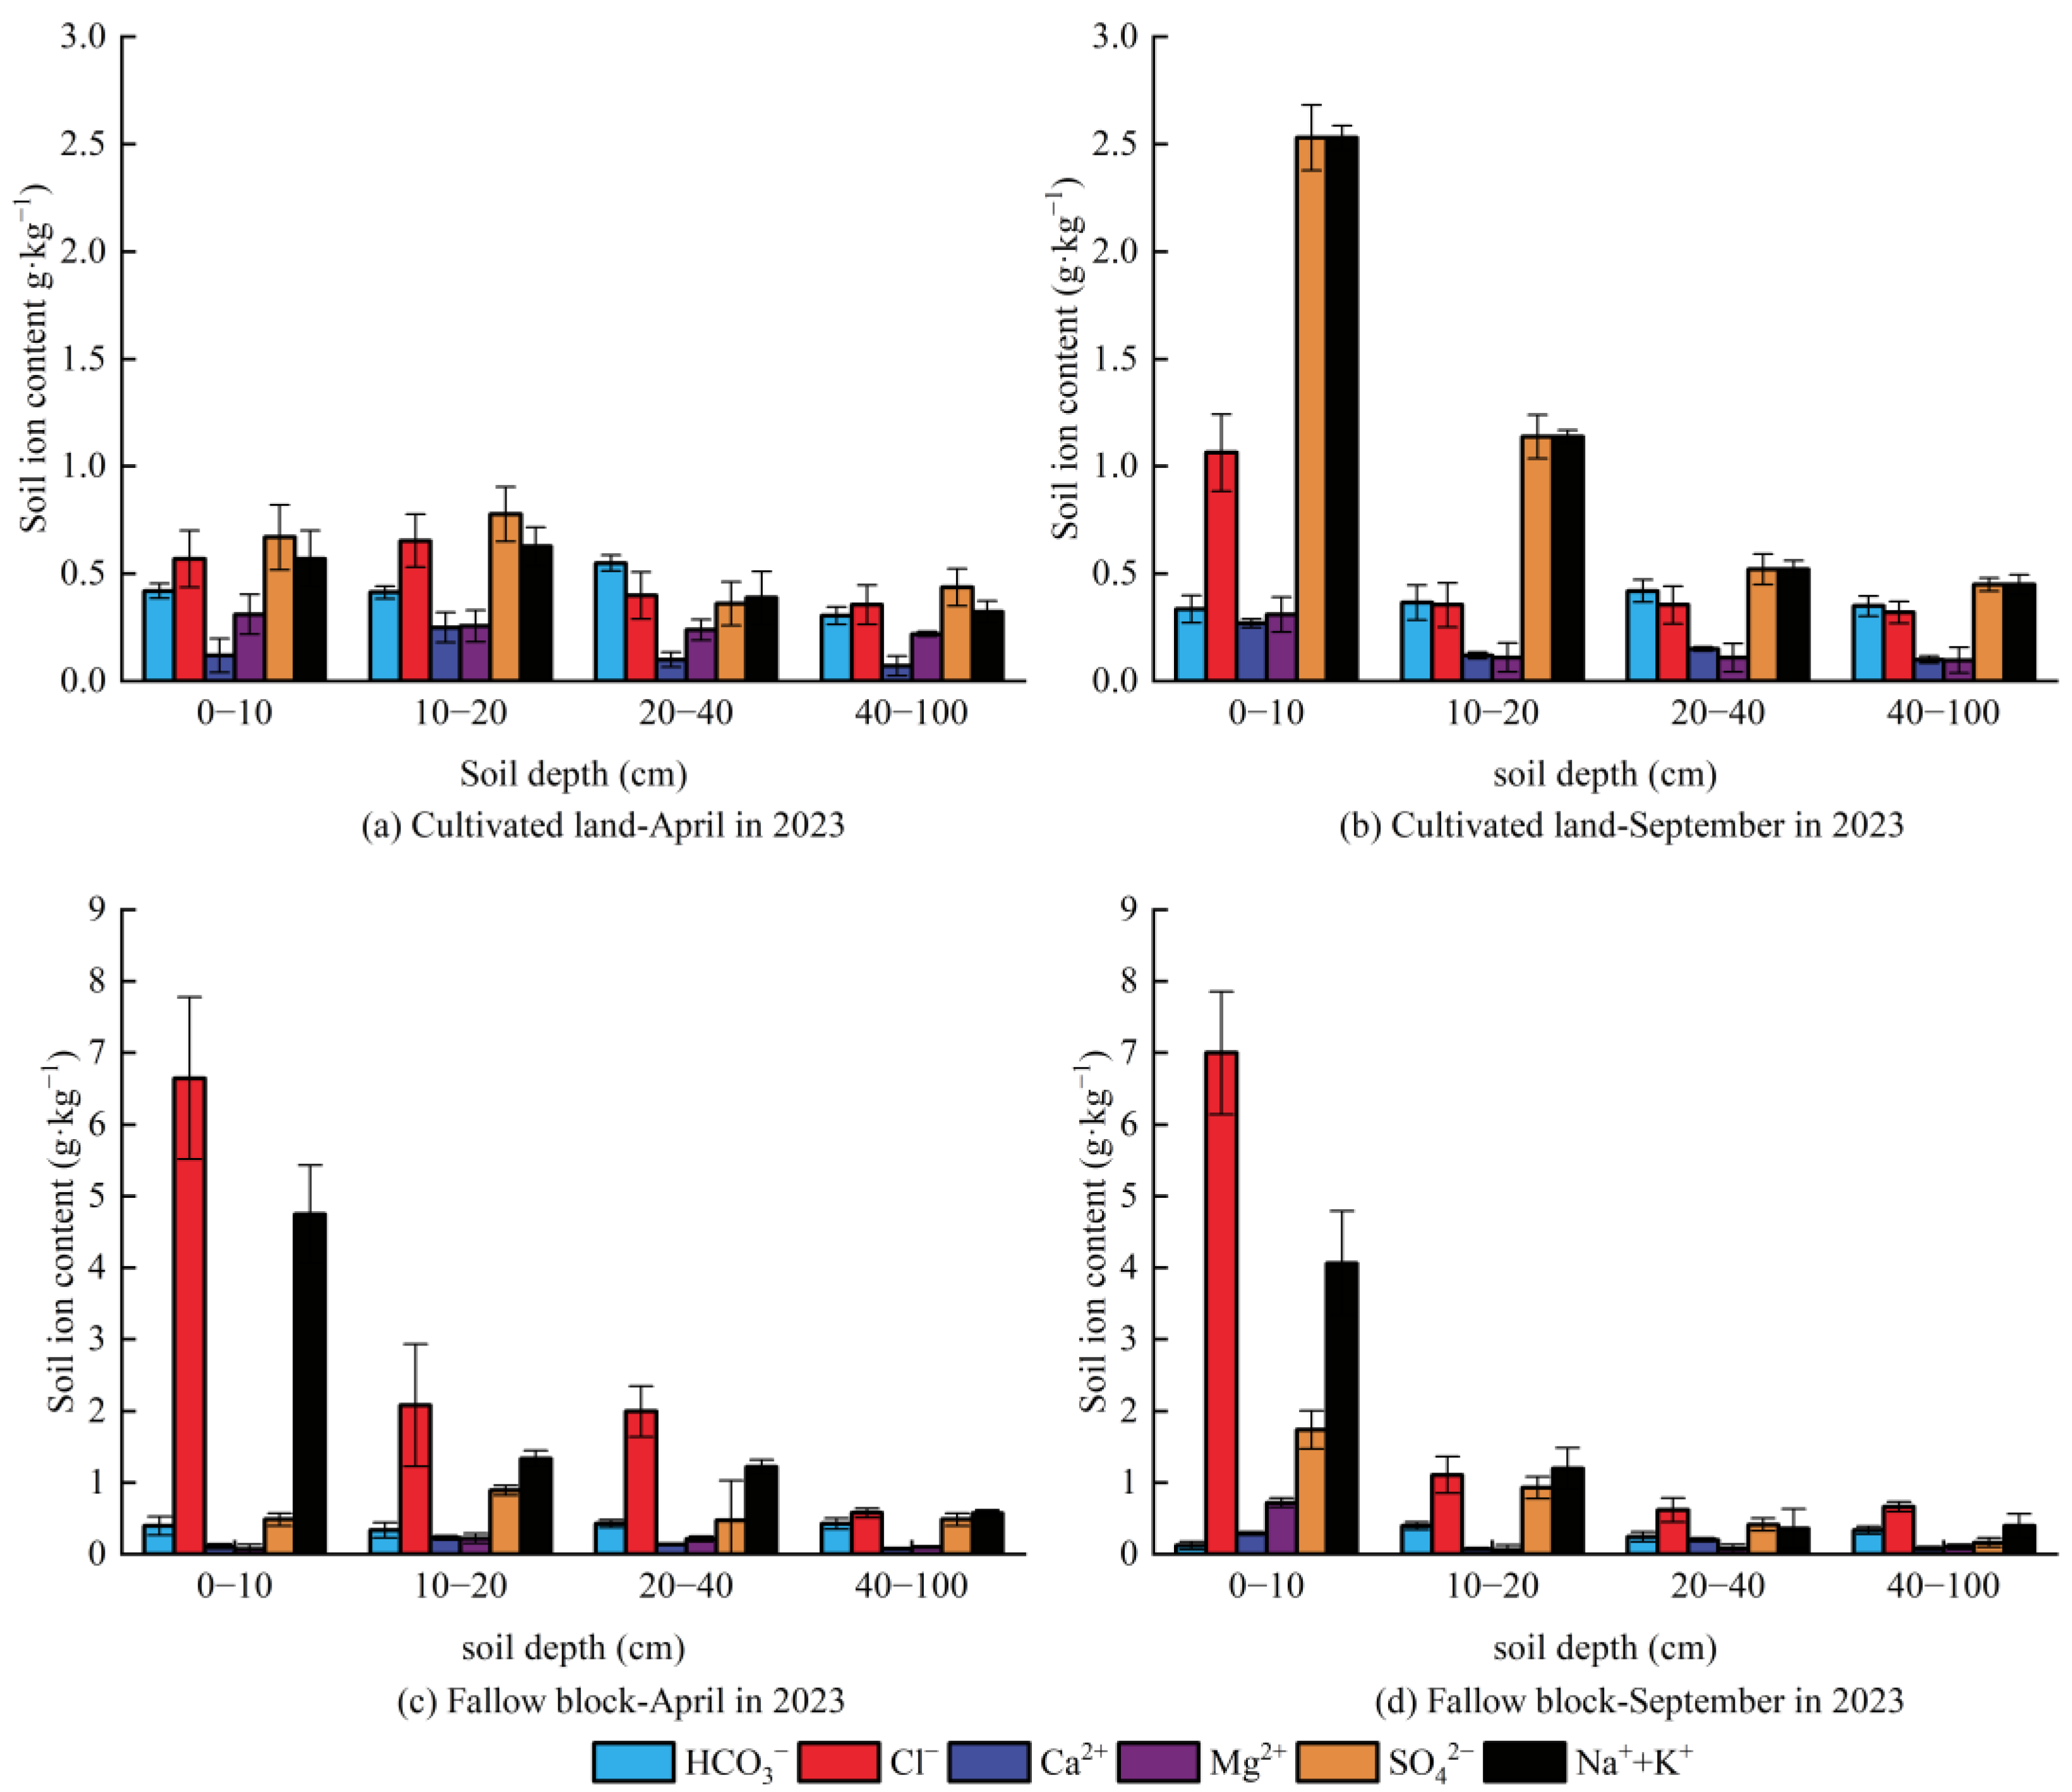
3.2. Distribution Characteristics of Soil Salt Ions

Figure 5 and Figure 6 depict the salt ion contents of various cultivated land and fallow soil layers in the study area from April 2022 to September 2023. Regarding the proportion of ion content, in the soil profile within 1 m of the study area, the cations of the cultivated soil were dominated by Na++K+, which accounted for 58.93–69.08% of the total cations. This was followed by Mg2+ and Ca2+, accounting for 13.51–18.81% and 14.79–24.01% of the total cations, respectively. In terms of the anions, those of the cultivated soil were dominated by SO42−, which accounted for 38.00–56.55% of the total anions. This was followed by Cl and HCO3, accounting for 25.51–33.45% and 17.94–30.7% of the total anions, respectively. The content ratio of each salt ion in fallow soil was similar to that of cultivated land, and the predominant cations in wasteland soil were Na++K+, accounting for 70.56–87.19% of the total cations. This content ratio was considerably different from that of Mg2+ and Ca2+. The remaining ions in fallow soil account for an almost negligible proportion. In terms of anions, those of fallow soil differed from those of cultivated land, which was dominated by Cl, accounting for 64.09–74.24% of the total anions, whereas HCO3 and SO42− solely accounted for 7.99–12.93% and 15.34–25.36% of the total anions, respectively. In terms of temporal changes, the ionic trends observed in cultivated land and fallow block between April 2022 and September 2023 were similar. The Mg2+ and Ca2+ contents in the soil underwent minimal changes, the content of HCO3 underwent a modest change, and Na++K+, Cl, and SO42− contents underwent large changes. Because of reduced irrigation, the main sources of salt ions in cultivated land and fallow block were deep soil or groundwater. Sodium chloride and sodium sulfate salts are more soluble in water than other ionic salts. Consequently, they can accumulate and migrate more effectively in the soil, and the gradual increase in the proportion of chloride salts in cultivated land indicates that cultivated land soils have a tendency of shifting from sulfate soils to chloride salt soils.

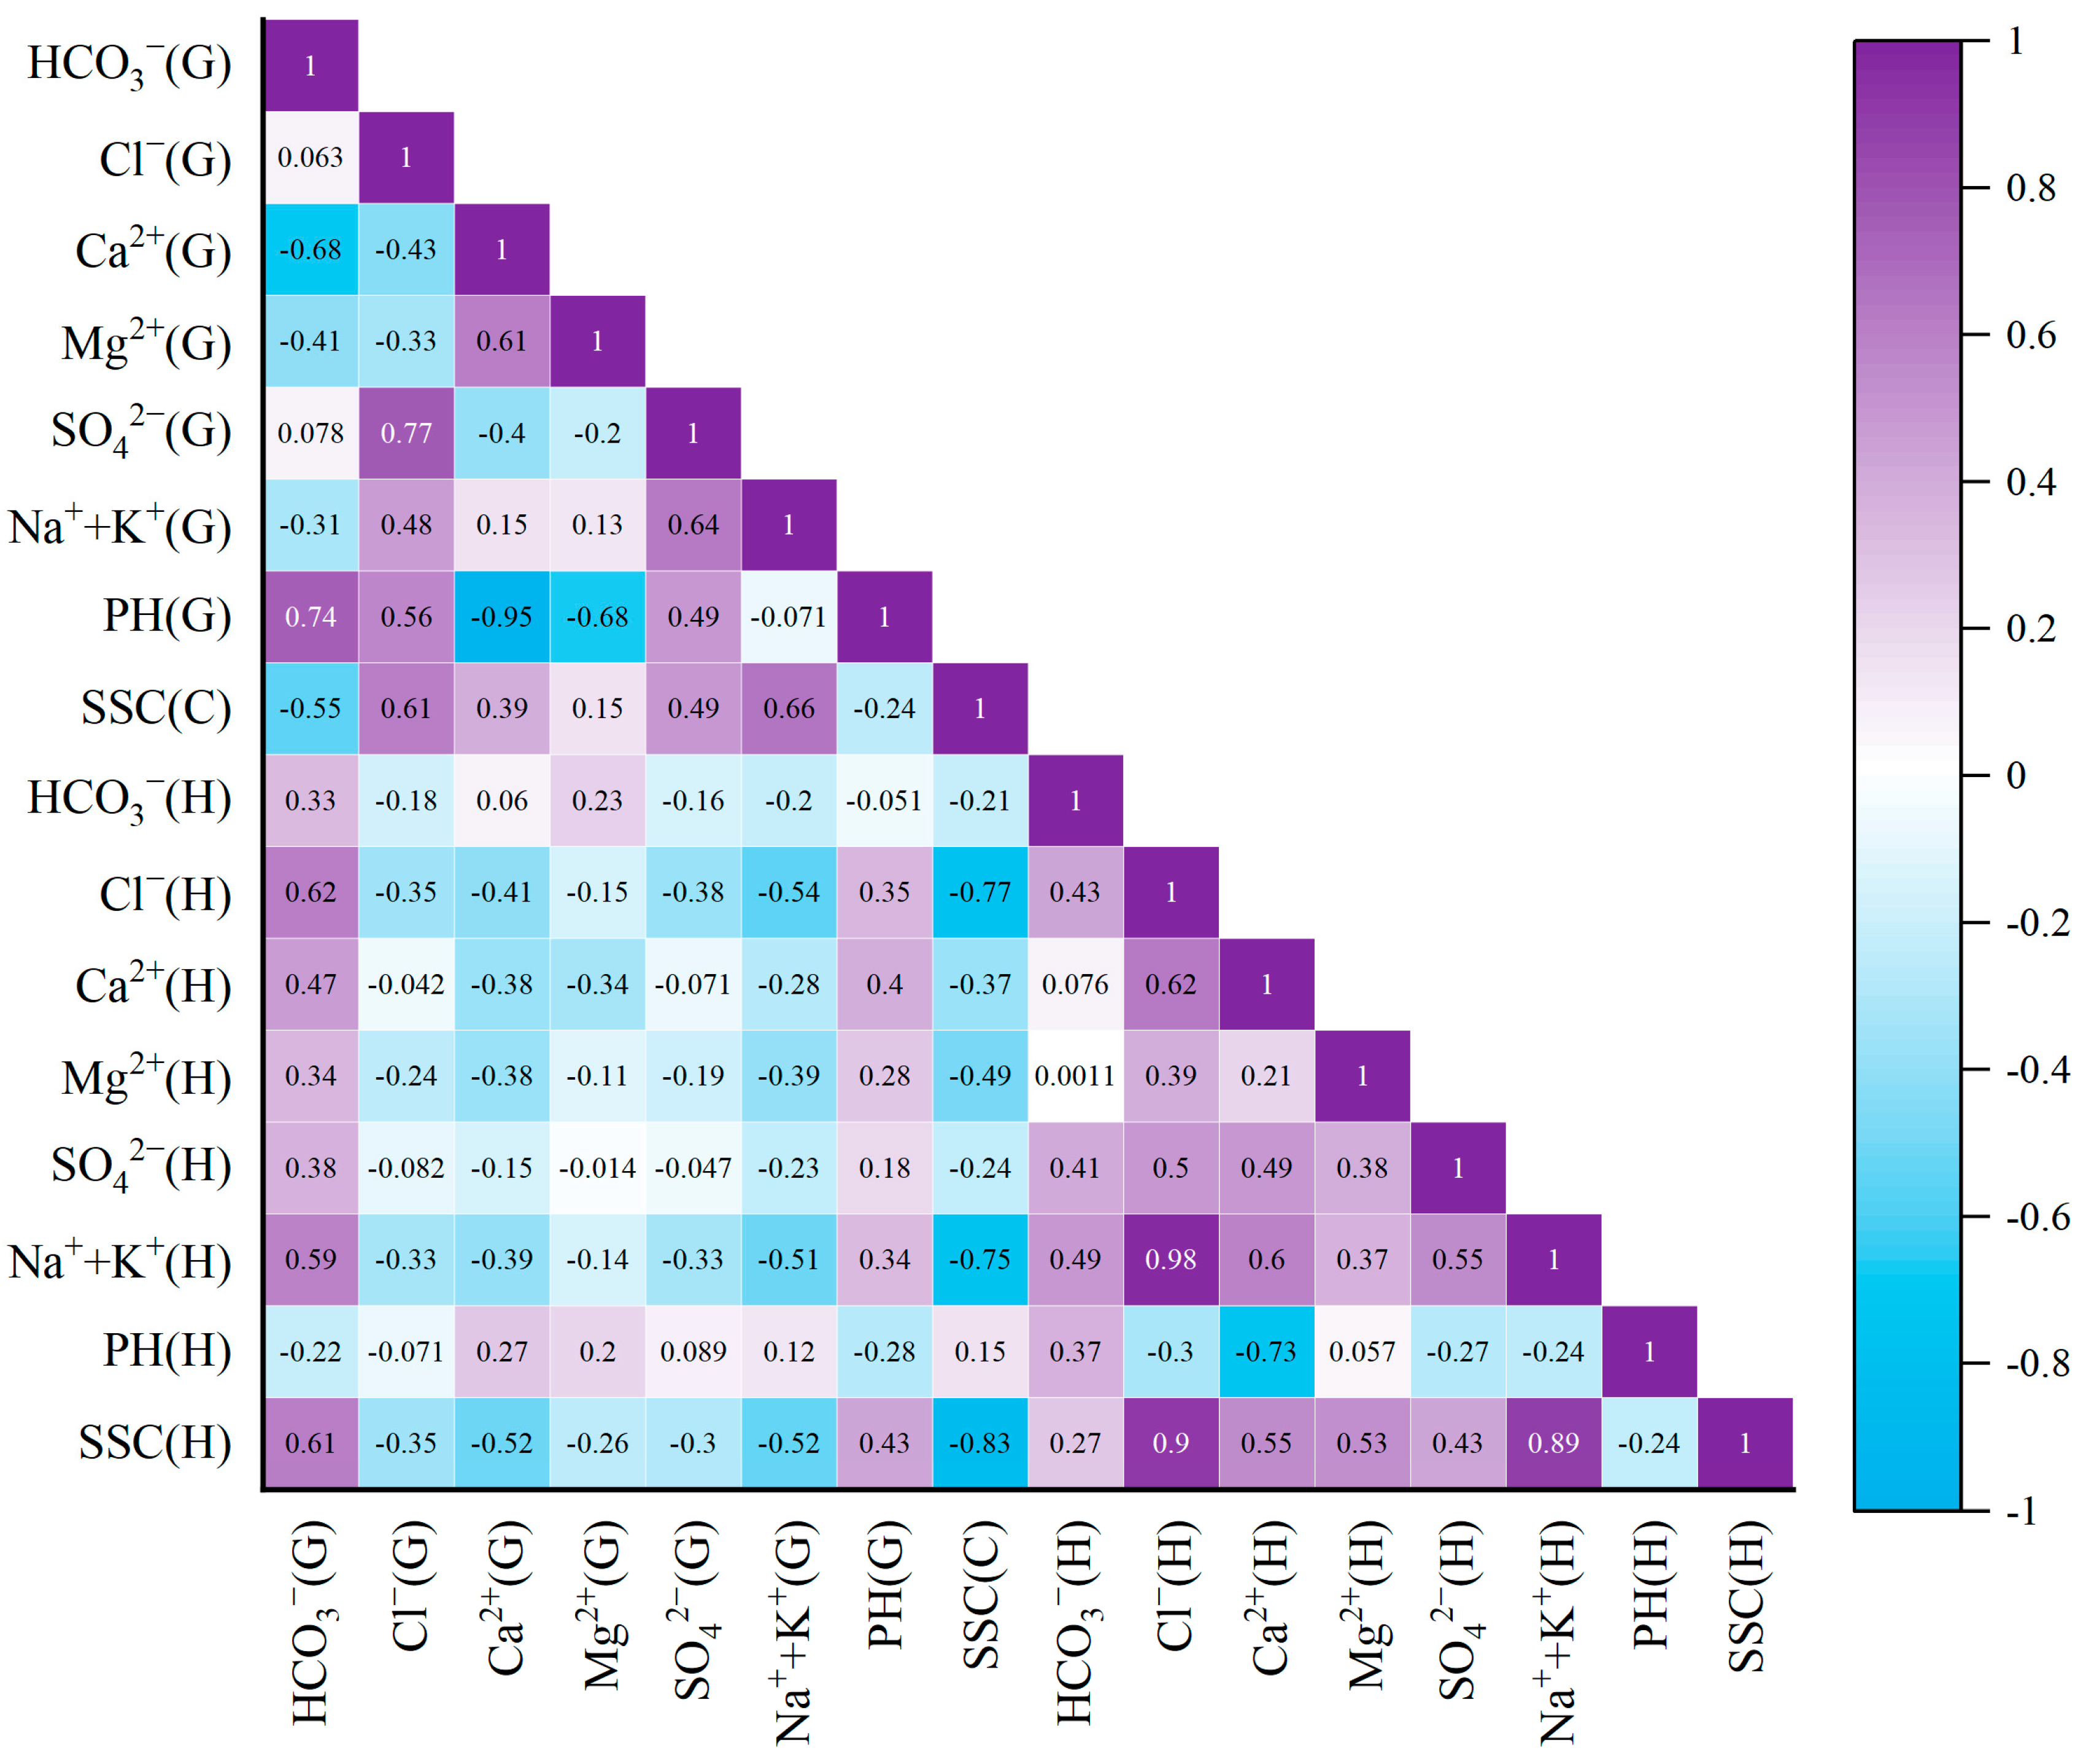
3.3. Correlation Analysis of Soil Salt Ions

Correlation analysis between salt ions in cultivated land and fallow block soils within the study area can provide a better understanding of soil ion composition and the patterns of soil ion migration patterns. This, in turn, can positively affect the management of saline soils and analysis of the impact of dry salt drainage measures in fallow blocks. Fifty sets of data, including salt ions, pH, and soil salt content (SSC) in cultivated and fallow soils, were selected as characteristic indicators for correlation analysis. The correlation was considered significant when the absolute value of the correlation was greater than 0.21 (p < 0.05), highly significant when the absolute value of the correlation was greater than 0.28 (p < 0.01), and not significant when the opposite was true. The results are shown in Figure 7, where the SSCs of cultivated land and fallow block were negatively correlated with a correlation coefficient of −0.85 (p < 0.01). The SSC also represented the relationship with the amount of soil salts accumulated, indicating that the salt accumulation of cultivated land and fallow block was evidently negatively correlated, indicating that the fallow block had transformed into the salt drainage area of cultivated land. The correlation coefficients between Na++K+ and Cl were 0.66 (p < 0.01) and 0.61 (p < 0.01) for cultivated land and 0.89 and 0.9 for fallow block, respectively. These results suggested that NaCl was the primary salt responsible for the accumulation of salt in the soil of both cultivated land and fallow block. The anion SO42− accounted for a larger proportion of the salt ions in the soil; however, it had a weaker correlation with soil salinity than Cl. This indicated that sulfates were less mobile between cultivated and fallow blocks than chlorinated salts. In cultivated land, Ca2+, Mg2+, and pH showed a significant negative correlation. When Ca2+ and Mg2+ contents are excessive, reactions with HCO3 in the soil generated CaCO3 and MgCO3 via precipitation, and HCO3 was hydrolyzed to generate OH−, which indirectly controlled the degree of alkalinity of the soil. In summary, the cultivated and fallow block within the study area contained sodium sulfate and sodium chloride as the primary salts. The main salt-accumulating ions in the soil were Na++K+ and Cl, with sodium chloride being the most active salt controlling the accumulation of salts in the study area. The salt ion content of the soil was more susceptible to various factors such as soil texture, irrigation, precipitation, and anthropogenic activities at the farm scale. In the repeated process of salt accumulation and desalination, NaCl was more water-tolerant than sodium sulfate and could accumulate more rapidly in the soil. Ca2+, Mg2+, and HCO3 influenced the degree of soil alkalization in the study area, whereas the three ions restrained each other, and the ion content was always maintained at a stable level.

3.4. Principal Component Analysis of Soil Salt Ions

The principal component analysis is a classic data dimensionality reduction method. It facilitates the identification of patterns within data, the examination of relationships among variables, and the reduction of data dimensionality. These processes improve data visualization and interpretation [22,23]. In this study, principal component analysis was carried out on Cl, HCO3, SO42−, Ca2+, Mg2+, Na++K+, SSC, pH, and eight variables in cultivated land and fallow soils. The principal components for various land types were determined using an eigenvalue > 1, as shown in Table 2. The number of principal components of different land types was investigated to determine the correct evaluation of salt accumulation in the cultivated land and fallow soils of the research area characteristic factors, and the results are displayed in Table 3.
The principal component analysis results are depicted in Table 2 and Table 3. The eigenvalues of the first three factors in cropland were all >1, with eigenvalues of 3.902, 1.787, and 1.286, respectively. Their corresponding variance contribution ratios were 48.769%, 22.338%, and 16.071%, respectively, with a cumulative variance contribution ratio of 87.178%. The results indicated that the first three principal components could adequately account for most of the information of the eight original variables of cultivated land. The first two factors of fallow block were both >1, with eigenvalues of 4.221 and 1.633, respectively, and their corresponding variance contribution rates were 52.766% and 20.413%, respectively, with a cumulative variance contribution rate of 73.179%. These results indicated that the first two principal components could adequately account for most of the information of the eight original variables of fallow block. Based on the eigenvectors obtained from the principal component analysis, the expression for the principal component of salt accumulation in cultivated soil is as follows:
PCA1 = 0.099(HCO3) + 0.473(Cl) + 0.333(Ca2+) + 0.113(Mg2+) + 0.415(SO42−) + 0.466(Na++K+) + 0.175(pH) + 0.473(SSC)
PCA2 = 0.684(HCO3) − 0.102(Cl) − 0.103(Ca2+) + 0.299(Mg2+) + 0.009(SO42−) + 0.097(Na++K+) + 0.636(pH) + 0.094((SSC)
PCA3 = −0.234(HCO3) + 0.006(Cl) − 0.548(Ca2+) + 0.663(Mg2+) + 0.376(SO42−) + 0.243(Na++K+) − 0.025(pH) − 0.071(SSC)
Similarly, the expression for the main components of salt accumulation in fallow soil is as follows:
PCA1′ = 0.211(HCO3) + 0.416(Cl) + 0.365(Ca2+) + 0.240(Mg2+) + 0.333(SO42−) + 0.461(Na++K+) − 0.188(pH) − 0.440(SSC)
PCA2′ = 0.560(HCO3) + 0.077(Cl) − 0.410(Ca2+) + 0.123(Mg2+) + 0.034(SO42−) + 0.101(Na++K+) + 0.692(pH) − 0.088(SSC)
The expression of principal components of cultivated land provided above reveals that Na++K+, Cl, SSC, and SO42− were loaded more heavily in the first principal component PCA1. Consequently, the first principal component PCA1 represented the contribution of the four factors (i.e., Na++K+, Cl, SSC, and SO42−) among the original eight indexes, which were closely related to the degree of soil salinity and could be used as a representative factor of soil salinization status. HCO3 and pH were loaded into the second principal component PCA2, which represented the contribution of the two factors (i.e., HCO3 and pH) among the original eight indicators. The pH is an indicator used to assess the acidity and alkalinity of a given soil. The pH of the cultivated soils in the study area ranged from 7.3 to 9.2; therefore, pH served as an indicator of the alkalinity of the soil in this study. Moreover, the presence of HCO3, a common alkaline ion in the soil, caused pH values to increase. Consequently, the second principal component PCA2 represented the alkalinity characteristics of the soil, whereas the third principal component PCA3 exhibited higher loadings of Ca2+ and Mg2+. Because Ca2+ and Mg2+ were soil salinity indicators and their components in the soil were low, they were only used as a supplement to the salinity status of cultivated land in the study area. The characteristics of the fallow block soil were similar to those of the cultivated land. Na++K+, Cl, and SSC occupied higher loadings in the first principal component PCA1′, which represented the soil salinization status, and HCO3 and pH had higher loadings in the second principal component PCA2′, which represented the alkalinity characteristics of wasteland soils. Based on the above analysis, Na++K+, Cl, SSC, SO42−, HCO3, and pH could be considered as indicative factors representing the salinity and alkalinity characteristics of cultivated land. Similarly, Na++K+, Cl, SSC, HCO3, and pH could be considered as indicative factors representing the salinity and alkalinity characteristics of fallow block.

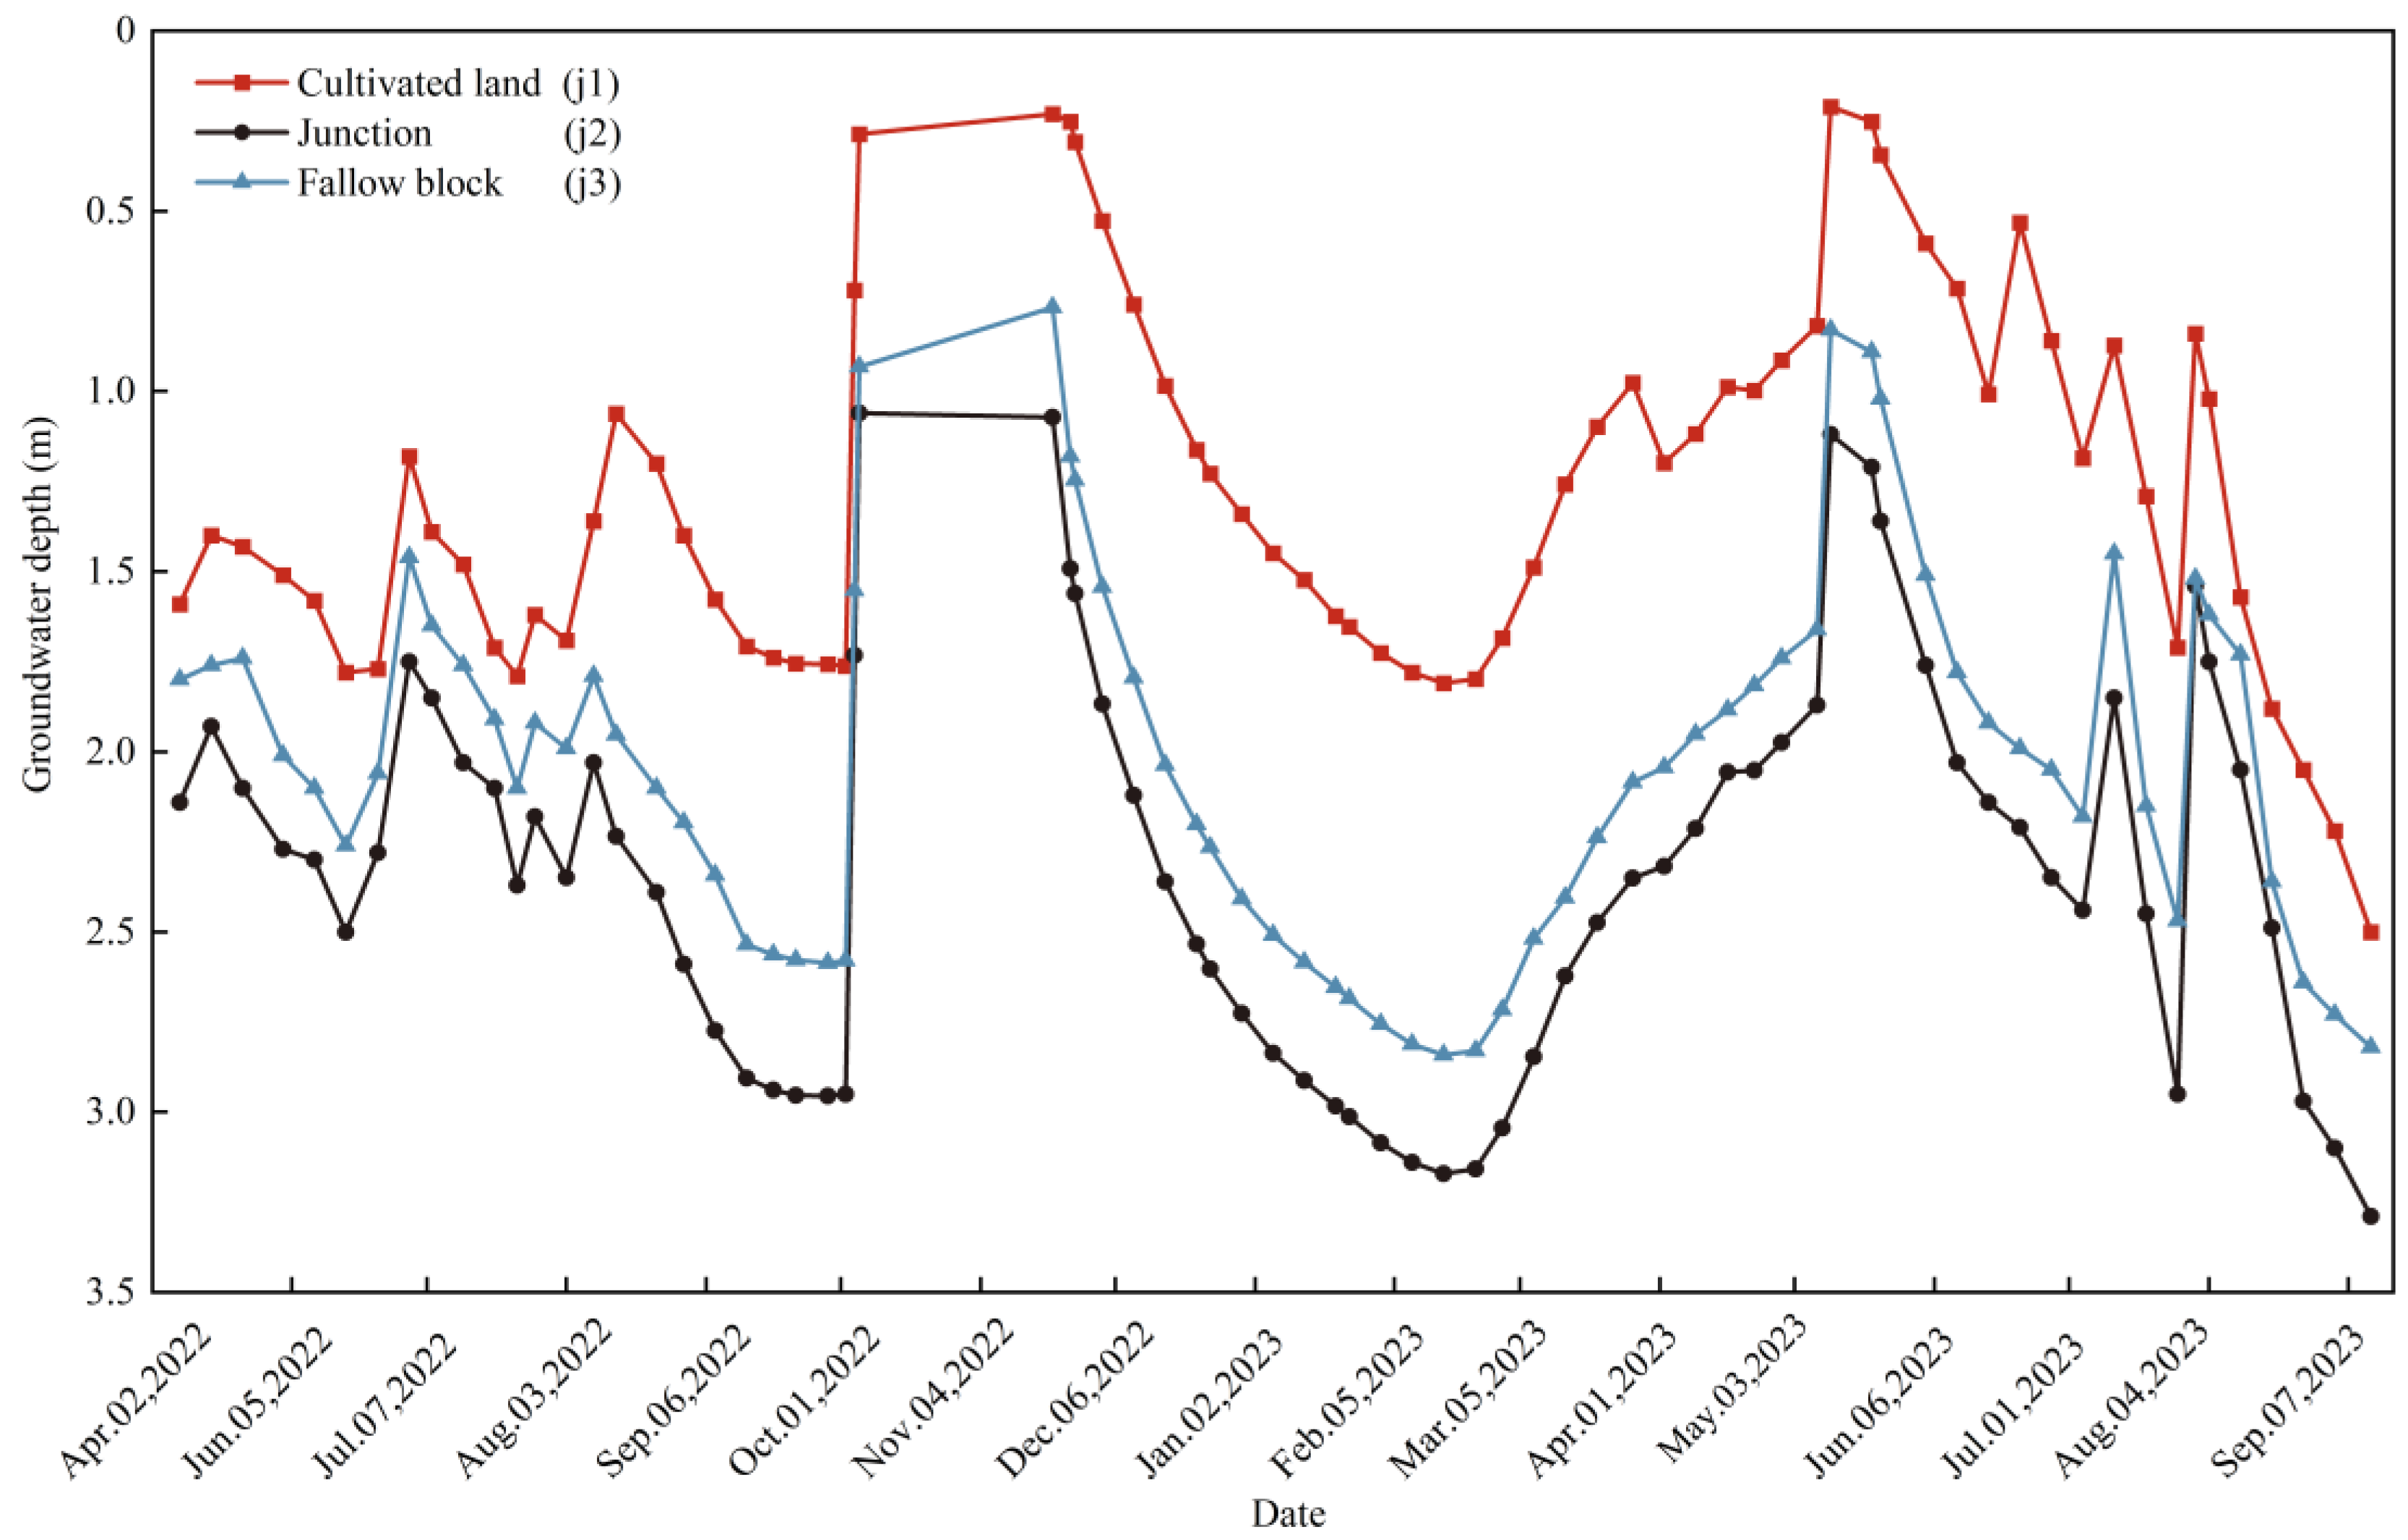
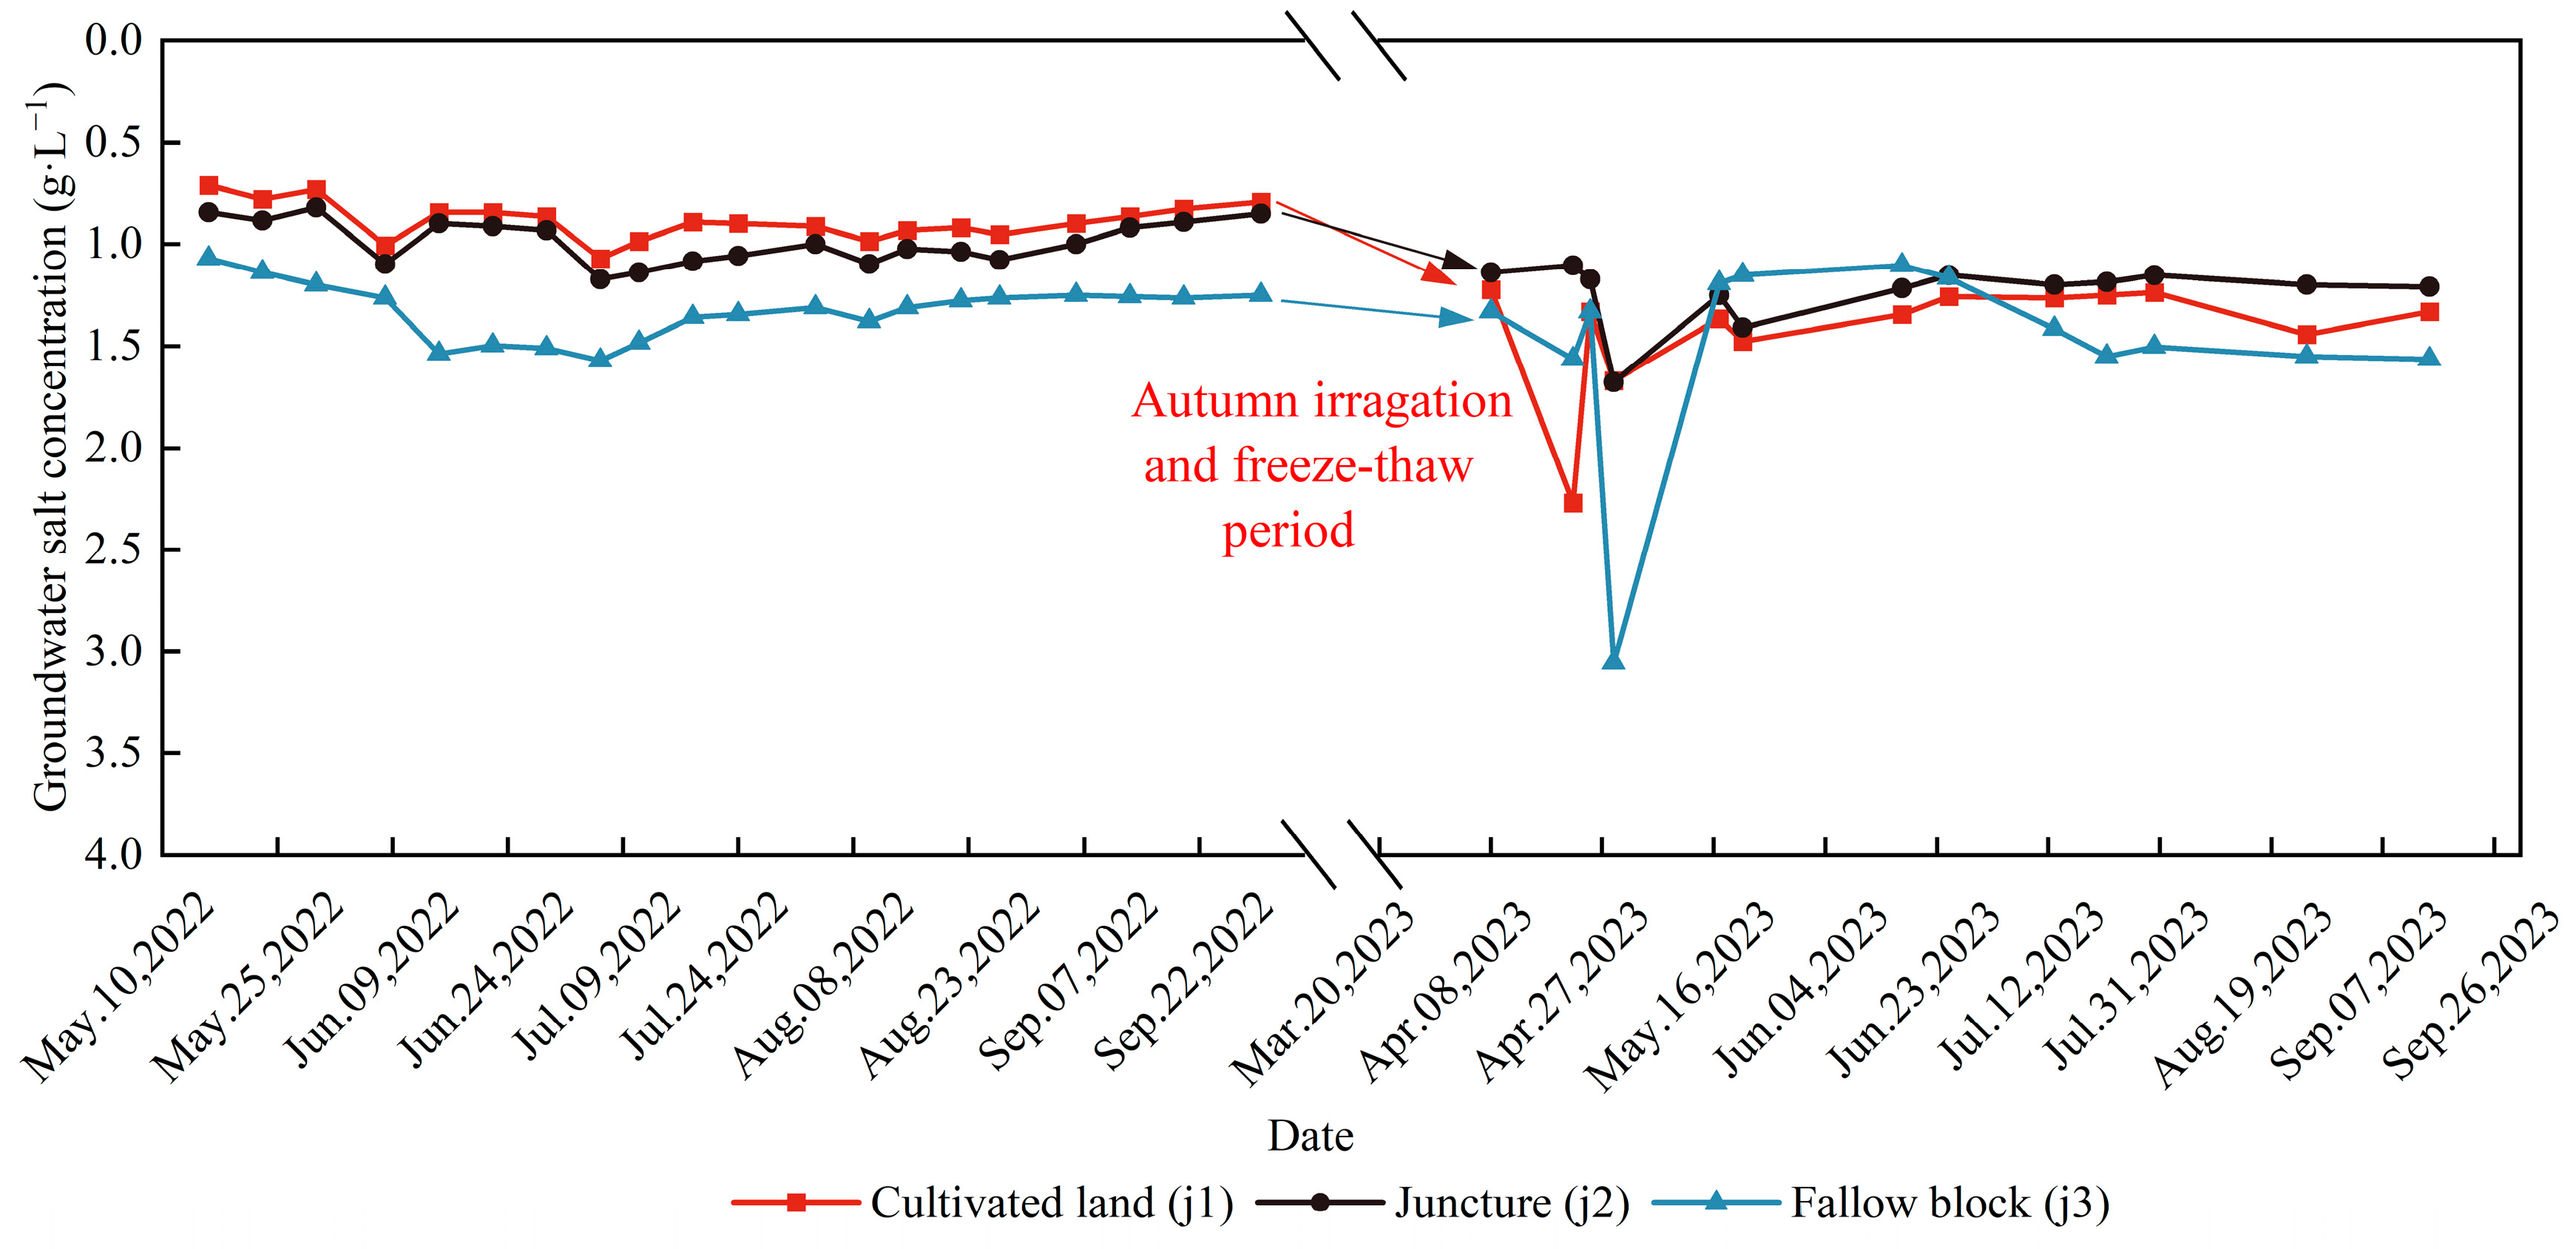
3.5. Dynamic Changes in Groundwater Depth and Salinity

Figure 8 illustrates the groundwater depth over a two-year period spanning from May 2022 to September 2023. The process of water level change in each groundwater observation well was basically identical, which can be roughly divided into five phases: autumn watering phase (mid-September to mid-October), winter storage phase (mid-October to mid-November), freeze-up phase (mid-November to late February of the following year), spring thaw phase (late February to early May), and fertility irrigation stage (early May to mid-September). Before autumn watering, the groundwater depth reached its maximum value during the reproductive period, with an average depth of 2.43 m. After autumn watering, the cultivated land in the study area and all the nearby cultivated land were irrigated, and the groundwater depth rose rapidly within three days. The average depth of groundwater in the cultivated land was 0.72 m, and the shallowest part of the cultivated land reached 0.23 m. Autumn irrigation water volume was higher for most of the year, the irrigation period was longer, and at this time, the groundwater depth was basically at the same level. The main factor for the difference in groundwater depth was the surface elevation of the groundwater wells. The water volume of autumn irrigation was completely infiltrated within January, when it also entered the freezing stage, and the groundwater depth started to decrease synchronously. The groundwater depth at the end of February reached a larger water level trough throughout the year, with an average depth of 2.48 m. After the freeze–thaw period ended, the frozen layer of the soil started to thaw, the freeze–thaw water recharged the groundwater, and the groundwater depth rose, with an average change of 1.03 m. After entering the reproductive period, part of the cultivated land undergoes spring irrigation, groundwater depth begins to rise, it reaches the first peak water level in a year, and with the growth of the crop. As crop transpiration and evapotranspiration continue to increase, they begin to deplete groundwater, the groundwater depth begins to increase, the irrigation of its neighboring cultivated land increases the groundwater depth in the study area, and a strong hydraulic gradient drives the groundwater in the irrigated area into the nonirrigated area. During the entire hydrological year, there are usually two groundwater depth peaks and two groundwater depth troughs, with the first of the peaks occurring after autumn irrigation and the second after spring irrigation; the first of the troughs occurs before autumn irrigation and the second before the end of the freeze–thaw period. The changes in groundwater depth in the study area were mainly affected by irrigation events. The depth of groundwater was cyclically alternating, and a similar pattern of change was repeated in the next hydrological year.
As shown in Figure 9, the change in groundwater mineralization in the study area in 2022 and 2023 was minimal from an overall point of view, and the trend of the change in groundwater mineralization from May 2022 to September 2023 was similar. The change was not evident, and the mineralization of the groundwater was always maintained at a stable level, with an average value of approximately 1.2 g/L. At the end of the freeze–thaw period, groundwater mineralization peaked, probably because the freeze–thaw water dissolved a large number of soluble salts in the soil and entered the groundwater, resulting in an increase in groundwater mineralization. With the gradual increase in atmospheric temperatures, evaporation was gradually strengthened, and the salts in the groundwater reentered the soil. Consequently, the groundwater in the study area always remained at a relatively stable level.

4. Discussion

It has been shown that wasteland, as a special land type, plays a role in maintaining the salt balance in the irrigation area and partly undertakes the role of drainage and salt removal, which creates favorable conditions for the growth of crops [24,25]. Zeng et al. [26] pointed out that wasteland, as the “salt reservoir” of cultivated land, always accumulates salt during the reproductive period and loses salt during the autumn watering period, so as to empty the “salt reservoir” for continued salt accumulation in the second year. Wang et al. [27] pointed out that during the irrigation period, the salts from the cultivated land entered the wasteland along with the groundwater, and 41% of the total salt accumulation in the wasteland originated from the migration of the groundwater from the cultivated land with the horizontal infiltration of the cultivated land, and that the dry drainage of salt from the wasteland was obvious. Liu et al. [28] found that evapotranspiration from cultivated land was greater than that from wasteland, that lateral water and salt fluxes during the irrigation period flowed from irrigated croplands to wastelands within a few days of the onset of irrigation, and that transpirational evaporation could cause water and salt fluxes to flow from wastelands to croplands during irrigation intervals. Xiao et al. [29] used the Modflow model in conjunction with MT3DMS and found that irrigation of cultivated land led to lateral groundwater flow, which contributed to the migration of salts to the wasteland, where the accumulation of salts reached 27–40% of the salts introduced by irrigation. Fairouz et al. [30] found that rainfall amount and rainfall structure have an effect on the concentration of salts in groundwater and soil. The wasteland lacked vegetation cover, resulting in reduced soil evaporation and substantial salt accumulation in the surface layer, which could lead to the formation of salt spots or crusts. These formations inhibit the evaporation of water from the surface of the soil and contribute to the more stable water content of wasteland soils in comparison to that of cultivated land. In addition, soil water content in the surface layer (0–40 cm) of cultivated land and fallow block is more susceptible to external conditions and changes more drastically than in deeper (40–100 cm) soils. The overall difference in soil salinity between cultivated land and wasteland soils was considerable, with cultivated land salinity affected by irrigation, rainfall, and crop growth. In contrast, wasteland soil salinity was affected by precipitation and cultivated land irrigation and served as a salt storage area for cultivated land. It is anticipated that following autumn irrigation, most of the salts accumulated in both cultivated land and wasteland will be leached back into the groundwater. Excessive water us-age during autumn irrigation can result in the wastage of water resources. Moreover, a high groundwater level can contribute to the substantial return of salts in the subsequent year. Conversely, insufficient water addition during autumn irrigation will be inadequate to remove salts from cultivated land, thereby negatively affecting the growth and development of crops. In addition, altering the planting structure will result in changes to the irrigation system, which in turn will indirectly affect the salinity levels in the cultivated land and fallow block in the study area. Therefore, the development of a rational irrigation system and cropping structure to effectively utilize the dry salt drainage capacity of wasteland is an urgent issue.
Salinity, ionic composition, pH, alkalinity, ESP, and other indicators reflect the salinization characteristics of the soil or groundwater to a certain extent, providing a basis for saline and alkaline land improvement. River-loop irrigation areas are affected by climate, irrigation, topography, and anthropogenic factors, and soil salinization is a serious issue. In recent years, many scholars have used the method of principal component analysis to study the characteristics of soil salinization, land use mode, saline soil distribution, and groundwater quality. Ruiping et al. [31] used this method to study the distribution characteristics of spring soil salinization in the urban irrigation domain, and the main factors influencing the degree of spring salinization in the urban irrigation domain were determined. Hongyuan et al. [32] used this method to analyze the accumulation of ions in groundwater and soil salt under two irrigation and drainage modes: drip irrigation + open ditch drainage and yellow irrigation + concealed pipe drainage. Wang et al. [33] used this method in combination with stepwise regression analysis to develop a regression prediction model for soil salt accumulation in cultivated, barren, and sandy lands at a depth of 1.2 m. Abdel-Fattah et al. [34] used principal component analysis in conjunction with GIS to assess the soil quality indices of Egyptian deserts. Li et al. [35] investigated the ionic composition of soil salts in the barren lands of the Kashgar River Basin and found that NaCl and sodium sulfate were the main salts in the soil. This study is similar to the present study. In this study, the indicators of total soil salinity, soil salt ions, and pH were selected as the characteristic factors of soil salinity status, which were used to judge the degree and distribution characteristics of soil salinity in the study area. In the study area, the soil is dominated by saline soils; the main salt in cultivated land is sodium sulfate salt, and the main salt in the fallow block is sodium chloride salt. According to the analysis of the correlation results, sodium chloride salt is the salt that is most active in salt transport between cultivated land and fallow block because sodium chloride salt is easily soluble in water. Consequently, when an irrigation or precipitation event occurs, sodium chloride salt is transported from cultivated land to fallow block with the flow of water, resulting in the continuous accumulation of salt in the wasteland. This results in a constant build-up of salt in fallow blocks.
Soil salinization has always been linked to groundwater [36], with salts in the soil affecting groundwater aquifers through leaching from irrigation and polluting local and regional groundwater [37]. Wang et al. [21] used isotopes, such as δD and δ18O, to discover that 82% of the irrigation water was stored in the 1 m soil, 18% of the irrigation water contributed to the groundwater of the cultivated land, and the groundwater of the wasteland came from precipitation and the groundwater of cultivated land. After irrigation, groundwater acted as a link to carry salts into the wasteland. Similar to the present study, the wasteland in the study area continued to accumulate salts under salt recharge from groundwater, and salt accumulation reached a maximum by the end of the reproductive period. Cui et al. [38] analyzed the relationship between soil salinity and groundwater in the Yao Ba Oasis and found a significant correlation between surface soil salt fractions, salt content, and groundwater. Wang et al. [39] indicated that groundwater depth and salinity are the main factors affecting soil salinization in river oases. Zhang et al. [40] used the ITDRO-SaltMod integrated model to control the groundwater level below the critical depth. Consequently, the groundwater level in the irrigation area was lowered by 0.75 m and the groundwater salinity was lowered by 0.68 g/L, which can effectively control the groundwater salinity and prevent the salinization of soil. As a typical irrigation unit, the groundwater aquifers in this study area are basically in agreement. The groundwater salinity does not show evident changes, and the groundwater salinity is basically at a stable level throughout the year. Groundwater in the fallow block does not show a significant accumulation of salts, indicating that the small fallow blocks existing near the farmland do not affect the groundwater system and that irrigation drenching of the cultivated land is the main factor influencing salinity changes in the farmland.

5. Conclusions

In the arid and semiarid region of Inner Mongolia, the dynamic characteristics of moisture, salinity, ions, and groundwater in cultivated land and fallow block were investigated through a combination of field and indoor experiments. The soil water content of cultivated land and fallow block increased gradually with the depth of the soil layer, and with the continuation of the reproductive period, the water content gradually decreased and reached a minimum value in September. Soil salinity in the fallow block was 1.8 to 2.0 times higher than that in cultivated land, and 56.2% of the salinity in the wasteland accumulated in the surface layer. The results of the content of ions and correlation analyses showed that the predominant salt in the cultivated land was sodium sulfate and in the fallow areas was sodium chloride; the proportion of chloride in the salts of the cultivated land increased gradually with time. Through principal component analysis, six indicators of Na++K+, Cl, SSC, SO42−, HCO3, and pH in cultivated soils were used as characteristic factors of soil salinity status, and five indicators of Na++K+, Cl, SSC, HCO3, and pH were used as characteristic factors of salinity status in the salinized soils of the fallow block in the study area. The depth of groundwater in the study area varied periodically, with two peaks and two troughs in a hydrological year, and groundwater mineralization was always at a stable level. The objectives of this study are to optimize the rational spatial distribution of cultivated land and fallow blocks, to use fallow blocks for dry salt drainage, and to provide theoretical references for the prevention and control of soil salinization and water management in an irrigation district.

Author Contributions

Conceptualization, H.S.; methodology, H.S.; validation, H.S.; formal analysis, C.H. and Q.M.; investigation, C.H., Q.M., H.S., Z.H., C.Y., Y.Z. and Y.Y.; resources, H.S.; data curation, H.S.; writing—original draft, C.H.; writing—review and editing, H.S. and W.F.; visualization, C.H., H.S. and W.F.; supervision, H.S. and W.F.; project administration, H.S. All authors have read and agreed to the published version of the manuscript.

Funding

This study was supported by the “14th Five-Year Plan” National Key R&D Program, China (grant number 2021YFC3201202-05), the Inner Mongolia Autonomous Region “Unveiling the List of Commanders” Project, China (2023JBGS0003), the National Natural Science Foundation of China (52269014), and the Project of Science and Technology of Inner Mongolia Province (2022YFHH0044).

Data Availability Statement

The data already exist in this manuscript.

Conflicts of Interest

The authors declare that they have no competing financial interests or personal relationships that could have influenced the work reported in this manuscript.

References

  1. Guan, Z.; Jia, Z.; Zhao, Z.; You, Q. Dynamics and distribution of soil salinity under long-term mulched drip irrigation in an arid area of northwestern China. Water 2019, 11, 1225. [Google Scholar] [CrossRef]
  2. Cui, G.; Lu, Y.; Zheng, C.; Liu, Z.; Sai, J. Relationship between soil salinization and groundwater hydration in Yaoba Oasis, Northwest China. Water 2019, 11, 175. [Google Scholar] [CrossRef]
  3. Abbas, A.; Khan, S.; Hussain, N.; Hanjra, M.A.; Akbar, S. Characterizing soil salinity in irrigated agriculture using a remote sensing approach. Phys. Chem. Earth Parts A/B/C 2013, 55, 43–52. [Google Scholar] [CrossRef]
  4. Wang, Y.; Deng, C.; Liu, Y.; Niu, Z.; Li, Y. Identifying change in spatial accumulation of soil salinity in an inland river watershed, China. Sci. Total Environ. 2018, 621, 177–185. [Google Scholar] [CrossRef] [PubMed]
  5. Liu, Y.; Ao, C.; Zeng, W.; Srivastava, A.K.; Gaiser, T.; Wu, J.; Huang, J. Simulating water and salt transport in subsurface pipe drainage systems with HYDRUS-2D. J. Hydrol. 2021, 592, 125823. [Google Scholar] [CrossRef]
  6. Xu, X.; Huang, G.; Sun, C.; Pereira, L.S.; Ramos, T.B.; Huang, Q.; Hao, Y. Assessing the effects of water table depth on water use, soil salinity and wheat yield: Searching for a target depth for irrigated areas in the upper Yellow River basin. Agric. Water Manag. 2013, 125, 46–60. [Google Scholar] [CrossRef]
  7. Yuan, C.; Feng, S.; Zhuang, X.; Qian, Z. Analysis on the groundwater salt dynamic in a monitoring area in Hetao Irrigation District of Inner Mongolia. Agric. Res. Arid. Areas 2020, 40, 76–85. [Google Scholar]
  8. Gowing, J.; Wyseure, G. Dry-drainage a sustainable and cost-effective solution to waterlogging and salinisation. In Proceedings of the 5th International Drainage Workshop, Lahore, Pakistan, 8–15 February 1992; pp. 6.26–26.34. [Google Scholar]
  9. Ansari, S.; Abedi-Koupai, J.; Mostafazadeh-Fard, B.; Shayannejad, M.; Mosaddeghi, M.R. Assessment of solute transport and distribution under dry drainage conditions using a physical model. Irrig. Drain. 2019, 68, 797–807. [Google Scholar] [CrossRef]
  10. Konukcu, F.; Gowing, J.; Rose, D. Dry drainage: A sustainable solution to waterlogging and salinity problems in irrigation areas? Agric. Water Manag. 2006, 83, 1–12. [Google Scholar] [CrossRef]
  11. Soltani, M.; Rahimikhoob, A.; Sotoodehnia, A.; Mendicino, G.; Akram, M.; Senatore, A. Numerical evaluation of the effects of increasing ratio of cropped to uncropped width on dry drainage efficiency in salty soils. Irrig. Drain. 2018, 67, 91–100. [Google Scholar] [CrossRef]
  12. Li, L.; Shi, H.; Jia, J.; Wang, C.; Liu, H. Simulation of water and salt transport of uncultivated land in Hetao Irrigation District in InnerMongolia. Trans. CSAE 2010, 26, 31–35. [Google Scholar] [CrossRef]
  13. Ren, D.; Xu, X.; Huang, G. Irrigation water use in typical irrigation and drainage system of Hetao Irrigation District. Trans. Chin. Soc. Agric. Eng. 2019, 35, 98–105. [Google Scholar] [CrossRef]
  14. Wang, G.; Shi, H.; Li, X.; Yan, J.; Miao, Q.; Chen, N.; Wang, W. Simulation and evaluation of soil water and salt transport in desert oases of Hetao Irrigation District using HYDRUS-1D model. Trans. Chin. Soc. Agric. Eng. 2021, 38, 87–98. [Google Scholar] [CrossRef]
  15. Wei, F.; Shen, C.; Liu, J.; Wu, J. Analysis of factors influencing the effect of dry drainage salt control based on numerical simulation. China Rural Water Hydropower 2015, 5, 85–90. [Google Scholar]
  16. Wang, X.; Gao, Q.; Lv, Q.; Li, B. Salt-water Balance and Dry Drainage Desalting in Hetao Irrigating Area, Inner Mongolia. Sci. Geogr. Sin. 2006, 26, 4455–4460. [Google Scholar]
  17. Yue, W.; Yang, J.; Tong, J.; Gao, H. Transfer and balance of water and salt in irrigation district of arid region. J. Hydraul. Eng. 2008, 39, 623–626+632. [Google Scholar]
  18. Wu, J.; Zhao, L.; Huang, J.; Yang, J.; Vincent, B.; Bouarfa, S.; Vidal, A. On the effectiveness of dry drainage in soil salinity control. Sci. China Ser. E Technol. Sci. 2009, 52, 3328–3334. [Google Scholar] [CrossRef]
  19. Wang, C.; Wu, J.; Zeng, W.; Zhu, Y.; Huang, J. Five-year experimental study on effectiveness and sustainability of a dry drainage system for controlling soil salinity. Water 2019, 11, 111. [Google Scholar] [CrossRef]
  20. Yu, B.; Jiang, L.; Shang, S. Dry drainage effect of Hetao irrigation district based on remote sensing evapotranspiration. Trans. Chin. Soc. Agric. Eng. 2016, 32, 1–8. [Google Scholar] [CrossRef]
  21. Wang, G.; Shi, H.; Li, X.; Yan, J.; Guo, J.; Li, Z. Study on migration of different types water during farmland-wasteland-lake system in Hetao Irrigation District. Adv. Water Sci 2020, 31, 832–842. [Google Scholar]
  22. Fox, G.A.; Metla, R. Soil property analysis using principal components analysis, soil line, and regression models. Soil Sci. Soc. Am. J. 2005, 69, 1782–1788. [Google Scholar] [CrossRef]
  23. Sun, K.; Zhang, J.; Zhang, W.; Zhou, W.; Wang, J. Characteristics of Soil Salinity in Representative Plastic Shed Vegetable Production Areas in Shandong Province, China. Eurasian Soil Sci. 2023, 56, 488–501. [Google Scholar] [CrossRef]
  24. Ren, D.; Xu, X.; Huang, Q.; Huo, Z.; Xiong, Y.; Huang, G. Analyzing the role of shallow groundwater systems in the water use of different land-use types in arid irrigated regions. Water 2018, 10, 634. [Google Scholar] [CrossRef]
  25. Ren, D.; Xu, X.; Ramos, T.B.; Huang, Q.; Huo, Z.; Huang, G. Modeling and assessing the function and sustainability of natural patches in salt-affected agro-ecosystems: Application to tamarisk (Tamarix chinensis Lour.) in Hetao, upper Yellow River basin. J. Hydrol. 2017, 552, 490–504. [Google Scholar] [CrossRef]
  26. Zeng, J.; Liu, X.; Li, J.; XIa, Y.; Wang, L. Dynamic analysis of water and salt in cropland-saline alkali land-sand dunes-lake area based on SWAP model. J. Agric. Resour. Environ. 2018, 35, 540–549. [Google Scholar] [CrossRef]
  27. Wang, G.; Shi, H.; Li, X.; Guo, J.; Wang, W.; Wu, D. Estimation of Salt Transport and Relationship with Groundwater Depth in Different Land Types in Hetao Irrigation Area. Trans. Chin. Soc. Agric. Mach. 2020, 51, 255–269. [Google Scholar] [CrossRef]
  28. Liu, G.; Wang, C.; Wang, X.; Huo, Z.; Liu, J. Growing season water and salt migration between abandoned lands and adjacent croplands in arid and semi-arid irrigation areas in shallow water table environments. Agric. Water Manag. 2022, 274, 107968. [Google Scholar] [CrossRef]
  29. Xiao, X.; Xu, X.; Ren, D.; Huang, Q.; Huang, G. Modeling the behavior of shallow groundwater system in sustaining arid agroecosystems with fragmented land use. Agric. Water Manag. 2021, 249, 106811. [Google Scholar] [CrossRef]
  30. Slama, F.; Gargouri-Ellouze, E.; Bouhlila, R. Impact of rainfall structure and climate change on soil and groundwater salinization. Clim. Chang. 2020, 163, 395–413. [Google Scholar] [CrossRef]
  31. Wang, R.; Wan, H.; Chen, S.; Xia, Y.; Bai, Q.; Peng, Z.; Shang, S. Spatial distribution pattern of soil salinization in farmland of Wulate sub-irrigation areas in Hetao Irrigation District in Inner Mongolia in spring. Trans. Chin. Soc. Agric. Eng. 2021, 38, 105–113. [Google Scholar] [CrossRef]
  32. Gao, H.; Liu, X.; Gao, X.; Qu, Z. Analysis o fSalinity and Ions Migration Law and Equilibrium in Salinized Soil Under Different Irrigationand Drainage Modes. J. Soil Water Conserv. 2023, 37, 361–370. [Google Scholar] [CrossRef]
  33. Wang, Y.; Liu, X.; Hu, X.; Qiao, T. Water and salt distribution and salt accumulation characteristics of cultivated-waste-sandy lands in salinized irrigated area. Agric. Res. Arid Areas 2020, 38, 207–214. [Google Scholar] [CrossRef]
  34. Abdel-Fattah, M.K.; Mohamed, E.S.; Wagdi, E.M.; Shahin, S.A.; Aldosari, A.A.; Lasaponara, R.; Alnaimy, M.A. Quantitative evaluation of soil quality using Principal Component Analysis: The case study of El-Fayoum depression Egypt. Sustainability 2021, 13, 1824. [Google Scholar] [CrossRef]
  35. Li, S.; Lu, L.; Gao, Y.; Zhang, Y.; Shen, D. An Analysis on the Characteristics and Influence Factors of Soil Salinity in the Wasteland of the Kashgar River Basin. Sustainability 2022, 14, 3500. [Google Scholar] [CrossRef]
  36. Guan, X.; Wang, S.; Gao, Z.; Lv, Y.; Fu, X. Spatio-temporal variability of soil salinity and its relationship with the depth to groundwater in salinization irrigation district. Acta Ecol. Sin. 2012, 32, 1202–1210. [Google Scholar] [CrossRef]
  37. Mohanavelu, A.; Naganna, S.R.; Al-Ansari, N. Irrigation induced salinity and sodicity hazards on soil and groundwater: An overview of its causes, impacts and mitigation strategies. Agriculture 2021, 11, 983. [Google Scholar] [CrossRef]
  38. Cui, X.; Han, W.; Zhang, H.; Cui, J.; Ma, W.; Zhang, L.; Li, G. Estimating soil salinity under sunflower cover in the Hetao Irrigation District based on unmanned aerial vehicle remote sensing. Land Degrad. Dev. 2023, 34, 84–97. [Google Scholar] [CrossRef]
  39. Wang, D.; Zhao, C.; Zheng, J.; Zhu, J.; Gui, Z.; Yu, Z. Evolution of soil salinity and the critical ratio of drainage to irrigation (CRDI) in the Weigan Oasis in the Tarim Basin. Catena 2021, 201, 105210. [Google Scholar] [CrossRef]
  40. Zhang, Y.; Yang, P.; Liu, X.; Adeloye, A.J. Simulation and optimization coupling model for soil salinization and waterlogging control in the Urad irrigation area, North China. J. Hydrol. 2022, 607, 127408. [Google Scholar] [CrossRef]
Figure 1. Location of the study area and distribution of sampling sites.
Water 15 04098 g001
Figure 2. Changes in precipitation and temperature in the study area in 2022 and 2023.
Water 15 04098 g002
Figure 3. Changes in soil moisture content of cultivated land and wasteland in 2022 and 2023.
Water 15 04098 g003
Figure 4. The variation characteristics of soil salinity in 2022 and 2023.
Water 15 04098 g004
Figure 5. Changes in soil salt ions in 2022 cultivated land and wasteland.
Water 15 04098 g005
Figure 6. Changes in soil salt ions in 2023 cultivated land and wasteland.
Water 15 04098 g006
Figure 7. Correlation analysis of soil salt ions in different land types.
Water 15 04098 g007
Figure 8. The change in groundwater depth from 2022 to 2023.
Water 15 04098 g008
Figure 9. The change in groundwater buried salinity in 2022 and 2023.
Water 15 04098 g009
Table 1. Soil physical properties.
Land TypeSoil DepthSandClaySiltSoil TextureBulk DensityField CapacitySaturated Water Capacity
(cm)(%)(%)(%)(g·cm−3)(cm3·cm−3)(cm3·cm−3)
0–100.320.060.62Silt Loam1.628.66%34.37%
10–200.180.100.72Silt Loam1.5427.67%26.16%
Cultivated land20–400.290.070.64Silt Loam1.5126.72%32.92%
40–600.030.160.81Silt Loam1.529.23%34.13%
60–800.060.160.78Silt Loam1.532.72%37.92%
80–1000.300.060.64Silt Loam1.4733.27%40.36%
0–100.190.050.76Silt Loam1.6731.87%39.29%
10–200.200.050.75Silt Loam1.4928.48%34.49%
Fallow block20–400.100.040.85Silt1.4827.89%33.57%
40–600.080.050.88Silt1.4533.33%39.33%
60–800.070.060.87Silt1.5630.28%36.46%
80–1000.050.070.87Silt1.5131.37%39.07%
Table 2. Eigenvalues and variance contributions of principal component analysis.
Land TypePrincipal ComponentEigenvalueContribution/%Cumulative Contribution/%
Cultivated landPCA13.90248.76948.769
PCA21.78722.33871.107
PCA31.28616.07187.178
Fallow blackPCA1′4.22152.76652.766
PCA2′1.63320.41373.179
Table 3. Principal component analysis table.
LandPrincipal ComponentCoefficients of the Indicators in the Principal Components
TypeHCO3ClCa2+Mg2+SO42−Na++K+pHSSC
Cultivated landPCA1−0.1960.9340.658−0.2230.8190.920.3450.934
PCA20.914−0.1360.1370.40.0120.130.85−0.126
PCA3−0.2650.007−0.6210.7520.4260.276−0.028−0.081
Fallow blockPCA1′0.4340.9470.750.4940.6840.947−0.3860.905
PCA2′0.7150.099−0.5250.1570.0440.1290.8840.112
Disclaimer/Publisher’s Note: The statements, opinions and data contained in all publications are solely those of the individual author(s) and contributor(s) and not of MDPI and/or the editor(s). MDPI and/or the editor(s) disclaim responsibility for any injury to people or property resulting from any ideas, methods, instructions or products referred to in the content.

