Article

A Case Study for Stability Analysis of Toppling Slope under the Combined Action of Large Suspension Bridge Loads and Hydrodynamic Forces in a Large Reservoir Area

1
China Communications Highway Planning and Design Institute Co., Ltd., Beijing 100010, China
2
Earth Sciences and Engineering College, Hohai University, Nanjing 210098, China
*
Author to whom correspondence should be addressed.
Water 2023, 15(23), 4037; https://doi.org/10.3390/w15234037
Submission received: 14 September 2023 / Revised: 3 November 2023 / Accepted: 9 November 2023 / Published: 21 November 2023

Abstract

:
The foundation of a large river crossing bridge is often located on high and steep slopes in mountainous area, and the stability of the slope has a significant impact on the safety of the bridge. Not only the bridge load, but also the hydro-dynamical action in the reservoir area has a significant impact on the stability of the bank slope where the bridge foundation is located, especially for the toppling bank slope. This paper takes the stability of the toppling bank slope where the one major bridge foundation is located at on the Lancang River in China as an example. Through on-site exploration, drilling data and core conditions, and television images of the borehole, the geological structure of the on-site bank slope were conducted. Based on the development of the dumping body obtained from on-site exploration, corresponding indicators have been proposed from the perspectives of rock inclination, deformation, and rock quality to clarify the degree of dumping along the depth of the bank slope. The failure mechanism of the overturned bank slope under the action of a bridge was analyzed from a mechanical perspective. Numerical simulations were conducted using GeoStudio 2018:SEEP/W and FLAC3D 6.0 software to analyze the failure modes of bridge loads and hydrodynamic forces under different water levels and rainfall conditions. The seepage field characteristics, failure modes, and stability characteristics were analyzed from a two-dimensional perspective, while the displacement characteristics, plastic zone, and stress–strain characteristics were explored from a three-dimensional perspective, which revealed the evolution mode of overturned deformation under the action of bridge foundation loads. Finally, the stability of the wide slope was numerically calculated using the strength reduction method, and the stability calculation data was combined with the numerical simulation results to determine the optimal location of the bridge foundation.

1. Introduction

With the rapid development of highway construction in mountainous areas of China, a large number of bridge foundations set in high and steep slope have emerged. Bridge foundations on high and steep slopes in mountainous are usually set in the form of a pile foundation, and the geological environment in which the foundations are located is complex, especially on the slope of the reservoir bank with developed toppling deformation. The effect of bridge load and reservoir water change aggravates the degree of toppling deformation, which may cause slope instability and bridge foundation failure. It is necessary to evaluate the stability of toppled rock slope under bridge loads and hydrodynamic forces. In the process of evaluating the stability of the bank slope under the bridge load, the influence of the bridge load on the shape and position of the potential sliding surface in the bank slope should be considered. Currently, there is relatively little research on this type of pile foundation and there is no complete theoretical method. It is also not possible to design and guide with conventional calculation methods. To ensure the reliability and safety of the pile foundation, the stability analysis and evaluation of the slope under the action of bridge loads and reservoir water level fluctuations have important practical significance. In recent years, relevant research has been conducted on bridge foundations on high slopes, but it mainly focused on high and steep slopes with good rock mass quality. There is a lack of research on the impact of toppling deformation of rock slope and changes in reservoir water level on the stability of bridge foundation slopes. Some researchers used engineering geological methods and block theory to analyze the stability of high and steep slopes in canyon areas under bridge loads [1,2,3]. The research focus is on the impact of bridge load lateral forces on slope stability. Yu et al. obtained the response of a single pile subjected to a lateral load in sloping ground via a field test [4]. With the development of the finite element method, more and more scholars begin to use the strength reduction method to analyze bridge foundation bank slope stability. Deendayal et al. used the finite element numerical method to study the behavior of a group of piles located on sloping ground, and obtained the effect of slopes on pile capacity [5]. Sitharam et al. analyzed the highly jointed slopes on the abutments of a railway bridge [6]. Tian et al. used the strength reduction method to analyze the stability of the bank by considering the effect of bedding and vertical joints, and they obtained the results of how a slide surface would form under skewback due to a huge bridge load [7]. Souri et al. studied the static lateral behavior of the battered pile group foundation of an I-10 twin span bridge by using the 3D finite element modeling [8]. Abu-Farsakh et al. have researched the static lateral behavior of three pile group configurations by using three-dimensional finite element modeling [9]. Their research on the stress problem of high- and steep-slope bridge piers mainly focused on pile foundations and has achieved a series of valuable results. Luo et al. established a three-dimensional finite element calculation model for double-row foundation piles of bridges on rock slopes, and obtained the stress distribution law of rock slopes [10]. These studies have deepened our understanding of the forces acting on high- and steep-slope bridge piers. Some researchers have studied the seismic performance of bridge-pile-foundation slopes with anti-sliding piles. Zhou et al. have conducted shaking table tests on bridge foundation reinforced by anti-slide piles on slope [11]. Zhang et al. have researched the seismic performance of bridge-pile-foundation slopes with an anti-sliding pile by using the large-scale shaking table model test [12].
The geological structure of the toppling deformation slope is relatively complex, and there are many influencing factors. The sliding scale of toppled and deformed slopes varies, and the deformation depth is usually smaller than the scale of the landslide. However, in the canyon area of southwestern China, the deformation depth can reach 200–300 m. The damage caused by toppling deformation is related to factors such as the degree and type of toppling, and the failure modes and sliding modes of toppling failure vary greatly under different influencing factors. The collapse deformation and damage can be divided into three categories: bending collapse, block collapse, and block bending collapse. The different types of damage threats are shown in Table 1.
At present, a large amount of research on toppling deformation is focused on the failure mechanism, deformation mode, etc. Some scholars have studied the changes in water level in the reservoir area caused by the construction of hydropower stations in western China and their impact on the degree of toppling. Research on the stability of slopes where bridges are located has focused heavily on the impact of bridge loads on slope stability and the exploration of slope slip mechanisms. Therefore, there is relatively little research on the stability of inverted layered rock slopes under bridge loads. In relevant research, most scholars used simplified two-dimensional numerical analysis to study bridge foundation slopes, in which it is difficult to reflect the relevant effects on canyon terrain with significant terrain fluctuations; in three-dimensional numerical analysis, most bridge loads are replaced by simplified concentrated forces or ignored, making it difficult to reflect the impact of bridge foundations on slope stability.
Although many scholars have studied the stability of bridge pile foundations on slopes, as well as the evaluation of the stability of toppled rock slopes, there is very little research on building large bridges on toppled rock slopes of large reservoirs. The prediction of deformation or failure of toppled rock slopes under bridge loads is one of the key contents of safety research for large bridges. This paper proposed the basic indicators of toppling deformation bodies to discuss the mechanism of toppling deformation under the action of bridges and hydrodynamic forces, simulated the characteristics of the seepage field on a two-dimensional scale, and conducted a stability analysis using the rigid body limit equilibrium stability calculation method. The slope stress state and plastic zone distribution characteristics of two sets of bridge type schemes were analyzed at a three-dimensional scale, and the optimal scheme for a bridge foundation layout was ultimately determined using the strength reduction method. In summary, this paper took the stability of a collapsed bank slope of a certain bridge foundation on the Lancang River as an example, combined engineering geological methods with numerical simulation, simulated the combined effect of bridge loads and hydrodynamic forces, explored potential failure modes of the bank slope, discussed slip modes, and comprehensively evaluated the stability of the bank slope.
The purpose of this paper is to achieve the following:
(1)
Provide the method for determining the toppling deformation degree of bank slopes along depth;
(2)
Propose the prediction model of the toppling deformation trend under the combined action of bridge loads and reservoir hydrodynamics;
(3)
Establish the stability evaluation method for the toppling bank slope in a large canyon reservoir area under bridge loads and hydrodynamic forces.
To analyze the stability of toppled slopes under the combined action of bridge loads and hydrodynamic forces, many methods currently used for calculating and evaluating toppled slopes can be selected. At present, many calculation and evaluation methods of toppling slope stability are used, which can be divided into the following types: ① Numerical methods: methods include the finite element method (FEM), the discrete element method (DEM), finite difference method (FDM), the boundary element method (BEM), discontinuous deformation analysis (DDA), elastic-plastic finite element analysis of strength reduction, the point safety factor method based on finite element theory, the Lagrange fast difference method (FLAC), etc. Marc-Andre and Doug used a three-dimensional discrete element program to study the influence of discontinuous structural planes on the mechanism of block toppling deformations in rock masses [13]. Pinheiro et al. used the discrete element method to study the development mechanism and deformation failure characteristics of a slope in Brazil due to bending and toppling. Compared with the continuous medium method, they better simulated the failure process of rock masses along discontinuous surfaces. They also used the discrete element method to perform an inverse analysis on the parameters of bending and toppling failure of a rock mass [14]. Li et al. proposed a new discrete element method (CDEM) to simulate the irreversible process from continuous deformation to discontinuous deformation, analyze the characteristics of toppling deformation and failure mechanism, and compare the numerical simulation results with GB-InSAR monitoring data to verify the applicability of the method [15]. Lian et al. used a discrete lattice spring numerical model to study the deformation development law of toppling failure of fractured rock slopes [16]. Zhang et al. used the discrete element method to study the seismic dynamic response mechanism of layered slopes against tilting, and analyzed the tilting deformation mechanism of layered slopes with different slopes, joint angles, and joint orientations under natural earthquake and sine wave actions [17]. Hassan et al. compared the reliability of the finite element and discrete element methods for a stability analysis of rock masses with upper sliding and lower tilting, and the results showed that the discrete element method has a higher accuracy in a stability analysis of such toppling deformation of rock masses [18]. ② Limit equilibrium method: Unbalanced thrust transfer coefficient method, Sarma method, key block theory, etc. Liu et al. proposed a stability analysis method for toppled deformed rock slopes based on the limit equilibrium method for the case where the thickness of the block toppling deformed rock mass is less than the thickness of the top rock mass [19]. ③ Physical simulation method. In 1971, Ashby J. was the first to use the inclined table model-based technology to study the mechanism and process of slope collapse failure. Subsequently, In 1978, HittingerM proposed the theory of the base friction test for the study of slope block toppling and bending toppling. Ignacio et al. conducted indoor model experiments to simulate toppling deformation using tilting table tests. In the experiments, 3D printing technology was used to prepare toppling deformation rock masses, simulate the development mechanism of toppling deformation, and extend the experimental results to the effects of earthquakes or water [20]. Zheng et al. designed three sets of centrifuge model tests with different slope angles to simulate the evolution process of inverted layered slope toppling deformation under different slope angle conditions, taking the dam toppling deformation of the Lancang River Gushui Hydropower Station as an example [21]. Zheng et al. proposed an adaptive moment estimation method for the stability analysis of toppling deformation, and compared it with the results of a centrifuge test analysis of toppling deformation stability, indicating that this method can effectively find the toppling instability surface and corresponding safety factor [22]. ④ Uncertainty analysis methods: including the reliability analysis method of slope stability, stochastic process method, fuzzy analysis method, grey system prediction, artificial intelligence and artificial neural network method, etc. Ardestani used probability analysis methods to consider the effects of slope shape, structural surface characteristics, geotechnical parameters, groundwater, dynamic loads, and support measures on the formation mechanism and stability of anti-dip slopes [23]. ⑤ Other analysis methods include engineering geological analogy and graphical methods. In the above research methods, most of them focus on discussing the deformation conditions under which the rock mass undergoes toppling, analyzing the mechanism of toppling deformation, or evaluating the stability of the slope after excavation or unloading of the toppling rock mass. There is very little research on the secondary failure mechanism under combined action of bridge loads and reservoir hydrodynamical change. Liu et al. studied the instability mechanism of the toppled slope under geological loads using the #1 toppling deformed rock mass of Huangdeng Hydropower Station as the research object; it is believed that during an earthquake, multiple cracks are formed inside the collapsed rock mass, cutting and shearing the rock mass, resulting in deformation and failure of the collapsed rock mass [24]. Huang et al. used geological surveying, exploration tunnels, electron spin resonance dating, and kinematic monitoring to analyze the deep dumping mechanism of a high and steep anti-tilting slope at the Miaowei Hydropower Station dam site in the Lancang River. They believe that the deep dumping is caused by the rapid cutting of the valley under high ground stress [25]. Cai et al. studied the deformation mechanism of the ductile bending toppling mode in toppling deformation, dividing ductile bending toppling into the start-up stage, rapid deformation stage, transient stability stage, and long-term creep stage [26]. Zhang et al. proposed a calculating model of limited toppling depth according to the shallow deformation strength by using geological mechanism analysis and the numerical simulation method [27]. Xuan et al. discussed the large reservoir bank slope stability on considering wave action [28]. Based on the research content of the above literature, the advantages and disadvantages of the numerical simulation methods used have been summarized. The specific content is shown in Table 2.

2. Research Materials and Methods

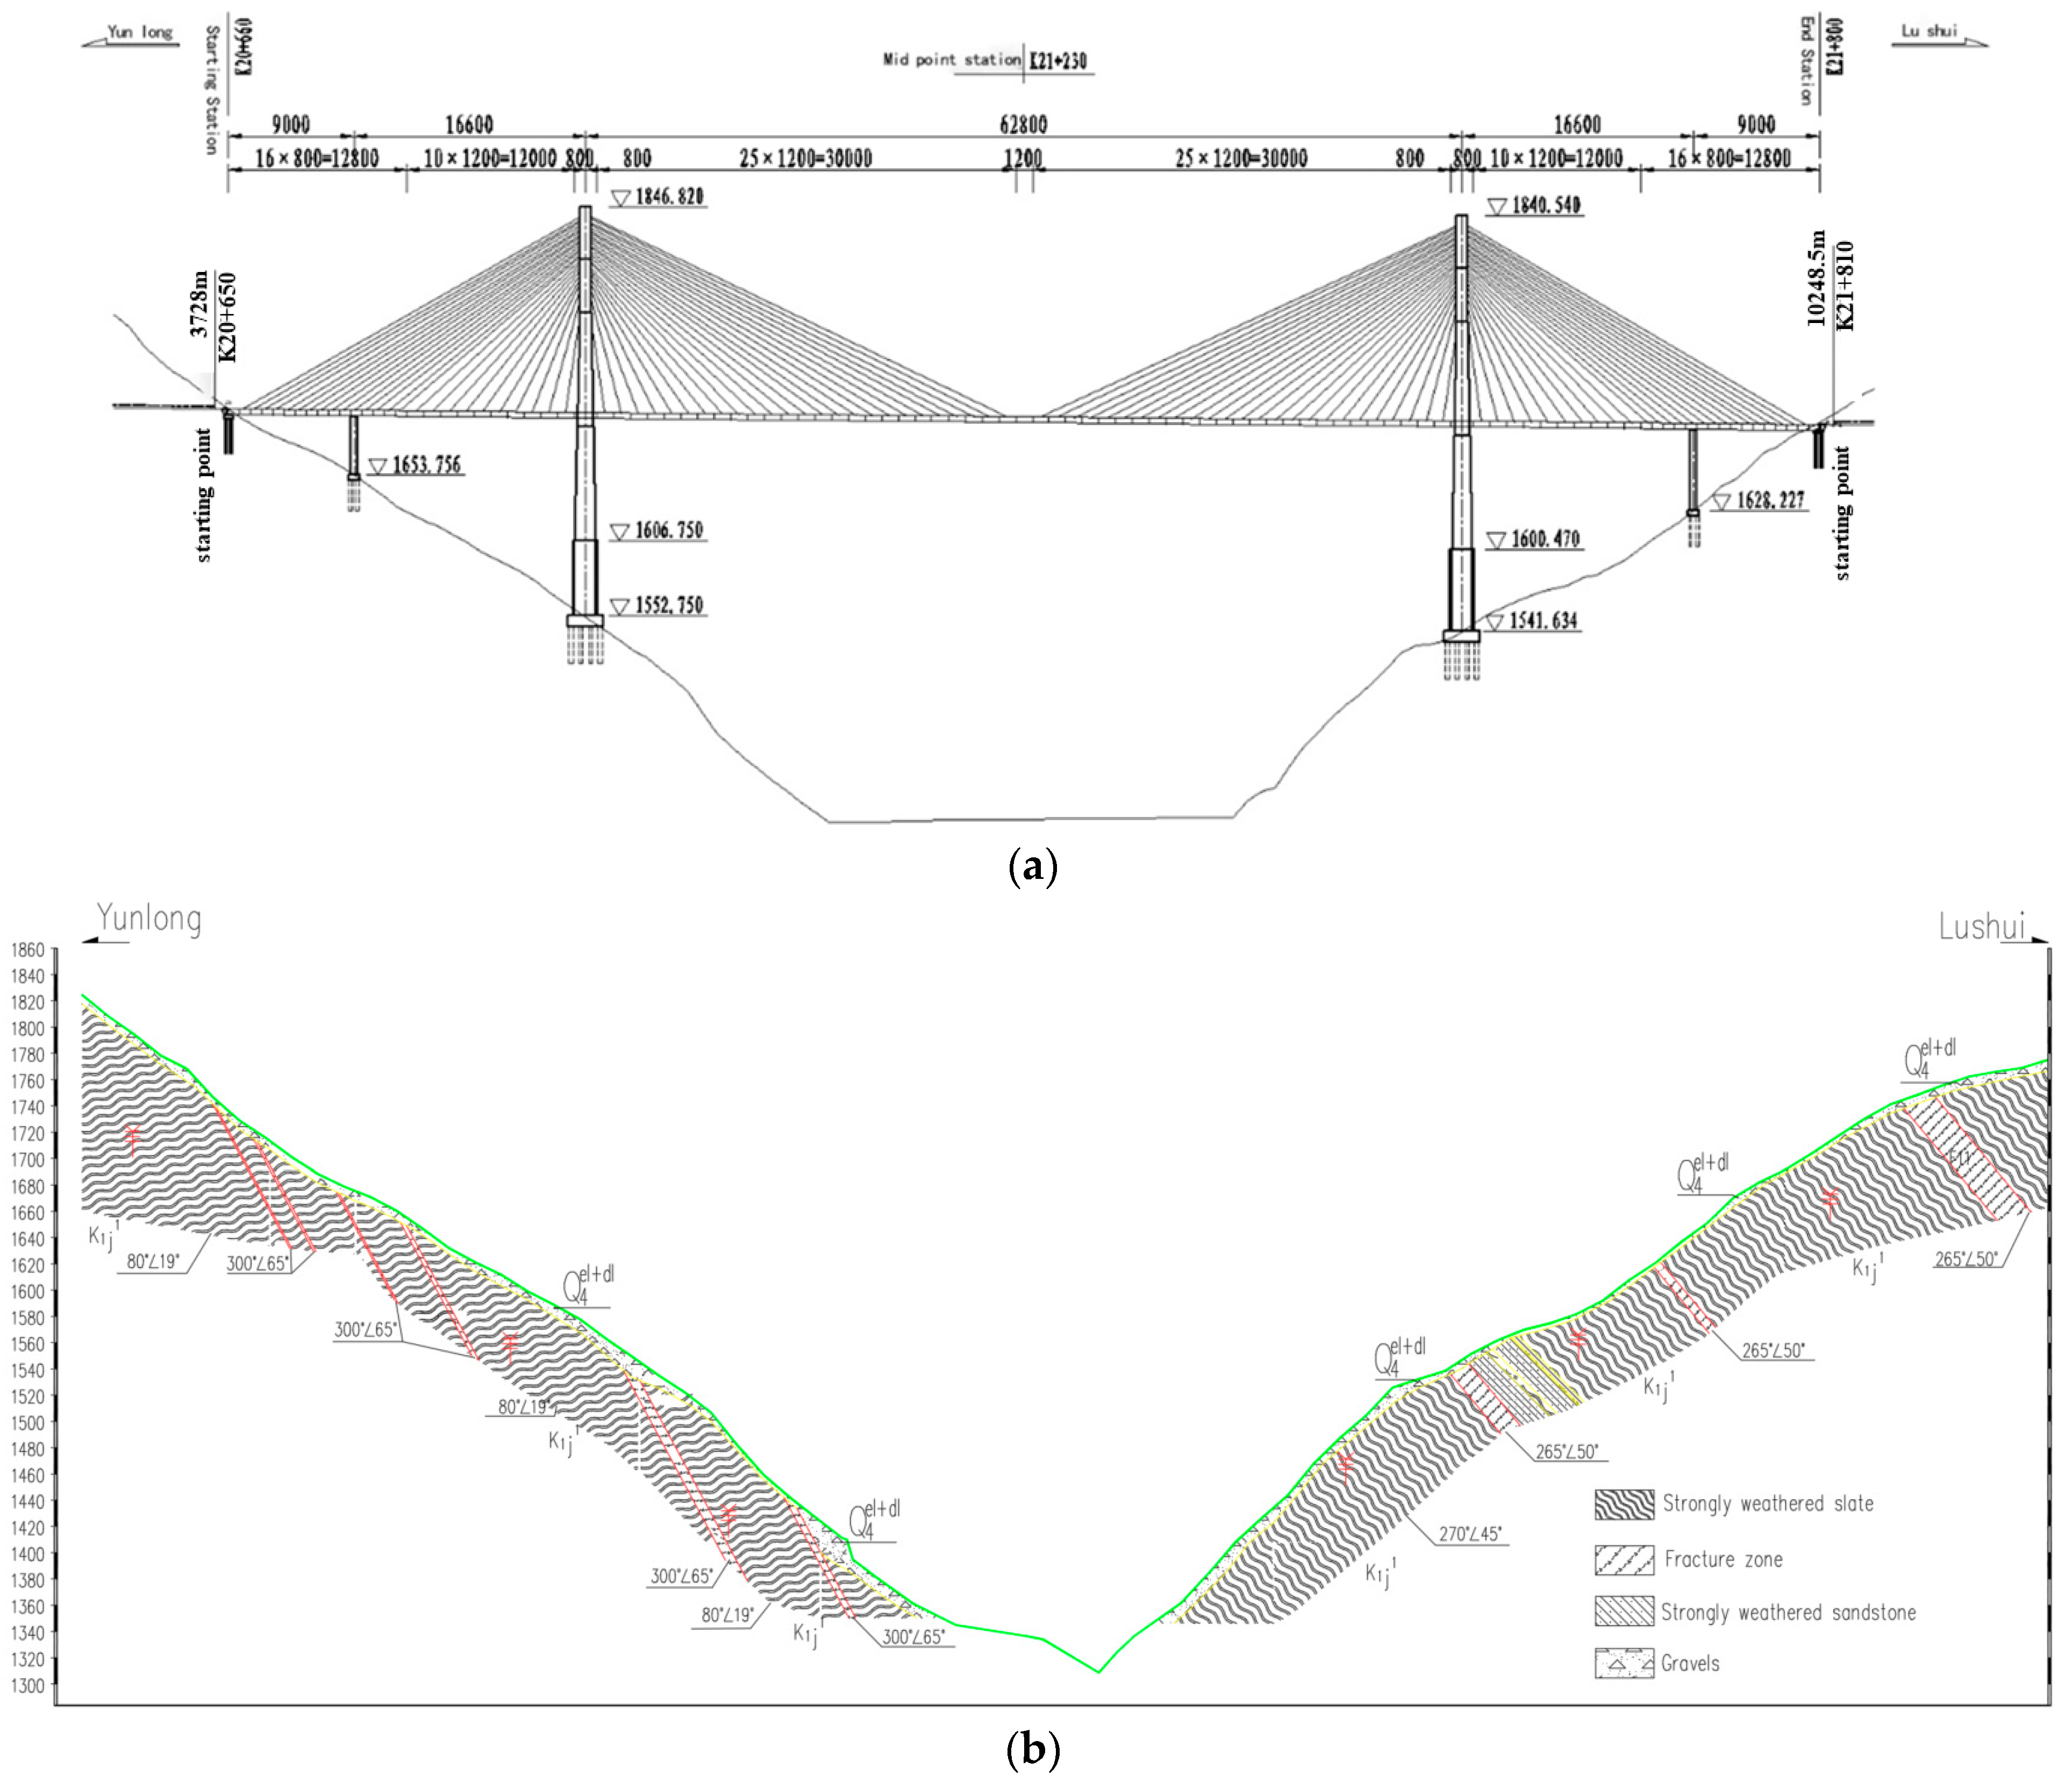
2.1. Overview of the Research Area

The Lancang River Grand Bridge is located on the northeast side of Yingping Village, Yunlong County, Yunnan Province. The piers of the bridge are located both on the east and west bank slopes of the Miaowei Hydropower Station Reservoir on the Lancang River, with a water level depth of about 70–100 m. During the period of the on-site survey, the water surface elevation of the reservoir was 1400–1405 m, and the width of the water surface was about 240 m. The Lancang River brand Bridge is a 256 + 628 + 256 m double-tower composite girder cable-stayed bridge, while the main span is 495 m, and the bridge span is arranged as 3 × 60 m + 75 m + 495 m + 75 m + 75 m + 3 × 60 m = 1005 m. It is proposed to use the bored cast-in-place pile group pile foundation with a diameter of 2.5 m (Figure 1). The corresponding loads used for calculating bank slope stability under different bridge layout schemes are listed in Table 3.
The geomorphic type of the bridge area is alpine canyon topography (Figure 2). The elevation of the crossing section in the bridge site area is 1300~1710 m. The terrain is undulating and there is strong seismic activity in the area.

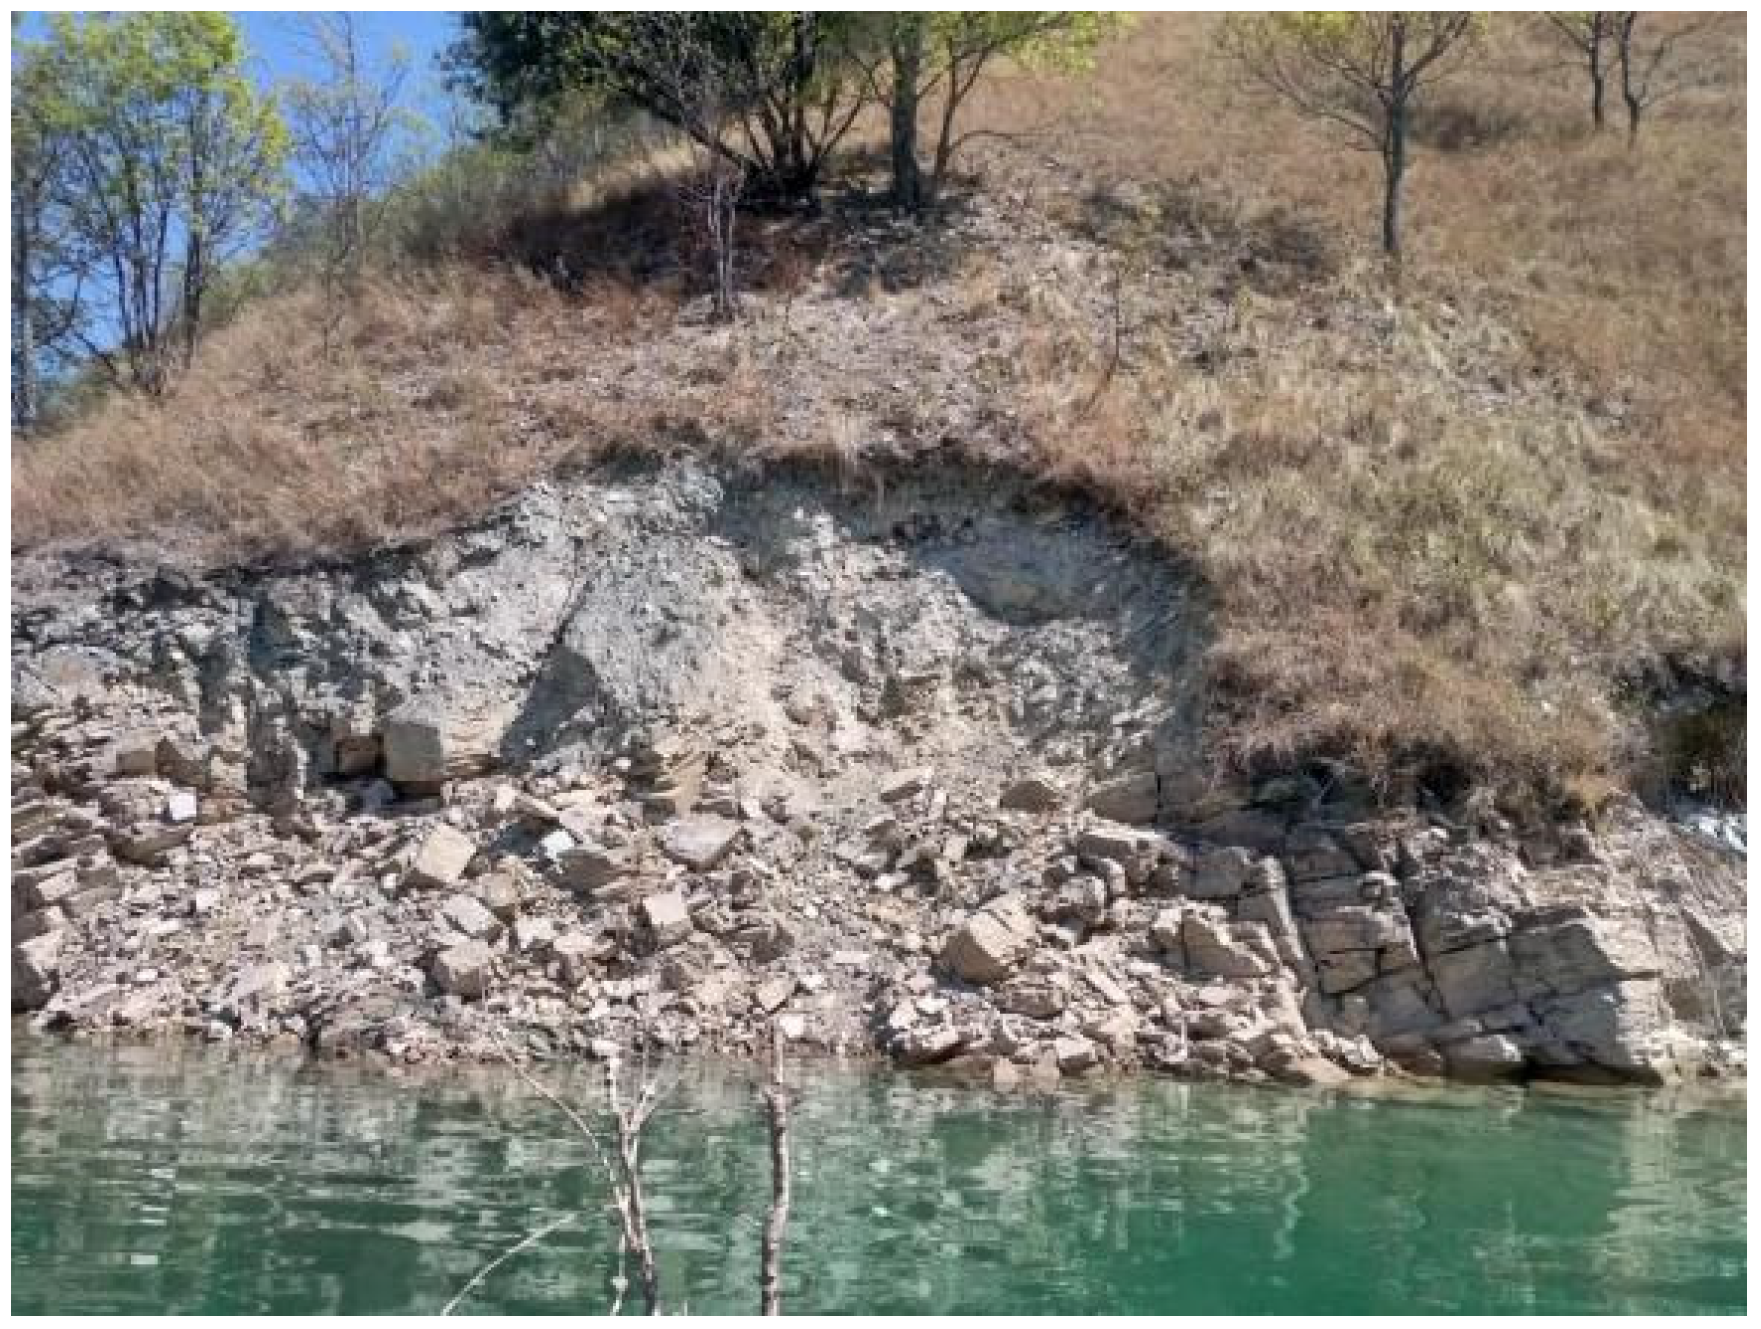
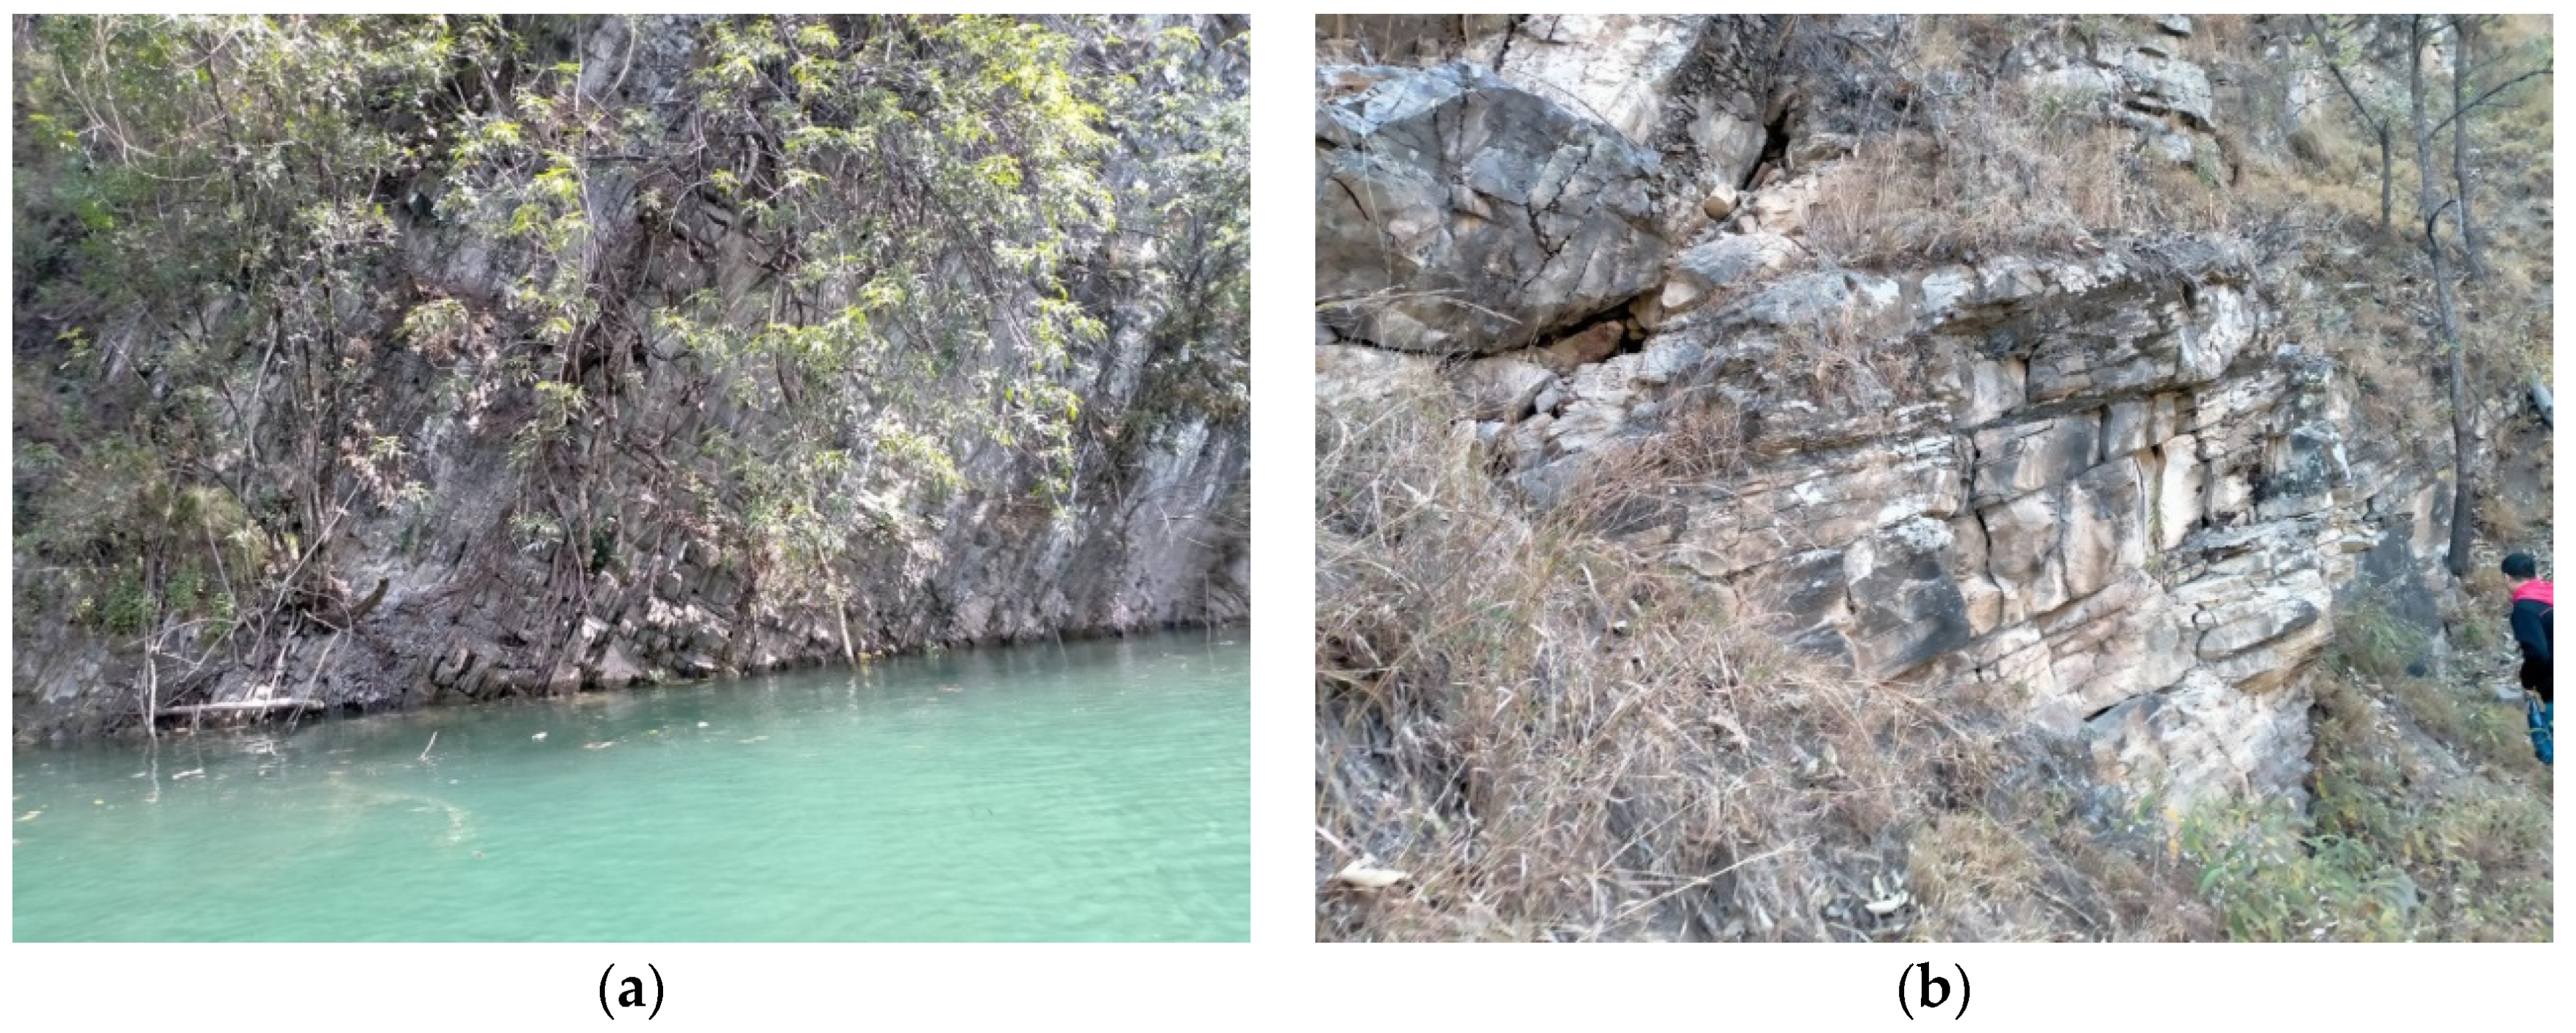
2.2. Engineering Geological Characteristics of the Research Area

2.2.1. Lithology

According to geological survey, the lithology of the stratum in the bridge site area is distribution from top to bottom as follows: Quaternary eluvial, deluvial, and colluvial silty clay, gravelly soil, fault gouge, fault breccia, cataclasite caused by the fault zone structure, slate with sandstone in the Cretaceous Jingxing Formation, etc. The distribution of strata on both sides of the bank slopes is relatively continuous, and the lithology is relatively single. The rock layers are inclined towards the slope, and the fractured zones (rock debris mixed with crushed stones) and joint fissures within the rock mass are relatively developed (Figure 3 and Figure 4). The drilling core exposed strata are strongly unloading slate with sandstone, with a rock occurrence of 80° ∠ 19–72°.

2.2.2. Hydrogeological Conditions

Before the impoundment of the Miaowei Hydropower Station, the Lancang River served as the lowest discharge reference level for surface water and groundwater on the bank slope of the bridge site. Groundwater varied greatly with the seasons and was mainly replenished by atmospheric precipitation. Groundwater was ultimately discharged into the Lancang River. After the impoundment of Miaowei Hydropower Station, the water level in the reservoir is higher than the groundwater level on both bank slopes. The groundwater level inside the bank slope is mainly supplied by the reservoir water, followed by atmospheric precipitation infiltration.
Groundwater types are divided into porous and fractured groundwater based on burial conditions and storage media. Pore water is present in the Quaternary loose layer, while fractured groundwater is present in the fractures and structural zones of rock masses.
(1)
Pore phreatic water
Distributed in the residual slope, colluvial slope, and alluvial and proluvial layers on both sides of the riverbed, pore phreatic water varies significantly with the season, with abundant water content in the rainy season and dry season.
(2)
Fissured phreatic water
The groundwater in the bridge site area is replenished by the infiltration of reservoir water and atmospheric precipitation. The exploration of the bank slope revealed that the groundwater level inside the bank slope is at the same level as the water level of the Lancang River Miaowei Hydropower Station reservoir, ranging from approximately 1400 m to 1410 m. Affected by the periodic rise and fall of the reservoir water level, the groundwater on the bank slope also undergoes periodic fluctuations, with a range of 0–10 m. The area in front of the bank slope that connects with the reservoir water has a significant change, but gradually decreases towards the bank slope.

2.3. Numerical Simulation Method

In this paper, the finite differences software FLAC3D 6.0 is used to analyze the stress and strain of toppling slope under the coupling effect of bridge loads and reservoir water change, and the strength reduction method is used to determine the anti-sliding stability coefficient of slope.
According to the site’s geological investigation data, the main strata and geological structures are shown in Figure 2. The main layers were strongly weathered sandstone and strongly weathered slate mixed with sandstone, which were characterized by low strength and susceptible to bending deformation towards the airborne direction due to its own weight.
The rock mass model is set as an elastic-plastic Mohr–Coulomb model. For the boundary conditions, during the calculation, a fixed displacement boundary at the bottom is set to limit deformation at the bottom, the displacement boundary and stress boundary are set before and after the model, and the initial crustal stress, which is mainly generated by gravity, is set inside the model. The horizontal stress is taken as 0.5 times the vertical stress that is converted by gravity. The stress value increases linearly with depth.
According to the design of the bridge and the location of the bridge foundation, there was a bored cast-in-place pile group foundation with a diameter of 2.5 m. Therefore, the three-dimensional geometric modeling was established while the bridge loads was applied. Although the two schemes for bridge layout have different pier positions, the dimensions of the 3D geological model are the same. The starting point in the x-direction of the Yunlong side slope model area is 0 m, and the ending point is 735 m, which refers to the model with a length of 735 m; the starting point in the y-direction is 0 m, and the ending point is 289 m, which refers to the model with a length of 289 m; The starting point in the z-direction is 0 m, and the ending point is 567 m, which refers to the model with a length of 567 m. In the calculation, applying loads at the corresponding position of the bridge foundation on both banks, including the main pile position, the main pile auxiliary pile, the abutment auxiliary pile, and the abutment. Details of the model are shown in Figure 5.

3. Research Results

In order to understand the characteristics and determine the toppling deformation of the bank slope rock mass, a series of on-site investigation methods were adopted to explore the toppling deformation of the bank slope rock mass, aiming to provide relevant data and qualitative descriptions for the basic indicators of the toppling body. This article provides evidence for the determination of the deformation characteristics and degree of the collapsed body through on-site surveys, geological conditions revealed through drilling, and television images inside the hole.
The degree of fragmentation of the rock mass in the front of the bank slope along the bridge axis is more severe than that in the middle and rear. The rock mass near the river undergoes stronger unloading and toppling deformation, which can be clearly revealed by the cores drilled near the east bank and the television images inside the holes. As shown in Figure 6, the television images inside the holes reveal that the rock mass is extremely fragmented, with many cracks being open and hollow, and many cracks being steep inclined.

3.1. Distribution Law of the Toppling Deformation Degree

(1)
Basic indicators for grading the degree of toppling deformation
(1) Dip angle difference in rock strata
Based on the core revealed by drilling, the dip angles of rock layers at different depths were statistic, which plays an important role in determining toppling degree along the depth. The dip angles of rock layers are significantly different with different degrees of toppling. According to the differences in dip angle, the rock mass on the bank slope of the bridge site area can be divided into three major types: extremely strong (A), strong (B), and weak toppling (C). Among them, Class B, namely the strong toppling rock mass, can be divided into B1 (the upper section) and B2 (the lower section). The dip angle of Class A is α ≤ 40°, the dip angle of Class B1 is 40° < α ≤ 57°, the dip angle of Class B2 is 54° < α ≤ 68°, and the dip angle of Class C is 60° < α ≤ 78°.
(2) Maximum tension within the layer
Tensile cracks formed by tensile deformation is related to the maximum tension within the layer. Among the three types toppling rock masses, Class A has strong tensile deformation. The maximum tension cracks within the layer in Class A is generally more than 21 mm, while the maximum tensile cracks in Class B1, B2, and C are 9–24 mm, 6–18 mm, and 2–8 mm, respectively.
(3) Unit tension within the layer
The tensile deformation per unit length of rock mass within the layer (mm/m) is clearly controlled by the intensity of rock mass toppling deformation. According to the geological survey results, the soft rock combination, with a thin layer structure and highly developed bedding plane dislocations, mainly composed of slate, schist, and phyllite, generally exhibits plastic characteristics, which does not present significant tensile deformation even when toppling and rotated at a large angle. However, the combination of hard rocks mainly composed of quartzite sand slate and metamorphic sandstone can produce obvious tensile fractures under a small toppling and rotation angle condition.
(4) Unloading deformation of rock mass
The strong unloading rock mass is consistent with the extremely strong unloading fracture (Class A) and strong unloading fracture (Class B) rock masses, which indicates that the bottom boundary of the strong unloading deformation rock mass is generally located near the bottom boundary of Class B toppling rock mass. Similarly, the distribution range of weak unloading deformation is generally similar to that of Class C weak toppling rock mass.
(5) Weathering degree of rock mass
The distribution range of strongly weathered rock mass is close to that of extremely strong unloading fracture (Class A); the strongly toppling rock mass (Class B) is generally in the weakly weathered upper section; the weakly weathered rock mass (Class C) is generally located in the lower section of weak weathering. Sometimes, the strongly weathered rock mass also appears in Class B1 rock mass, the weakly weathered lower rock mass also appears in Class B2 rock mass.
(2)
Characteristics of toppling deformation of bank slope rock mass
According to the changes in the exposed rock mass on the bank slope of the bridge site area and the dip angle of the rock layers exposed by the drilling core, it is indicated that there are relatively complex toppling deformation rock masses distributed on the bank slope. During the geological history of the Lancang River valley being incised, the rock mass on the bank slope has undergone strong toppling deformation and weathering unloading, especially in the extremely strong toppling zone (Class A) and strong unloading zone where the quality of the rock mass is poor, which has a significant impact on the stability of the bank slope and is the main internal factor affecting the stability of the bank slope.
The toppling deformation of the rock mass on the bank slope is shown in Figure 7.
The investigation and analysis of the characteristics and development of the toppling deformation of the exposed rock mass on the bank slope of the bridge site area reveal that the toppling deformation of the rock mass is mainly of the toppling bending type. The toppling rock mass undergoes bending deformation with a great change in the inclination angle and curvature of the rock layer. There are obvious bending transition segments or intermittent tensile fractures outside the slope between the deformed rock mass and the original rock mass, and the toppling rock mass is mainly subjected to bending tensile fracture failure. According to the on-site geological survey, the rock mass on the bank slope of the bridge site area can be divided into three major types: extremely strong (A), strong (B), and weak toppling (C). The specific description of different degree of toppling deformation zones (Zones A, B, and C) on the bank slope in the bridge site area is shown in Table 4. The statistical analysis of the development depth of the toppling rock mass shows that:
(1)
The toppling deformation of both sides of the bridge site is relatively strong.
(2)
The extremely strong toppling deformation zone (Zone A) and the strong toppling deformation zone (Zone B) are both located within the strongly weathered zone, with a development depth equivalent to the depth of the strongly weathered zone; the weak toppling deformation zone (Zone C) is basically located within the moderately weathered zone, with slight deformation.
(3)
The extremely strong toppling deformation type A is located in the strong unloading zone, while the strong toppling deformation type B is located in the weak unloading zone.

3.2. Mechanism of Toppling Deformation under Bridge Loads

3.2.1. Stage Failure Mechanism of Toppling Deformation

With the varying degrees of toppling deformation, the interior of the rock mass exhibits different fracture forms, mechanical mechanisms, and characteristic deformation phenomena.
(1)
Intralayer shear dislocation of weakly toppled deformed rock masses in the early stage
In the early stage of the development of valley cutting and rock mass unloading toppling deformation, the nearly vertical thin or plate shaped rock mass begins to tilt towards the free direction in the form of a cantilever beam under the action of self-weight bending moment, and gradually develops from the shallow and superficial to the deep of the slope. Due to the highly developed interlayer dislocation zones caused by structural deformation within the rock mass (such structural planes are products of strong folding and deformation in the crustal rock mass, with a certain thickness and obvious argillization, and generally low shear strength), they are prone to inclined shear sliding along them (Figure 7a). This stage is still in the early stage of toppling deformation, and the tensile effect of the interlayer rock plate derived from the tilting slip dislocation of the toppling layer is weak, which does not have the basic stress conditions for producing interlayer tensile deformation. Therefore, macroscopic tensile fractures usually do not occur.
(2)
Intralayer tensile deformation of strongly toppled deformed rock masses
With the further development of toppling deformation, the shear action along interlayer dislocations, phyllites and other weak zones gradually intensifies, leading to a stronger tensile effect within the layer. The rock plates between the dislocations bear increasing tensile stress. When the gradually increasing tensile stress reaches or exceeds the tensile strength of the rock slab, accompanied by further mutual dislocation between the rock slabs, the rock slabs within the layer undergo tensile fracture or tensile deformation along the existing structural plane (Figure 8b).
(3)
Shear fracture of rock mass with strong toppling deformation
Due to the continuous and strong development of rock mass toppling, the bending moment acting on the rock slab also increases, and the shear action along weak rock zones such as interlayer dislocation and phyllite becomes very strong. In addition to continuing to bear tensile stress, the shear effect of interlayer rock slabs gradually increases. The form of fracture transforms into significant tensile shear fracture or dip slip shear displacement along existing gently inclined joints (Figure 8c), and continuous development inevitably leads to shear.
(4)
Breaking and tensile fractures of extremely strong toppled rock masses.
When the development of toppling deformation is extremely strong, the bending deformation angle of the rock layer was large, the toppling bending moment acting on the rock plate further accumulates and increases. Once the bending strength of the rock plate is reached, the rock mass undergoes transverse cutting of the rock plate and tends to break and fracture outside the slope. The fracture zones formed within the rock mass have dual control characteristics, which, respectively, constitute the control structures of surface collapse, sliding, and deep dip slip deformation.

3.2.2. Bank Slope Failure Process under the Action of Bridge Loads

There are closure and opening states of the joints under force action. When the compressive stress pa perpendicular to the joint surface is less than or equal to 0, the joint opens. In this state, there is no elastic stiffness on the joint surface, only normal strain. When the joint surface compressive stress p a > 0, the joint fissure is closed. The sliding friction failure of the joint meets the following requirements:
f a = τ a p a tan φ a c a
where τ a is the component of shear stress on the joint surface, p a is the vertical pressure acting on the joint surface, φ a is the internal friction angle of the joint system, and ca is the cohesive force. The calculation considers the influence of bedrock bedding and vertical joints.
The bridge load causes the stress concentration of the bedrock at the bottom of the tower basement. During the strength reduction process, the plastic zone at the tower basement is connected and developing towards to the toe of the slope, forming a local damage zone, which is adverse to the stability of the bank slope.

3.2.3. Aggravated Toppling Deformation under Bridge Loads

For layered rock masses, the deformation caused by external load can be divided into the following three types:
Longitudinal bending: The rock layer undergoes bending under external forces parallel to the rock surface.
Transverse bending: The rock layer undergoes bending under external forces perpendicular to the rock surface.
Shear superposition: The rock layer undergoes differential sliding failure along a series of dense cleavages that are not parallel to the bedding plane.
Based on the structural characteristics of the collapsed deformed rock mass, the deformation trend under external loads can be predicted using the deformation calculation methods of equal thickness beams, trapezoidal beams, short cantilever beams, and composite plates.
The bending deformation which occurs in both the near-surface and engineering rock masses exhibits certain plastic and ductile deformation characteristics, accompanied by brittle fracture. According to the stress conditions, it can be divided into two types: transverse bending and longitudinal bending. There are three types of curved plate beams, named simply supported beams, extended beams, and cantilever beam bending. The load of the bridge acts on the rock layer that has undergone toppling deformation, similarly to the deformation and failure of the rock mass under transverse bending conditions.
On-site observations and simulation research have shown that the evolution process of bending deformation and failure of rock masses under lateral forces has obvious stage characteristics. The results of elastic-plastic finite element simulation are represented by equivalent (uniaxial) stress [σ] to represent the stress state inside the plate, which is equivalent to the three-dimensional stress effect and is expressed as Equation (2):
σ = 1 2 [ σ 1 σ 3 2 + σ 3 σ 1 2 + ( σ 1 σ 2 ) 2 ]
When σ is equal to rock yield stress σ y , plastic failure has occurred. The self-weight stress field was considered in the simulation and assumed to be in a state of hydrostatic pressure, i.e., σ = 0.
The combined force of unloading stress caused by the external load and gravity acting on the reverse slope is nearly perpendicular to the rock layer surface, similarly to the transverse bending action (Figure 9). The result is that the rock layer can undergo a large range of deformation. When the dip angle of the rock layer and resultant force direction are the same as the inclination angle of gravity, the maximum lateral bending effect is generated, and the degree of toppling deformation of the rock layer is the strongest.
For the inverted slope, the typical characteristics of the development of toppling deformation are as follows:
(1)
Large deformation depth;
(2)
The degree of deformation near the outside of the slope is greater than that inside the slope;
(3)
Due to the influence of bending deformation, the distribution density of tension cracks perpendicular to the bedding plane is relatively high near the outer side of the slope.
Based on geometric, physical, and equilibrium relationships, a nonlinear bending equation for large deformation of beams can be established as Equation (3).
d d x E I d 3 w d x 3 + E I d w d x 2 d 3 d x 3 = p
where w is the deflection of the beam, x is the axial coordinate of the beam, EI is the bending stiffness of the beam, and P is the lateral force.
For the case of cantilever beams, the end conditions are:
x = 0         w = d w d x = 0 x = l         d 2 w d x 2 = d 3 w d x 3 = 0
Through the bending test results with different beam lengths, it can be seen that the bending deformation increases with the beam length under the same load, and the tangent stiffness increases with the deformation.
The deformation of the interbedding of soft and hard rock mass has the slip effect of the composite beam. Within the scope of elasticity, the displacement of any point on the cross section of the rock stratum combination conforms to the linear superposition principle, so it mainly has the following aspects: the longitudinal displacement of any point on the cross section of the rock stratum combination can be caused by the longitudinal displacement of the composite beam, the relative displacement caused by the relative rotation angle between the hard rock center point, and the soft rock center point caused by the interface slip; the longitudinal displacement caused by the bending deformation of soft and hard rock layers and the warping displacement caused by shear lag effect are combined.

3.3. Limit Equilibrium Analysis of Bank Slope Stability Considering Bridge Loads and Changes in Reservoir Water Level

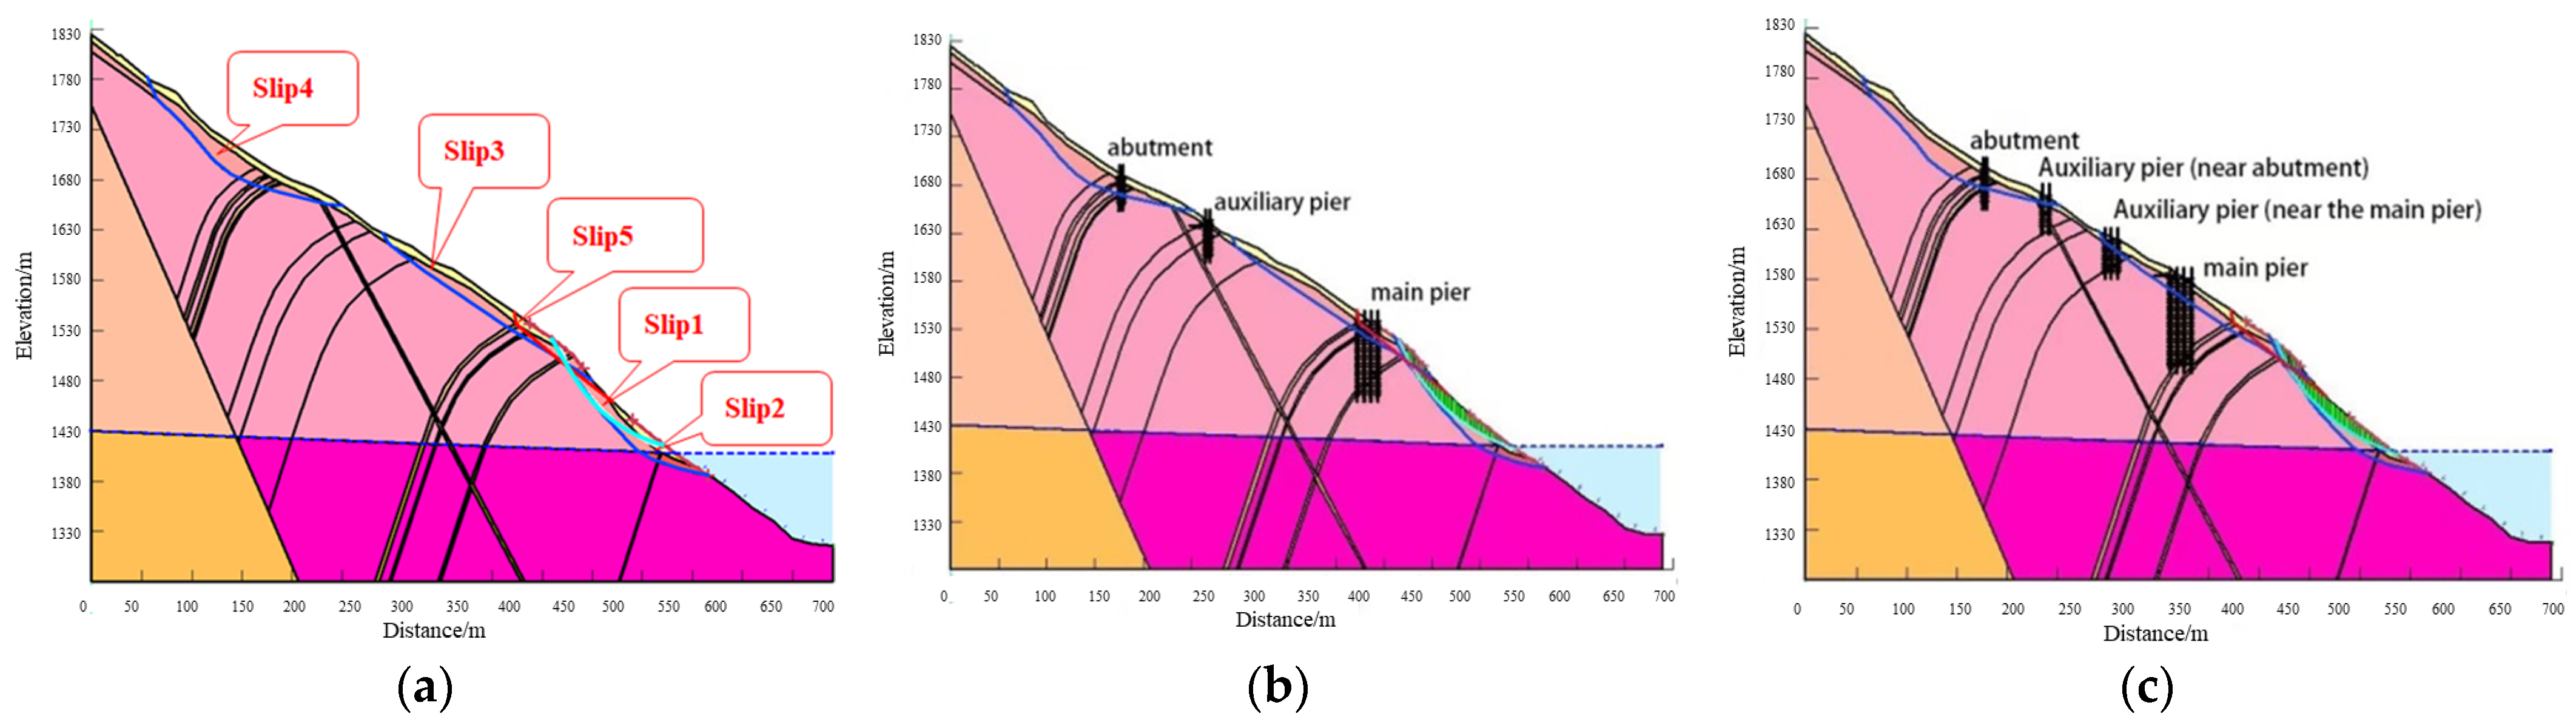
3.3.1. Failure Mode Analysis

Affected by the strong unloading and toppling deformation of the Lancang River bank slope, the dip angle from the surface layer of the slope changes from gentle to steep, with rock strata occurrence ranging from 26 to 136° ∠ 19 to 72°. The layer thickness is generally 0.1 to 0.44 m, and the surface layer is flat. The potential sliding surfaces should be located at the junction of strongly and moderately weathered rock masses and at the bottom boundary of the strong and weak unloading zones. In addition, there is a possibility of circular sliding failure occurring within the fractured rock mass in the strongly weathered area at the front of the Yunlong bank slope. There are a total of five potential slip surfaces (Slip 1~Slip 5) on the Yunlong side bank slope, among which Slip 1 refers to the circular sliding surface automatically searched at the front of the bank slope, and Slip 2~Slip 5 are polygonal slip surfaces. Due to the absence of a fully connected out-dip structural plane at the junction of strongly and moderately weathered rock masses, the potential sliding surface shape at the junction of strongly and moderately weathered areas will not be a polygonal line shape, but rather a stepped sliding surface.
The potential failure mode of the Yunlong side bank slope is shown in Figure 10.

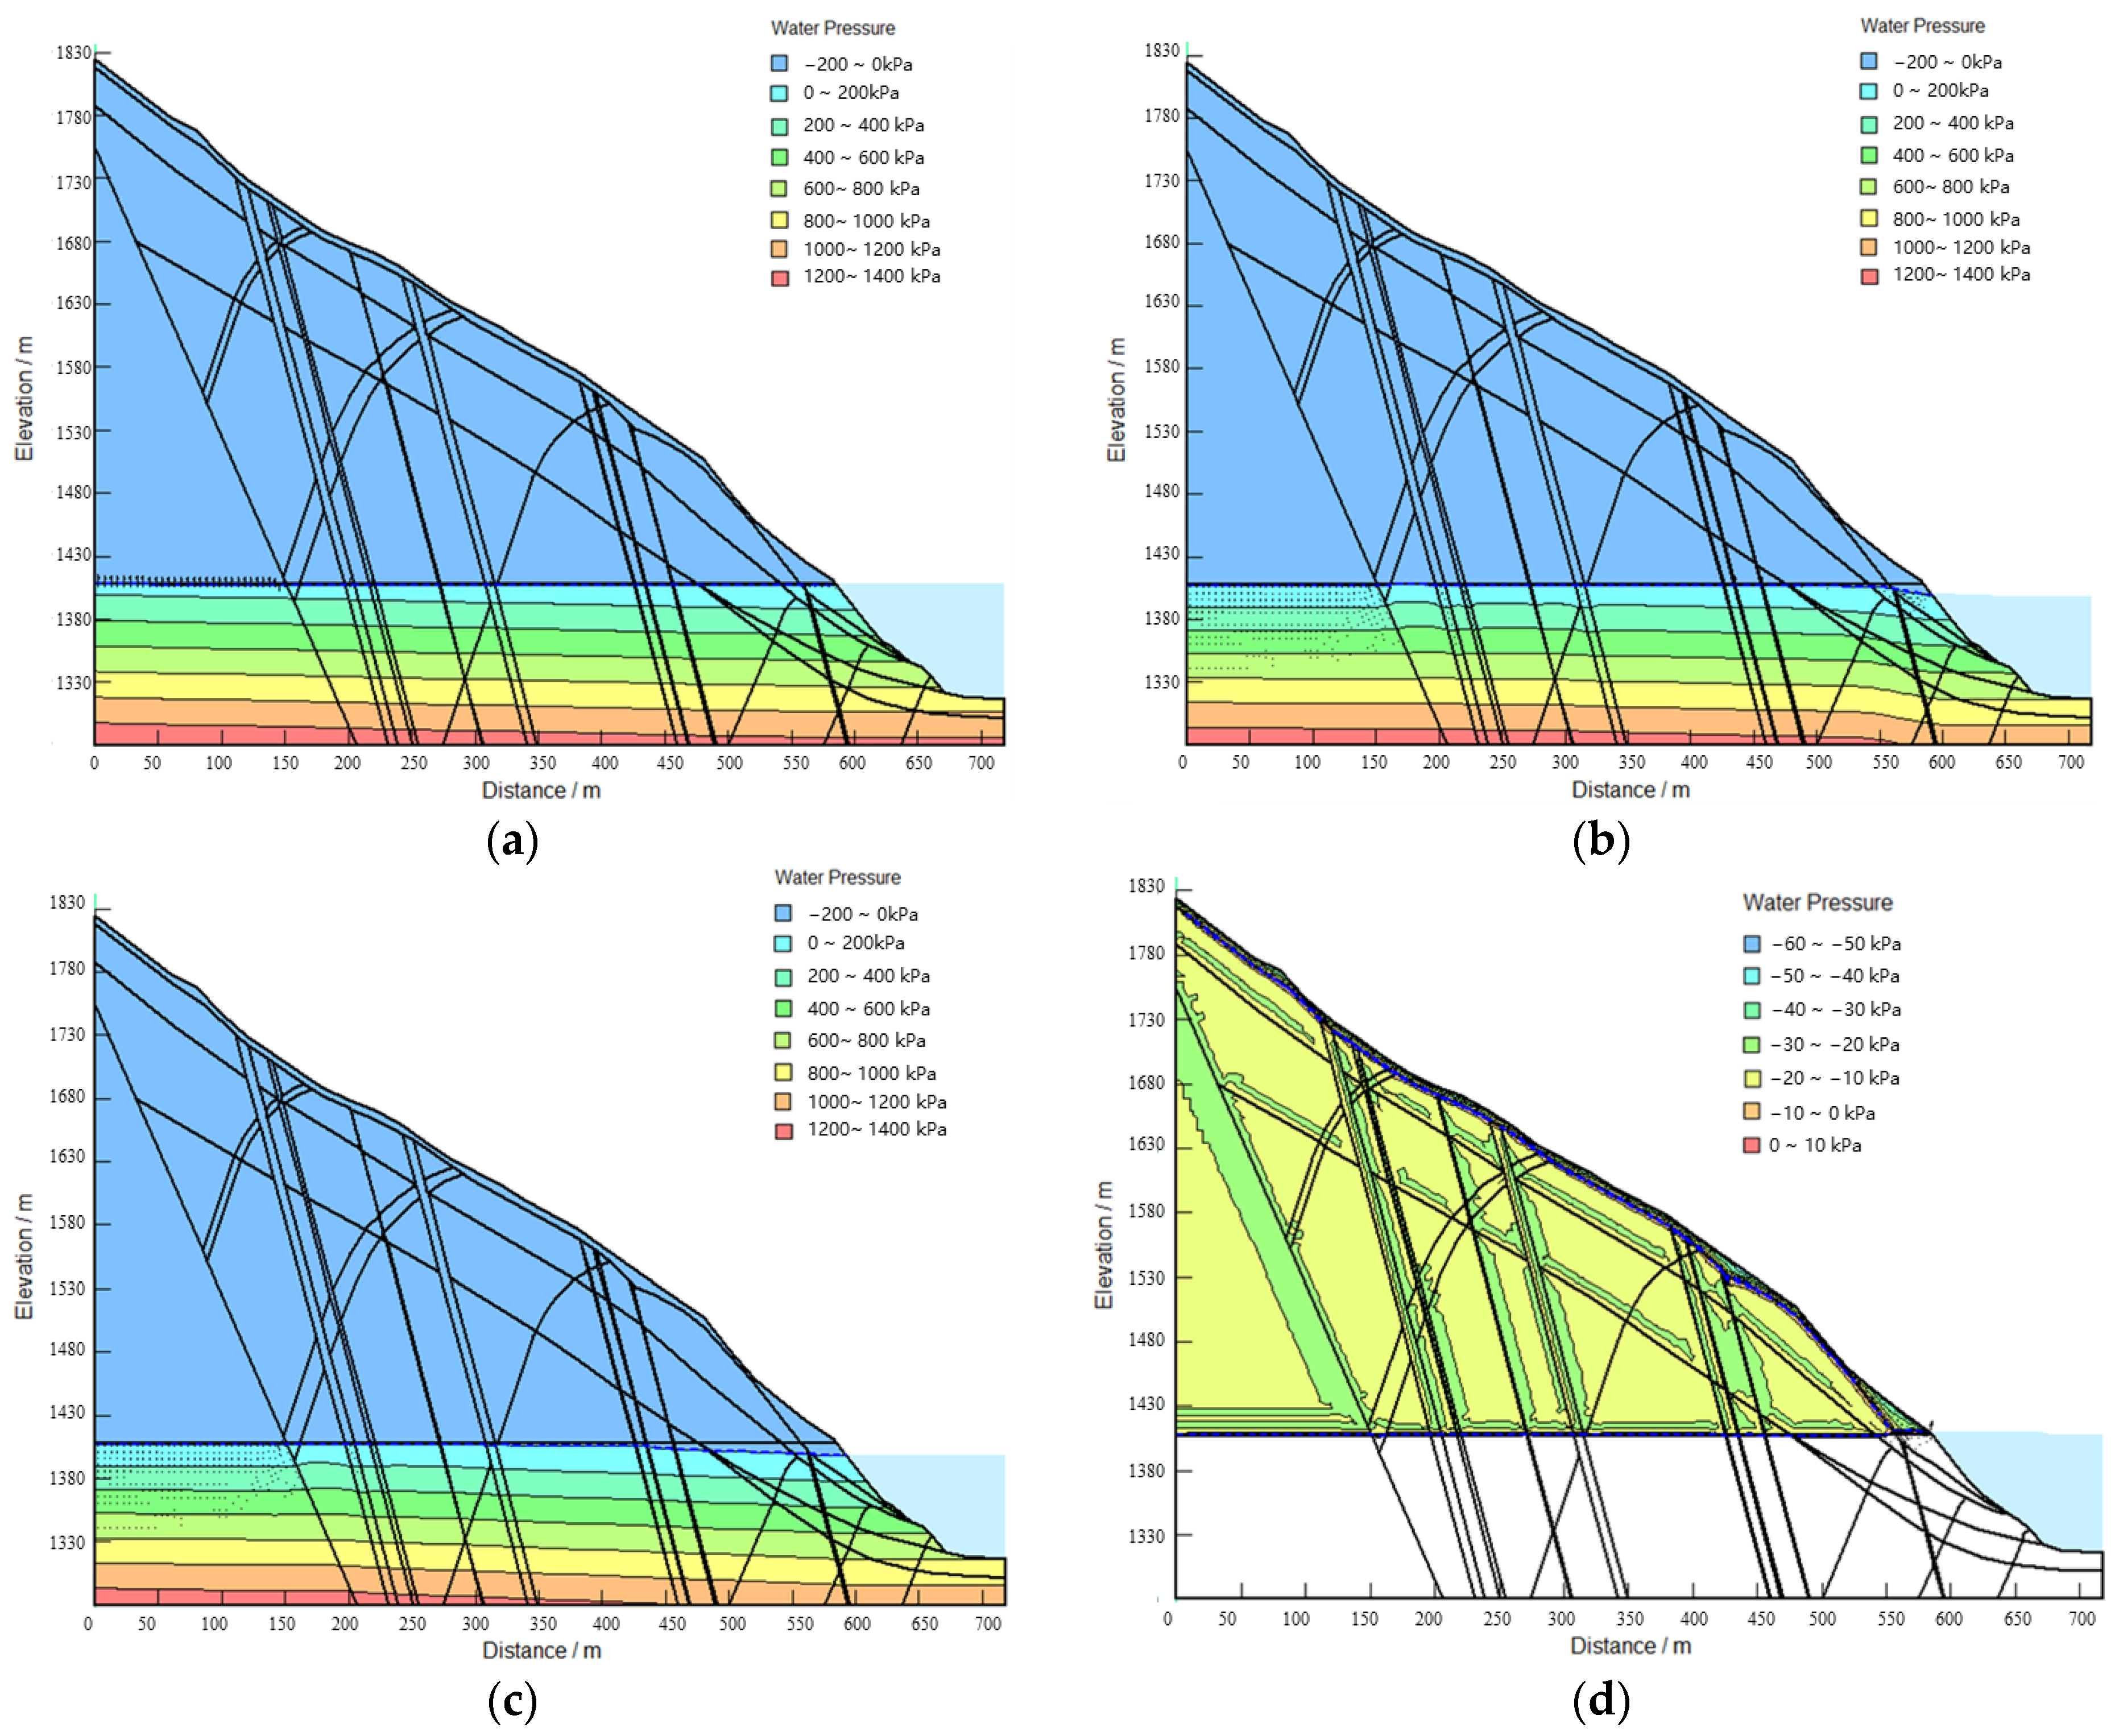
3.3.2. Characteristics of Seepage Field on Toppling Bank Slope under Reservoir Water Level Fluctuation and Rainfall Conditions

Using the SEEP/W program to simulate the seepage field of the bank slope body of Miaowei Hydropower Station Reservoir under the operation with different water levels and rainfall conditions. In the SEEP/W model, “saturated and unsaturated” model is selected for rock and soil mass, and the Van Genuchten model (VG model for short) is selected for unsaturated and hydraulics parameter estimation.
The water level of the reservoir suddenly dropped from the normal storage level of 1408 m to the dead water level of 1398 m at a speed of 3 m/d after about 3.3 days. Distribution characteristics of pore water pressure under the coupling effect of reservoir water level and rainfall in front of different bank slopes.
The rainfall condition can be divided into rainstorm and continuous rainfall: the rainfall intensity of the former is 124.85 mm/d (100 years period), and the duration of rainstorm is 5 d; the rainfall intensity of the latter (used for calculation) is 83.71 mm/d (once every ten years), and the continuous rainfall duration (used for calculation) is 15 d.
Due to the fact that the super-large bridge is located in the Lancang River basin, the development of a toppling deformation and the types of the rock and soil types of the bridge site are similar to the Miaowei Hydropower Station. Therefore, based on the on-site investigation results, this article selects the test parameters obtained from the rock mass test at the Miaowei Hydropower Station dam site, and quotes the appropriate hydraulics parameters of rock and soil mass for the different toppling areas of the bank slope on the bridge site area. The hydraulics parameters of the rock and soil mass on the bank slope are listed in Table 5.
The negative pore water pressure of the rock and soil above the groundwater level in the bank slope is set at −20 kPa.
After calculation, the distribution of pore water pressure inside the slope under various working conditions on the Yunlong bank slopes is shown in Figure 11.
Under rainstorm or continuous rainfall conditions, the pore water pressure below the groundwater level increases proportionally with the increase in depth, and the pore water pressure value is large.
According to the seepage calculation results under the above five consecutive days of rainstorm conditions, the following can be seen: (1) During the rainstorm period, the water content in the gravelly soil of the overburden layer continues to increase with the rainfall infiltration. By the end of the fifth day, the rainfall infiltration will form a local, small range of saturated positive pressure zone at the junction of the Quaternary overburden layer and the rock stratum in Area A. The overburden layer is basically still in a negative pressure state, but the water content has increased significantly compared with that before the rainfall. (2) After the rainfall stops, the water in the upper part of the cover layer continues to conduct downward and inclined towards the slope. By the 9th and 10th days, the saturated zone at the junction of the Quaternary cover layer and the rock layers in Zone A is basically connected, and a saturated positive pressure zone is formed in the local area at the top of the rock layers in Zone A. (3) The rainstorm for 5 consecutive days will form a backwater in the groundwater level in the slope body near the water in the front of the slope, and the water level will rise by 2~2.6 m.
The seepage calculation results under the continuous rainfall condition are slightly different from those under the rainstorm condition. The seepage characteristics are as follows: during the continuous rainfall period, with the rainfall infiltration, the water content in the gravelly soil of the overburden layer continues to increase. By the end of the seventh day, the rainfall infiltration will form a local, small range of saturated positive pressure zones at the junction of the Quaternary overburden layer and the rock stratum in Zone A, and the overburden layer is basically still in a negative pressure state, but the water content has increased significantly compared to before the rainfall. On the 9th day, the saturated area at the junction of the Quaternary cover layer and the rock layers in Zone A is basically connected. From the 13th day onwards, a sheet-like saturated positive pressure zone was continuously formed in the local area at the top of the rock layer in Zone A, but the scope and saturation depth were limited. After the end of continuous rainfall, the groundwater level in the near water section of the front of the slope will form a backwater, and the water level line will rise up to 2–3.6 m.
By comparing the infiltration of rainstorm for 5 days with that of continuous rainfall for 15 days, in both cases, an overall saturation will not form in the Quaternary overburden on the slope surface. The saturation area is mainly distributed in the junction area between the overburden and the rock stratum in Zone A. The saturation area formed in the slope under the continuous rainfall condition is slightly larger than that under the rainstorm condition.

3.3.3. Calculation Parameters

The parameters of the rock and soil in the topppling deformation area of the bridge site also refer to the parameters obtained from the rock mass test at the Miaowei Hydropower Station dam site. The physical and mechanical parameters of different toppling areas are listed in Table 6.

3.3.4. Analysis of Calculation Results
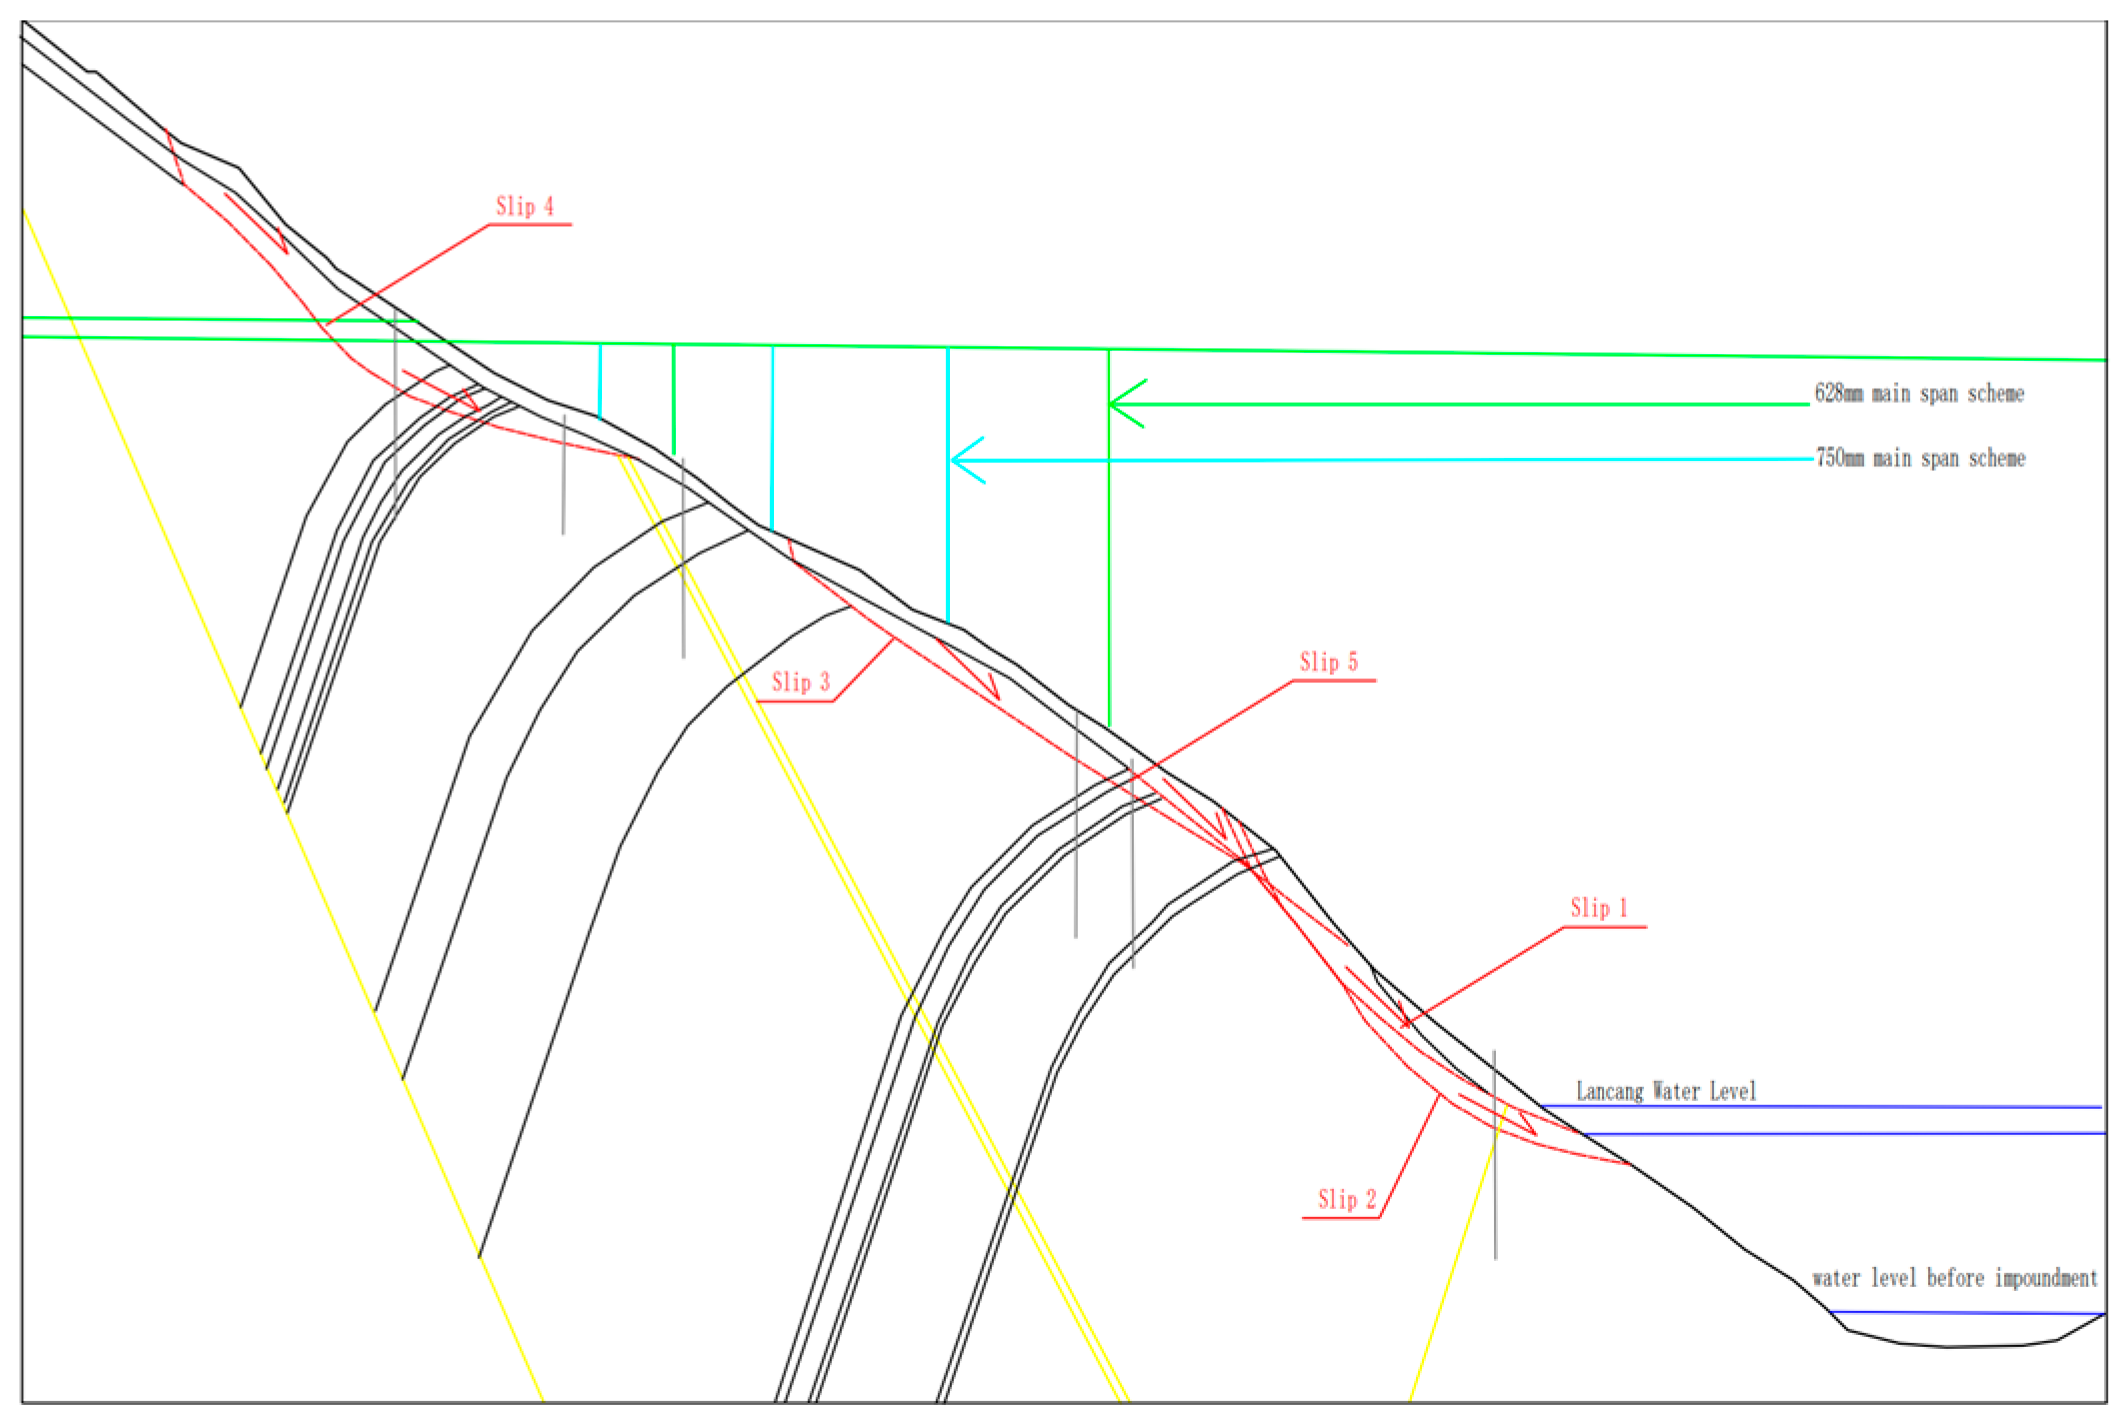
Using the two-dimensional rigid body limit equilibrium stability calculation method (broken-line sliding surface transfer coefficient method, and circular sliding surface simplified Bishop method) to calculate the stability of the bank slope at the Lancang River Extra-Large Bridge area. The methods were used to analyze the toppling slope stability under bridge loads in different schemes. The calculation model for bank slope stability is illustrated in Figure 12.
The calculation results and evaluation of the stability of the Yunlong bank slope calculated via the two-dimensional limit equilibrium analysis method under various working conditions are detailed in Table 7, and the calculation results of bank slope stability are shown in Figure 13.
From the two-dimensional limit equilibrium analysis results, with regard to the stability character of the Yunlong bank slope, the following can be concluded:
(1)
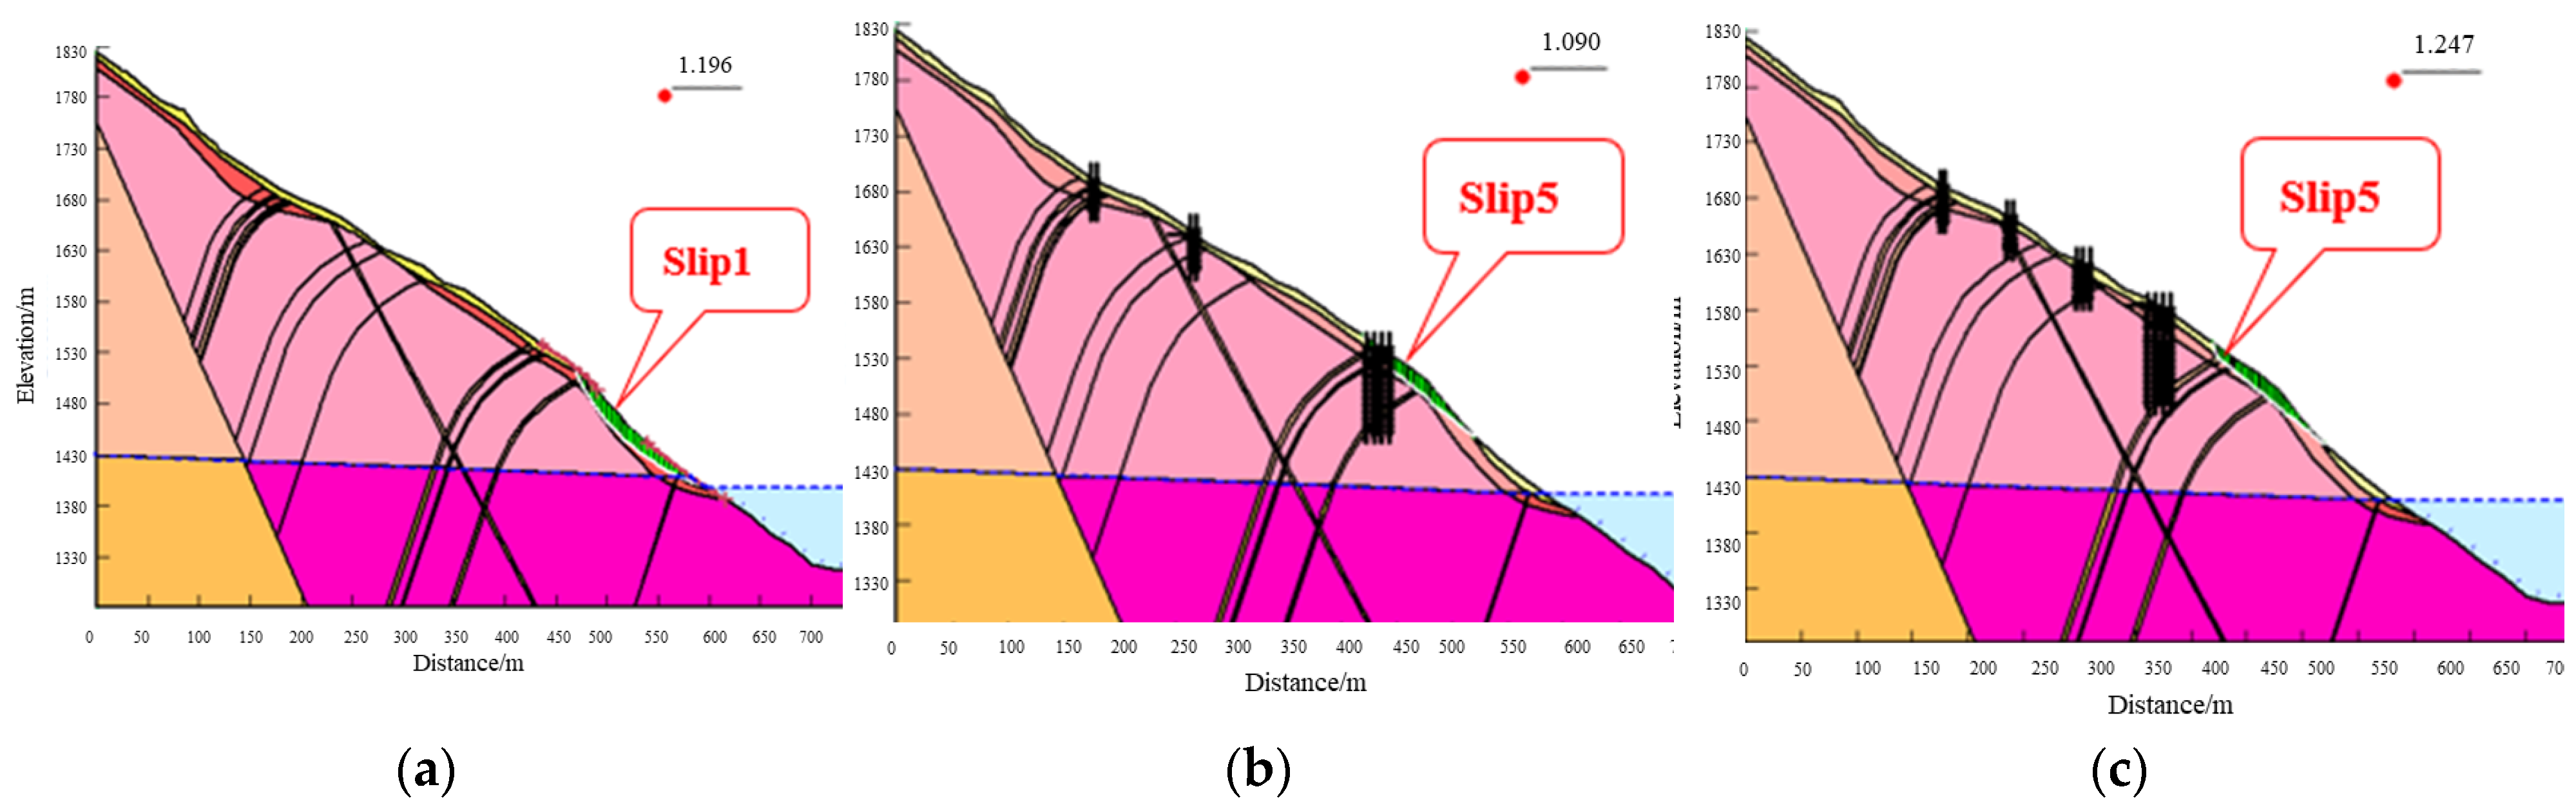
The five potential sliding bodies (Slip 1~Slip 5) on the bank slope, except for Slip 5, are in a stable state under natural conditions, rainfall conditions, and rainfall + earthquake conditions, with stability coefficients (Fs) ranging from 1.163 to 1.639; Slip 5 is in a basically stable state under rainfall and earthquake conditions. This indicates that the quantitative calculation results of the stability of the current condition bank slope are consistent with the qualitative evaluation of the stability of the bank slope.
(2)
In scheme 1, with the loads of the 628 m span cable-stayed bridge acting on the toppling slope, the stability coefficients (Fs) of potential sliding bodies Slip 1~Slip 4 on the bank slope under natural conditions, rainfall conditions, and rainfall + earthquake conditions are in the range 1.163~1.624, which can meet the design safety factor requirements for each working condition. The stability coefficients (Fs) of Slip 5 under natural conditions, rainfall conditions, and rainfall + earthquake conditions are 1.090, 1.046, and 0.956, respectively, which does not meet the design safety factor. Especially under rainfall + earthquake conditions, the rock mass in the strong unloading zone will lose stability and incur damage, posing a threat to the safety of the bridge.
(3)
In scheme 2, with the loads of the 750 m span cable-stayed bridge acting on toppling slope, the stability coefficients (Fs) of the potential sliding bodies Slip 1~Slip 4 on the bank slope under natural conditions, rainfall conditions, and rainfall + earthquake conditions are in the range 1.163~1.624, which can meet the design safety factor requirements for each working condition. The stability coefficients (Fs) of Slip 5 under natural and rainfall conditions are 1.247 and 1.194, respectively, which cannot meet the design safety factor. However, the stability coefficient under rainfall + earthquake conditions is 1.115, which has a certain safety reserve.
(4)
Under the fluctuating water level conditions of the Miaowei Hydropower Station reservoir, different water storage conditions (normal water level, sudden drop of reservoir water level, and dead water level) have a significant impact on the stability of the potential sliding mass Slip 2 in the front of the bank slope, while the impact on the stability of Slip 1 is small. The three potential sliding masses Slip 3~Slip 5 in the middle and rear of the bank slope are located above the groundwater level and reservoir water level, and are not directly affected by the fluctuation of reservoir water level. For wading bank slopes, the trend of slope stability is Fsnormal water level > Fsdead water level > Fssudden drop in water level.
(5)
Under the three working conditions of natural, rainfall, and rainfall + earthquake, the trend of slope stability is Fsnatural > Fsrainfall > Fsrainfall+earthquake. Among the three working conditions, the seismic horizontal force under earthquake working condition has the worst effect on slope stability.
(6)
The excavation of pile foundation platforms and anchor slopes on the mountain side will affect the local stability of the slope, especially when excavating within the Quaternary cover layer. The stability coefficient of the Quaternary slope under natural conditions, rainfall conditions, and rainfall + earthquake conditions is less than the design safety coefficient, and the safety reserve is insufficient. Therefore, attention should be paid to the engineering protection of the Quaternary slope during the excavation of the upper slope. Although the overall stability of the upper slope can meet the requirements of the design safety factor, the stress release formed by slope excavation can cause deterioration of the physical and mechanical properties of the slope rock mass, which can cause local damage to the slope. Therefore, the overall engineering protection of the upper slope should be strengthened.

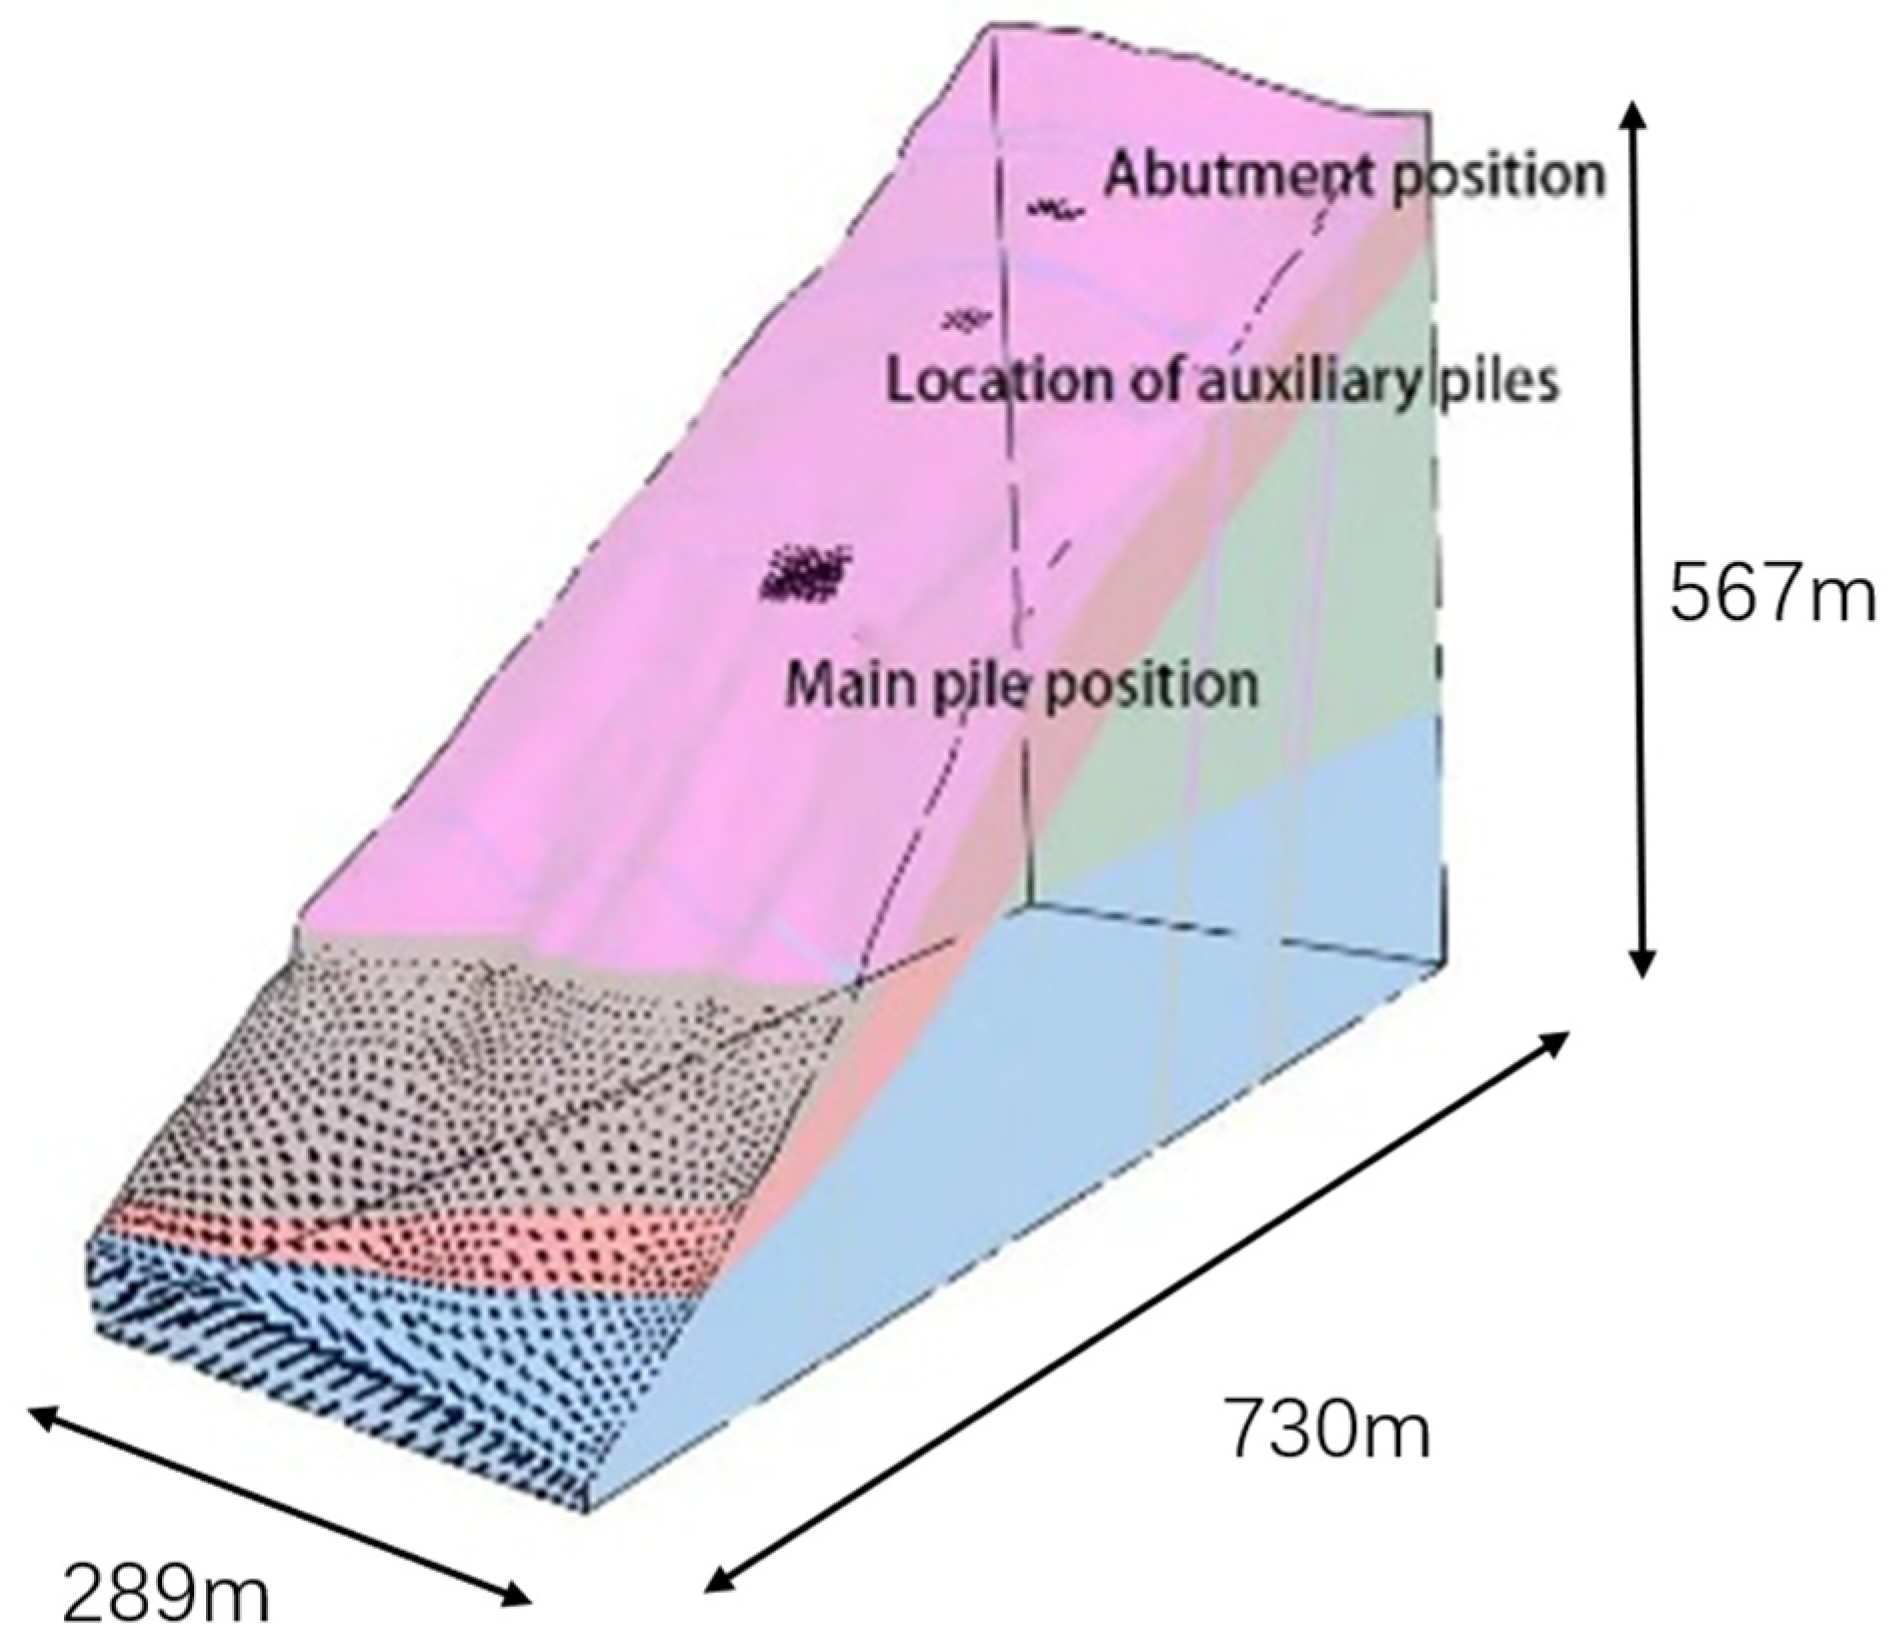
3.4. Three-Dimensional Numerical Analysis of Bank Slope under the Coupling Effect of Bridge Loads and Hydrodynamic Forces

In order to predict the stability of the bank slope under the synergistic effect of bridge loads and reservoir water level changes, this paper adopts a three-dimensional finite difference numerical simulation method to analyze the stress state and plastic zone distribution characteristics of the slope for two sets of bridge type schemes, and further determine the optimal scheme.

3.4.1. Three-Dimensional Geometric Modeling Establishment and Bridge Loads Application Mode

Scheme 1: The starting point in the x-direction of the Yunlong side slope model area is 0 m, and the ending point is 735 m, which refers to the model with a length of 735 m; The starting point in the y-direction is 0 m, and the ending point is 289 m, which refers to the model with a length of 289 m; The starting point in the z-direction is 0 m, and the ending point is 567 m, which refers to the model with a length of 567 m. In the calculation, applying loads at the corresponding position of the bridge foundation on both banks, including the main pile position, the main pile auxiliary pile, the abutment auxiliary pile, and the abutment. The selected load is the basic combination load of scheme 1, and the load application method on the Yunlong side bank slope is shown in Figure 14a.
Scheme 2: The length, width, and height of the 3D model in scheme 2 are consistent with scheme 1, while the difference between the two models is the loading position of the bridge foundation loads. The load application method on the Yunlong side bank slope is shown in Figure 14b.

3.4.2. Simulation of Groundwater Seepage Field under Reservoir Water Level Fluctuation

The calculation of seepage field adopts built-in seepage module of Flac3D, which simulates the changes in water level by setting the changes in pore water pressure. The rainfall intensity is 100 mm/d. In the seepage calculation, the permeability coefficient of Zone A is 0.0001 m/s. After setting the water level at the front edge of the slope to decrease by 10 m, convert the unit of permeability coefficient into minute permeability coefficient, calculate 2880 steps (i.e., water level decrease time is 48 h), and complete the simulation calculation of the seepage field. Among them, the small step of fluid time step set for calculation is 0.001 min. The results are illustrated in Figure 15.

3.4.3. Calculation Conditions and Parameters

Based on the actual situation, the most unfavorable operating conditions (i.e., sudden drop from 1408 m water level to 1398 m water level) were selected to establish the geological model, and the following three working conditions were selected for calculation.
(1)
working condition 1: Bridge operation + natural working conditions (sudden drop of water level from 1408 m to 1398 m).
(2)
working condition 2: Bridge operation + rainstorm condition (1408 m water level suddenly drops to 1398 m water level).
(3)
working condition 3: Bridge operation + earthquake + rainfall conditions (sudden drop of water level from 1408 m to 1398 m).
Based on on-site investigation and analysis, considering the rock layer information of the modeling area, the rock and soil types used for the stability calculation analysis of the Yunlong bank slopes mainly include: (1) extremely strong toppling and strongly weathered slate in Zone A; (2) strong toppling and strong weathering of slate in Zone B; (3) slightly weathered slate; (4) broken zone.
In order to ensure the accuracy and rationality of the three-dimensional finite difference simulation, the calculation parameters used for numerical simulation in this paper were referenced from similar slope analysis in the Miaowei Reservoir Area after adjustments and reductions, based on the geological information of the Bridge site, the rock mass test parameters of the Miaowei Hydropower Station dam site, and the toppling deformation situation obtained from the on-site investigation. The calculation parameters are listed in Table 8.

3.4.4. Calculation Results for Scheme 1
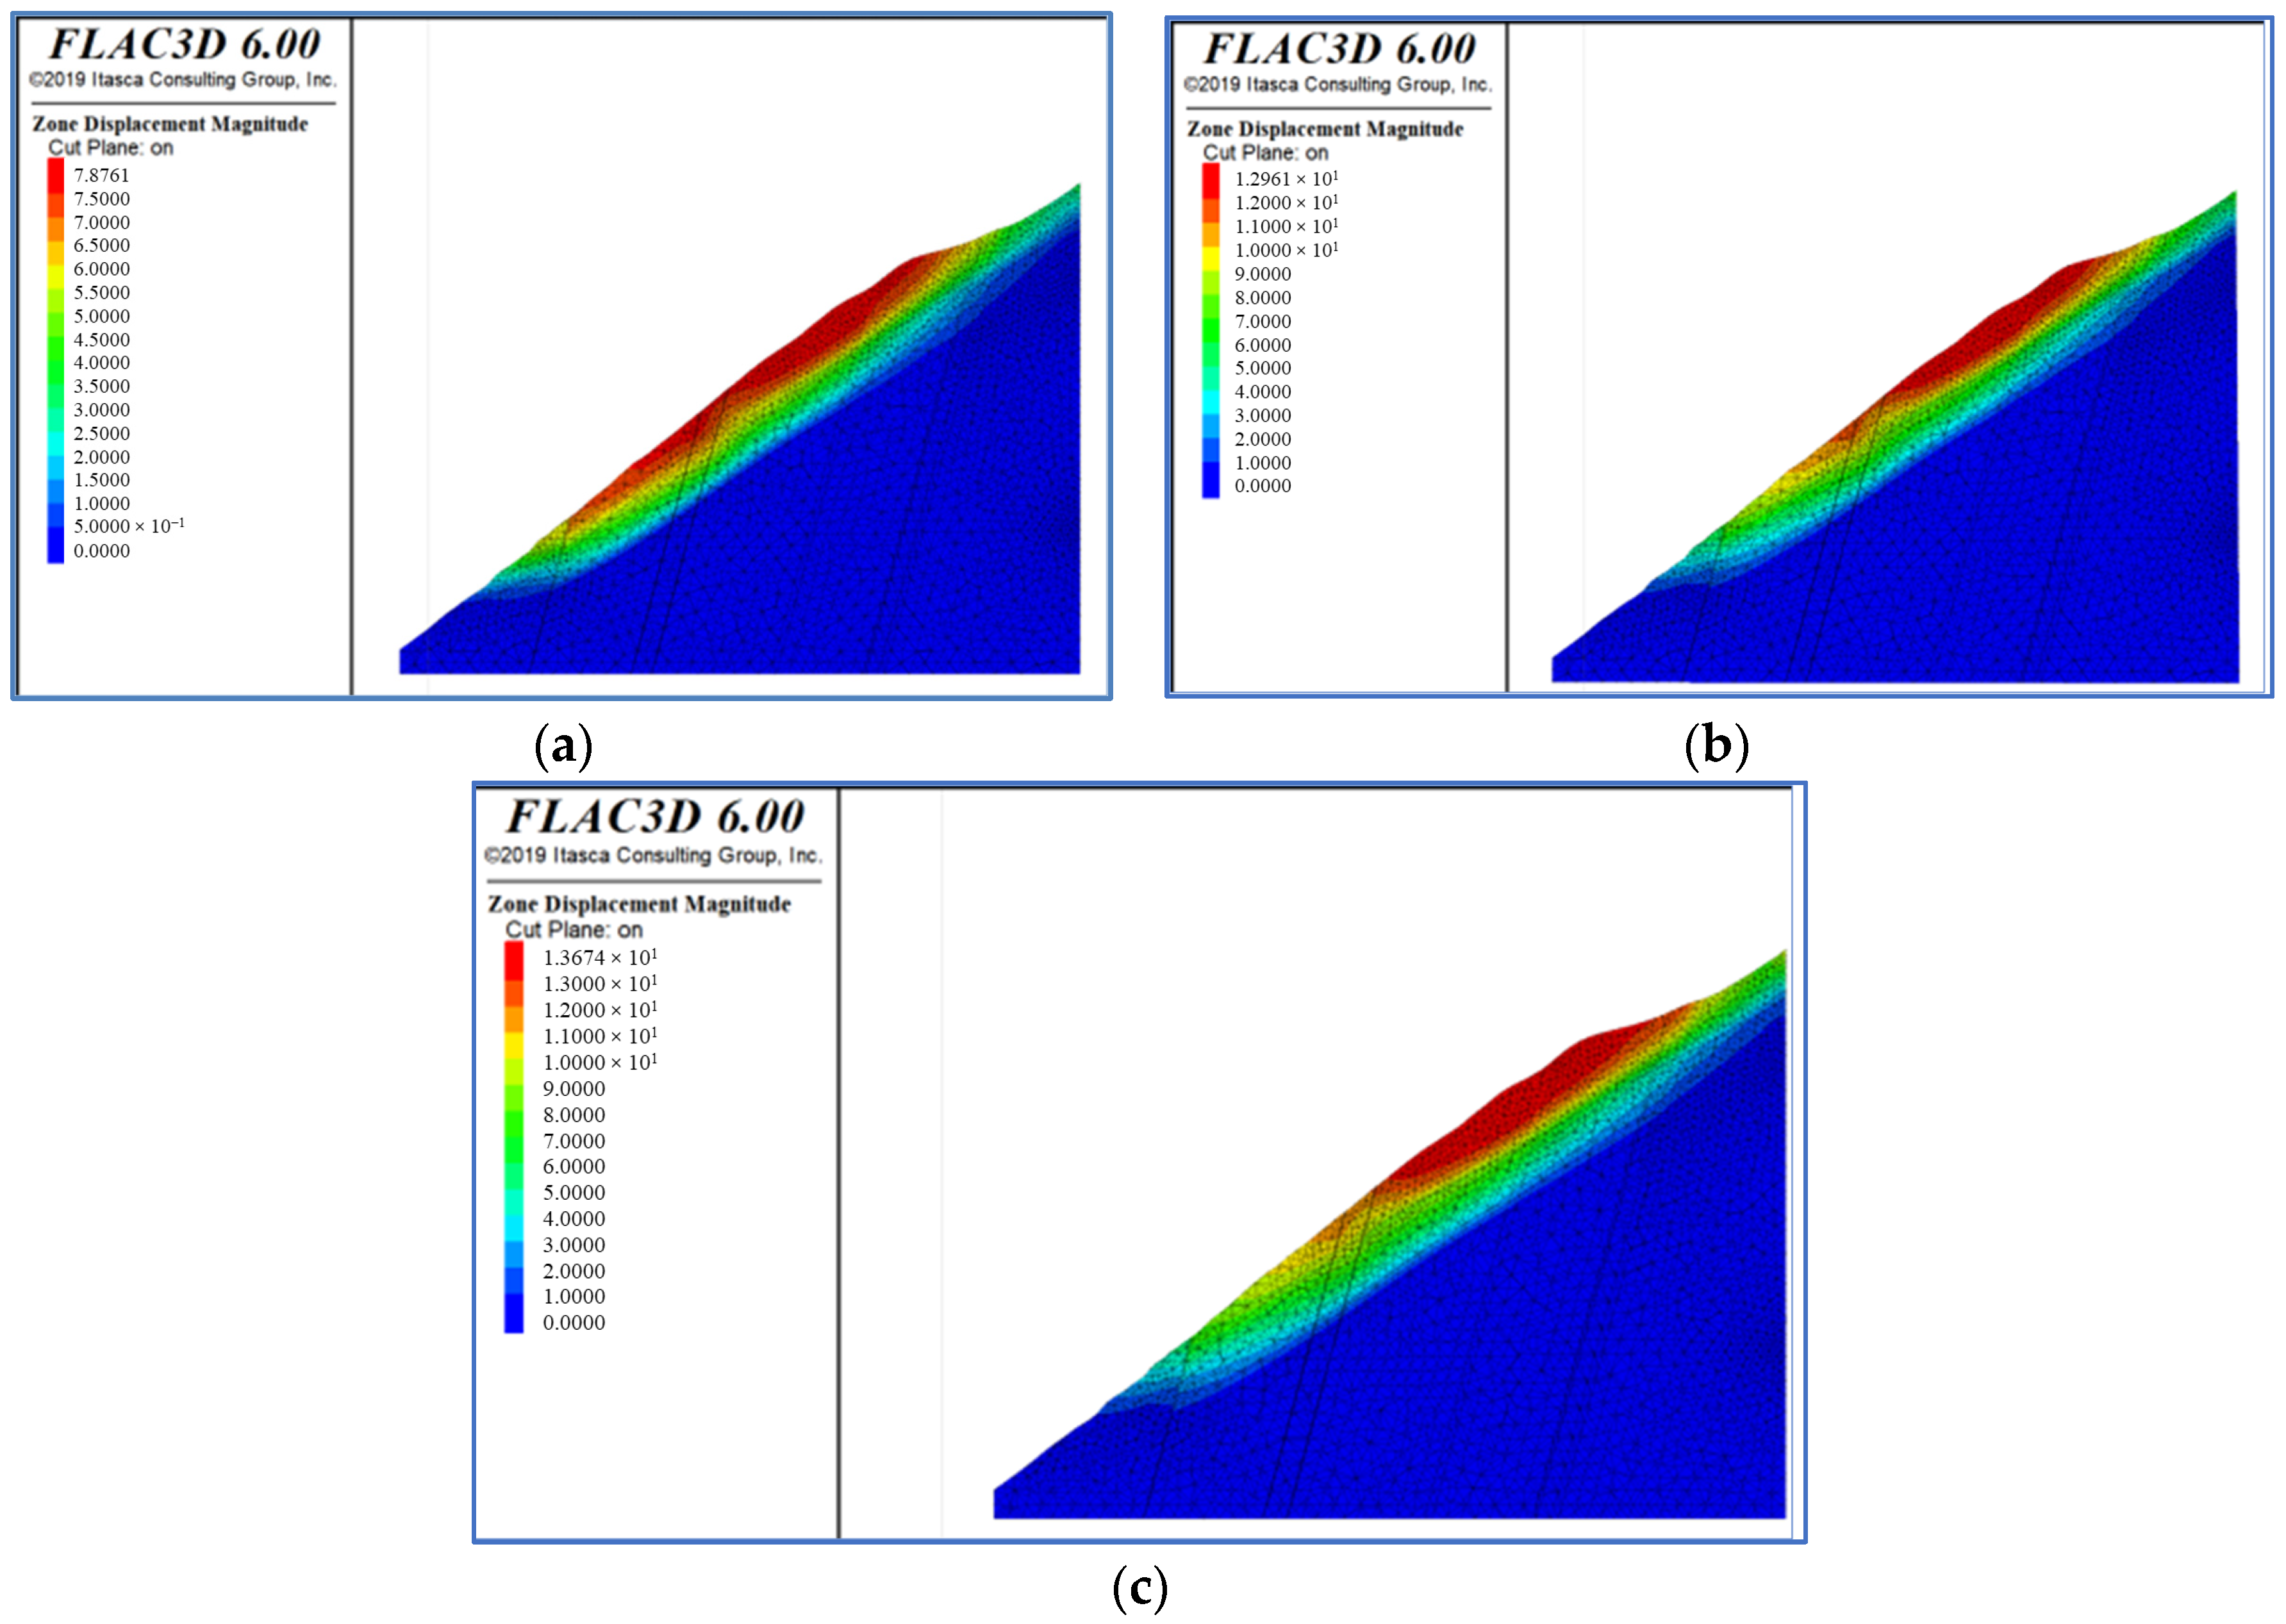
(1)
Total displacement characteristics under different working conditions
The displacement obtained by calculating stability is shown in Figure 15. For working condition 1, the maximum displacement is concentrated at the location where the main pile load is applied, and the main displacement is concentrated at the fracture zone at the elevations of 1570 m, 1550 m, and 1440 m (Figure 16a). For working condition 2, the main displacement is concentrated at the broken zone at the elevation of 1570 m, 1550 m and 1440 m (Figure 16b). For working condition 3, the maximum displacement is located behind the 1570 m elevation fracture zone and at the 1550 m elevation fracture zone where the main pile load is applied. There is also a significant displacement at the 1440 m elevation fracture zone at the leading edge (Figure 16c).
(2)
Plastic zone distribution under different working conditions
The maximum plastic area is located at the 1570 m elevation fracture zone, where a small amount of plastic deformation occurs for working condition 1 (Figure 17a). For working condition 2, a small amount of plastic zone is generated at the fracture zone at elevations of 1570 m, 1550 m, and 1440 m (Figure 17b). For working condition 3, plastic zone is generated in the 1430 m elevation fracture zone, 1550 m elevation fracture zone, and 1570 m elevation fracture zone (Figure 17c).
The stability coefficient of Yunlong side bank slope calculated by strength reduction is 1.55 for working condition 1 (1408 m water level suddenly drops to 1398 m water level). The displacement and plastic deformation area are mainly concentrated in the fracture zone at 1410 m elevation to the fracture zone at 1730 m elevation, the rear edge of the obtained sliding surface is the fracture zone at 1730 m elevation, the front edge is the fracture zone at 1410 m elevation, the rear edge is staggered along the fracture zone, and the front edge is cut out in an arc. Compared to the natural surface morphology, a plastic strain zone appears at the point where the load is applied to the main pile. The stability coefficient for working condition 2 (1408 m water level suddenly drops to 1398 m water level) is 1.44 and 1.28 for working condition 3.

3.4.5. Analysis of Calculation Results for Scheme 2

The stability coefficient of Yunlong side bank slope calculated by Strength reduction is 1.56 for working condition 1 (1408 m water level suddenly drops to 1398 m water level). The displacement and plastic deformation area of the instability zone are mainly concentrated in the fracture zone at 1410 m elevation to the fracture zone at 1730 m elevation, the rear edge of the obtained sliding surface is the fracture zone at 1730 m elevation, the front edge is the fracture zone at 1410 m elevation, the rear edge is staggered along the fracture zone, and the front edge is cut out in an arc. Compared to the natural surface morphology, a plastic strain zone appears at the point where the load is applied to the main pile. The stability coefficient is 1.47 and 1.31, respectively, for working condition 2 (1408 m water level suddenly drops to 1398 m water level) for working condition 3 (1408 m water level suddenly drops to 1398 m water level).

4. Discussion

4.1. The Stability of Toppling Bank Slope under the Action of Bridge Loads and Reservoir Water Level Change

The stability of the toppling deformation bank slope under the combined action of the bridge load and reservoir water level is controlled by the following three factors:
(1)
Deformation characteristics of toppled rock slope under bridge loads
Toppling deformation often leads to the unloading of tension cracks, which are a relatively special type of joint (Figure 18). When tension cracks occurred on the surface of the slope, shear failure in the rock mass has already begun. Under the pressure and lateral thrust generated by the bridge foundation load, the mechanical properties of the unloading crack may undergo significant changes. On the one hand, the unloading crack may cause significant displacement. On the other hand, the horizontal thrust may cause the unloading crack to topple or slide and fail. In addition to generating high stress concentration areas at the foot of the slope and the base, there is also a phenomenon of high stress concentration near the unloading crack. The maximum principal stress and shear stress on the slope surface in front of the foundation significantly increase due to the horizontal thrust of the normal stress on the unloading crack surface. When the unloading crack is at a certain angle with the slope surface, the stability is the worst. The existence of unloading cracks mainly changes the longitudinal mechanical behavior characteristics of the slope rock mass. Due to the fact that unloading cracks are generally in an open state, unloading cracks are equivalent to a secondary free boundary, with zero stress on the boundary. When subjected to the load transmitted by the bridge foundation, the stress in the rock mass near the base and unloading cracks increases significantly. Whether the rock mass can meet the strength requirements requires strength verification. The load action will cause stress concentration at the height of the unloading crack tip, and the anti-toppling stability of the rock mass cut by the unloading crack will decrease, which will have adverse effects on the stability of the rock mass (Figure 19).
(2)
Influence of reservoir water level fluctuation on the stability of toppling bank slope
The impact of changes in the reservoir water level on the stability of bank slopes is mainly reflected in the effect of dynamic water pressure inside the slope and the reduction in the strength of the toppling rock mass at the foot of the slope due to the dry–wet cycle of the underwater bank slope. The tensile cracks formed in the toppling body during the deformation process create favorable conditions for the infiltration of reservoir water into the slope. The groundwater level rapidly increases with the rise in the reservoir water level, leading to an increase in the pore water pressure and a decrease in the effective stress in the landslide resistance section, which results in a decrease in stability eventually. Landslides are prone to sliding and failure along the foundation interface evolved from the tilting fracture section (Figure 20).
(3)
The splitting effect of the reservoir water leads to an increase in the degree of toppling deformation of the rock mass at the foot of the slope
The high water head during the process of reservoir water level rise has a splitting effect on the existing tilting tension cracks. Groundwater permeability, as a mechanical force, directly affects the distribution of stress field in the rock mass on the crack surface. At the same time, changes in the rock mass stress field cause deformation of the cracks, which has adverse effects on the stability of the rock mass. The mechanical effects of groundwater on the fracture surface mainly include the normal seepage static water pressure and the tangential drag force, namely the seepage dynamic water pressure. The seepage static water pressure of a crack refers to the static water pressure acting in the normal direction of the crack surface, which is perpendicular to the crack wall surface. Hydrodynamic pressure refers to the reaction force of the fluid on the fracture surface that hinders its movement when it flows within the fracture, and its direction is consistent with the direction of the fracture water flow. For the toppling rock mass in the slope of the reservoir bank, tensile cracks are very developed. During the descending stage of the reservoir water, static and dynamic water pressures often form towards the outside of the slope, leading to the further increase in the width of tensile cracks and weakening of the structure of the rock mass.
The specific calculation formula is:
P 1 = γ w Δ H J
where P1 is the driving force of water flow; γ w is the unit weight of water; ΔH is the depth of water in the drawdown zone of the reservoir water level; and J is the hydraulic gradient.

4.2. Numerical Simulation Results of Bank Slope Stability via Strength Reduction Method

The bank slope stability calculated result by using three-dimensional finite difference method is listed in Table 9.
(1)
For schemes 1 and 2, the natural bank slope is in a stable state under the action of Miaowei reservoir operation (with a sudden drop in water level from 1408 m to 1398 m).
(2)
Under the load conditions of schemes 1 and 2, the stability coefficient of the bank slope under each working condition of bridge operation can meet the requirements of stability coefficient. The coefficient is greater than 1.30 under bridge operation + natural working condition, more than 1.20 under bridge operation + rainstorm working condition, and 1.10 under bridge operation + rainfall + earthquake working condition.
(3)
Under the load condition of scheme 1, the main area of potential instability of the Yunlong side slope on the east bank is located between the elevation of 1550 m and 1730 m, and is generally located in the middle and rear of the slope.
(4)
Under the load condition of scheme 2, the main area of potential instability of the Yunlong side slope is located between the elevation of 1532 m and 1730 m, and is generally located in the middle and rear of the slope.
(5)
The stability coefficient of the Yunlong side bank slope in scheme 1 is smaller than that in scheme 2. The load application location is a small inclined plane, so the stability coefficient of scheme 1 is greater than that of scheme 2.

4.3. Determination of Optimal Bridge Location

Considering that the bridge loads act on different parts of the toppling deformed rock mass, the toppling deformation degree caused by the transverse bending action is greater than the longitudinal bending action. Therefore, when the pile foundation of the bridge cushion cap is selected, the transverse bending effect should be avoided or reduced as far as possible. According to the analysis of the engineering geological conditions of the rock and soil mass of the bank slope, all potential sliding bodies of the bank slope are located in the strongly weathered rock mass area. The rock mass in the strongly weathered area is broken due to the geological forces such as the undercutting and fracture of the Lancang River, the movement of the folded tectonics, and the toppling deformation during the geological history. The closer it is to the Lancang River channel, especially in areas with raised terrain, the stronger the weathering and unloading of the rock mass, and the poorer the stability of the bank slope. From the perspective of engineering geological safety, the farther away the main pier of the bridge from the river, the safer it is.
According to the stability analysis results of the bank slope, the stability of the Yunlong side bank slope is mainly controlled by the potential sliding body Slip 5 of the strong unloading zone. If the potential sliding body Slip 5 of the Yunlong side bank slope experiences sliding failure, it will directly threaten the safety of the main pier of the bridge in scheme 1 (628 m span cable-stayed bridge). Therefore, it is necessary to carry out engineering pre-reinforcement treatment for scheme 1 bank slope. When selecting bridge scheme 2 (750 m span cable-stayed bridge), although the stability of the potential sliding body Slip 5 in the strong unloading zone of the Yunlong side bank slope does not meet the requirements of the design safety factor, the horizontal distance from the rear edge of the potential sliding body to the front edge of the Yunlong side main pier pile foundation cap is 36.0 m. After the sliding failure of the potential sliding body occurs, it will not affect the safety of the bridge main pier. It can be seen that bridge scheme 2 is safer than scheme 1 from the perspective of the results and analysis of the stability of the bank slope.
From the analysis the long-term effects of pre-reinforcement and engineering of the bank slope, it is recommended to adopt the frame beam + anchor cable as the pre-reinforcement measures to ensure that the stability of the bank slope is able to meet the requirements of the design safety factor. As the rock mass of the bank slope is mainly composed of sandy slate mixed with muddy slate and metamorphic sandstone, it belongs to relatively soft rock. The potential sliding mass Slip 5 on the Yunlong side of the bank slope is located in the strongly weathered rock area of the bank slope, with broken rock masses and developed joint fissures. The inclination of the rock mass is basically consistent with the installation angle of the anchor cable, and the relaxation of prestressed anchor cable will be more severe, which leads to the low long-term effect of the pre-reinforcement project. On the other hand, the construction of the frame beam + anchor cable project requires the removal of the loose cover layer on the slope surface and the leveling of the slope surface, which will cause damage to the vegetation ecology of the bank slope and is not conducive to the protection of the ecological environment in the reservoir area.
From the perspective of bridge construction conditions, the main and auxiliary piers of the Yunlong side bridge are located in the middle and upper part of the bank slope. By comparison, the farther away the bridge pier columns are from the Lancang River channel, the shorter the construction road needs to be, leading to better construction conditions. The construction conditions of the main pier in scheme 2 are superior to those in scheme 1.
Based on the analysis of various influencing factors such as rock and soil engineering geological conditions of the bank slope, bank slope stability, pre-reinforcement engineering of the bank slope and its long-term effects, bridge construction conditions, etc., the determination of the specific bridge type plan based on the advantages of the location of the main pier arrangement for the bridge in scheme 2, which means that scheme 2 is the safest and most suitable one, followed by scheme 1.

4.4. Limitations in Numerical Simulation

Although we have discussed the joint effects of bridge loads and hydrodynamic forces on the reservoir bank slope from both two-dimensional and three-dimensional perspectives, there are still some shortcomings in the relevant simulations:
(1)
The geological profile used in the two-dimensional simulation is only on the section where the bridge foundation is located, and the adjacent sections have not undergone a seepage field simulation, two-dimensional limit equilibrium analysis, or strength reduction calculation, so the accuracy of the three-dimensional simulation is verified using the calculation results of other sections.
(2)
In a 3D simulation, simulating the influence of bridge loads by using equivalent concentrated force without any solid elements of the bridge section may have a certain impact on the analysis results.
(3)
The failure mode of a toppling slope is influenced by numerous factors, and the scope of failure and sliding surface have certain uncertainties. The use of the strength reduction method may result in different slope stability analysis results, leading to significant differences between quantitative and qualitative analysis.
(4)
The design of the bridge body was not considered, the structural changes in the bridge were not simulated, and the impact of changes in pier position on the bridge design was not verified.

5. Conclusions

(1)
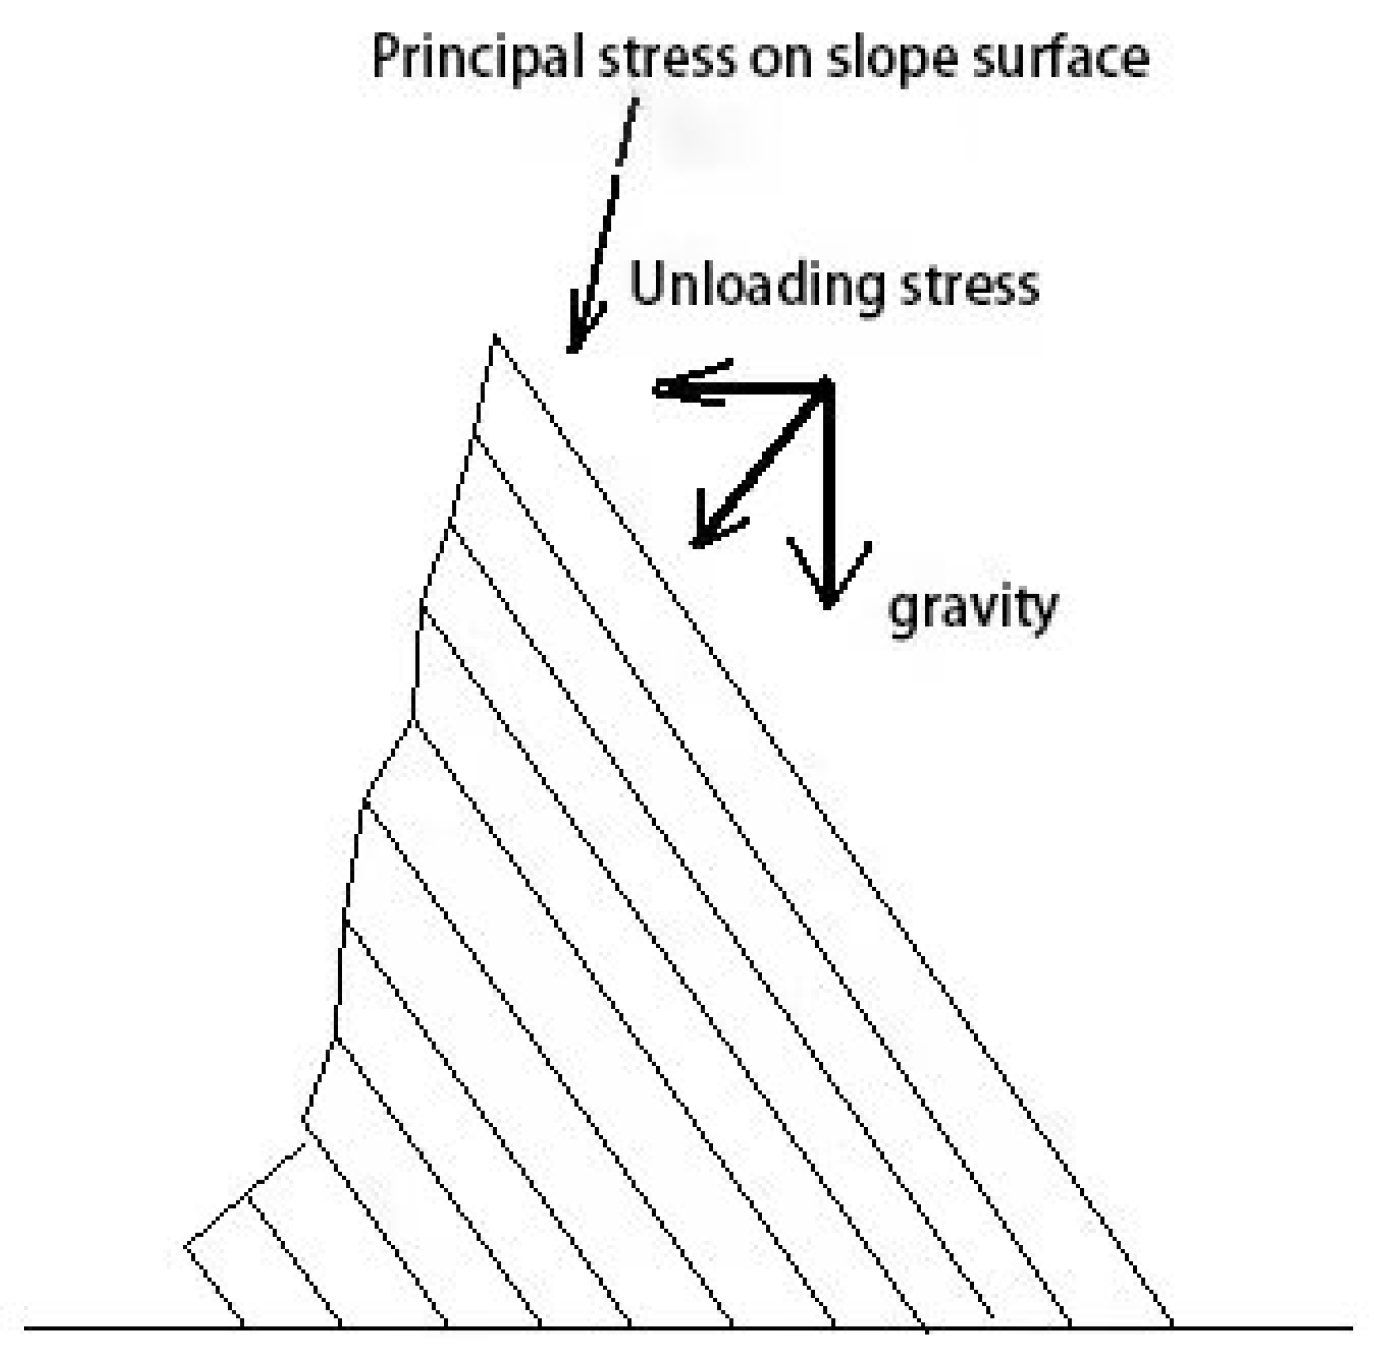
The formation of toppled and deformed rock masses in the reservoir area is mainly due to the rapid deepening of the valley under the action of regional tectonic stress, leading to the release of stress towards the free space direction, resulting in differential deformation between thin and interbedded rock layers. The damage caused by the process of reservoir impoundment to the toppling rock mass is mainly due to the crack splitting and softening effect of the reservoir impoundment at the foot of the slope. The foot of the slope loses support for the upper rock mass, causing the toppling rock mass above the reservoir water level to be subjected to gravity and transverse bending, transmitted upward through joint dislocation, rotation, and sliding, accelerating the speed of secondary toppling damage, and forming compressive shear failure along the tilting tensile cracks.
(2)
The shear failure zone below the water storage level is influenced by the saturation strength of different lithology, the distribution characteristics of different tilting tension fractures, and the permeability characteristics. Through the softening of water storage at the foot of the slope, fracturing of fracture water, and wave dynamics, it may lead to the continued development of toppling deformation. The horizontal depth of the failure surface is related to the depth of the collapsed deformation body, usually the sum of the wave-induced erosion zone and the horizontal softening and tilting zone at the water surface of the reservoir.
(3)
The degree of toppling deformation can be determined via the dip angle difference in rock strata, maximum tension within the layer, unit tension within the layer, unloading deformation of rock mass, and weathering degree of rock mass.
(4)
The strength reduction method is used to analyze the stability of the rock bank slope before and after the bridge load, and the influence of bridge loads on the shape and position of the bank slope sliding surface is obtained, creating a local failure zone at the bottom of the arch is detrimental to the stability of the bank slope.

Author Contributions

Conceptualization, Z.L. (Zhiqing Liu) and J.H.; methodology, F.Z. and C.L.; software, C.L.; validation, C.L., M.D. and Z.L. (Zinan Li); investigation, J.H. and S.T.; writing—review and editing, Z.L. (Zinan Li). All authors have read and agreed to the published version of the manuscript.

Funding

This study was supported by the Science Foundation of China Huaneng Group Co., Ltd. (20158101216).

Data Availability Statement

Data are contained within the article.

Acknowledgments

The authors express their sincere thanks to the anonymous reviewers and the editor for their invaluable help and guidance throughout this research.

Conflicts of Interest

Author Jian Huang, Shixiong Tang, Zhiqing Liu was employed by the company China Communications Highway Planning and Design Institute Co., Ltd. The remaining authors declare that the research was conducted in the absence of any commercial or financial relationships that could be construed as a potential conflict of interest.

References

  1. Chen, C.; Shih, B.-J.; Jeng, C.-J. Case study on performance monitoring and stability analysis of Baishihu suspension bridge and side slope. J. Civ. Eng. Manag. 2022, 28, 81–92. (In Chinese) [Google Scholar] [CrossRef]
  2. Jiang, T.-Z.; Zhang, G.-Z.; Jiang, L.-W. The bank slope stability evaluation of Jiagai River Bridge in Zhijin-Bijie Railway. J. Railw. Eng. Soc. 2014, 31, 46–49+113. (In Chinese) [Google Scholar]
  3. Yin, X.; Feng, Z.; Yan, F.; Wang, D.; Qin, Y. Safety estimation for the bedding slope of Huaping bank at Jinshajiang bridge in Huaping-Lijiang highway based on static model test. Yanshilixue Yu Gongcheng Xuebao/Chin. J. Rock Mech. Eng. 2017, 36, 1215–1226. (In Chinese) [Google Scholar] [CrossRef]
  4. Yu, H.; Peng, S.; Zhao, Q. Field Tests of the Response of Single Pile Subjected to Lateral Load in Gravel Soil Sloping Ground. Geotech. Geol. Eng. 2019, 37, 2659–2674. [Google Scholar] [CrossRef]
  5. Deendayal, R.; Muthukkumaran, K.; Sitharam, T.G. Analysis of laterally loaded group of piles located on sloping ground. Int. J. Geotech. Eng. 2020, 14, 580–588. [Google Scholar] [CrossRef]
  6. Sitharam, T.G.; Mantrala, S.; Verma, A.K. Analyses and design of the highly jointed slopes on the abutments of the world’s highest railway bridge across the chenab river in Jammu and Kashmir state. India Lect. Notes Civ. Eng. 2019, 29, 15–32. [Google Scholar] [CrossRef]
  7. Tian, H.-M.; Chen, W.-Z.; Zheng, P.-Q.; Yu, J.-X. Stablity analysis of rocky slope for arch bridge foundation in gorge area. Yantu Lixue/Rock Soil Mech. 2013, 34 (Suppl. S1), 379–385. (In Chinese) [Google Scholar]
  8. Souri, A.; Abu-Farsakh, M.; Voyiadjis, G. Study of static lateral behavior of battered pile group foundation at I-10 twin span bridge using 3d finite element modeling. Can. Geotech. J. 2015, 53, 962–973. [Google Scholar] [CrossRef]
  9. Abu-Farsakh, M.; Souri, A.; Voyiadjis, G.; Rosti, F. Comparison of static lateral behavior of three pile group configurations using three-dimensional finite element modeling. Can. Geotech. J. 2018, 55, 107–118. [Google Scholar] [CrossRef]
  10. Luo, W.H.; Liu, J.H.; Cao, W.G.; Zhao, M.H. Stress analysis on the pile-column bridge piers in rock slope. Highw. Eng. 2008, 33, 1–9. Available online: https://kns.cnki.net/kcms2/article/abstract?v=J0BDVs0XdL199x-4np_x331keQ8FXxwUN1uofGQixO33FOQyzMA6KGvw4n0AE8bzsi_XCkQ4ydhZVS1Efawf9XH75Ch5zhG4EE3b6vbcQVq6J3ueLwTzYKHzkeXVpehwtTRKjH3BYNU=&uniplatform=NZKPT&language=CHS (accessed on 20 February 2008). (In Chinese).
  11. Zhou, H.; Su, Q.; Liu, J.; Yue, F. Shaking table tests on bridge foundation reinforced by antislide piles on slope. Earthq. Res. China 2019, 33, 11. [Google Scholar] [CrossRef]
  12. Zhang, C.; Jiang, G.; Su, L.; Lei, D.; Liu, W.; Wang, Z. Large-scale shaking table model test on seismic performance of bridge-pile-foundation slope with anti-sliding piles: A case study. Bull. Eng. Geol. Environ. 2019, 79, 1429–1447. [Google Scholar] [CrossRef]
  13. Brideau, M.-A.; Stead, D. Controls on block toppling using a three-dimensional distinct element approach. Rock Mech. Rock Eng. 2009, 43, 241–260. [Google Scholar] [CrossRef]
  14. Pinheiro, A.L.; Lana, M.S.; Sobreira, F.G. Use of the distinct element method to study flexural toppling at the Pico Mine, Brazil. Bull. Eng. Geol. Environ. 2015, 74, 1177–1186. [Google Scholar] [CrossRef]
  15. Li, Z.; Wang, J.; Li, L.; Wang, L.; Liang, R.Y. A case study integrating numerical simulation and GB-InSAR monitoring to analyze flexural toppling of an anti-dip slope in Fushun open pit. Eng. Geol. 2015, 197, 20–32. [Google Scholar] [CrossRef]
  16. Lian, J.-J.; Li, Q.; Deng, X.-F.; Zhao, G.-F.; Chen, Z.-Y. A Numerical Study on Toppling Failure of a Jointed Rock Slope by Using the Distinct Lattice Spring Model. Rock Mech Rock Eng. 2017, 51, 513–530. [Google Scholar] [CrossRef]
  17. Ren, Z.H.; Chen, C.X.; Zheng, Y.; Sun, C.Y.; Yuan, J.H. Dynamic Analysis of the Seismo-Dynamic Response of Anti-Dip Bedding Rock Slopes Using a Three-Dimensional Discrete-Element Method. Appl. Sci. 2022, 12, 4640. [Google Scholar] [CrossRef]
  18. Hassan, S.; Alireza, B.; Reza, S. Numerical Modelling of Slide-Head-Toppling Failure using FEM and DEM Methods. J. Min. Environ. 2022, 13, 269–280. [Google Scholar]
  19. Liu, C.; Jaksa, M.; Meyers, A.G. Improved analytical solution for toppling stability analysis of rock slopes. Int. J. Rock Mech. Min. Sci. 2008, 45, 1361–1372. [Google Scholar] [CrossRef]
  20. Pérez-Rey, I.; Muñiz-Menéndez, M.; González, J.; Vagnon, F.; Walton, G.; Alejano, L.R. Laboratory physical modelling of block toppling instability by means of tilt tests. Eng. Geol. 2021, 282, 105994. [Google Scholar] [CrossRef]
  21. Zheng, D.; Zhou, H.; Zhou, H.; Liu, F.; Chen, Q.; Wu, Z. Effects of Slope Angle on Toppling Deformation of Anti-Dip Layered Rock Slopes: A Centrifuge Study. Appl. Sci. 2022, 12, 5084. [Google Scholar] [CrossRef]
  22. Zheng, Y.; Chen, C.; Wang, R.; Meng, F. Stability Analysis of Rock Slopes Subjected to Block-Flexure Toppling Failure Using Adaptive Moment Estimation Method (Adam). Rock Mech. Rock Eng. 2022, 55, 3675–3686. [Google Scholar] [CrossRef]
  23. Akbar, A.; Mehdi, A.; Kamran, E. A two-dimensional limit equilibrium computer code for analysis of complex toppling slope failures. J. Rock Mech. Geotech. Eng. 2021, 13, 114–130. [Google Scholar]
  24. Liu, S.; Wang, H.; Meng, Q.; Yan, L. Simulating Crack Development and Failure Characteristic of Toppling Rock Slope under Seismic Loading on Lancang River in China. Lithosphere 2021, 2021, 6. [Google Scholar] [CrossRef]
  25. Huang, D.; Ma, H.; Huang, R.; Peng, J.; Luo, S. Deep-seated toppling deformations at the dam site of the Miaowei Hydropower Station, Southwest China. Eng. Geol. 2022, 303, 106654. [Google Scholar] [CrossRef]
  26. Cai, J.C.; Zheng, D.; Ju, N.P.; Wang, J.; Zhou, X.; Li, D. Time-Varying Effect of Ductile Flexural Toppling Failure on Antidip Layered Rock Slope. Front. Earth Sci. 2022, 10, 943700. [Google Scholar] [CrossRef]
  27. Zhang, F.; Zhang, W.; Wang, W.; Huang, D.; Li, Y.; Yu, C. Distribution Properties and Limit Depth Determing Methods of Rock mass With Toppling Deformation. J. Eng. Geol. 2015, 23, 1109–1116. (In Chinese) [Google Scholar] [CrossRef]
  28. Zhang, X.; Meng, Q.; Zhang, F. Influence of Wind-Generated Wave Action on Mountain Reservoir Bank Collapse: A Case Study at the Lancang River, Western China. Lithosphere 2021, 2021, 6427717. [Google Scholar] [CrossRef]
Figure 1. Schematic diagram of bridge location (scheme 1). (a) Schematic diagram of bridge type; (b) geological section of bridge site area.
Water 15 04037 g001
Figure 2. Terrain and landform characteristics on both sides of the bridge.
Water 15 04037 g002
Figure 3. Deep stratigraphy of Yunlong side bank slope.
Water 15 04037 g003
Figure 4. Stratigraphy of river water level position on Yunlon side bank slope.
Water 15 04037 g004
Figure 5. Geometric model.
Water 15 04037 g005
Figure 6. Broken rock mass revealed via TV images in boreholes near shore.
Water 15 04037 g006
Figure 7. Toppling rock mass of the bank slope. (a) Near the reservoir surface at 1403 m; (b) at the elevation of 1540 m.
Water 15 04037 g007
Figure 8. Fracture forms and mechanical mechanisms of rock masses with different degrees of toppling deformation: (a) shear dislocation within weak toppling layers; (b) tensioning deformation between strong toppling layers; (c) tensioning shear fracture of strong toppling shear layers.
Water 15 04037 g008
Figure 9. Deformation of toppled rock mass under bridge load.
Water 15 04037 g009
Figure 10. Potential failure mode diagram of Yunlong side bank slope.
Water 15 04037 g010
Figure 11. Distribution of pore water pressure under different conditions on the bank slope. (a) 1408 m Water Level; (b) 1408~1398 m water level sudden drop; (c) 1398 m water level; (d) rainstorm + 1408 m water level; (e) rainfall + 1408 m water level; (f) rainstorm + sudden water level drop; (g) rainfall + sudden water level drop; (h) rainstorm + 1398 m water level; (i) continuous rainfall + 1398 m water level.
Water 15 04037 g011aWater 15 04037 g011b
Figure 12. Calculation model for stability of Yunlong side bank slope. (a) Natural conditions; (b) scheme 1; (c) scheme 2.
Water 15 04037 g012
Figure 13. Calculation results of bank slope stability on Yunlong side. (a) Natural condition: sudden drop in water level + rainfall + earthquake condition; (b) scheme 1: natural working condition; (c) scheme 2: natural working conditions.
Water 15 04037 g013
Figure 14. Three-dimensional calculation model of Yunlong side bank slope (a) scheme 1; (b) scheme 2.
Water 15 04037 g014
Figure 15. Pore pressure distribution of Yunlong side toppling slope.
Water 15 04037 g015
Figure 16. Total displacement of different working condition. (a)working condition 1; (b) working condition 2; (c) working condition 3.
Water 15 04037 g016
Figure 17. Plastic zone during Bridge Operation (y = 140 m profile). (a) working condition 1; (b) working condition 2; (c) working condition 3.
Water 15 04037 g017
Figure 18. Toppling cracks developed along layer.
Water 15 04037 g018
Figure 19. Mechanism of toppling deformation under bridge load.
Water 15 04037 g019
Figure 20. Displacement vector diagram after reservoir impoundment.
Water 15 04037 g020
Table 1. The specific description of different types of toppling deformation and failure.
Toppling Damage TypeDeformation ProcessDeformation Characteristic
Bending collapseMainly in thin to medium-sized layers of rock formations, bending as a floating surface under their own weight, but which do not break. They have self-stability and are often affected by excavation, earthquakes, water loads, and other factors.Large-scale and deep deformation
Block collapseMainly in medium-sized to thick rock masses, under the action of gravity or external forces, with the cut rock blocks toppling outward along the corners. During the failure, the rock mass at the foot of the slope undergoes deformation due to the action of the latter rock layer, leading to toppling failure of the upper rock mass.Instantaneous and sudden, but on a smaller scale
Block bending collapseMainly in slopes with alternating layers of soft and hard rocks, with continuous bending deformation and a failure scale between bending collapse and block collapse.Continuity and accumulation
Table 2. Advantages and disadvantages of different numerical simulation methods used in the above literature.
Numerical MethodsAdvantageDisadvantage
Finite element method (FEM)Able to considering the non-uniformity and discontinuity of the slope rock mass, avoiding the defect of treating the sliding mass as a rigid body that is too simplified; able to consider the impact of groundwater, construction engineering, and the combined effects of various support structures and geotechnical materials.Affected greatly by the selection of physical parameters; cannot solve the problem of a large number of joints and discontinuities in the rock mass, especially for solving problems such as large deformation and displacement.
Discrete element method (DEM)Suitable for stress and deformation analysis of jointed rock masses, with significant advantages in solving linear large displacement and dynamic stability problems.The selection of time steps affects the accuracy of calculation results.
Boundary element method (BEM)Advantages for solving infinite or semi-infinite domain problems, suitable for small deformation homogeneous continuous media.When encountering domain integrals corresponding to nonlinear terms, there is a strong singularity near the singular point, making the solution difficult.
Discontinuous deformation analysis (DDA)Taking the minimum value of the potential functional has some advantages of both finite element and discrete element methods.Analyzing problems often completely discretizes the research object, which is not suitable for the analysis of continuous and semi-continuous problems. At the same time, due to the wide variety of rock masses and complex properties, the calculation time step has a significant impact on the results.
Lagrange fast difference method (FLAC)Able to effectively consider the large deformation and discontinuity of rock and soil, with fast solving speed, suitable for solving nonlinear large deformation problems.There is randomness in the division of calculation boundaries and grids, and the calculation results will be influenced by the grids and boundaries.
Table 3. Calculation of bridge load for bank slope stability (Unit: kN).
Bridge
Programme
Pier/Abutment NameTransverse Bridge Width/mPile Foundation Length/mAxial Force/kNAxial Compressive Bearing Capacity Per Linear Meter of a Single Pile with a Single Width/kNHorizontal Force along the Bridge Direction/kNHorizontal Force along the Bridge Direction with Single Width/kN
scheme 1main pier40801,039,32521664,2071605
auxiliary pier11.23577,46818887678
abutment12.82869,09917200
scheme 2main pier40901,632,13521631,039776
auxiliary pier (adjacent to the main pier)16.535112,08815500
auxiliary pier (near abutment pier)16.53555,17911500
abutment11.82874,69517200
Table 4. The specific description of different toppling deformation zones.
Basic IndicatorZone AZone BZone C
Zone B1Zone B2
Dip angle difference in rock strataα ≤ 40°40° < α ≤ 57°54° < α ≤ 68°60° < α ≤ 78°
Maximum tension within the layerD > 21 mm9 mm < D < 24 mm6 mm < D < 18 mm2 mm < D < 8 mm
Location of the weathering zoneGenerally in strongly weathered zoneGenerally in the weakly weathered upper sectionGenerally in the weakly weathered upper sectionGenerally in the lower section of weak weathering
Location of the unloading zoneConsistent with the extremely strong unloading, the bottom boundary of strong unloading zone is generally located near the bottom boundary of Zone BConsistent with the weak unloading zone
Table 5. Hydraulic parameters of different toppling areas of bank slope.
LithologySaturated Permeability Coefficient (m/s)Saturated Volume Moisture Content
Quaternary cover layer6 × 10−5 0.42
Fracture zone4.2 × 10−60.40
Zone A: extremely strong toppling area; strongly weathered slate with metamorphic sandstone2.315 × 10−60.35
Zone B: strong toppling area; strong weathered slate mixed with metamorphic sandstone1.157 × 10−60.29
Moderately weathered slate mixed with metamorphic sandstone in the micro toppling area of Zone C3.45 × 10−80.18
Table 6. Rock and soil parameters for different toppling areas.
LithologyWeight (kN/m3)C (kPa)Φ (°)Deformation Modulus/E
Gpa
Poisson’s Ratio/μ
NaturallySaturationNaturallySaturationNaturallySaturation
Quaternary cover layer20.020.5302824220.0250.35
Fracture zone21.221.6402730250.20.32
Strongly weathered sandy slate mixed with muddy slate23.023.415013526240.50.3
Metamorphic sandstone in strongly weathered areas23.023.41301152523.90.450.32
Moderately weathered sandy slate mixed with muddy slate26.227.057051037.033.30.60.29
Metamorphic sandstone in moderately weathered areas26.227.050045033.430.10.550.3
Structural planes in strongly weathered areas (combined with general)//80702523//
Structural planes in moderately weathered areas (well bonded)//2202003531.5//
Table 7. Calculation results for stability of the pile foundation platform.
Condition NameNatural Working ConditionsRainfall ConditionsRainfall + Earthquake Conditions
Stability Coefficient FsStability
Judgment
Stability Coefficient FsStability
Judgment
Stability Coefficient FsStability
Judgment
scheme 1: Slope covering layer on the main pier1.290<1.351.173<1.201.055<1.10
scheme 1: Slope foundation covering the interface on the main pier1.783>1.351.595>1.201.462>1.10
scheme 2: Slope covering layer on the main pier1.292<1.351.174<1.201.055<1.10
scheme 2: Strong to moderately weathered interface on the upper slope of the main pier2.147>1.351.914>1.201.749>1.10
scheme 2: Cover layer of the upper slope of the auxiliary pier (near the main pier)1.481>1.351.347>1.201.244>1.10
Table 8. Calculation Parameters of 3D finite difference Method.
LithologySevere (KN/m3)C (KPa)Φ (°)Deformation Modulus E
GPa
Poisson’s Ratio μ
NaturallySaturationNaturallySaturationNaturallySaturation
fracture zone22.523.5402730250.20.32
Zone A extremely strong toppling and strong weathered slate26.227.020018033.229.80.50.3
Strong toppling and weathering of slate in Zone B26.227.040036035.431.90.60.29
Slightly weathered slate26.827.86505854136.90.80.28
Table 9. Finite difference stability coefficient table.
Calculated Operating ConditionsStability CoefficientLeading Edge (m)Trailing Edge (m)
Before the construction of the bridgeNatural working conditions (sudden drop of water level from 1408 m to 1398 m)1.5914101730
scheme 1Bridge operation + natural working conditions (sudden drop of water level from 1408 m to 1398 m)1.5514101730
Bridge operation + rainstorm condition (1408 m water level suddenly drops to 1398 m water level)1.4415001730
Bridge operation + rainfall + earthquake conditions (sudden drop of water level from 1408 m to 1398 m)1.2815501750
scheme 2Bridge operation + natural working conditions (sudden drop of water level from 1408 m to 1398 m)1.5614101730
Bridge operation + rainstorm condition (1408 m water level suddenly drops to 1398 m water level)1.4715321730
Bridge operation + rainfall + earthquake conditions (sudden drop of water level from 1408 m to 1398 m)1.3115501750
Disclaimer/Publisher’s Note: The statements, opinions and data contained in all publications are solely those of the individual author(s) and contributor(s) and not of MDPI and/or the editor(s). MDPI and/or the editor(s) disclaim responsibility for any injury to people or property resulting from any ideas, methods, instructions or products referred to in the content.

