Article

Tap Water Quality: Challenges and Psychological Consequences

1
Environmental Protection Division, Zijin Mining Group, Longyan 364200, China
2
School of Environmental Studies, China University of Geosciences, Wuhan 430074, China
3
College of Nationalities, Hainan Tropical Ocean University, Sanya 572022, China
4
Key Laboratory of Theory and Technology of Petroleum Exploration and Development, China University of Geosciences, Wuhan 430074, China
5
Department of Zoology, College of Science, King Saud University, P.O. Box 2455, Riyadh 11451, Saudi Arabia
6
Institute of Mountain Hazards and Environment, Chinese Academy of Sciences, Chengdu 610041, China
7
Hubei Subsurface Multiscale Image Key Laboratory, School of Geophysics and Geomatics, China University of Geosciences (Wuhan), Wuhan 430074, China
8
College of New Energy and Environment, Jilin University, Changchun 130021, China
*
Authors to whom correspondence should be addressed.
Water 2023, 15(22), 3987; https://doi.org/10.3390/w15223987
Submission received: 23 October 2023 / Revised: 7 November 2023 / Accepted: 14 November 2023 / Published: 16 November 2023

Abstract

:
Investigating drinking water quality is crucial for public health, as clean water access is a fundamental requirement for a healthy life. To comprehensively assess Karachi’s drinking water quality, 152 water samples were systematically collected from five districts: Malir, Karachi West, Karachi East, Karachi South, and Karachi Central. The investigation involved analyzing various physicochemical and microbiological parameters in comparison to WHO 2011 guidelines. Additionally, integrated techniques like principal component analysis and water quality index computation offer insights into both potable and non-potable water aspects, with a focus on health-related well-being. Elevated levels of turbidity and chloride were identified across all five districts, with the residual chloride surpassing permissible limits in Karachi West and Karachi Central. Coliform and E. coli levels exhibited significant variations, with the highest mean values recorded in Karachi Central and the lowest in Karachi East. The overall analysis revealed that only 16.67%, 38.71%, 50%, 43.33%, and 58.06% of the water supply is suitable for drinking in Malir, Karachi West, Karachi East, Karachi South, and Karachi Central, respectively, while 83.33%, 61.29%, 50%, 56.67%, and 41.94% are unsuitable for drinking, posing substantial health risks. Urgent interventions in water quality management and public health are imperative to mitigate these risks associated with substandard drinking water.

Graphical Abstract

1. Introduction

Access to safe and clean drinking water is universally recognized as a fundamental human right and a pivotal determinant of public health [1]. The quality of drinking water is inextricably linked to the well-being of individuals and communities, impacting not only physical health but also psychological and socio-economic dimensions [2,3]. In the sprawling metropolis of Karachi, Pakistan, a city marked by rapid urbanization and diverse socio-economic dynamics, the question of water quality is of paramount significance.
The quality of drinking water, whether potable or non-potable, plays a pivotal role in determining public health outcomes [4,5]. Potable water, meeting stringent quality standards, is a lifeline that safeguards individuals from waterborne diseases and health risks. However, the presence of non-potable water sources, often laden with contaminants and the existence of enteric viruses [6], introduces a complex conundrum. Exposure to non-potable water can lead to a spectrum of adverse health effects, encompassing gastrointestinal illnesses, waterborne diseases, and long-term health risks [7,8]. Beyond these physiological impacts, the psychological consequences of grappling with uncertain and unsafe water sources cannot be overstated [9]. The perpetual anxiety surrounding water safety [10], the stress of securing alternative water supplies, and the erosion of trust in public services all exact a psychological toll on affected communities [11]. These psychological stressors can manifest as anxiety, depression, and even post-traumatic stress disorder (PTSD). Therefore, it is necessary to identify water quality for the protection of public health by preventing waterborne diseases through water quality assessments and fostering public awareness and trust for their psychological well-being.
Various methods have been used to analyze water quality such as water quality index and multivariate modeling [12,13], risk assessment [14], principal component analysis (PCA) [15], Monte Carlo simulations [16], machine-learning algorithms [17,18], and an ATP-based method [19]. Among them, PCA and water quality index (WQI) were widely used because of their effectiveness in simplifying complex data, revealing underlying patterns, assisting in decision making, and facilitating communication with the public and policymakers [20,21]. These two methods not only enhance the ability to monitor and manage water resources effectively but also ensure access to safe and clean drinking water for communities.
This study explored the quality of drinking water supply in the five districts of Karachi, Pakistan, through descriptive statics of physicochemical and microbiological parameters in comparison to WHO 2011 guidelines, principal component analysis, and the computation of a water quality index which further classifies the water into potable and non-potable water and helps protect public health by reducing the risk of waterborne diseases and mental health issues associated with consuming contaminated water. Various water quality studies have previously investigated the water quality status worldwide, but the classification of water into potable and non-potable water along with the outline of psychological consequences makes it an innovative aspect of this study.

2. Materials and Methods

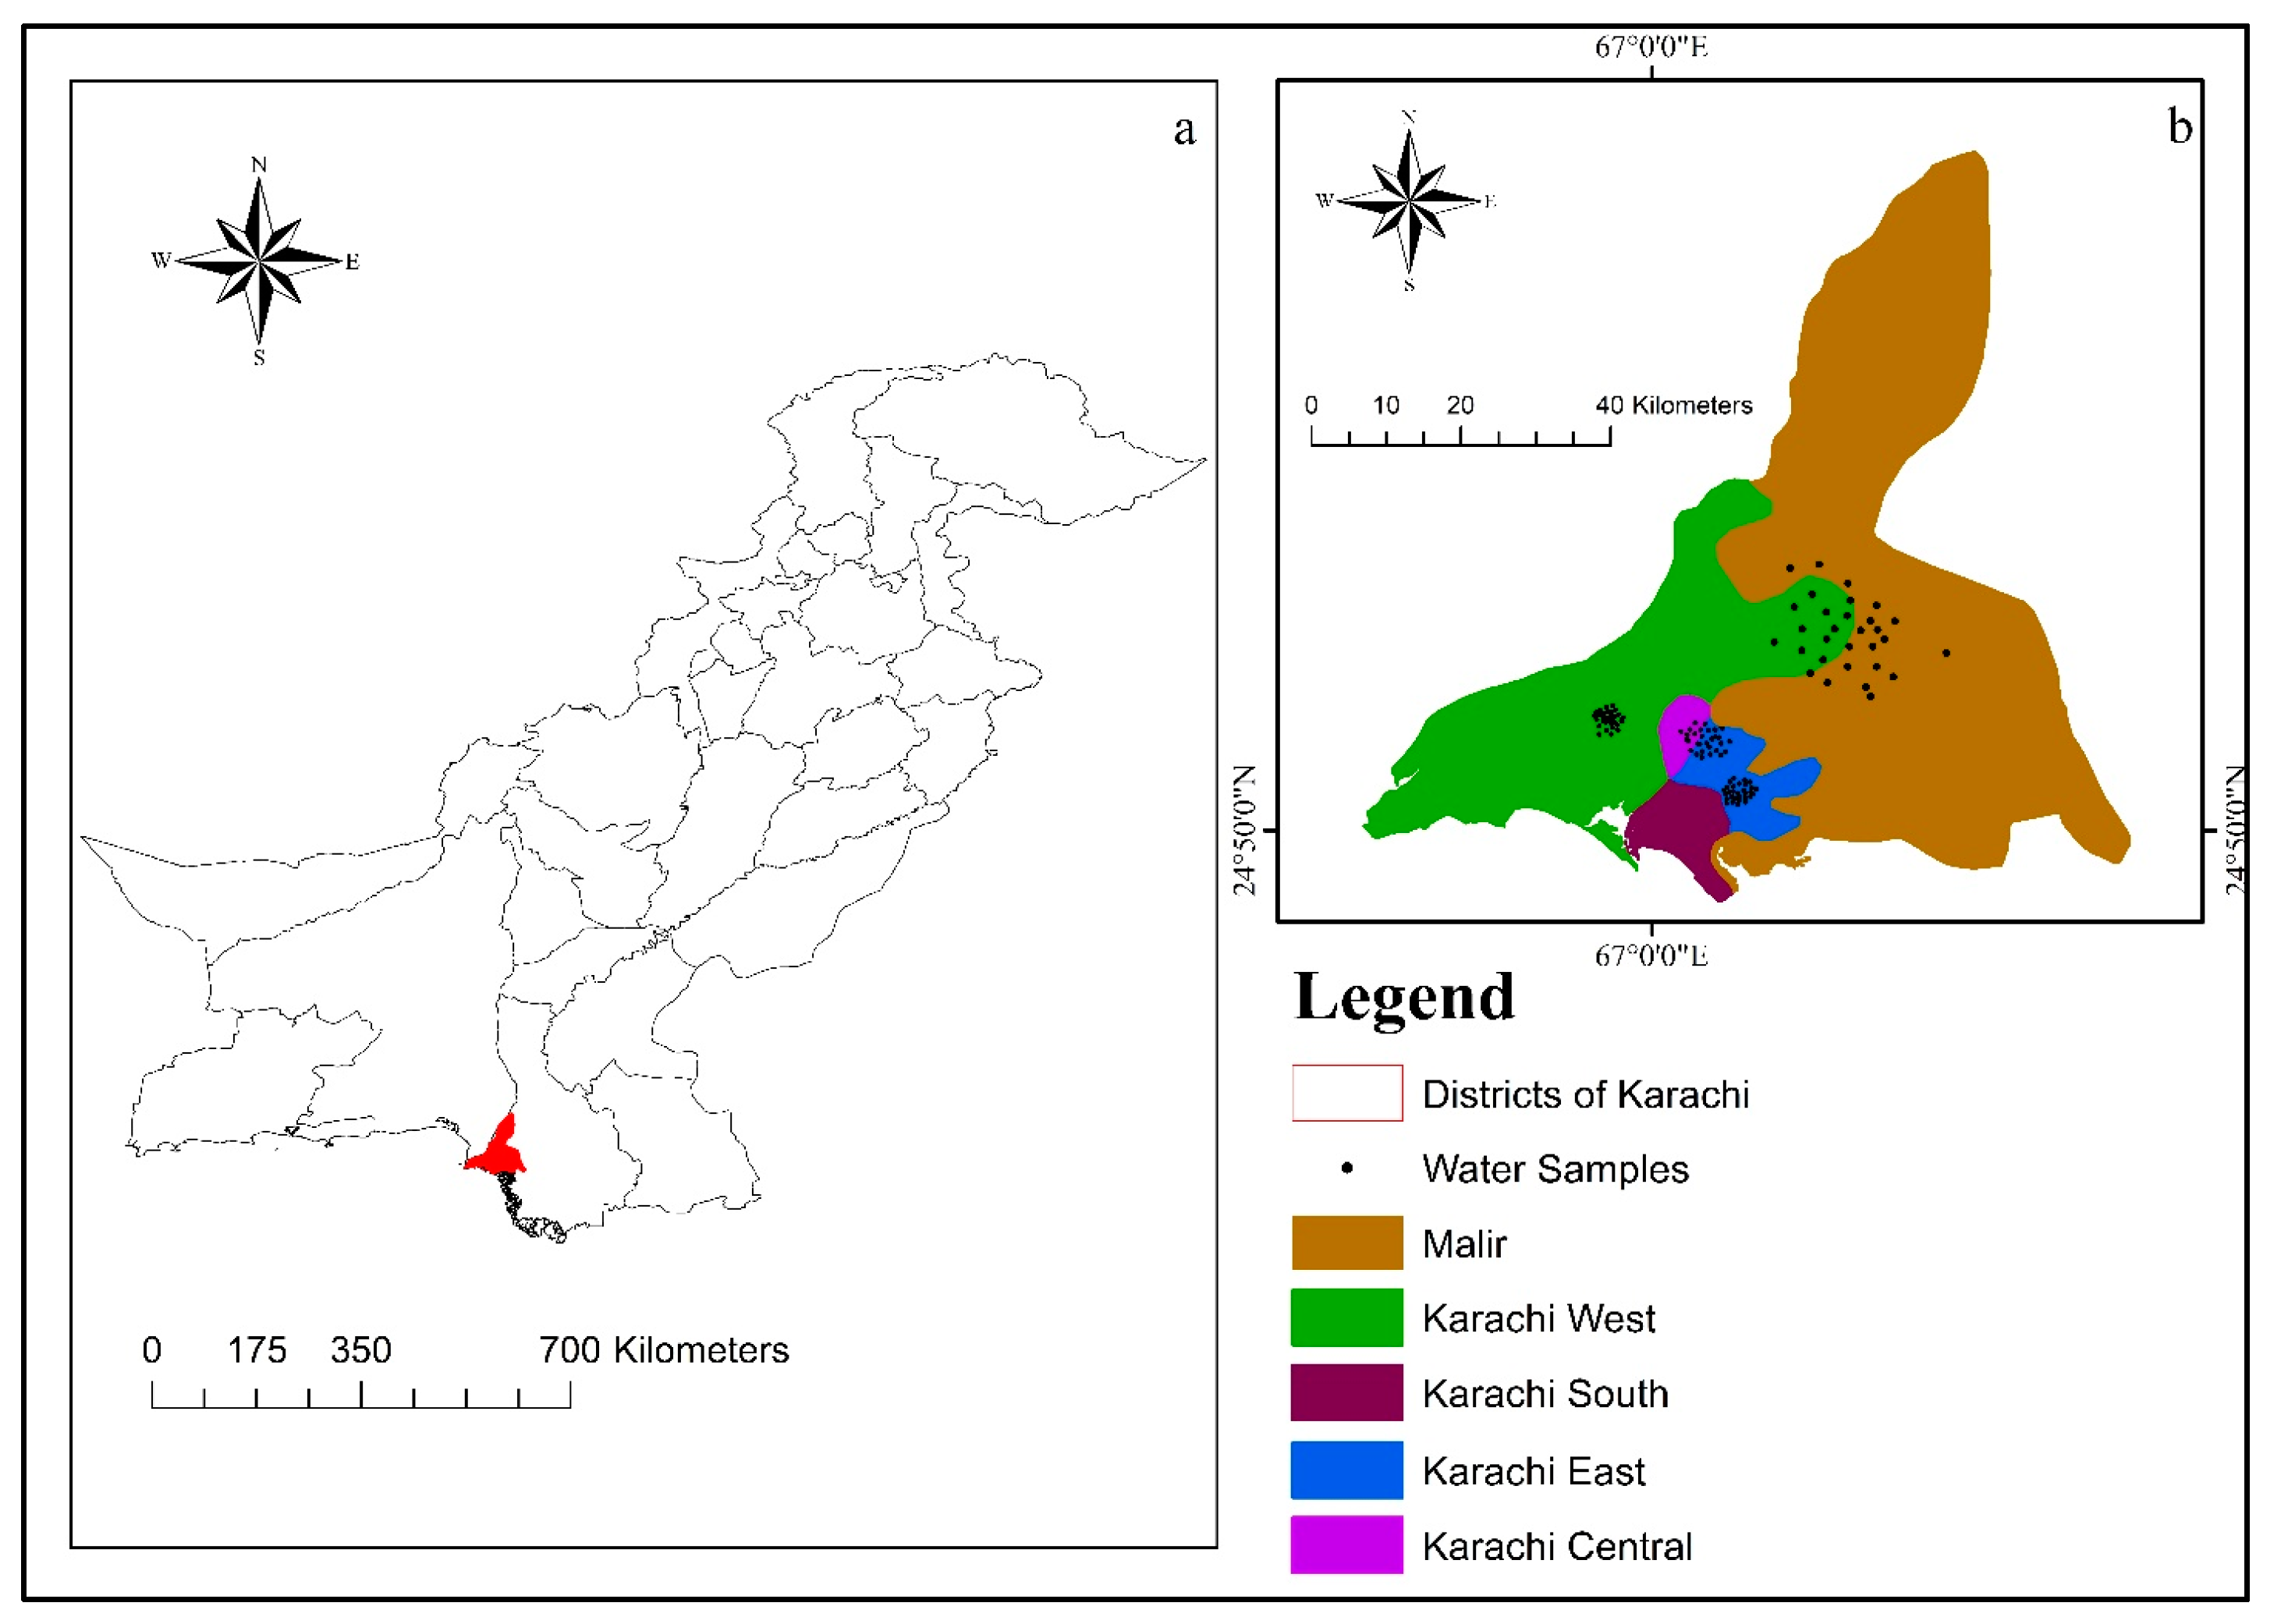
2.1. Study Area Description

A megacity of Asia, with a population of over 14 million in the 2017 census in Pakistan’s Sindh province, Karachi [22] comprises seven districts located at coordinates 25°4′12.15″ N and 67°17′5.23″ E, stretching from the Indus River to the Arabian Sea [23]. The industrial landscape of Karachi can vary from district to district, with areas like SITE (Sindh Industrial and Trading Estate, Karachi, Pakistan) being known for industrial activities, which also generates and releases a significant amount of wastewater into the environment. This vibrant city is marked by a subtropical climate known for its scorching summers and gentle winters. Karachi receives an average annual rainfall of 256 mm. Throughout the year, temperatures exhibit a noteworthy contrast, with winter lows averaging around 20.3 °C, while summer highs soar to an average of 31.7 °C. The productivity of water sources in Karachi can vary depending on factors such as weather conditions, water infrastructure, and maintenance. Within this metropolis, the natural water supply primarily relies on Keenjhar Lake, while the Hub Dam serves as a secondary source of drinking water [24].

2.2. Water Sampling

A total of 152 drinking water samples were collected for the assessment of water quality through a composite sampling method from the five districts of Karachi Central (n = 31), East (n = 30), South (n = 30), West (n = 31), and Malir (n = 30) districts (Figure 1). The sample locations were chosen to focus on areas of specific interest, efficiently allocate resources, and capture localized water quality variations (Table S2). The tap water to the five districts was supplied from different water pumping stations through the underground water supply lines by Karachi Water and Sewerage Board (KWSB Karachi, Pakistan). This allows for a comparison of water quality among districts, but it also requires a comprehensive approach to sampling, analysis, and interpretation to address the potential variations in water quality that may arise from different sources and distribution systems. The composite sampling method is a cost-effective and manageable way to assess water quality over a wide area. A one-liter plastic bottle was rinsed three times with the sample water used for sampling [25]. The samples were placed in an ice box following [26] and transported to the laboratory for further analysis of quality parameters including chemical, physical, and biological properties. Upon arrival at the laboratory, the samples were stored at 4 °C for the evaluation of physiochemical parameters and at −80 °C for microbial assessment. Temperature, turbidity, color, pH, conductivity, and residual chlorine were monitored on the spot during sampling, while for the analysis of coliform and E. coli, the samples were preserved using 0.1 M solution of sodium thiosulfate [27,28].

2.3. Microbial Analysis

2.3.1. Medium Preparation

The previously described microbiological techniques involved slight modifications [29]. The presumptive coliform test utilized lauryl tryptose broth as the growth medium. For coliform and E. coli isolation, a nutrient agar (NA) medium was prepared by dis-solving 28 g of nutrient agar (with specific constituents) in 1000 mL of water at pH 7, followed by autoclaving at 121 °C for 15 min. After cooling, nystatin was added to prevent fungal growth. The medium was poured into sterile Petri plates within a decontaminated laminar flow hood (LFH). Following a 3 min UV light exposure, the NA plates were incubated for 24 h to monitor contamination growth [29,30].

2.3.2. Enumeration of Coliform and E. coli

Three sets of tubes with varying water sample volumes (10 mL, 1 mL, and 0.1 mL) were incubated at 37 °C to 44 °C for 24–48 h to check for acid and gas production in the presumptive coliform test. Following this, the total coliform confirmatory test used Brilliant Green Lactose Bile broth and incubation at 37 °C for 24–48 h. For fecal coliform, incubation was at 44 °C, with observations for gas production. After confirming fecal coliform presence, Eosin Methylene Blue (EMB) agar plates were used to detect E. coli by streaking them with broth from positive tubes and checking for bacterial presence. [31,32].

2.4. Chemical Analysis

Various chemical tests were conducted to assess the levels of chemical ions. On-site measurements of water temperature, pH, turbidity, electrical conductivity, and total dissolved solids were carried out using calibrated portable meters (RS232C/Meter CON 110, Eutech Instruments Pte Ltd., Jinan, China). Nitrates were determined using the cadmium reduction method (Hach-8192, Hach, Shanghai, China) and a spectrophotometer (SulfaVer4—Hach-8051, Hach, Shanghai, China). For chlorides (Cl) determination, an argentometric method was employed, utilizing a potassium chromate indicator and a standard Ag-NO3 solution. The measurement of Cl- ions was performed using an ion chromatograph (IC/P60, Qingdao Shenghan Chromatograph Technology Co., Ltd., Qingdao, China), while alkalinity was determined through the acid–base titration technique.

2.5. Water Quality Index (WQI)

A comprehensive water quality index (WQI) methodology was employed to evaluate the overall quality of water in the study area. The physicochemical parameters such as turbidity, color, pH, chloride, total hardness, and TDS were considered to calculate WQI. Each parameter was assigned a weight based on its importance in determining water quality, and a sub-index was calculated for each parameter using established formulae [33]. Sub-indices were then combined to obtain the overall WQI for each district. The results were concluded by categorizing the WQI values into water quality classes [30] to facilitate easy interpretation of results.
WQI   =   i = 1 n   QiWi
where
Qi = sub-index for ith water quality parameter;
Wi = weight associated with ith water quality parameter;
n = number of water quality parameters.

2.6. Statistical Analysis

Origin version 2023 software and XLSTAT for Windows 10 were used for the statistical analyses. The analysis was performed in triplicate, and the mean values were used in further analysis. The data are presented as the mean ± SD compared with the WHO 2011 [34] standard value (Table S1), while the percentage of the number of samples affected by coliform and E. coli bacteria in each district was determined by:
No .   of   samples   affected   by   indicator   organism   ( % )   =   N a N × 100
where Na is the total number of affected samples, and N is the total number of samples in each district. The potable and non-potable water percentage in each district of Karachi was calculated using Equation (3).
Potable / Non - Potable   drinking   water   ( % ) = P   o r   N P N   ×   100
where P = potable water, and NP = non-potable water.

3. Results and Discussion

3.1. Physicochemical and Microbiological Profile

Descriptive statistics were carried out to evaluate the physicochemical and biological profile of the study area (Table S1). The mean temperature in the five districts of Karachi was found to be 27.86, 26.9, 27.75, 27.46, and 28.24 °C for Malir, Karachi West, East, South, and Karachi Central. The highest temperature was recorded in Malir and Karachi East, i.e., 32.2 °C, which may encourage the growth of certain microorganisms (M. kansasii and A. fumigatus) [35] and affect the water quality, while the lowest temperature was 2.5 °C in District Malir. The comparison with WHO 2011 [34] guidelines reveals that the mean value of turbidity exceeds in all five districts of Karachi, i.e., <1.5 NTU. The highest turbidity was observed to be 50.6 NTU in Karachi West, indicating the presence of contaminants such as sediment, algae, bacteria, or other particulate matter [33], while the lowest turbidity was 0.5 NTU in Karachi South district. The elevated levels of turbidity also reveal a measure of the cloudiness or haziness of water caused by the presence of suspended particles [36], which resulted in the elevated mean value of color (6.47 Hazen units) in Karachi East, while the minimum value of color in the four districts was the same, i.e., 1 except Karachi West, and the maximum value of color was found to be 90 Hazen units in Karachi East district.
The mean value of pH was found to be under the permissible limits of WHO (between 6.5 and 8.5), while the highest value of pH was 9.5 in District Malir, which indicates that the water is slightly alkaline [37], and Karachi West was found to have low pH, i.e., 6.4. The mean value of chloride was higher in all five districts of Karachi (<250 mg L−1), while the highest and lowest chloride values were 3240 mg L−1 and 1.96 mg L−1 in District Malir. The lowest chloride levels in Malir reveal that the higher the pH, the lower the chloride content [38], while the higher chloride in the same area suggests the influence of pH on chloride is relatively small compared to other factors.
The mean value of total hardness and TDS was above the permissible limit of WHO (<500 mg L−1 and <1000 mg L−1) in Malir and Karachi West, while the other districts were found within the allowable limit. The highest value of total hardness was observed in Karachi West (4460 mg L−1), revealing the presence of calcium (Ca2+) and magnesium (Mg2+) ions [39], while the lowest value (70 mg L−1) was observed in Malir and Karachi East. For TDS, only District Malir was observed to have the highest (8960 mg L−1) and lowest value (1.33 mg L−1).
The overall nitrate values in the study area were found to be within the permissible limit. The mean value for residual chloride (0–0.097 mg L−1) in the study area was below the WHO permissible limit (min 0.2–max 0.5 mg L−1). The maximum value of R/Cl was found in Karachi West, i.e., 2 mg L−1, while in Karachi Central, the value of R/Cl was also found to be above the permissible limit, i.e., 1 mg L−1. The value of R/Cl for the remaining districts was found to be lower than the permissible limit, i.e., no detectable chlorine or chloride ions in drinking water.
The study area was found to have coliform and E. coli in all five districts, indicating that the water supply has been contaminated with fecal matter [40]. Coliform (no./100 mL) was detected with a mean value of 0.033 in Malir and Karachi East, and 0.032, 0.2, and 3.65 in Karachi West, South, and Central districts, while the highest coliform, i.e., 45, was detected in Karachi Central, and the lowest value was approximately zero. E. coli (no./100 mL) was detected with a mean value of 0.033 in Malir, Karachi East, and Karachi South, and 0.032 and 0.19 in Karachi West and Central district, while the highest E. coli, i.e., 4, was detected in Karachi Central, and the lowest value was approximately zero in all five districts.

3.2. Principal Component Analysis of Physicochemical and Microbiological Parameters

Principal component analysis (PCA) was used to recognize the relationship among physicochemical and biological parameters in five districts of Karachi. The PCA results of drinking water samples in each district showed five principal components were achieved, namely F1, F2, F3, F4, and F5, which was also proposed by [41] for surface water and groundwater. In each district, F1 shows strongly favorable loading on alkalinity, chloride, total hardness, and TDS [42].

3.2.1. District Malir

Table 1 shows the PCA result of Malir samples (n = 30). The factors F1, F2, F3, F4, and F5 have a total cumulative percentage of (76.66) (Figure 2a). All the factors also show a variability percentage of (33.68), (14.70), (10.60), (9.77), and (7.90), with eigenvalues of (4.38), (1.91), (1.38), (1.27), and (1.03), respectively. The coefficient (r) values were noted as 0.956, 0.978, 0.974, and 0.982, respectively. Factor F1 was calculated to have a total variance of 33.682%, an eigenvalue of 4.379, and strong positive loadings for tap water variables alkalinity, chloride, total hardness, and TDS, the values of which were calculated to be 0.956, 0.978, 0.974, and 0.982, respectively. Understanding that F1 predominantly reflects mineral composition is valuable for water quality management. High levels of alkalinity, chloride, total hardness, and TDS can have implications for taste, corrosiveness, and the suitability of water for specific uses. Its high eigenvalue and substantial variance explain its importance in the context of water quality assessment and management. Understanding F1 can lead to more informed decisions regarding water treatment, taste, and overall water quality improvement. Strongly favorable loading on total hardness and TDS were also previously reported by [42] for groundwater. F2 was calculated to have a total variance of 14.703%, an eigenvalue of 1.911, and shows positive loadings for turbidity, color, and EC, with coefficient r values of 0.588, 0.666, and 0.548, respectively. F2 can be utilized to explore the relationships between aesthetic water quality and other factors, such as consumer preferences, water source characteristics, and treatment methods.

3.2.2. District Karachi West

Table 2 shows the PCA result of the Karachi West samples (n = 31). The factors F1, F2, F3, F4, and F5 have a total cumulative percentage of (74.39), described in Figure 2b. The factors also show a variability percentage of (34.71), (12.05), (10.34), (9.15), and (8.14), with eigenvalues of (4.51), (1.57), (1.34), (1.19), and (1.06), respectively. The coefficient (r) values were noted as 0.892, 0.968, 0.966, and 0.941, respectively. F1 shows a strongly favorable load for alkalinity, chloride, total hardness, and TDS. The coefficient (r) values were noted as (0.892), (0.968), (0.94), (0.966), and (0.941), respectively, while the F2 shows a favorable load for temperature (0.592) and nitrate (0.677). F1 provides insights into mineral composition, while F2 offers information on temperature and nitrate levels, enhancing the overall interpretation of water quality.

3.2.3. District Karachi East

Table 3 shows the PCA result of the Karachi East samples (n = 30). The factors F1, F2, F3, F4, and F5 have a total cumulative percentage of (75.15), described in Figure 2c. The factors F1, F2, F3, F4, and F5 show a variability percentage of (35.16), (11.85), (10.84), (9.31), and (7.99), with eigenvalues of (4.57), (1.54), (1.41), (1.21), and (1.04), respectively. The coefficient (r) values were noted as 0.800, 0.964, 0.927, and 0.965, respectively. F1 shows strongly favorable load for alkalinity, chloride, total hardness, TDS, and nitrate. The coefficient (r) values were noted as (0.800), (0.964), (0.94), (0.927), (0.941), and (0.625), respectively, while the F2 shows favorable load for color (0.758) and pH (0.611). Nitrate’s inclusion in F1 implies that F1 could be associated with the presence of nitrate in the water, potentially reflecting water quality variations related to nitrate contamination. F2 captures water quality aspects related to color and pH. These variables contribute to the understanding of water aesthetics (color) and acidity/alkalinity (pH) within the dataset [43].

3.2.4. District Karachi South

Table 4 shows the PCA result of the Karachi South samples (n = 30). The factors F1, F2, F3, F4, and F5 have a total cumulative percentage of (82.42), described in Figure 2d. The factors F1, F2, F3, F4, and F5 show a variability percentage of (38.44), (17.27), (11.56), (8.15), and (7.00), with eigenvalues of (5.10), (2.25), (1.50), (1.06), and (0.91), respectively. F1 shows strongly favorable load for pH, alkalinity, chloride, total hardness, TDS, and nitrate. The coefficient (r) values were noted as (0.609), (0.859), (0.876), (0.816), (0.916), and (0.733), respectively, while the F2 shows favorable load for turbidity (0.606) and color (0.694). F1 appears to represent not only mineral composition but also aspects related to nitrate contamination. PCA results show that Factor F1 primarily represents water chemistry, including pH, alkalinity, chloride, total hardness, TDS, and nitrate, while Factor F2 is associated with aesthetic water quality parameters, such as turbidity and color.

3.2.5. District Karachi Central

Table 5 shows the PCA result of Karachi Central samples (n = 31). The factors F1, F2, F3, F4, and F5 have a total cumulative percentage of (86.11), described in Figure 2e. The factors F1, F2, F3, F4, and F5 show a variability percentage of (33.84), (21.44), (14.51), (8.90), and (7.43), with eigenvalues of (4.41), (2.79), (1.89), (1.16), and (0.97), respectively. F1 shows a strongly favorable load for alkalinity, chloride, total hardness, TDS, and nitrate. The coefficient (r) values were noted as (0.932), (0.910), (0.935), (0.959), and (0.676), respectively. The results indicate that Factor F1 exhibits strongly favorable loadings for alkalinity, chloride, total hardness, TDS, and nitrate, supported by high coefficient (r) values of 0.932, 0.910, 0.935, 0.959, and 0.676, respectively, suggesting that F1 is closely associated with these parameters and predominantly represents the mineral composition [44] and nitrate content of the water [45], signifying the significant role of these factors in explaining the variance in the dataset.

3.3. Effect of Indicator Organisms (Coliform and E. coli) in the Study Area

The overall percentage of coliform and E. coli was evaluated in each district (Figure 3). District Malir and Karachi West were observed to have equal percentages of each of two bacteria (3.33% and 3.32%), while the same percentage of the presence of E. coli was observed (3.33%) in District Karachi East and South along with 6.67% and 16.67% of coliform bacteria. District Karachi Central was found to have the highest percentage of coliform and E. coli bacteria, i.e., 19.35% and 9.68%. The presence of indicator organisms (coliform and E. coli) in drinking water reveals that the water source has encountered sewage or other sources of contamination resulting in waterborne diseases, including gastrointestinal illnesses [46,47].

3.4. Potable vs. Non-Potable Drinking Water

The presence of the microbial indicators and the exceeding levels of several physicochemical parameters including temperature, turbidity, pH, TDS, and R/Cl compared with WHO 2011 reveal the suitability of water for human consumption in each district. Figure 4 shows the percentage of potable (P) and non-potable (NP) water in District Malir (P = 16.67% and NP = 83.33%), Karachi West (P = 38.71% and NP = 61.29%), Karachi East (P = 50% and NP = 50%), Karachi South (P = 43.33% and NP = 56.67%), and Karachi Central (P = 58.06% and NP = 41.94%), respectively.

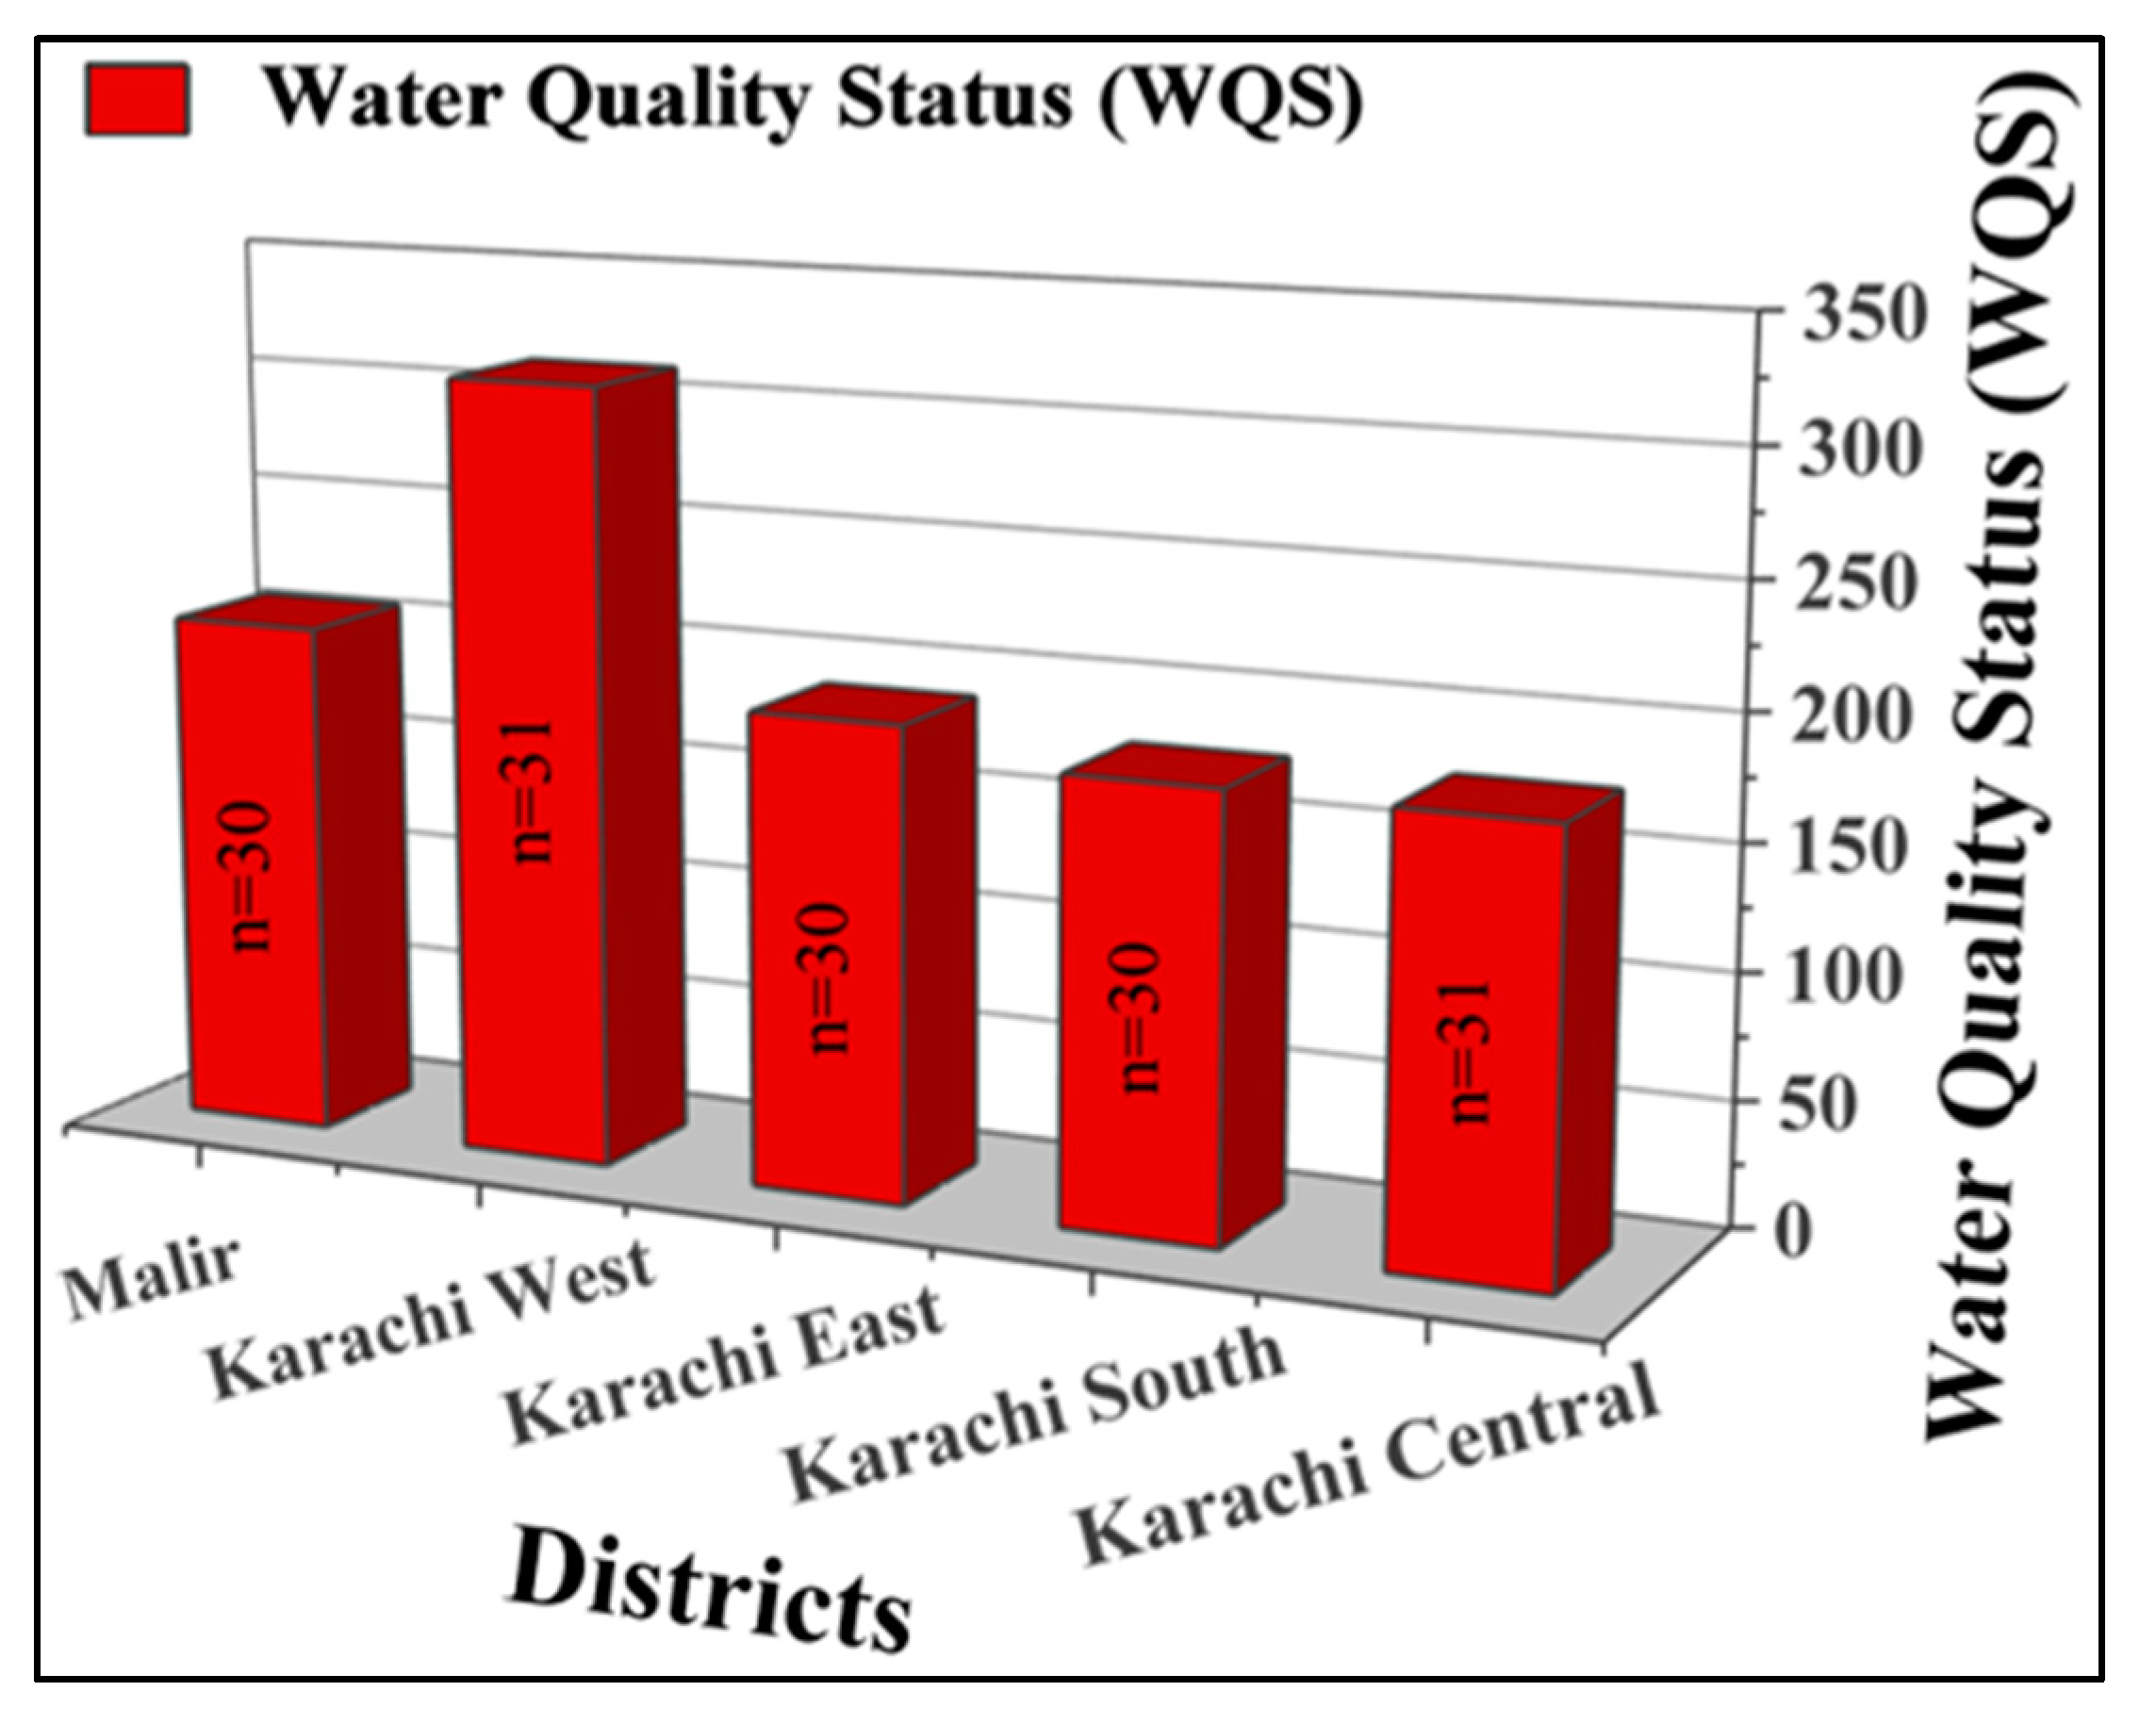
3.5. Water Quality Index (WQI)

Table 6 displays the classification of water quality proposed by [48] on the basis of water quality index (WQI) values, including water quality status (WQS) and water quality grading (WQG). Figure 5 reveals the water quality status (WQS) in the study area with a value of <100 in each district, i.e., 207, 312.2, 189.7, 176.9, and 176.1 for District Malir, Karachi West, Karachi East, Karachi South, and Karachi Central unfit for consumption. The WQS values below 100 in the mentioned districts indicate that the water quality is substandard and unsuitable for consumption. These results underscore the importance of addressing water quality challenges and implementing measures to provide safe and healthy drinking water to the residents of these districts. The results in Figure 5 emphasize the need for immediate attention and action to address the water quality issues in these districts. This could involve water treatment, source protection, infrastructure upgrades, and public health measures to ensure safe and clean drinking water.

3.6. Health Perception

The relationship between water quality and health perception is complex [46]. Access to clean and safe drinking water that meets or exceeds water quality standards generally has a positive influence on health [49], while the regions with chronic water quality issues may develop resilience and adaptability skills to navigate these challenges. However, constantly dealing with water-related stressors can still have long-term psychological consequences such as anxiety and worry regarding the concerns about waterborne illness which can lead to ongoing psychological stress, which may manifest as depression or other mental health issues [50,51].
Several studies provided the impact of water quality on human health in different ways [52,53]. Specifically, ref [10] screened 132 studies and proved the relationship between water crisis and mental health, indicating adverse psychological consequences, leading to increased levels of anxiety and health concerns. Another study [54] solidly established the link between water quality and mental health, evidently stating water insecurity as a possible driver of mental illness. Meanwhile, ref. [55] highlighted poor water quality as a workload and stress experienced by mothers, who are frequently subject to violence, thus affecting the psychological and physical well-being of breastfeeding mothers.

4. Conclusions

The investigation of potable vs. non-potable water quality is of significant importance as it provides insights into the drinking water quality status within the study area. The findings of this investigation reveal critical information about the water quality in the region.
  • This study uncovered that the maximum recorded temperature for tap water was observed in the Malir and Karachi East districts, reaching 32.2 °C. Notably, the total hardness and total dissolved solids (TDS) exceeded the permissible limits set by the World Health Organization (WHO) in the Malir and Karachi West districts. Additionally, elevated levels of turbidity and chloride were identified across all five districts. Specifically, the residual chloride (R/Cl) surpassed allowable limits in Karachi West and Karachi Central.
  • Furthermore, the investigation revealed that all five districts exhibited positive values for coliform and E. coli bacteria, indicating the presence of fecal contamination in the drinking water. The percentage of coliform bacteria presence varied among the districts, ranging from 3.33% to 19.35%, while E. coli ranged from 3.32% to 16.67%.
  • Nonetheless, this study highlighted a concerning trend, with non-potable water percentages being notably high in all districts, except for Karachi East, where the non-potable water percentage equaled that of potable water. This discrepancy underscores the need for particular attention to water quality in the region.
  • In terms of the statistical analysis, it was observed that in all five districts, Factor 1 (F1) exhibited strong and favorable loadings on alkalinity, chloride, total hardness, and TDS, with coefficients (r) ranging from 0.800 to 0.982. This suggests that these factors play a significant role in shaping water quality in the study area.
  • The water quality index (WQI) results indicated that the drinking water in all five districts was of poor quality and unfit for consumption. This finding is of paramount importance, as it implies potential consequences for the psychology and mental well-being of the population. Access to safe and clean drinking water is a fundamental factor in ensuring the overall health and peace of mind of the residents.
  • In conclusion, the investigation into potable vs. non-potable water quality in the study area has uncovered critical challenges in drinking water quality, with implications for public health and well-being. The results emphasize the urgency of addressing these water quality issues to safeguard the health and psychological well-being of the affected population. Also, it is recommended to implement a regular water quality monitoring program and upgrade the water treatment system by considering advanced treatment methods as needed.

Supplementary Materials

The following supporting information can be downloaded at: https://www.mdpi.com/article/10.3390/w15223987/s1, Table S1: Descriptive statistics of physicochemical parameters of drinking water in the study area along with the comparison of WHO 2011 guidelines [34]. Table S2: Displays the geographical attributes of sampled locations.

Author Contributions

Conceptualization, W.K.; methodology, W.K., C.S., I.K. and M.R.N.; software, W.K., I.K. and A.A.; validation, W.K.; formal analysis, W.K.; investigation, W.K.; resources, W.K., W.H., A.F.A. and M.H.A.; data curation, W.K.; writing—original draft preparation, W.K.; writing—review and editing, W.K., C.S., M.R.N., A.A., W.H. and M.Y.J.B.; visualization, W.K., I.K. and A.A.; supervision, W.K. and A.A.; project administration, W.K., A.F.A. and M.H.A.; funding acquisition, A.F.A. and M.H.A. All authors have read and agreed to the published version of the manuscript.

Funding

This research was funded by the Deputyship for Research and Innovation, “Ministry of Education” in Saudi Arabia for funding this research (IFKSUOR3-574-4).

Data Availability Statement

The data are available from the corresponding author on request.

Acknowledgments

The authors extend their appreciation to the Deputyship for Research and Innovation, “Ministry of Education” in Saudi Arabia for funding this research (IFKSUOR3-574-4). The authors are also thankful to Waqar Ahmed, Department of Environmental Science, Federal Urdu University of Arts Science & Technology, Karachi, Pakistan, for providing us with a platform to analyze the water quality samples.

Conflicts of Interest

The authors declare no conflict of interest.

References

  1. Oliveira, C.M.D. Sustainable access to safe drinking water: Fundamental human right in the international and national scene. Rev. Ambiente Água 2017, 12, 985–1000. [Google Scholar] [CrossRef]
  2. Kaiser, Z.R.M.A. Analysis of the livelihood and health of internally displaced persons due to riverbank erosion in Bangladesh. J. Migr. Health 2023, 7, 100157. [Google Scholar] [CrossRef] [PubMed]
  3. Sarango, M.; Senier, L.; Harlan, S.L. The high health risks of unaffordable water: An in-depth exploration of pathways from water bill burden to health-related impacts in the United States. PLoS Water 2023, 2, e0000077. [Google Scholar] [CrossRef]
  4. Gwenzi, W.; Dunjana, N.; Pisa, C.; Tauro, T.; Nyamadzawo, G. Water quality and public health risks associated with roof rainwater harvesting systems for potable supply: Review and perspectives. Sustain. Water Qual. Ecol. 2015, 6, 107–118. [Google Scholar] [CrossRef]
  5. Wang, L.; Zhang, L.; Lv, J.; Zhang, Y.; Ye, B. Public Awareness of Drinking Water Safety and Contamination Accidents: A Case Study in Hainan Province, China. Water 2018, 10, 446. [Google Scholar] [CrossRef]
  6. Rashid, M.; Khan, M.N.; Jalbani, N. Detection of Human Adenovirus, Rotavirus, and Enterovirus in Tap Water and Their Association with the Overall Quality of Water in Karachi, Pakistan. Food Environ. Virol. 2021, 13, 44–52. [Google Scholar] [CrossRef]
  7. Nappier, S.P.; Soller, J.A.; Eftim, S.E. Potable water reuse: What are the microbiological risks? Curr. Environ. Health Rep. 2018, 5, 283–292. [Google Scholar] [CrossRef]
  8. Nour, I.; Hanif, A.; Ryan, M.; Eifan, S. Insights into Gastrointestinal Virome: Etiology and Public Exposure. Water 2021, 13, 2794. [Google Scholar] [CrossRef]
  9. Wutich, A.; Brewis, A. Food, Water, and Scarcity. Curr. Anthr. 2014, 55, 444–468. [Google Scholar] [CrossRef]
  10. Brooks, S.K.; Patel, S.S. Psychological Consequences of the Flint Water Crisis: A Scoping Review. Disaster Med. Public Health Prep. 2022, 16, 1259–1269. [Google Scholar] [CrossRef]
  11. Morganstein, J.C.; Ursano, R.J. Ecological disasters and mental health: Causes, consequences, and interventions. Front. Psychiatry 2020, 11, 1. [Google Scholar] [CrossRef] [PubMed]
  12. El Osta, M.; Masoud, M.; Alqarawy, A.; Elsayed, S.; Gad, M. Groundwater Suitability for Drinking and Irrigation Using Water Quality Indices and Multivariate Modeling in Makkah Al-Mukarramah Province, Saudi Arabia. Water 2022, 14, 483. [Google Scholar] [CrossRef]
  13. Eftekhardadkhah, M.; Øye, G. Correlations between Crude Oil Composition and Produced Water Quality: A Multivariate Analysis Approach. Ind. Eng. Chem. Res. 2013, 52, 17315–17321. [Google Scholar] [CrossRef]
  14. Manne, R.; Kumaradoss, M.M.R.M.; Iska, R.S.R.; Devarajan, A.; Mekala, N. Water quality and risk assessment of copper content in drinking water stored in copper container. Appl. Water Sci. 2022, 12, 27. [Google Scholar] [CrossRef]
  15. Arain, M.B.; Ullah, I.; Niaz, A.; Shah, N.; Shah, A.; Hussain, Z.; Tariq, M.; Afridi, H.I.; Baig, J.A.; Kazi, T.G. Evaluation of water quality parameters in drinking water of district Bannu, Pakistan: Multivariate study. Sustain. Water Qual. Ecol. 2014, 3, 114–123. [Google Scholar] [CrossRef]
  16. Daly, S.W.; Harris, A.R. Modeling Exposure to Fecal Contamination in Drinking Water due to Multiple Water Source Use. Environ. Sci. Technol. 2022, 56, 3419–3429. [Google Scholar] [CrossRef]
  17. Uddin, G.; Nash, S.; Diganta, M.T.M.; Rahman, A.; Olbert, A.I. Robust machine learning algorithms for predicting coastal water quality index. J. Environ. Manag. 2022, 321, 115923. [Google Scholar] [CrossRef]
  18. Du, Z.; Qi, J.; Wu, S.; Zhang, F.; Liu, R. A spatially weighted neural network based water quality assessment method for large-scale coastal areas. Environ. Sci. Technol. 2021, 55, 2553–2563. [Google Scholar] [CrossRef]
  19. Delahaye, E.; Welté, B.; Levi, Y.; Leblon, G.; Montiel, A. An ATP-based method for monitoring the microbiological drinking water quality in a distribution network. Water Res. 2003, 37, 3689–3696. [Google Scholar] [CrossRef]
  20. Mladenović-Ranisavljević, I.I.; Takić, L.; Nikolić, Đ. Water Quality Assessment Based on Combined Multi-Criteria Decision-Making Method with Index Method. Water Resour. Manag. 2018, 32, 2261–2276. [Google Scholar] [CrossRef]
  21. Alam, A.; Singh, A. Groundwater Quality Assessment using SPSS based on multivariate statics and water quality index of Gaya, Bihar. Res. Sq. 2023, 195, 687. [Google Scholar] [CrossRef]
  22. Mangi, M.Y.; Yue, Z.; Kalwar, S.; Ali Lashari, Z. Comparative analysis of urban development trends of Beijing and Karachi metropolitan areas. Sustainability 2020, 12, 451. [Google Scholar] [CrossRef]
  23. Fazal, O.; Hotez, P.J. NTDs in the age of urbanization, climate change, and conflict: Karachi, Pakistan as a case study. PLOS Neglected Trop. Dis. 2020, 14, e0008791. [Google Scholar] [CrossRef] [PubMed]
  24. Rahman, A.; Lee, H.; Khan, M. Domestic water contamination in rapidly growing megacities of asia: Case of Karachi, Pakistan. Environ. Monit. Assess. 1997, 44, 339–360. [Google Scholar] [CrossRef]
  25. EPA. Drinking Water Unit. In Quick Guide To Drinking Water Sample Collection, 2nd ed.; Region 8 Laboratory: Lakewood, CO, USA, September 2016. [Google Scholar]
  26. Reemtsma, T.; Weiss, S.; Mueller, J.; Petrovic, M.; González, S.; Barcelo, D.; Ventura, F.; Knepper, T.P. Polar Pollutants Entry into the Water Cycle by Municipal Wastewater: A European Perspective. Environ. Sci. Technol. 2006, 40, 5451–5458. [Google Scholar] [CrossRef]
  27. Bolster, C.H.; Bromley, J.M.; Jones, S.H. Recovery of Chlorine-Exposed Escherichia coli in Estuarine Microcosms. Environ. Sci. Technol. 2005, 39, 3083–3089. [Google Scholar] [CrossRef]
  28. Tomás-Callejas, A.; López-Velasco, G.; Valadez, A.M.; Sbodio, A.; Artés-Hernández, F.; Danyluk, M.D.; Suslow, T.V. Evaluation of Current Operating Standards for Chlorine Dioxide in Disinfection of Dump Tank and Flume for Fresh Tomatoes. J. Food Prot. 2012, 75, 304–313. [Google Scholar] [CrossRef]
  29. Lukubye, B.; Andama, M. Bacterial analysis of selected drinking water sources in Mbarara Municipality, Uganda. J. Water Resour. Prot. 2017, 9, 999–1013. [Google Scholar] [CrossRef]
  30. Ali, B.; Khan, A.; Ali, S.S.; Khan, H.; Alam, M.; Ali, A.; Alrefaei, A.F.; Almutairi, M.H.; Kim, K.I. Heavy Metals and Microbial Diversity: A Comparative Analysis of Rivers Swat and Kabul. Water 2023, 15, 3297. [Google Scholar] [CrossRef]
  31. Ali, J.; Hussain, A.; Abid, H. The occurrence of coliforms bacteria in water reservoir at different schools of district Peshawar. Pak. J. Biochem. Mol. Biol. 2011, 44, 64–67. [Google Scholar]
  32. Anwar, M.S.; Lateef, S.H.A.H.L.A.; Siddiqi, G.M. Bacteriological quality of drinking water in Lahore. Biomedica 2010, 26, 66–69. [Google Scholar]
  33. Kothari, V.; Vij, S.; Sharma, S.; Gupta, N. Correlation of various water quality parameters and water quality index of districts of Uttarakhand. Environ. Sustain. Indic. 2021, 9, 100093. [Google Scholar] [CrossRef]
  34. WHO. Guidelines for Drinking-Water Quality, 4th ed.; WHO: Geneva, Switzerland, 2011; pp. 104–108. [Google Scholar]
  35. van der Wielen, P.W.; Dignum, M.; Donocik, A.; Prest, E.I. Influence of Temperature on Growth of Four Different Opportunistic Pathogens in Drinking Water Biofilms. Microorganisms 2023, 11, 1574. [Google Scholar] [CrossRef] [PubMed]
  36. Adjovu, G.E.; Stephen, H.; James, D.; Ahmad, S. Measurement of Total Dissolved Solids and Total Suspended Solids in Water Systems: A Review of the Issues, Conventional, and Remote Sensing Techniques. Remote Sens. 2023, 15, 3534. [Google Scholar] [CrossRef]
  37. Panjwani, S. Drinking water quality and environmental monitoring in rural areas of district Malir Karachi. Master’s Thesis, Dawood University of Engineering and Technology Karachi, Karachi, Pakistan, 2018. Available online: https://urn.fi/URN:NBN:fi:oulu-201805312006 (accessed on 1 October 2023).
  38. Wilson, W.; Gonthier, J.N.; Georget, F.; Scrivener, K.L. Insights on chemical and physical chloride binding in blended cement pastes. Cem. Concr. Res. 2022, 156, 106747. [Google Scholar] [CrossRef]
  39. Çadraku, H.S. Groundwater Quality Assessment for Irrigation: Case Study in the Blinaja River Basin, Kosovo. Civ. Eng. J. 2021, 7, 1515–1528. [Google Scholar] [CrossRef]
  40. Mahamba, C.; Palamuleni, L.G. Antimicrobial activity of sunflower (Helianthus annuus) seed for household domestic water treatment in Buhera District, Zimbabwe. Int. J. Environ. Res. Public Health 2022, 19, 5462. [Google Scholar] [CrossRef]
  41. Zhang, H.; Cheng, S.; Li, H.; Fu, K.; Xu, Y. Groundwater pollution source identification and apportionment using PMF and PCA-APCA-MLR receptor models in a typical mixed land-use area in Southwestern China. Sci. Total. Environ. 2020, 741, 140383. [Google Scholar] [CrossRef]
  42. Fasaee, M.A.K.; Berglund, E.; Pieper, K.J.; Ling, E.; Benham, B.; Edwards, M. Developing a framework for classifying water lead levels at private drinking water systems: A Bayesian Belief Network approach. Water Res. 2021, 189, 116641. [Google Scholar] [CrossRef]
  43. Dey, S.; Botta, S.; Kallam, R.; Angadala, R.; Andugala, J. Seasonal variation in water quality parameters of Gudlavalleru Engineering College pond. Curr. Res. Green Sustain. Chem. 2021, 4, 100058. [Google Scholar] [CrossRef]
  44. Atangana, E. An indices-based water quality model to evaluate surface water quality: A case study in Vaalwaterspruit, Mpumalanga, South Africa. J. Afr. Earth Sci. 2023, 205, 105001. [Google Scholar] [CrossRef]
  45. Trabelsi, R.; Zouari, K. Coupled geochemical modeling and multivariate statistical analysis approach for the assessment of groundwater quality in irrigated areas: A study from North Eastern of Tunisia. Groundw. Sustain. Dev. 2019, 8, 413–427. [Google Scholar]
  46. Some, S.; Mondal, R.; Mitra, D.; Jain, D.; Verma, D.; Das, S. Microbial pollution of water with special reference to coliform bacteria and their nexus with environment. Energy Nexus 2021, 1, 100008. [Google Scholar] [CrossRef]
  47. Wen, X.; Chen, F.; Lin, Y.; Zhu, H.; Yuan, F.; Kuang, D.; Jia, Z.; Yuan, Z. Microbial Indicators and Their Use for Monitoring Drinking Water Quality—A Review. Sustainability 2020, 12, 2249. [Google Scholar] [CrossRef]
  48. Brown, R.M.; McClelland, N.I.; Deininger, R.A.; O’Connor, M.F. A Water Quality Index—Crashing the Psychological Barrier. In Indicators of Environmental Quality; Springer: Boston, MA, USA, 1972; pp. 173–182. [Google Scholar] [CrossRef]
  49. Vaseashta, A.; Gevorgyan, G.; Kavaz, D.; Ivanov, O.; Jawaid, M.; Vasović, D. Exposome, Biomonitoring, Assessment and Data Analytics to Quantify Universal Water Quality. In Water Safety, Security and Sustainability; Advanced Sciences and Technologies for Security Applications; Springer: Cham, Switzerland, 2021; pp. 67–114. [Google Scholar] [CrossRef]
  50. Azupogo, U.W.; Achore, M.; Dery, F.A.; Bisung, E. Health implications of coping with water insecurity at the household level. Water Secur. 2023, 19, 100135. [Google Scholar] [CrossRef]
  51. Rosinger, A.Y.; Young, S.L. The toll of household water insecurity on health and human biology: Current understandings and future directions. WIREs Water 2020, 7, e1468. [Google Scholar] [CrossRef]
  52. Fida, M.; Li, P.; Wang, Y.; Alam, S.M.K.; Nsabimana, A. Water Contamination and Human Health Risks in Pakistan: A Review. Expo. Health 2023, 15, 619–639. [Google Scholar] [CrossRef]
  53. Schwarzenbach, R.P.; Egli, T.; Hofstetter, T.B.; Von Gunten, U.; Wehrli, B. Global water pollution and human health. Annu. Rev. Environ. Resour. 2010, 35, 109–136. [Google Scholar] [CrossRef]
  54. Wutich, A.; Brewis, A.; Tsai, A. Water and mental health. WIREs Water 2020, 7, e1461. [Google Scholar] [CrossRef]
  55. Ahmed, F.; Shahid, M.; Cao, Y.; Qureshi, M.G.; Zia, S.; Fatima, S.; Guo, J. A Qualitative Exploration in Causes of Water Insecurity Experiences, and Gender and Nutritional Consequences in South-Punjab, Pakistan. Int. J. Environ. Res. Public Health 2021, 18, 12534. [Google Scholar] [CrossRef]
Figure 1. The study area location map encompasses Karachi, Sindh, Pakistan, using the Geographic Information System (GIS). (a) represents the overall map of Pakistan highlighting the location of study area while (b) shows the sampling sites in the study area.
Water 15 03987 g001
Figure 2. Principal Component Analysis (PCA) of physicochemical and biological parameters of drinking water samples collected from different districts of Karachi. (a) Malir with biplot (axes F1 and F2: 48.39%); (b) Karachi West with biplot (axes F1 and F2: 46.76%); (c) Karachi East with biplot (axes F1 and F2: 47.01%); (d) Karachi South with biplot (axes F1 and F2: 55.70%); (e) Karachi Central with biplot (axes F1 and F2: 55.27%). The loadings of the variables, eigenvectors, in blue while the parameters in red dots with labels are shown, in relation to the first two components (F1 and F2).
Water 15 03987 g002
Figure 3. Coliform and E. coli percentages in each district of Karachi reveal important information about the water quality and potential health risks associated with the study area.
Water 15 03987 g003
Figure 4. Potable and non-potable water percentage reveals important information about the availability of safe drinking water in each district of Karachi.
Water 15 03987 g004
Figure 5. Water quality status (WQS) in the study area reveals the poor quality of water and its unsuitability for consumption with high values of 207, 312.2, 189.7, 176.9, and 176.1 for District Malir, Karachi West, Karachi East, Karachi South, and Karachi Central.
Water 15 03987 g005
Table 1. Principal component analysis (PCA) of physicochemical and microbiological parameters for District Malir samples (n = 30).
F1F2F3F4F5
Temperature0.242−0.594−0.4440.161−0.001
Turbidity−0.0460.588−0.3730.558−0.243
Color0.4510.666−0.2590.285−0.014
Ph−0.2030.3990.178−0.5320.176
Alkalinity0.9560.0960.002−0.1340.023
Chloride0.9780.058−0.023−0.1160.007
T.Hard0.9740.0520.007−0.095−0.022
EC−0.2070.5480.6170.159−0.002
TDS0.9820.0520.028−0.1100.013
Nitrate0.450−0.3710.5760.3000.048
R/Cl−0.1560.121−0.425−0.1330.696
Coliform−0.1450.001−0.217−0.494−0.668
E. coli−0.005−0.3740.0410.373−0.042
Eigenvalue4.3791.9111.3781.2711.027
Variability (%)33.68214.70310.6049.7747.896
Cumulative %33.68248.38558.98968.76376.659
Note: Bold values denote statistical significance at the F < 0.05 level.
Table 2. Principal component analysis (PCA) of physicochemical and microbiological parameters for District Karachi West samples (n = 31).
F1F2F3F4F5
Temperature0.2200.5920.1600.446−0.090
Turbidity0.506−0.203−0.4050.2400.511
Color0.640−0.089−0.3830.1530.430
Ph−0.3660.0860.5460.0690.409
Alkalinity0.892−0.1290.240−0.003−0.244
Chloride0.9680.0120.096−0.0540.027
T.Hard0.966−0.0030.164−0.030−0.130
EC−0.1740.455−0.3680.113−0.329
TDS mg/L0.9410.0030.191−0.085−0.144
Nitrate0.1420.677−0.055−0.2960.398
R/Cl−0.184−0.2700.4390.7030.103
Coliform−0.155−0.4750.205−0.4920.117
E. coli0.0560.4230.454−0.2410.218
Eigenvalue4.5131.5661.3441.1901.058
Variability (%)34.71212.04810.3379.1528.137
Cumulative %34.71246.76057.09866.25074.387
Note: Bold values denote statistical significance at the F < 0.05 level.
Table 3. Principal component analysis (PCA) of physicochemical and microbiological parameters for District Karachi East samples (n = 30).
F1F2F3F4F5
Temperature0.093−0.1150.700−0.2230.335
Turbidity−0.3730.236−0.351−0.2770.517
Color0.1280.7580.216−0.2720.207
Ph0.3540.6110.186−0.123−0.432
Alkalinity0.8000.273−0.101−0.122−0.077
Chloride0.964−0.135−0.059−0.0860.078
T.Hard0.927−0.158−0.168−0.038−0.022
EC0.698−0.367−0.0070.0100.026
TDS0.965−0.133−0.083−0.0580.058
Nitrate0.6250.3870.0840.3530.153
R/Cl−0.1790.109−0.535−0.355−0.439
Coliform−0.097−0.1870.610−0.210−0.433
E. coli−0.0530.2390.0250.820−0.097
Eigenvalue4.5711.5401.4101.2111.039
Variability (%)35.16011.84610.8439.3127.993
Cumulative %35.16047.00757.85067.16175.154
Note: Bold values denote statistical significance at the F < 0.05 level.
Table 4. Principal component analysis (PCA) of physicochemical and microbiological parameters for District Karachi South samples (n = 30).
F1F2F3F4F5
Temperature−0.2850.3860.7380.039−0.047
Turbidity NTU−0.5800.606−0.3120.118−0.005
Color−0.5920.694−0.081−0.090−0.007
Ph0.609−0.4170.197−0.016−0.406
Alkalinity0.8590.392−0.0440.0110.113
Chloride0.8760.354−0.0180.0110.128
T.Hard0.8160.431−0.014−0.0010.221
EC−0.072−0.1760.731−0.0110.532
TDS0.9160.316−0.012−0.0060.113
Nitrate0.7330.107−0.089−0.010−0.252
R/Cl−0.028−0.402−0.442−0.5370.468
Coliform−0.5460.513−0.037−0.1570.010
E. coli−0.084−0.203−0.2730.8490.294
Eigenvalue4.9962.2451.5031.0590.911
Variability (%)38.43517.26811.5648.1457.005
Cumulative %38.43555.70267.26675.41182.416
Note: Bold values denote statistical significance at the F < 0.05 level.
Table 5. Principal component analysis (PCA) of physicochemical and microbiological parameters for District Karachi Central samples (n = 31).
F1F2F3F4F5
Temperature0.149−0.6380.094−0.2730.317
Turbidity0.0120.7710.548−0.1690.130
Color0.0150.8300.466−0.1700.099
Ph0.1900.296−0.2700.7860.217
Alkalinity0.9320.070−0.1340.012−0.096
Chloride0.910−0.035−0.079−0.261−0.247
T.Hard0.935−0.1410.019−0.151−0.183
EC0.607−0.2390.1490.2830.503
TDS0.959−0.158−0.0690.0030.086
Nitrate0.6760.6090.1740.0310.147
R/Cl−0.146−0.115−0.233−0.4260.633
Coliform−0.002−0.5290.7440.179−0.054
E. coli0.036−0.4870.7730.148−0.032
Eigenvalue4.3992.7871.8861.1570.965
Variability (%)33.83721.43514.5088.9017.427
Cumulative %33.83755.27369.78178.68286.108
Note: Bold values denote statistical significance at the F < 0.05 level.
Table 6. Water quality classification in the study area based on water quality index (WQI) values including water quality status (WQS) and water quality grading (WQG) [5].
WQI LevelWQSWQG
0–25ExcellentA
26–50GoodB
51–75PoorC
76–100Very poorD
>100Unfit for consumptionE
Disclaimer/Publisher’s Note: The statements, opinions and data contained in all publications are solely those of the individual author(s) and contributor(s) and not of MDPI and/or the editor(s). MDPI and/or the editor(s) disclaim responsibility for any injury to people or property resulting from any ideas, methods, instructions or products referred to in the content.

