The Failure Risk Analysis of the Water Supply Network
Abstract
:1. Introduction
2. Method for Assessing the Risk in Water Distribution Subsystems
- or a continuous random variable:
- for the discrete variable:
- Ci—an independent variable describing the specific loss value;
- P(C)—the probability of the adverse events in the interval [0,C];
- Pj—the probability, that a loss will result from an adverse event;
- i = 1, 2, …, n and C0 = 0;
- n—number of intervals describing the loss parameter C;
- j = 1, 2, …, m and P0 = 0;
- m—number of intervals describing the probability parameter P.
- Ci—hazard consequences (assumed depending on the type of water supply network, according to Table 1);
- Pj—hazard occurrence probability (assumed depending on the failure rate λ, according to Table 2);
- Vk—vulnerability to hazards (adopted on the basis of the risk factors, according to Table 3 and Formula (5)).
- i—point weight for parameter C, i = {1,2,3};
- j—point weight for parameter P, j = {1,2,3};
- k—point weight for parameter V, k = {1,2,3}.
- For the loss parameter Ci. Evaluation criteria were adopted depending on the number of inhabitants (LM) exposed to the possibility of a hazard resulting in a shortage or restriction of a water supply according to Table 1.
| Point Weight (i) | Parameter Description (Inhabitants LM) |
|---|---|
| 1 | 1–5000 |
| 2 | 5001–50,000 |
| 3 | >50,000 |
- For the probability parameter Pj the evaluation criteria i were adopted depending on the failure rate value λ of the water supply network or exceedances. Table 2 proposes a procedure for the evaluation of the parameter Pj depending on the range of the frequency of occurrence of a failure event or failure rate and the different types of water mains: mains (M), distribution (D), water supply connections (WC).
| Point Weight (j) | Parameter Description | Range of Incidence Emergency Event/Exceedance fi [Event/a] | OR | λ [no. of Failures⋅km−1⋅a−1] | ||
| M | D | WC | ||||
| 1 | unlikely | ≤0.1 | ≤0.3 | ≤0.5 | ≤1 | |
| 2 | medium probability | (0.1–2> | (0.3–0.5> | (0.5–1> | (1.0–2> | |
| 3 | likely | >2 | ≥0.5 | ≥1 | ≥2 | |
- For the vulnerability parameter Vk. The vulnerability parameter is complex and its magnitude can be influenced by various factors depending on the technical conditions of the network itself (e.g., type of material), but also on the type of hazard under consideration, for which the risk is analyzed. Therefore, the procedure to value this parameter is complex. For this purpose, an original method for the analysis of this parameter is proposed. The VIM method is based on the identification of factors influencing the degree of vulnerability. The proposed method is based on the classification of vulnerability factors on the water supply network and the assignment of Ri ranking point values and wij point weights to them, followed by the calculation of the vulnerability index (VI) according to Formula (5). In the first step of the analysis, the factors that can affect the vulnerability of the network to a given type of failure (e.g., water pipe failure resulting in water leakage, secondary water contamination in the network, pipe leakage, fittings failure) should be identified.
- VI—vulnerability index;
- Ri—rank of ith risk factor (degree of importance);
- wij—weight jth of this factor;
- i = 1, 2 …, n;
- n—number of factors taken into account;
- j = 1, 2, 3.
- (0–1]—neglected,
- [2–3]—low importance,
- [4–6]—moderately important,
- [7–8]—important,
- [9–10]—very important.
| Influencing Factor | Rank Ri | Weight of the Factor wij | ||
|---|---|---|---|---|
| Low = 1 | Medium = 2 | High = 3 | ||
| Age of the water supply network | 9 | to 10 years | (10–30) years | >30 years |
| Network material | 6 | plastics | steel | grey cast iron |
| Hydrogeological factors influencing the network | 8 | good | average | bad |
| Monitoring of the network operations | 5 | above standard comprehensive monitoring of the water distribution network through the measurement of water pressure and flow rates. possession of specialized equipment for detecting water leaks using acoustic methods, unrestricted 24-h communication with the public via a dedicated phone line, monitoring of water quality within the WDN through a protection and warning system | standard simplified monitoring of the water distribution network, primarily through pressure measurements, inability to promptly respond to minor leaks. periodic water quality testing within the water distribution network | none lack of monitoring of network and water quality |
| Measures taken to prevent corrosion | 4 | full | standard | none |
| Network location—including factors such as dynamic loads and density of underground components | 3 | small pipeline in the not urbanized areas | average pipeline in the street | big pipeline in the pedestrian traffic |
| Hydraulic conditions within the network | 7 | good favorable working conditions of the water supply network: v = 1.0–1.5 m/s, water age < 24 h, smooth pressure regulation depending on hourly water consumption | average average conditions of waterworks network operation: network in mixed, v = 0.5–1.0 m/s, water age < 24–48 h, pressure regulation depending on hourly water consumption | bad unfavorable conditions of waterworks network operation: network in open system, v < 0.5 m/s, water age > 48 h, no pressure regulation depending on hourly water consumption |
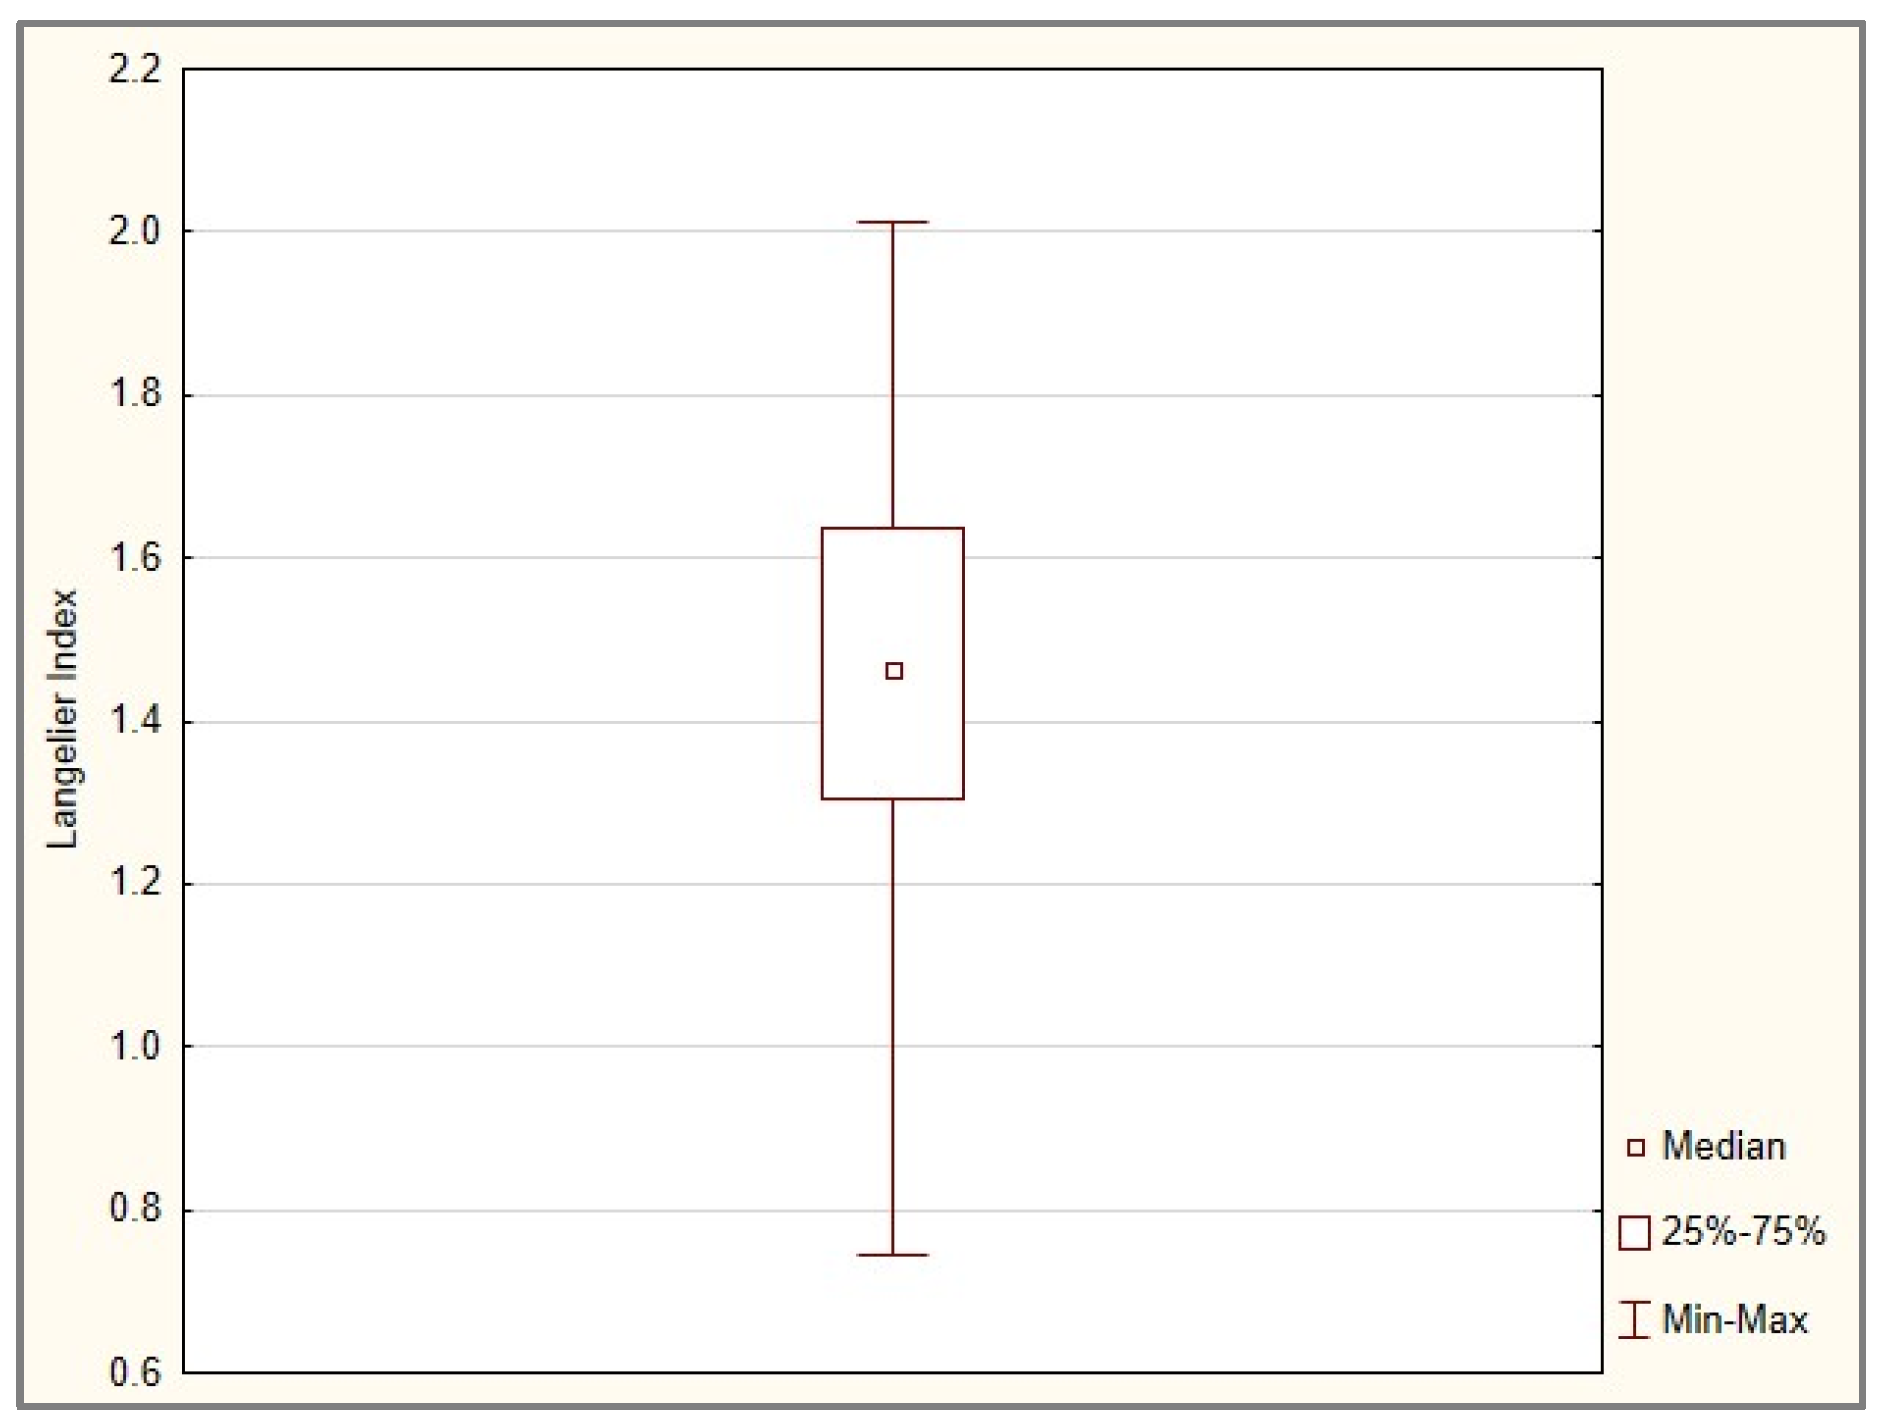
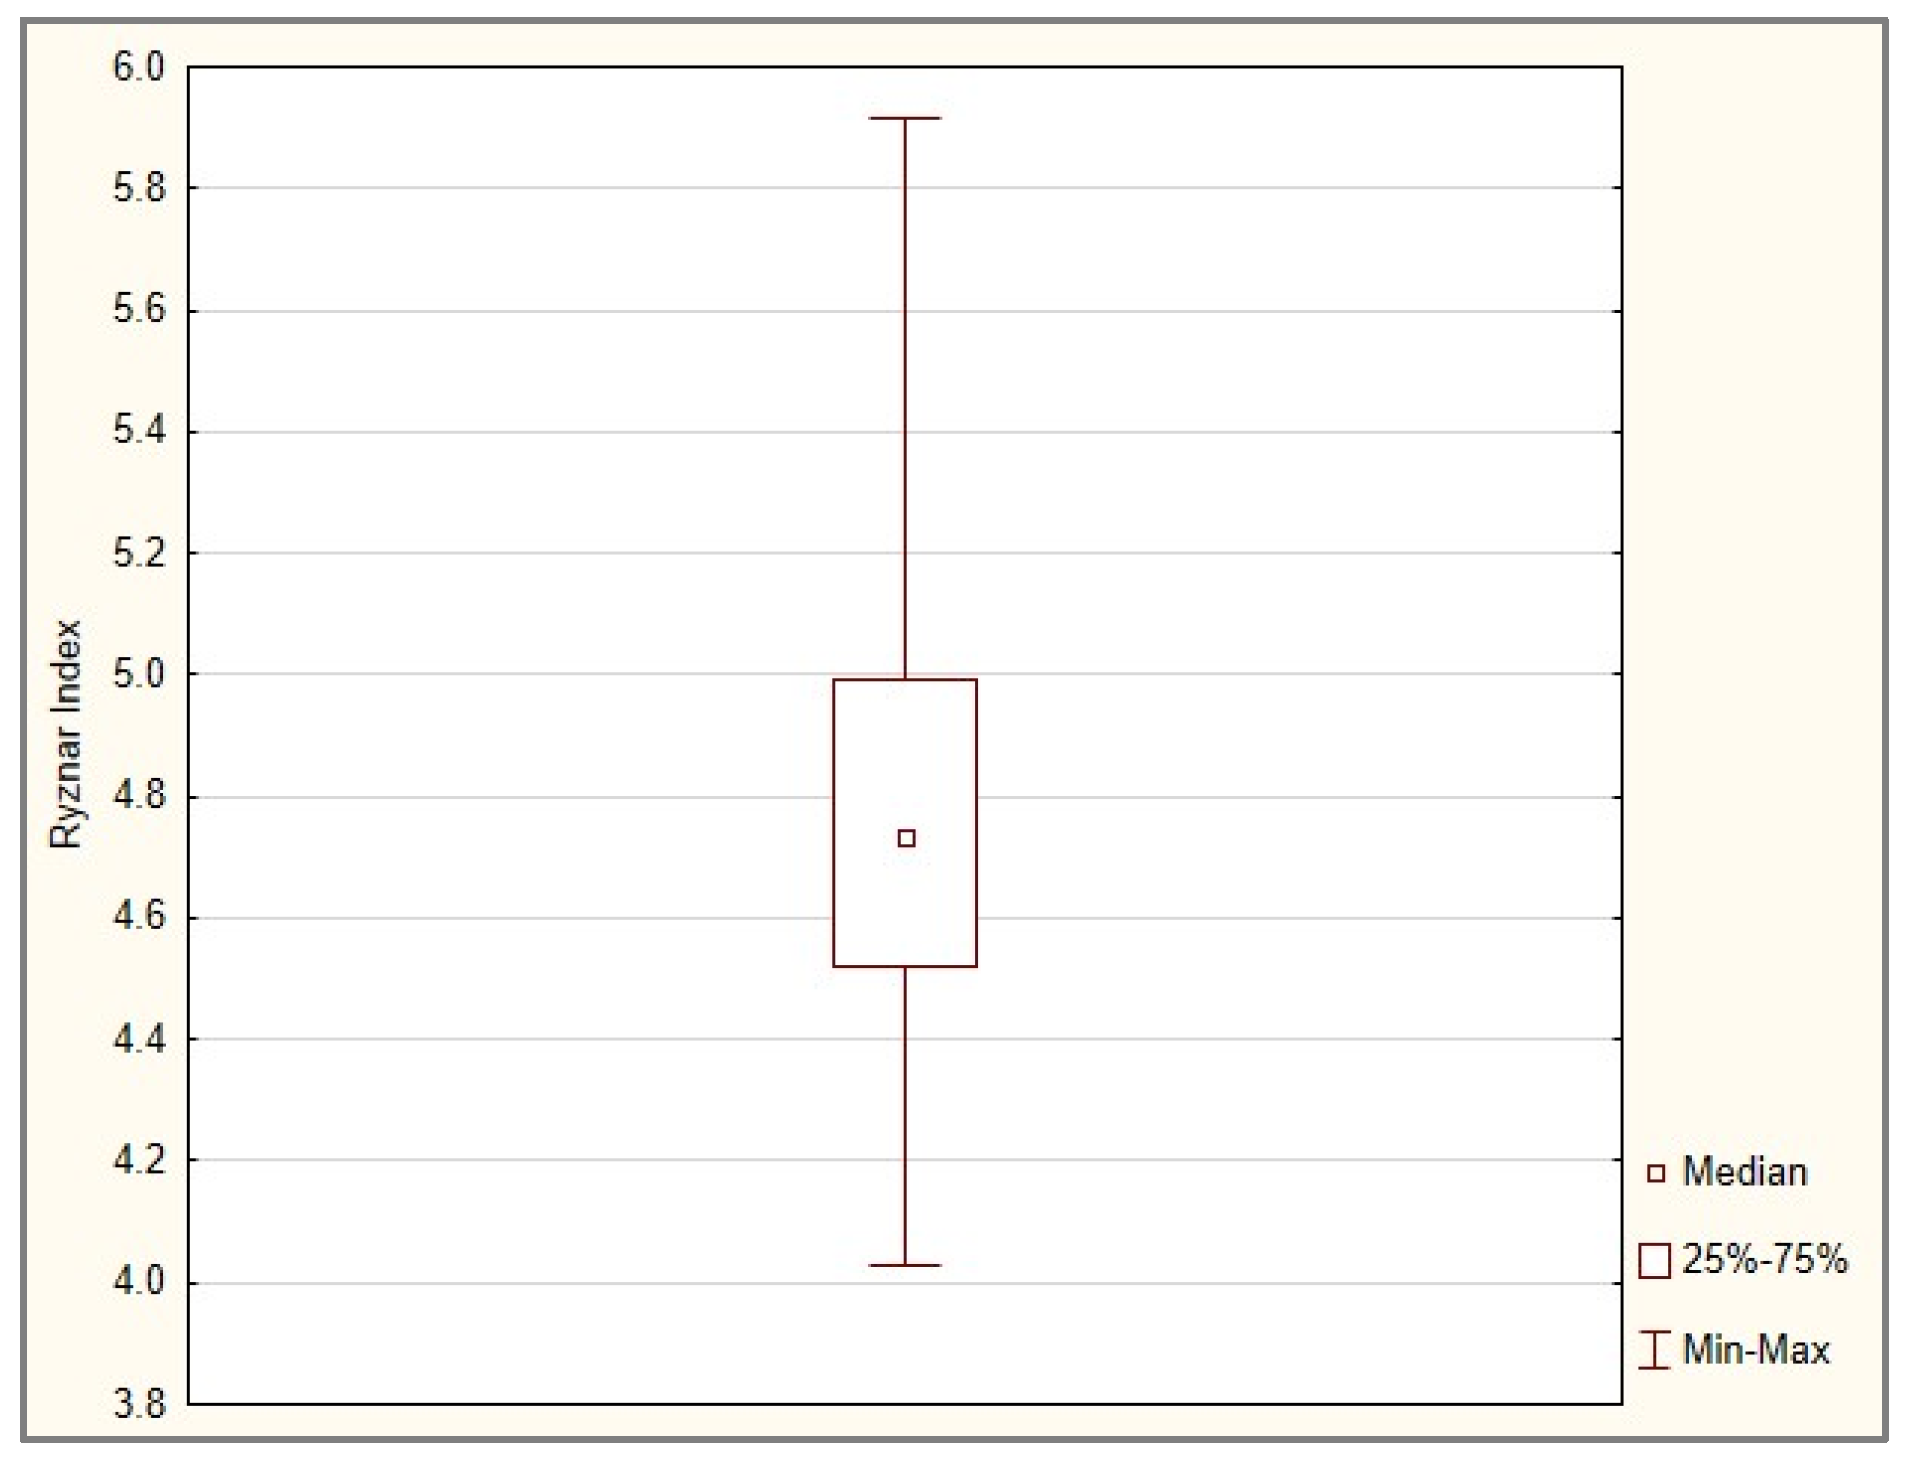
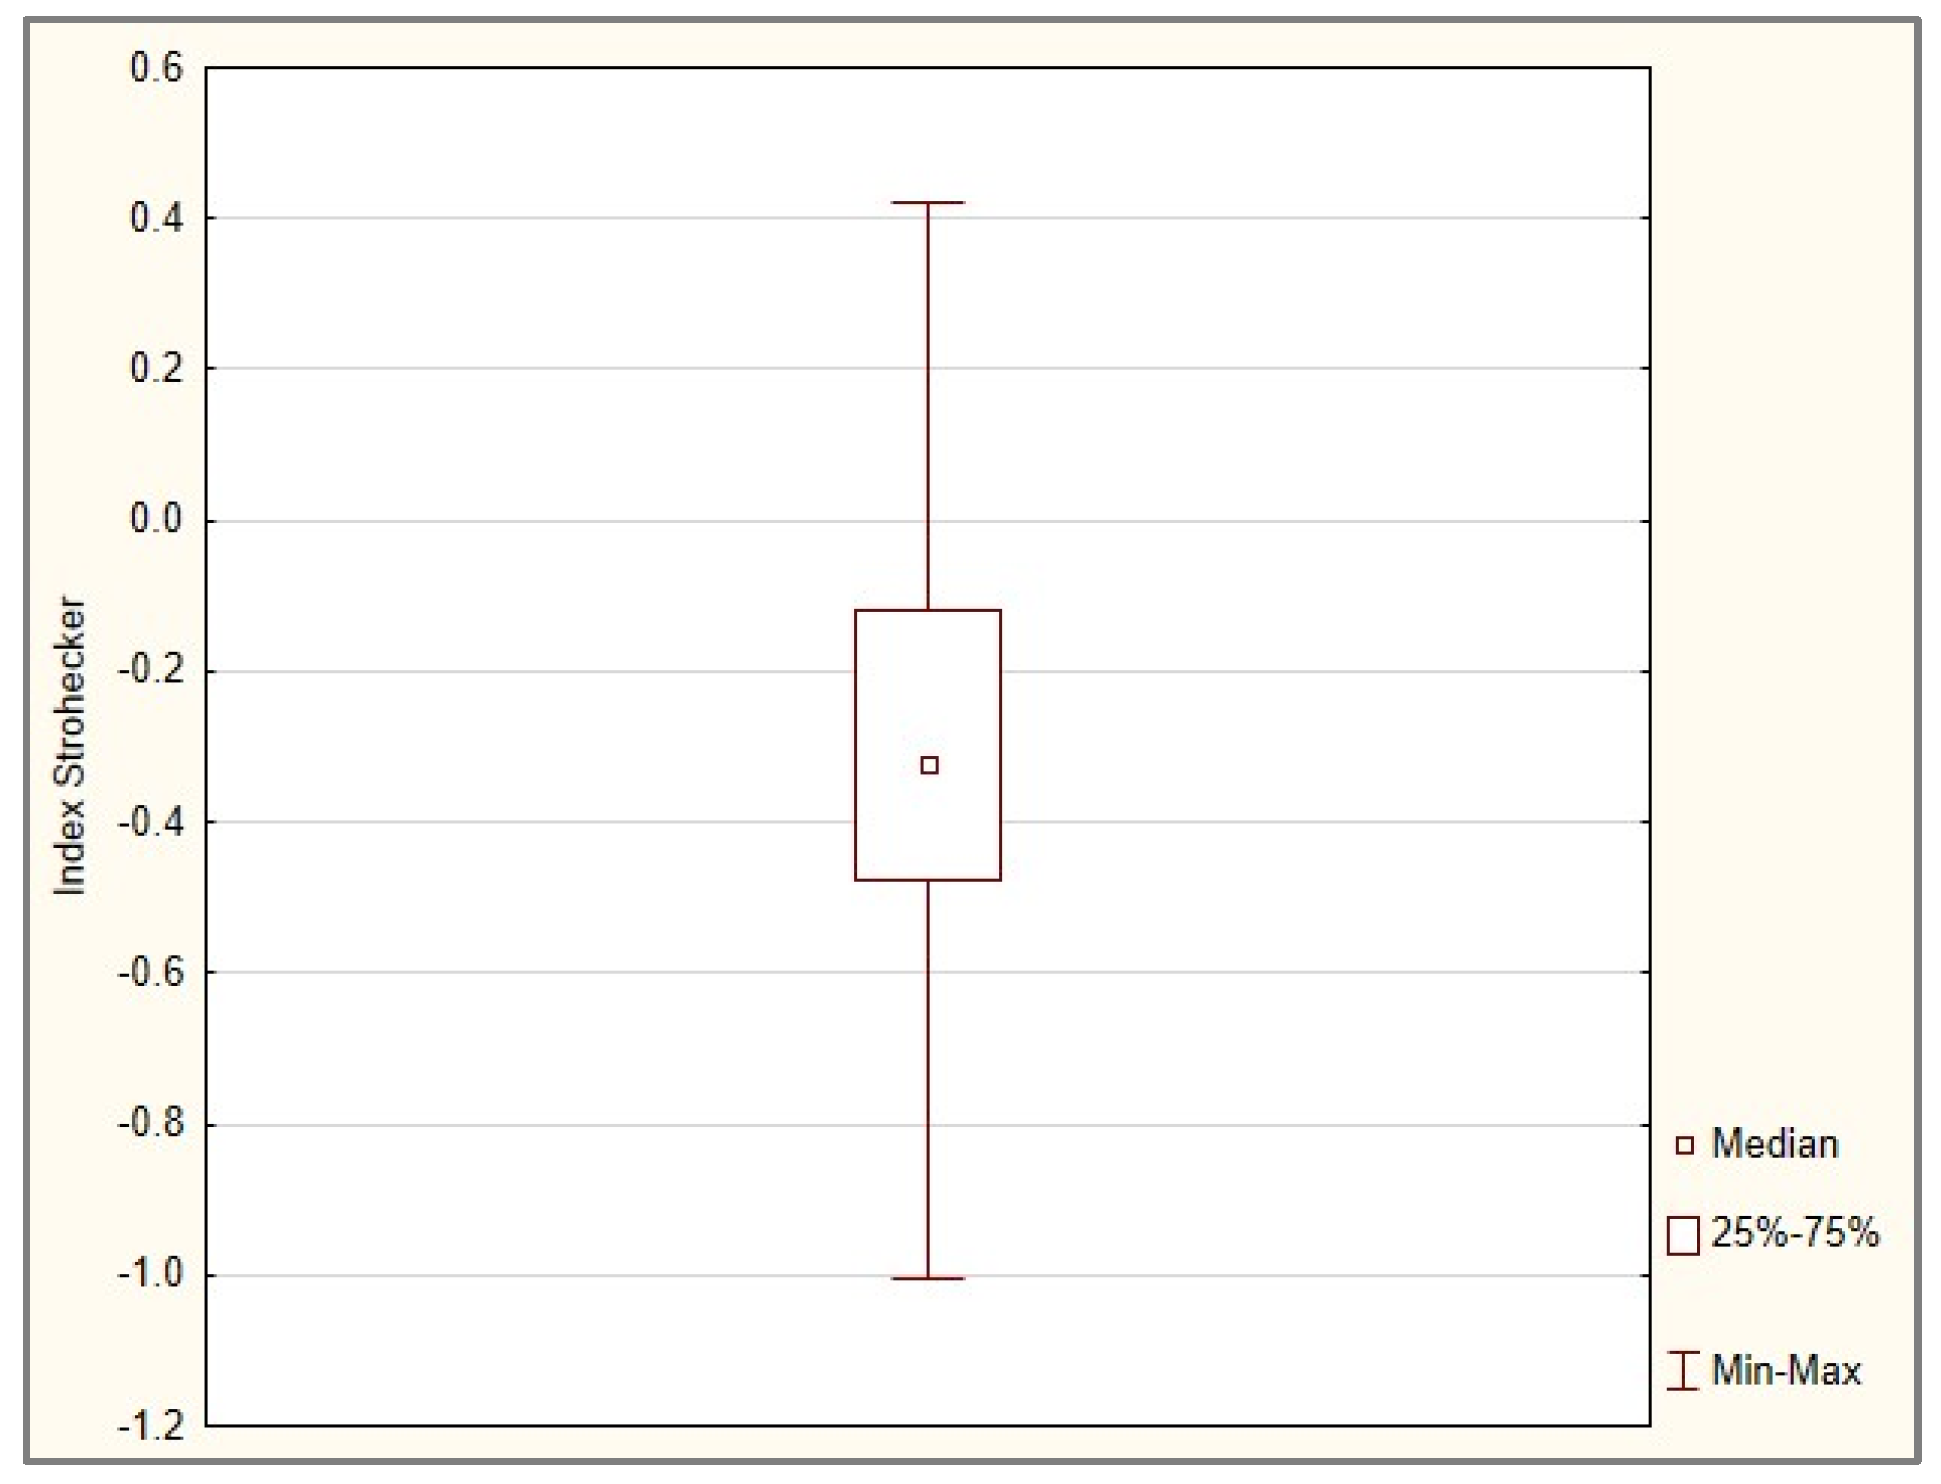
| Chemical stability of the water supplied by the network * | 8 | low water is chemically stable with the following parameters: Langelier saturation index IL = 0, or Ryznar index IR = 6.2–6.8, or Strohecker index Ist < 0.5) [73,74,75] | medium mild corrosion, does not produce protective CaCO3 layers, with the following parameters: Langelier Saturation Index IL = −3 to 4, or Ryznar Index IR = less than 8.5, or Strohecker Index Ist > 0.5, except when there is low susceptibility (Langelier Saturation Index IL = 0 and Ryznar Index IR = 6.2–6.8) and high susceptibility (Langelier Saturation Index IL = 3 to 4 and Ryznar Index IR = less than 5.5) [73,74,75] | high rapid corrosion, does not produce protective CaCO3 layers, with the following parameters: Langelier Saturation Index IL = −4 to −5, or Ryznar Index IR = more than 8.5 and less than 5.5 or Strohecker Index Ist > 0.5, or Langelier Saturation Index IL = 3 to 4, or Ryznar Index IR = less than 5.5, or Strohecker Index Ist > 0.5 [73,74,75] |
3. Characteristics of the Study Object
- Water intake and pumping subsystem.
- Water treatment subsystem.
- Water transmission subsystem.
- Water storage subsystem.
- Water distribution subsystem (water supply network with utilities).
- Accident events causing losses on a small scale, but occurring relatively frequently. These types of events include failures of the water distribution network and water supply connections, failures of individual devices.
- Emergency events causing medium-scale losses that occur relatively rarely. These include failures in water mains, incidental contamination in the source of intake water.
- Catastrophic events that occur relatively rarely but cause significant losses.
- Adverse events in the water distribution subsystem can therefore be divided into:
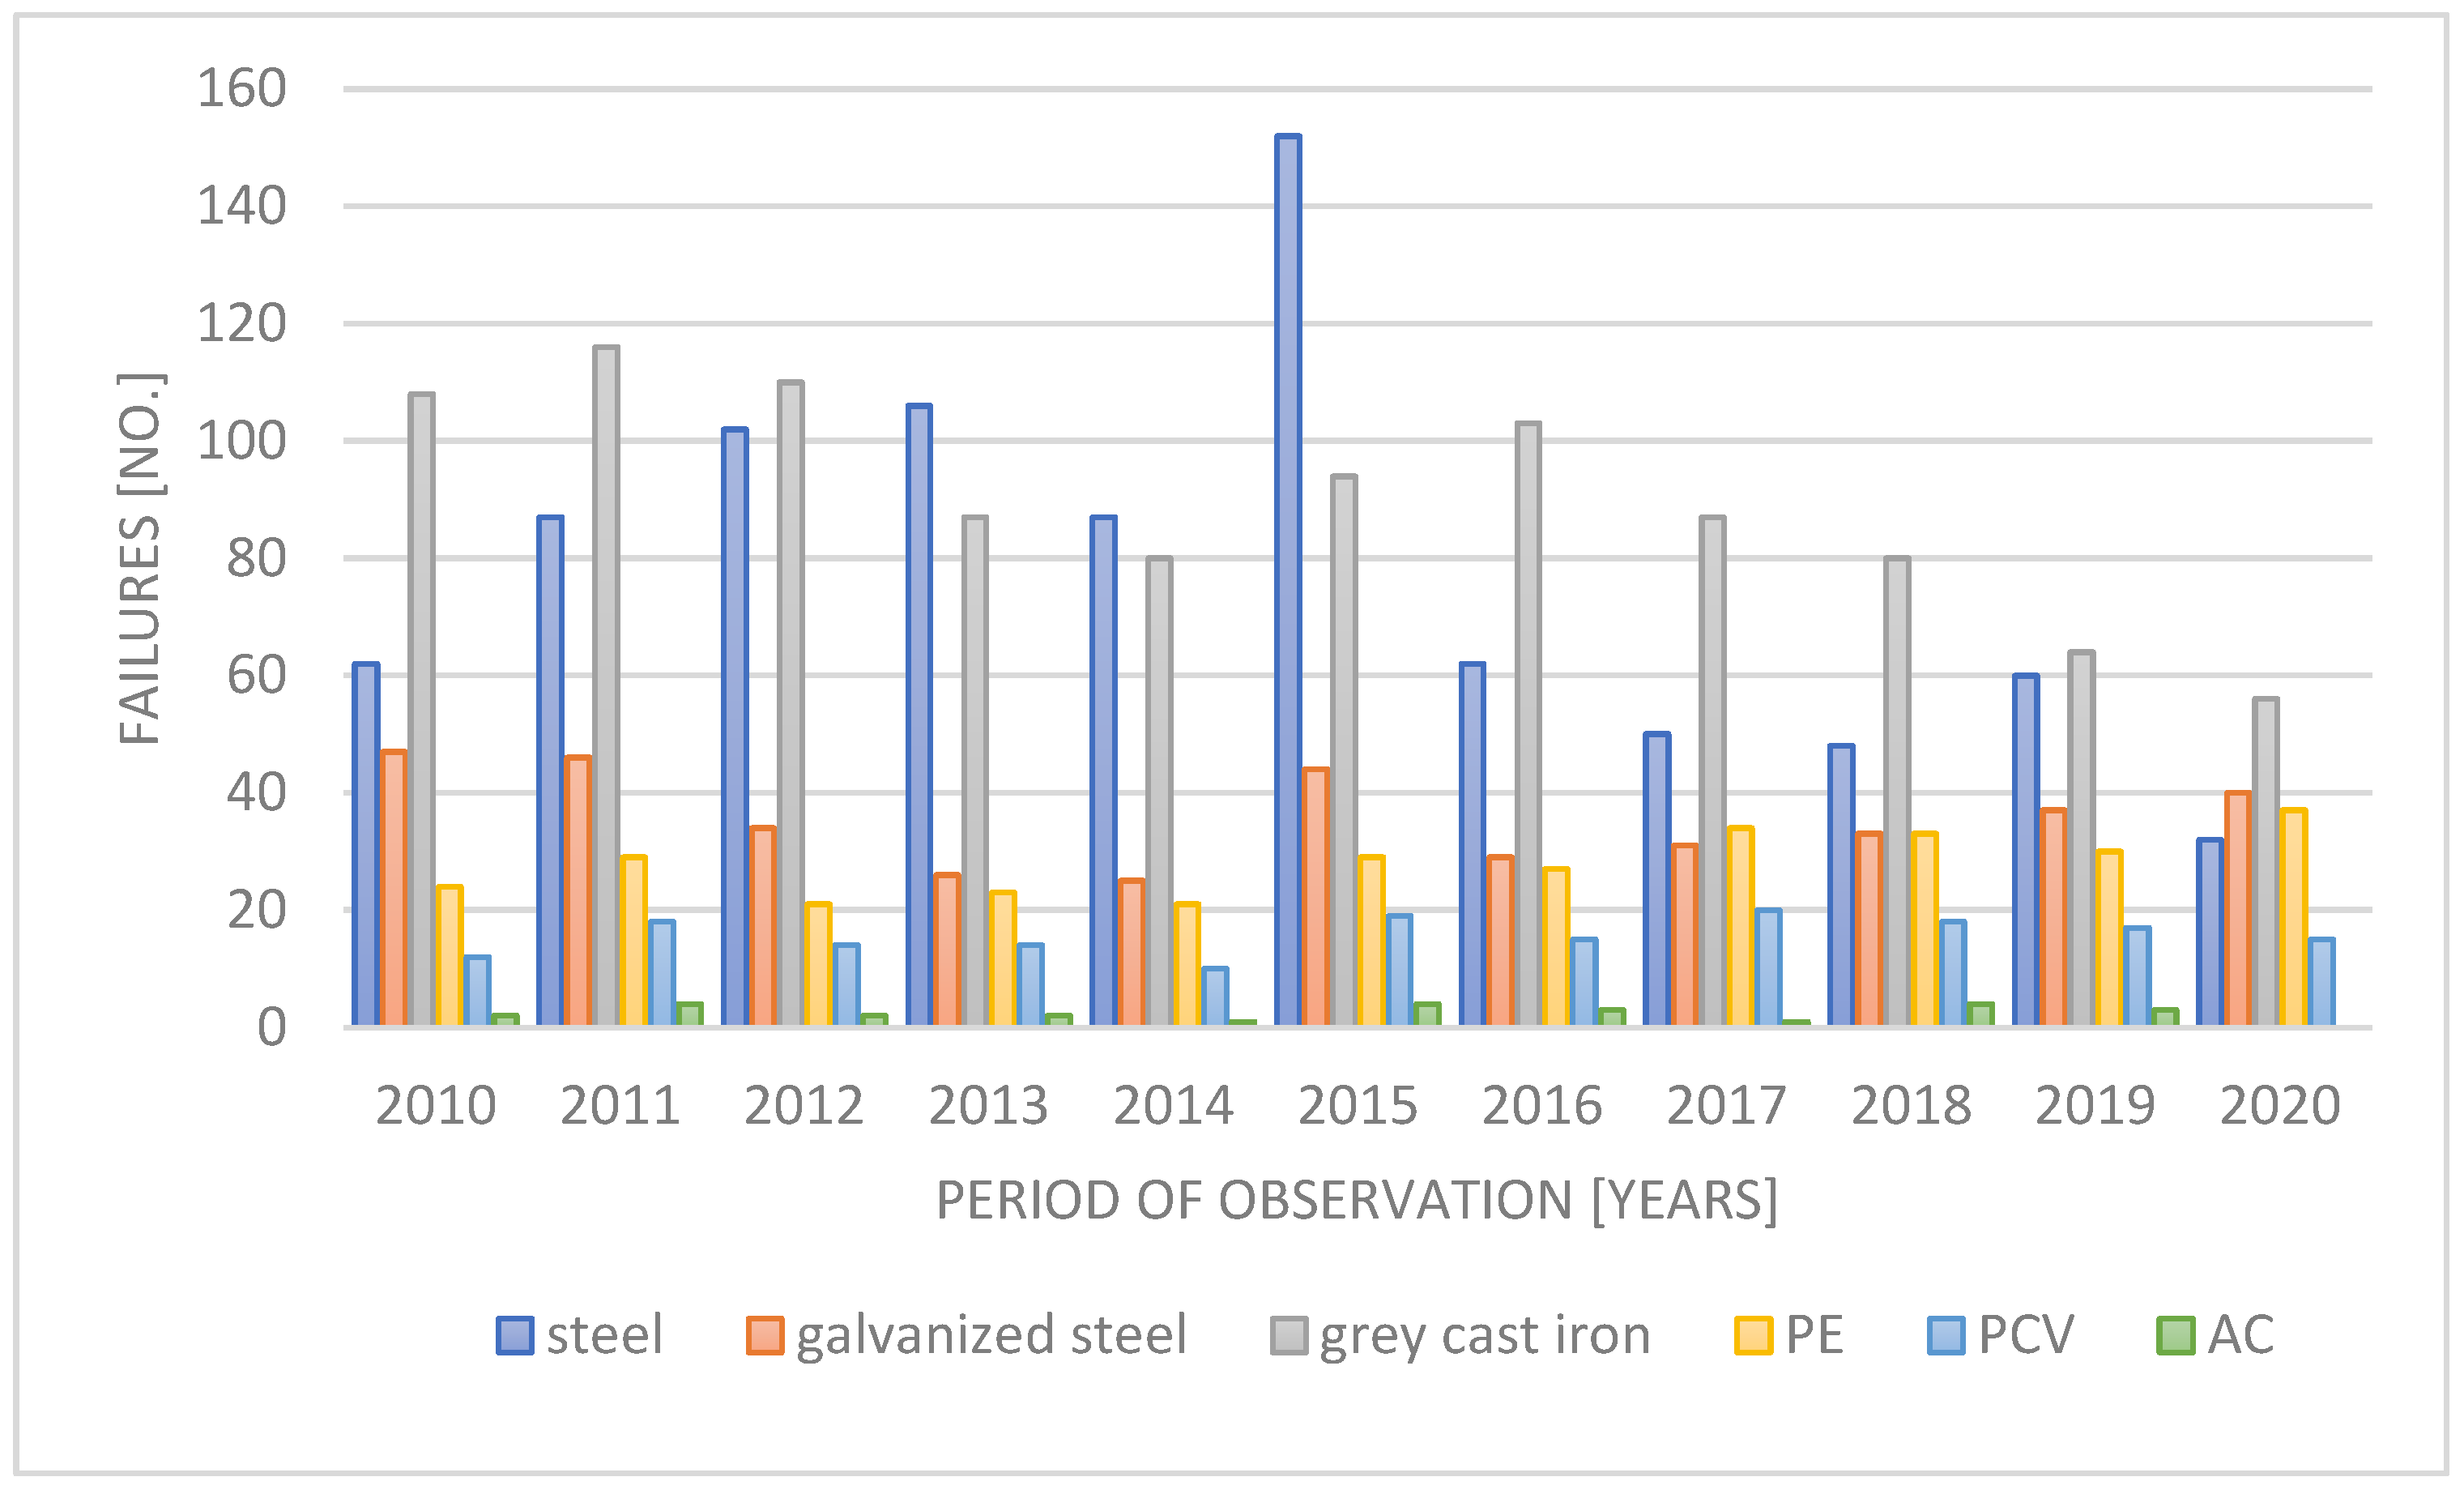
- Failures of water supply lines and fittings (e.g., material defects, corrosive soil, too high pressure, age of the pipes).
- Secondary water pollution in the water supply network.
- Failures of water supply pumping stations.
- Incidental events, i.e., contamination of water sources, failures of water treatment plants, water contamination in network water supply tanks.
- Action of forces of nature (droughts, landslides, rainfall).
- Actions of third parties (acts of vandalism, terrorist and cyberterrorist attacks).
- The effects of the above-mentioned events are:
- Interruptions in water supply or its complete lack.
- Secondary contamination of tap water.
- Loss of safety of water consumers due to consumption of poor quality water.
- Financial losses related to the purchase of bottled water, medical costs.
- Water losses and financial losses incurred by the water supply company related to network flushing, network disinfection, costs of repairing failures, lack of water sales.
- Compensation paid to water consumers.
- Washing out of the bottom layer of the substrate due to the action of water flowing from the damaged pipe, which results in unsealing of subsequent sections of the network.
- Loss of trust in the water recipient–water supplier relationship.
- Preliminary stage (research preparation).
- Analysis of the structure of facilities and the process of their operation and functioning.
- Obtaining and verifying operational data.
- Processing the collected data and determining reliability characteristics objects.
- Use of processed data (research results).
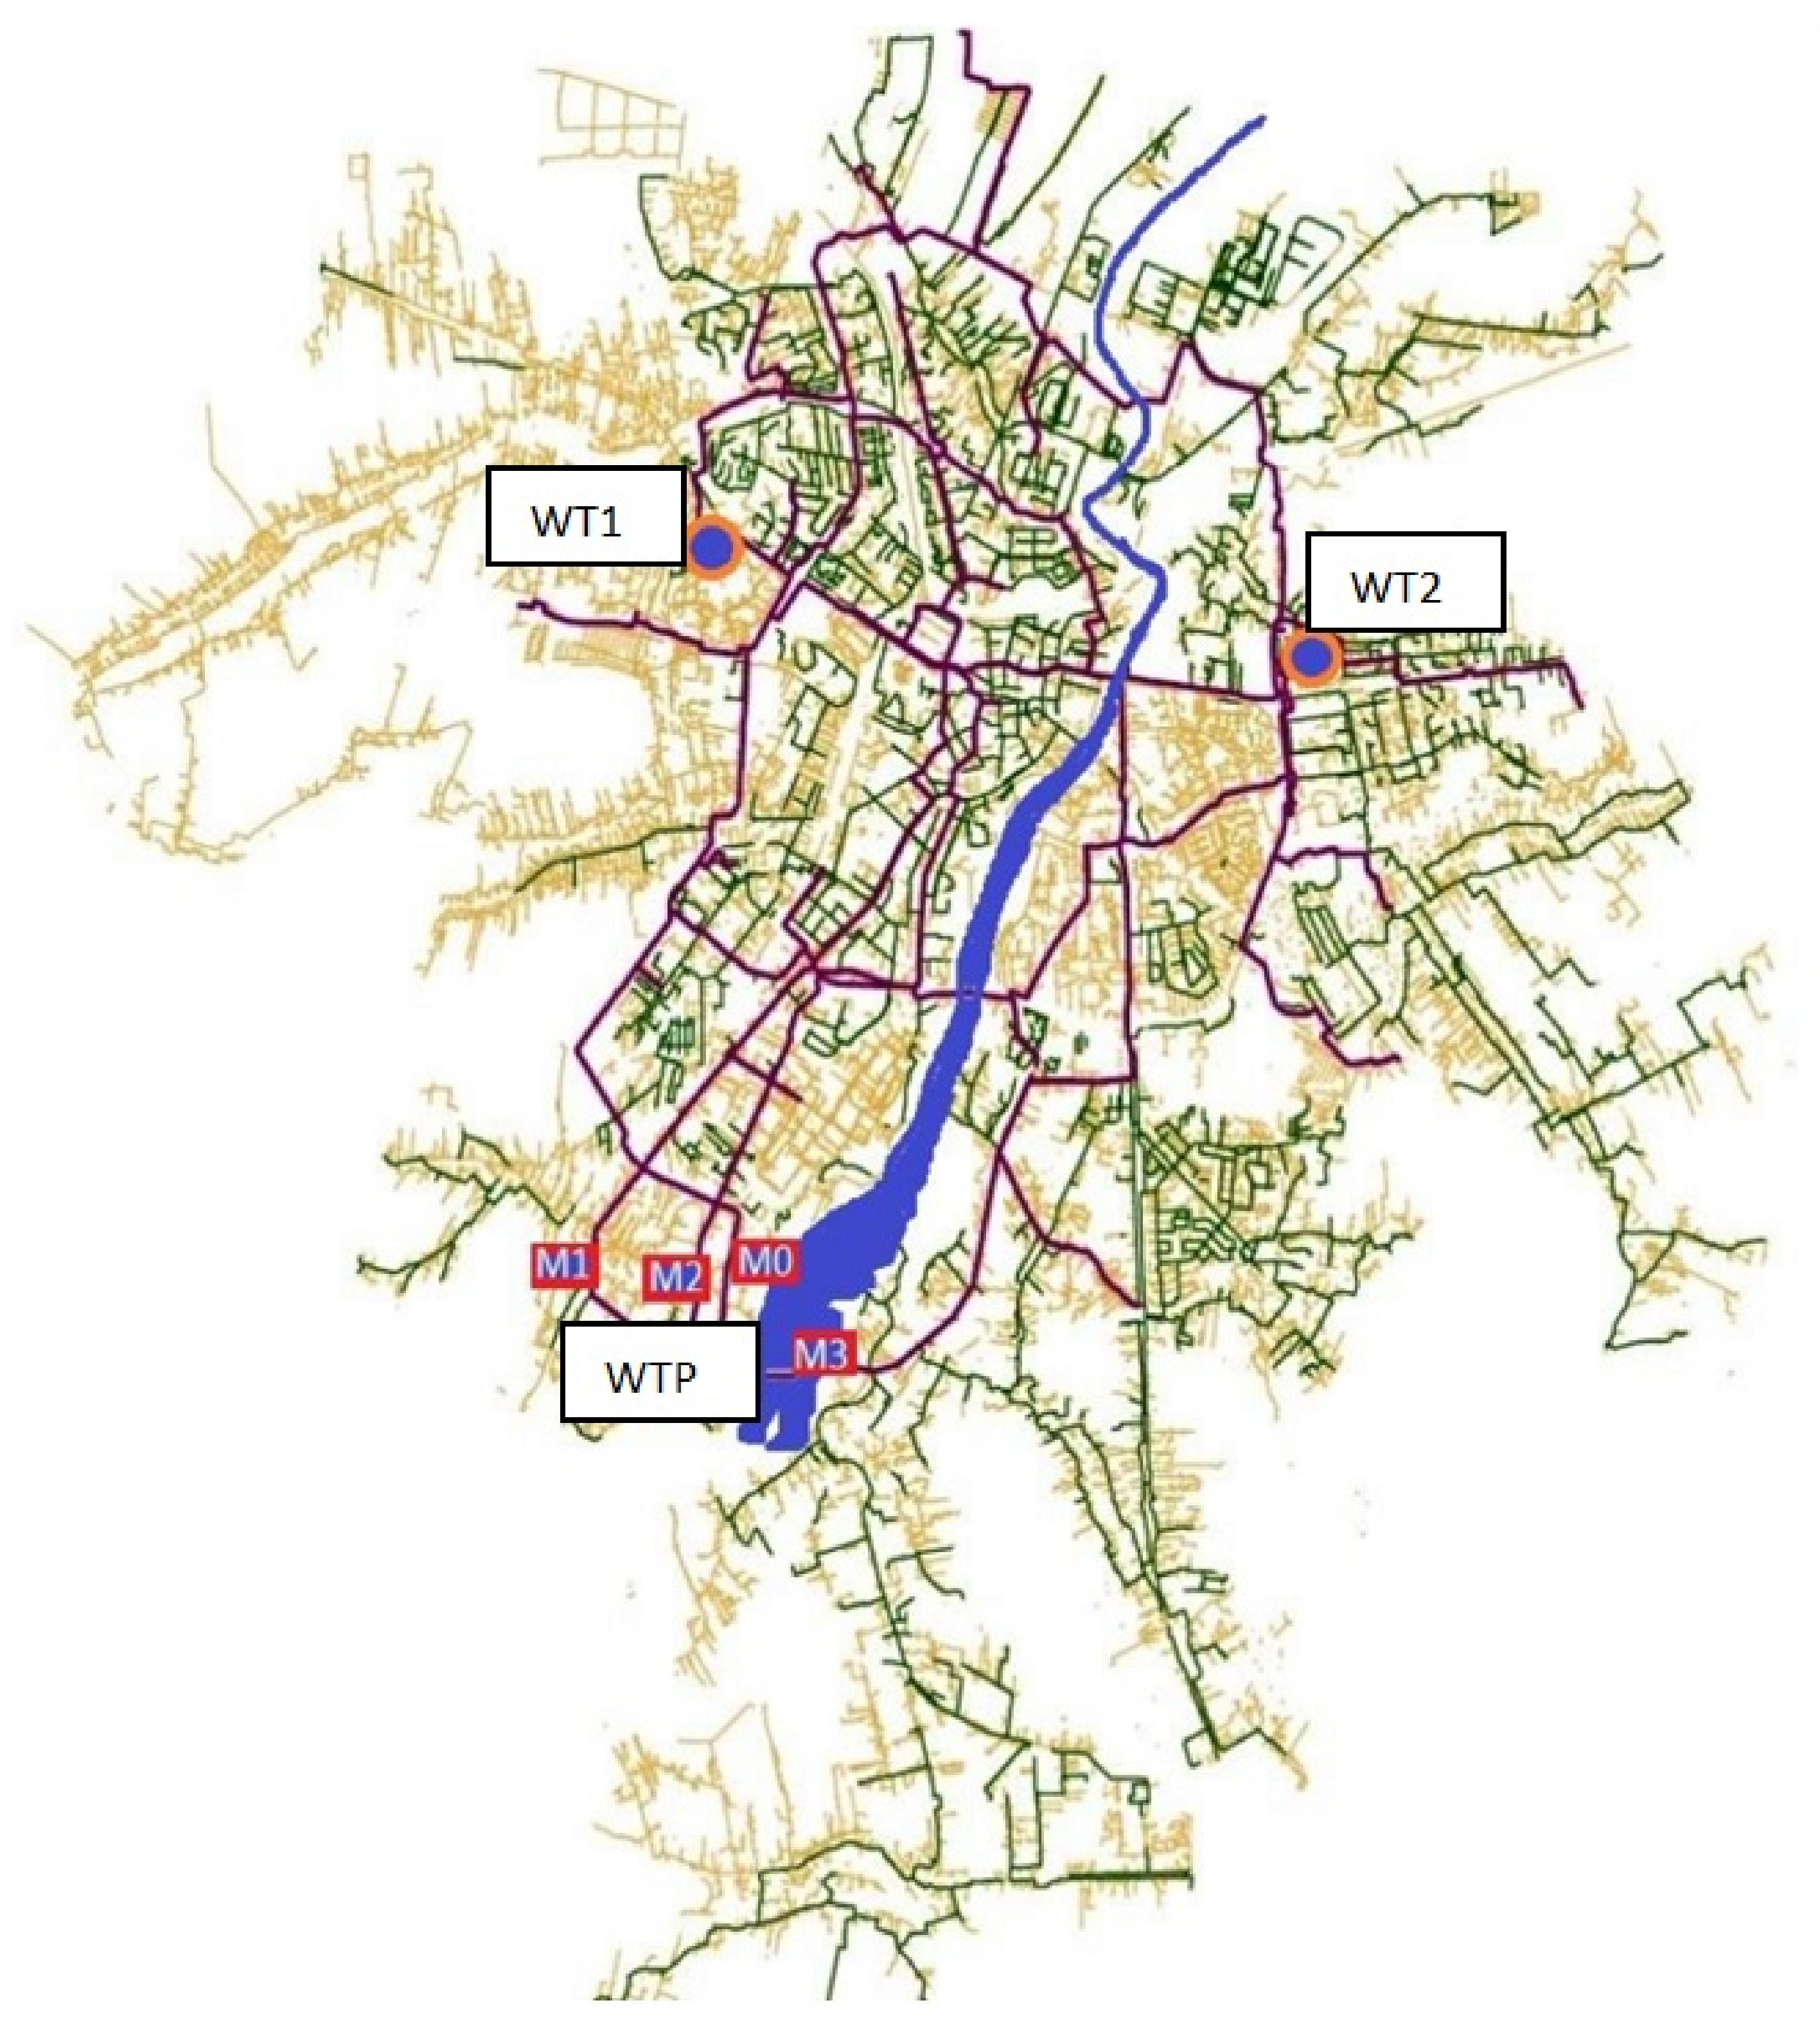
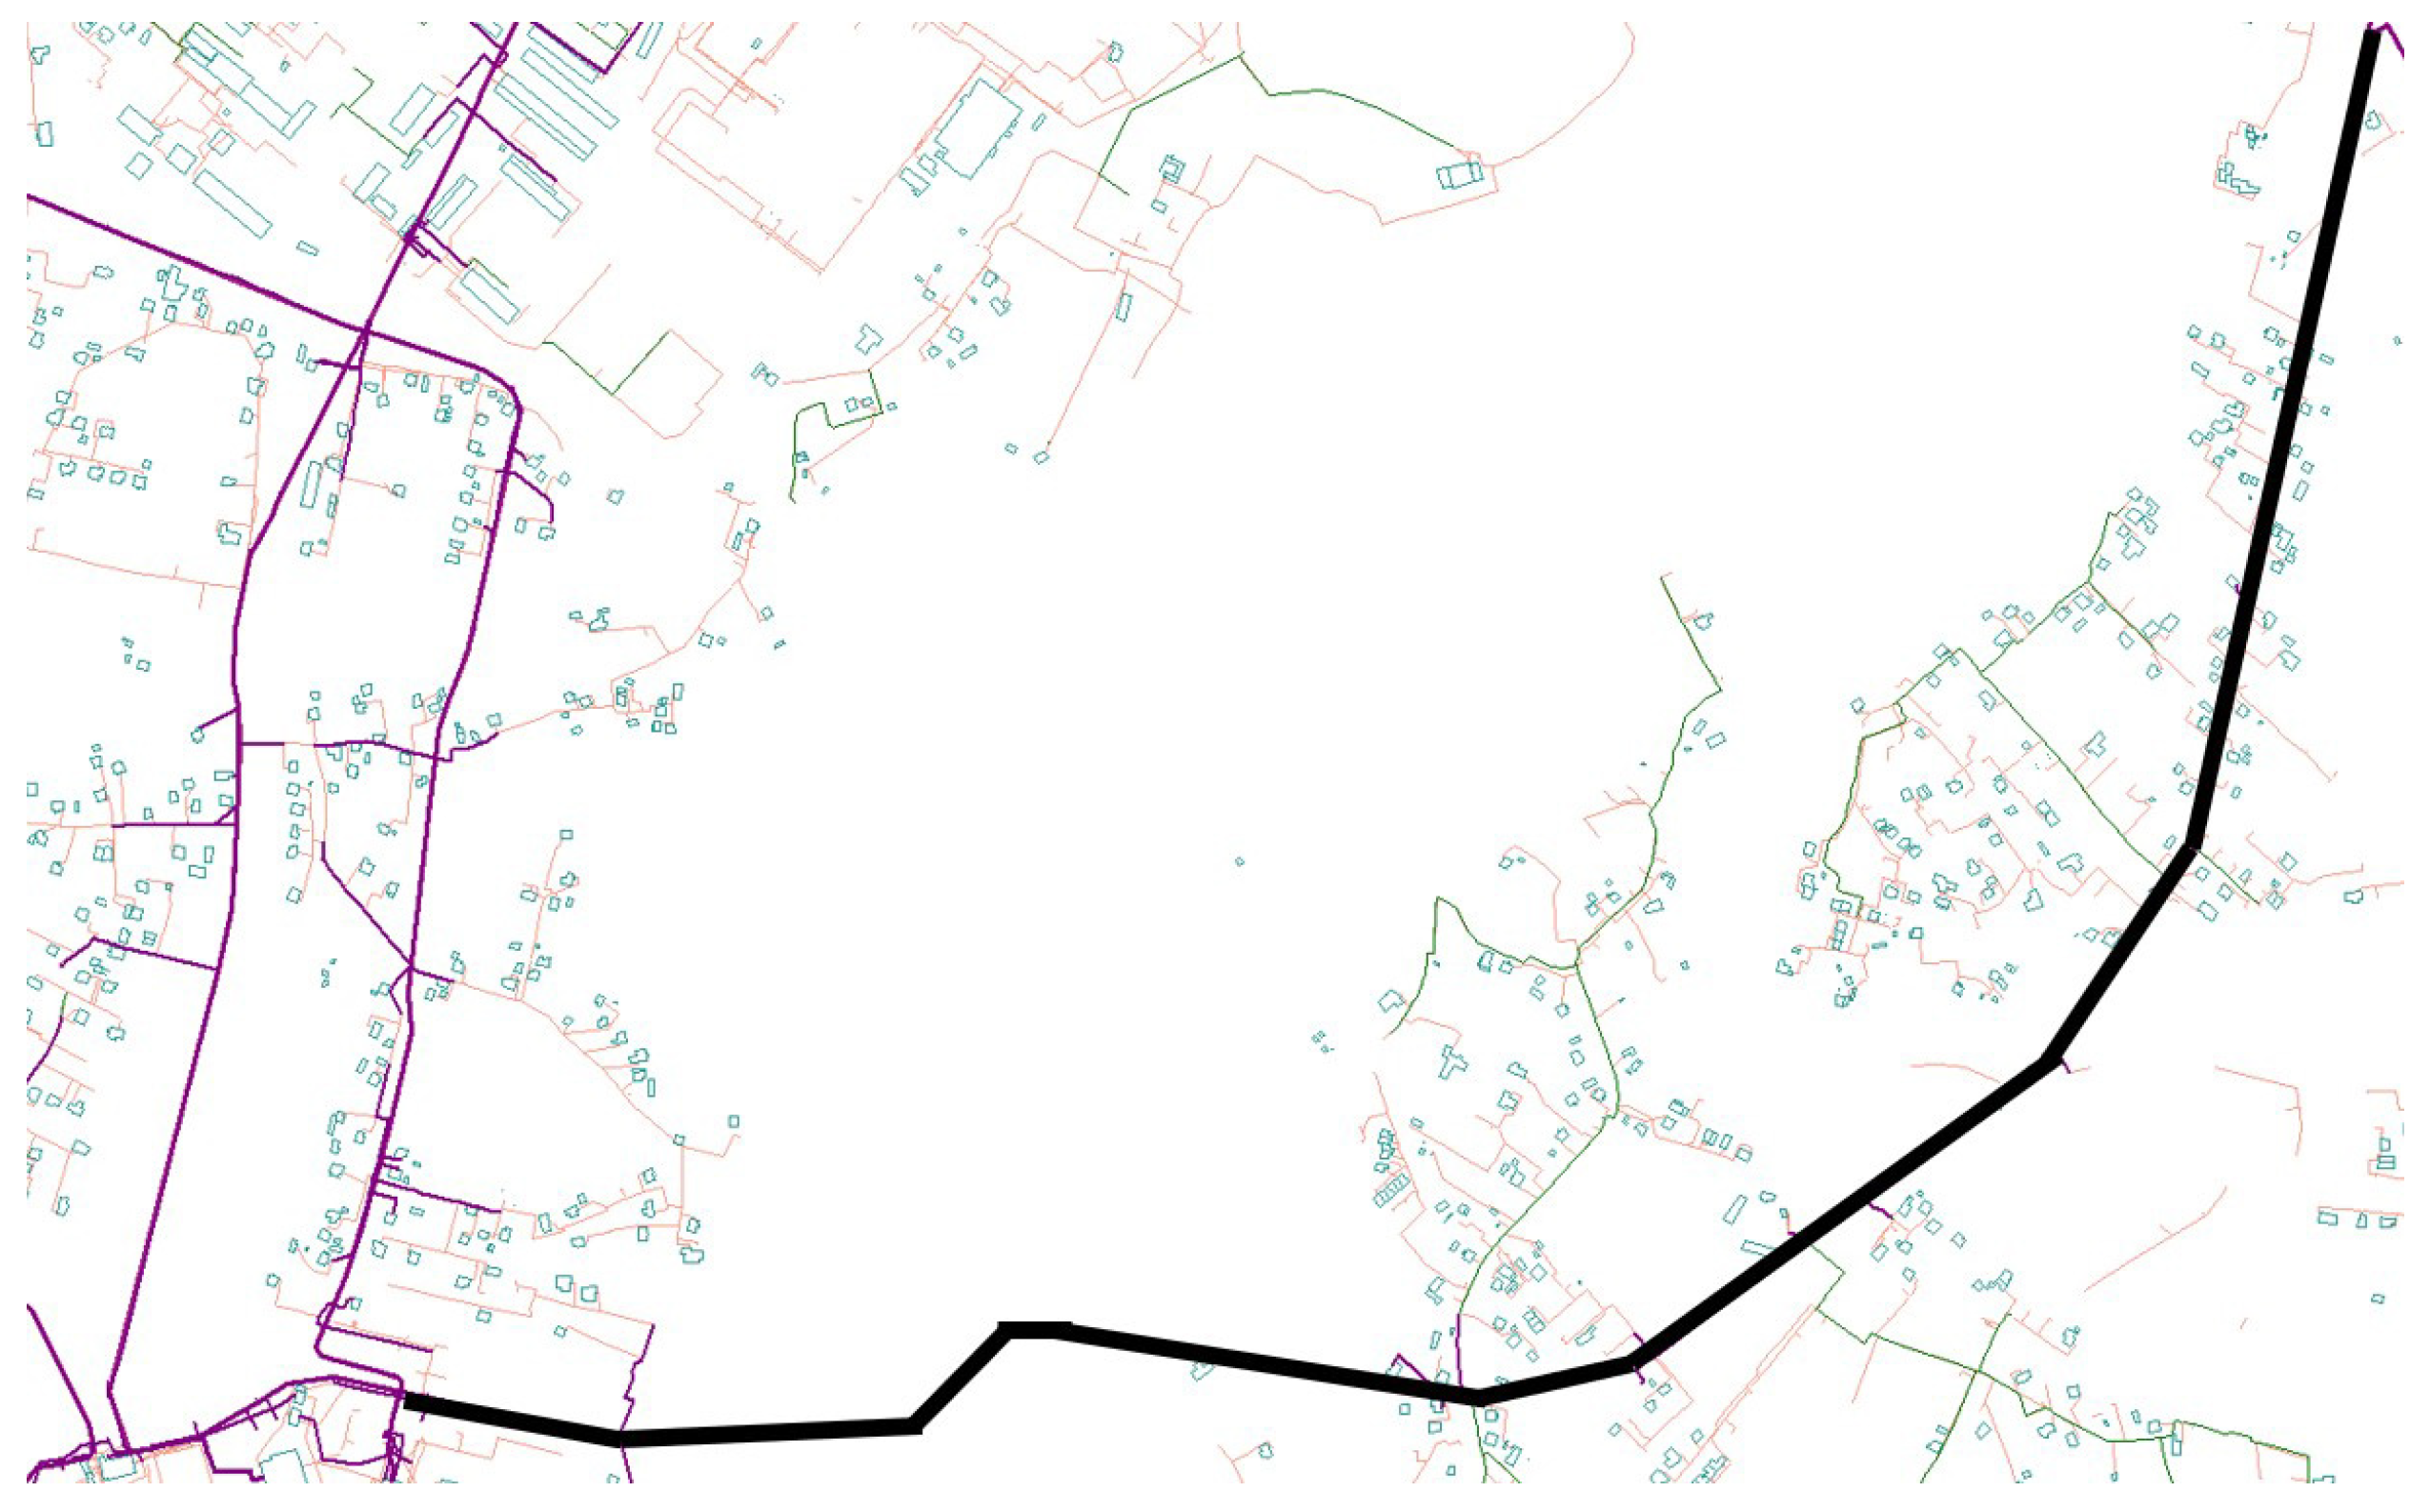
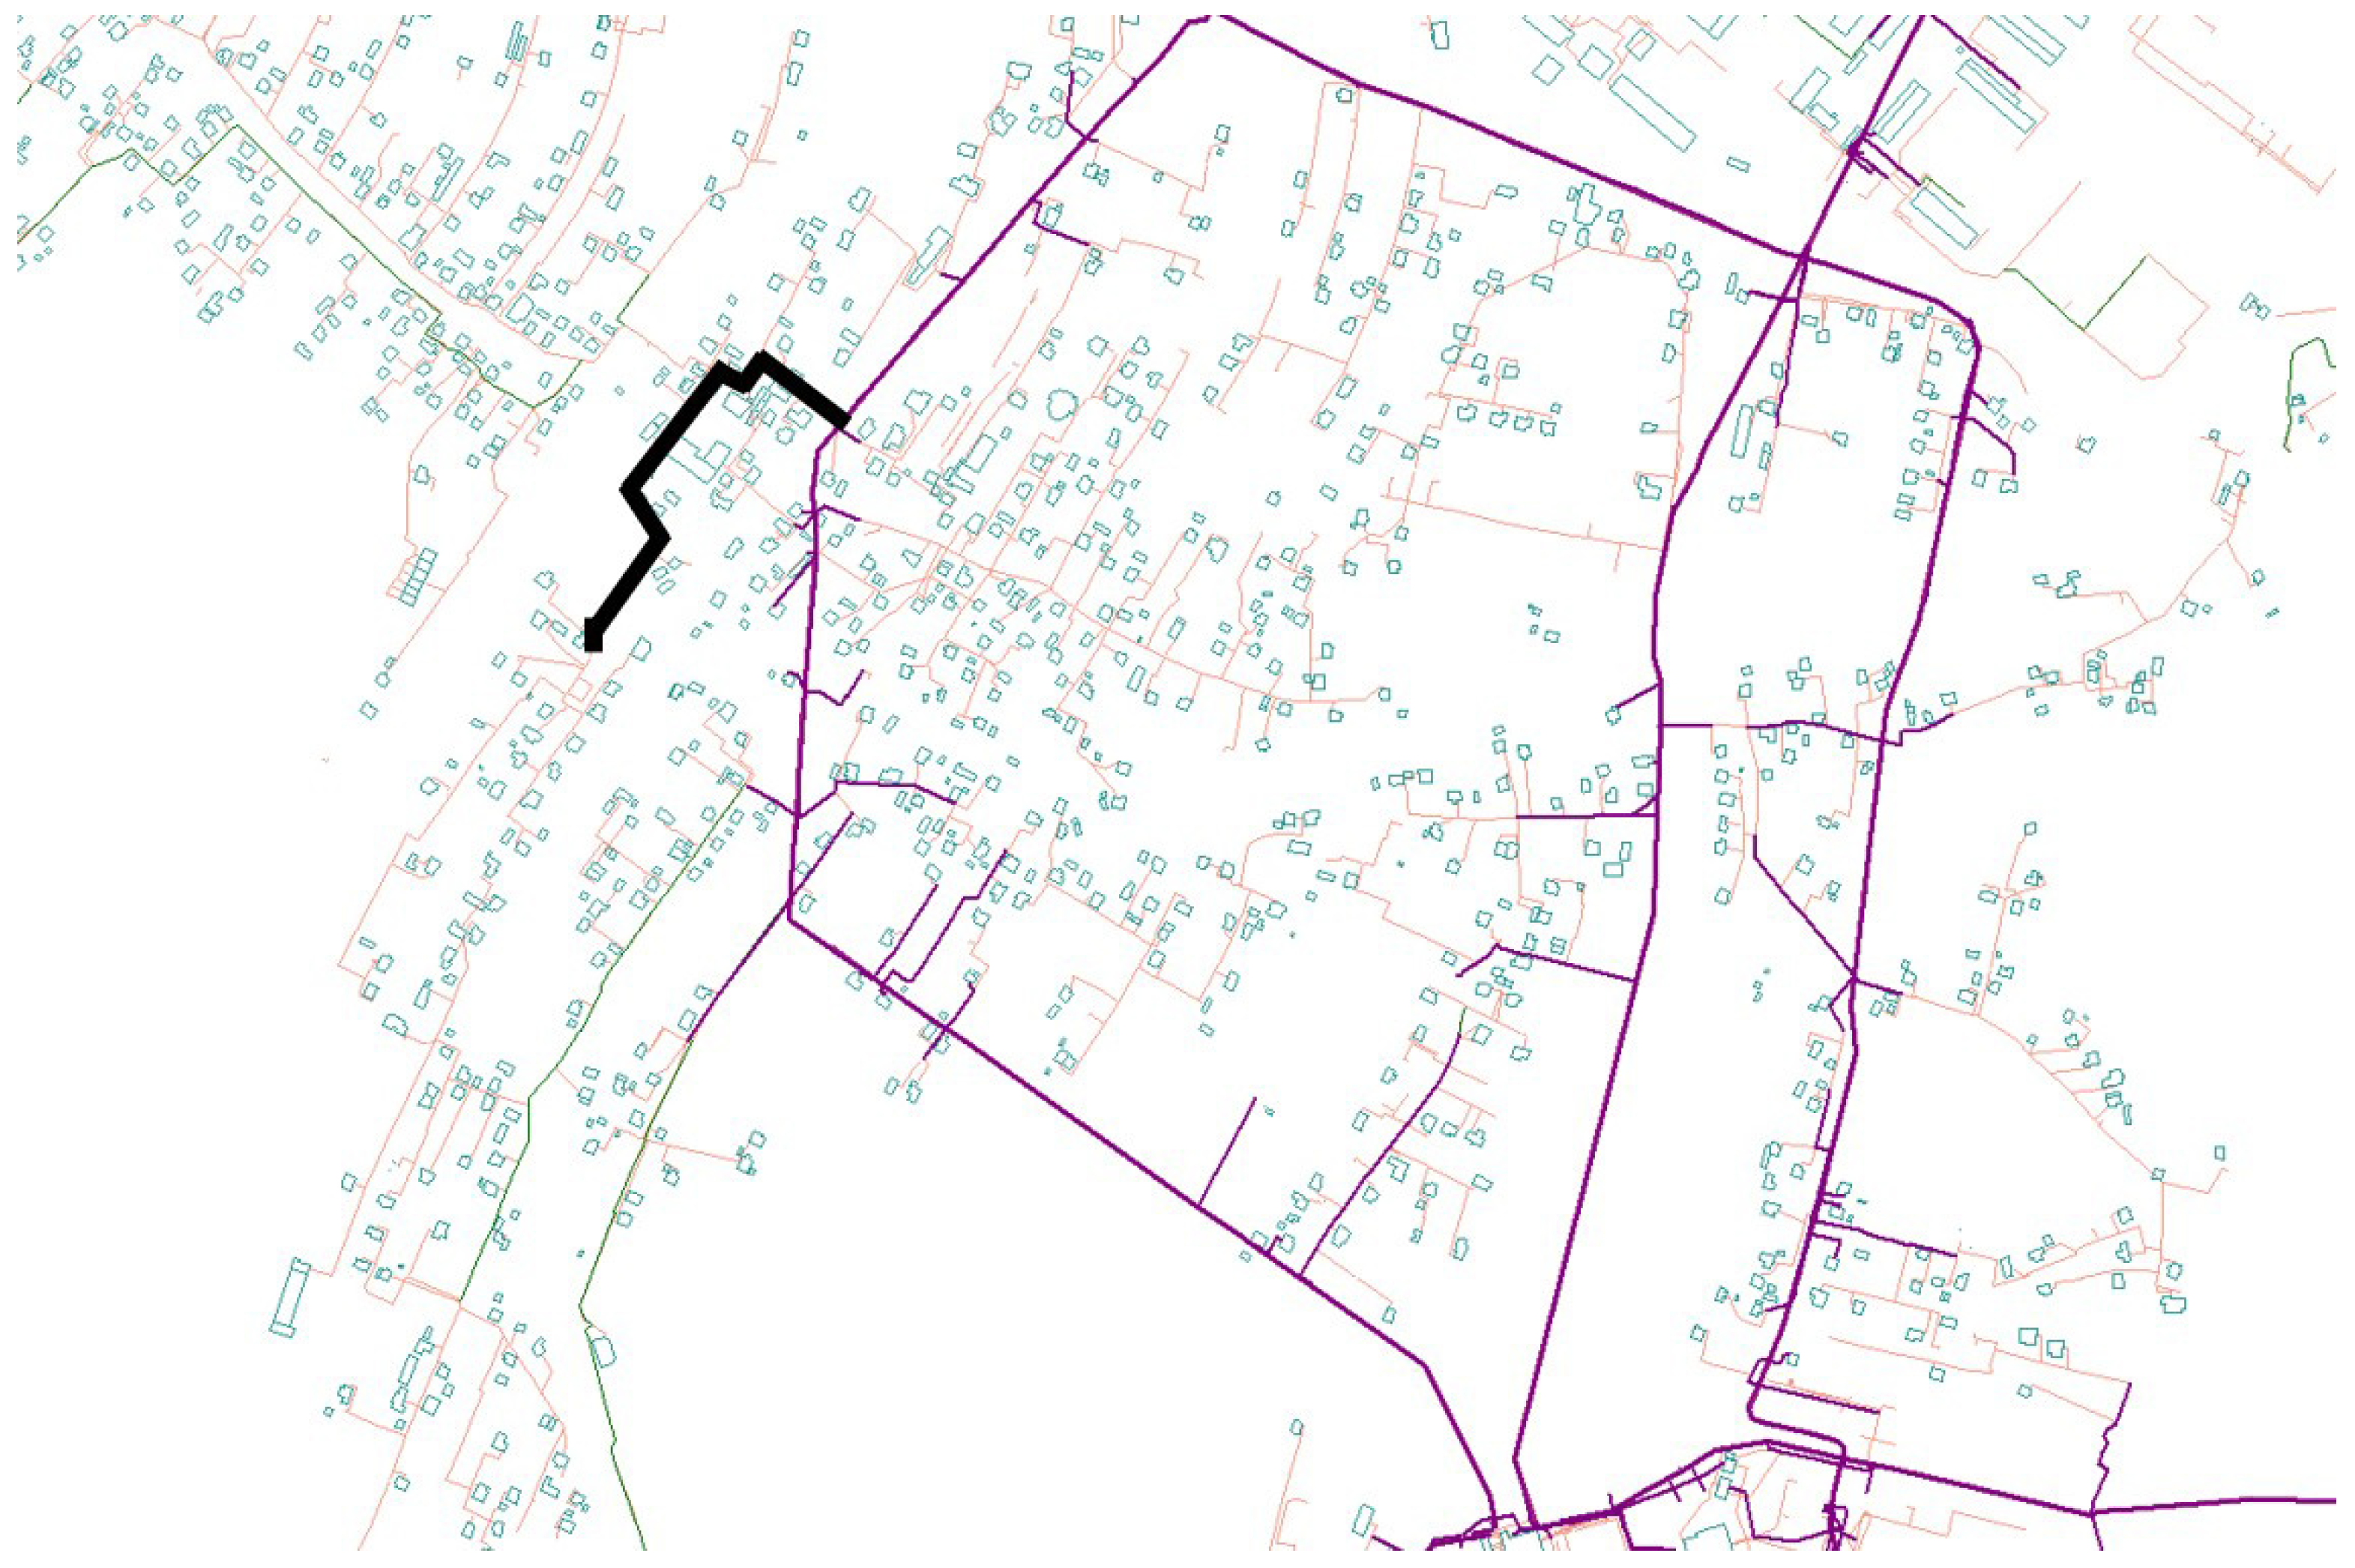
- Main line No. “0”, with a diameter ranging from Φ 1200 to 800 mm, made of steel.
- Mains No. “1” and No. “2”, both with a diameter of Φ 400 mm, constructed from steel and cast iron.
- Pipe line No. “3”, also with a diameter of Φ 400 mm, made from a combination of steel and cast iron materials.
4. Results
4.1. Failure Analysis of Water Supply Network
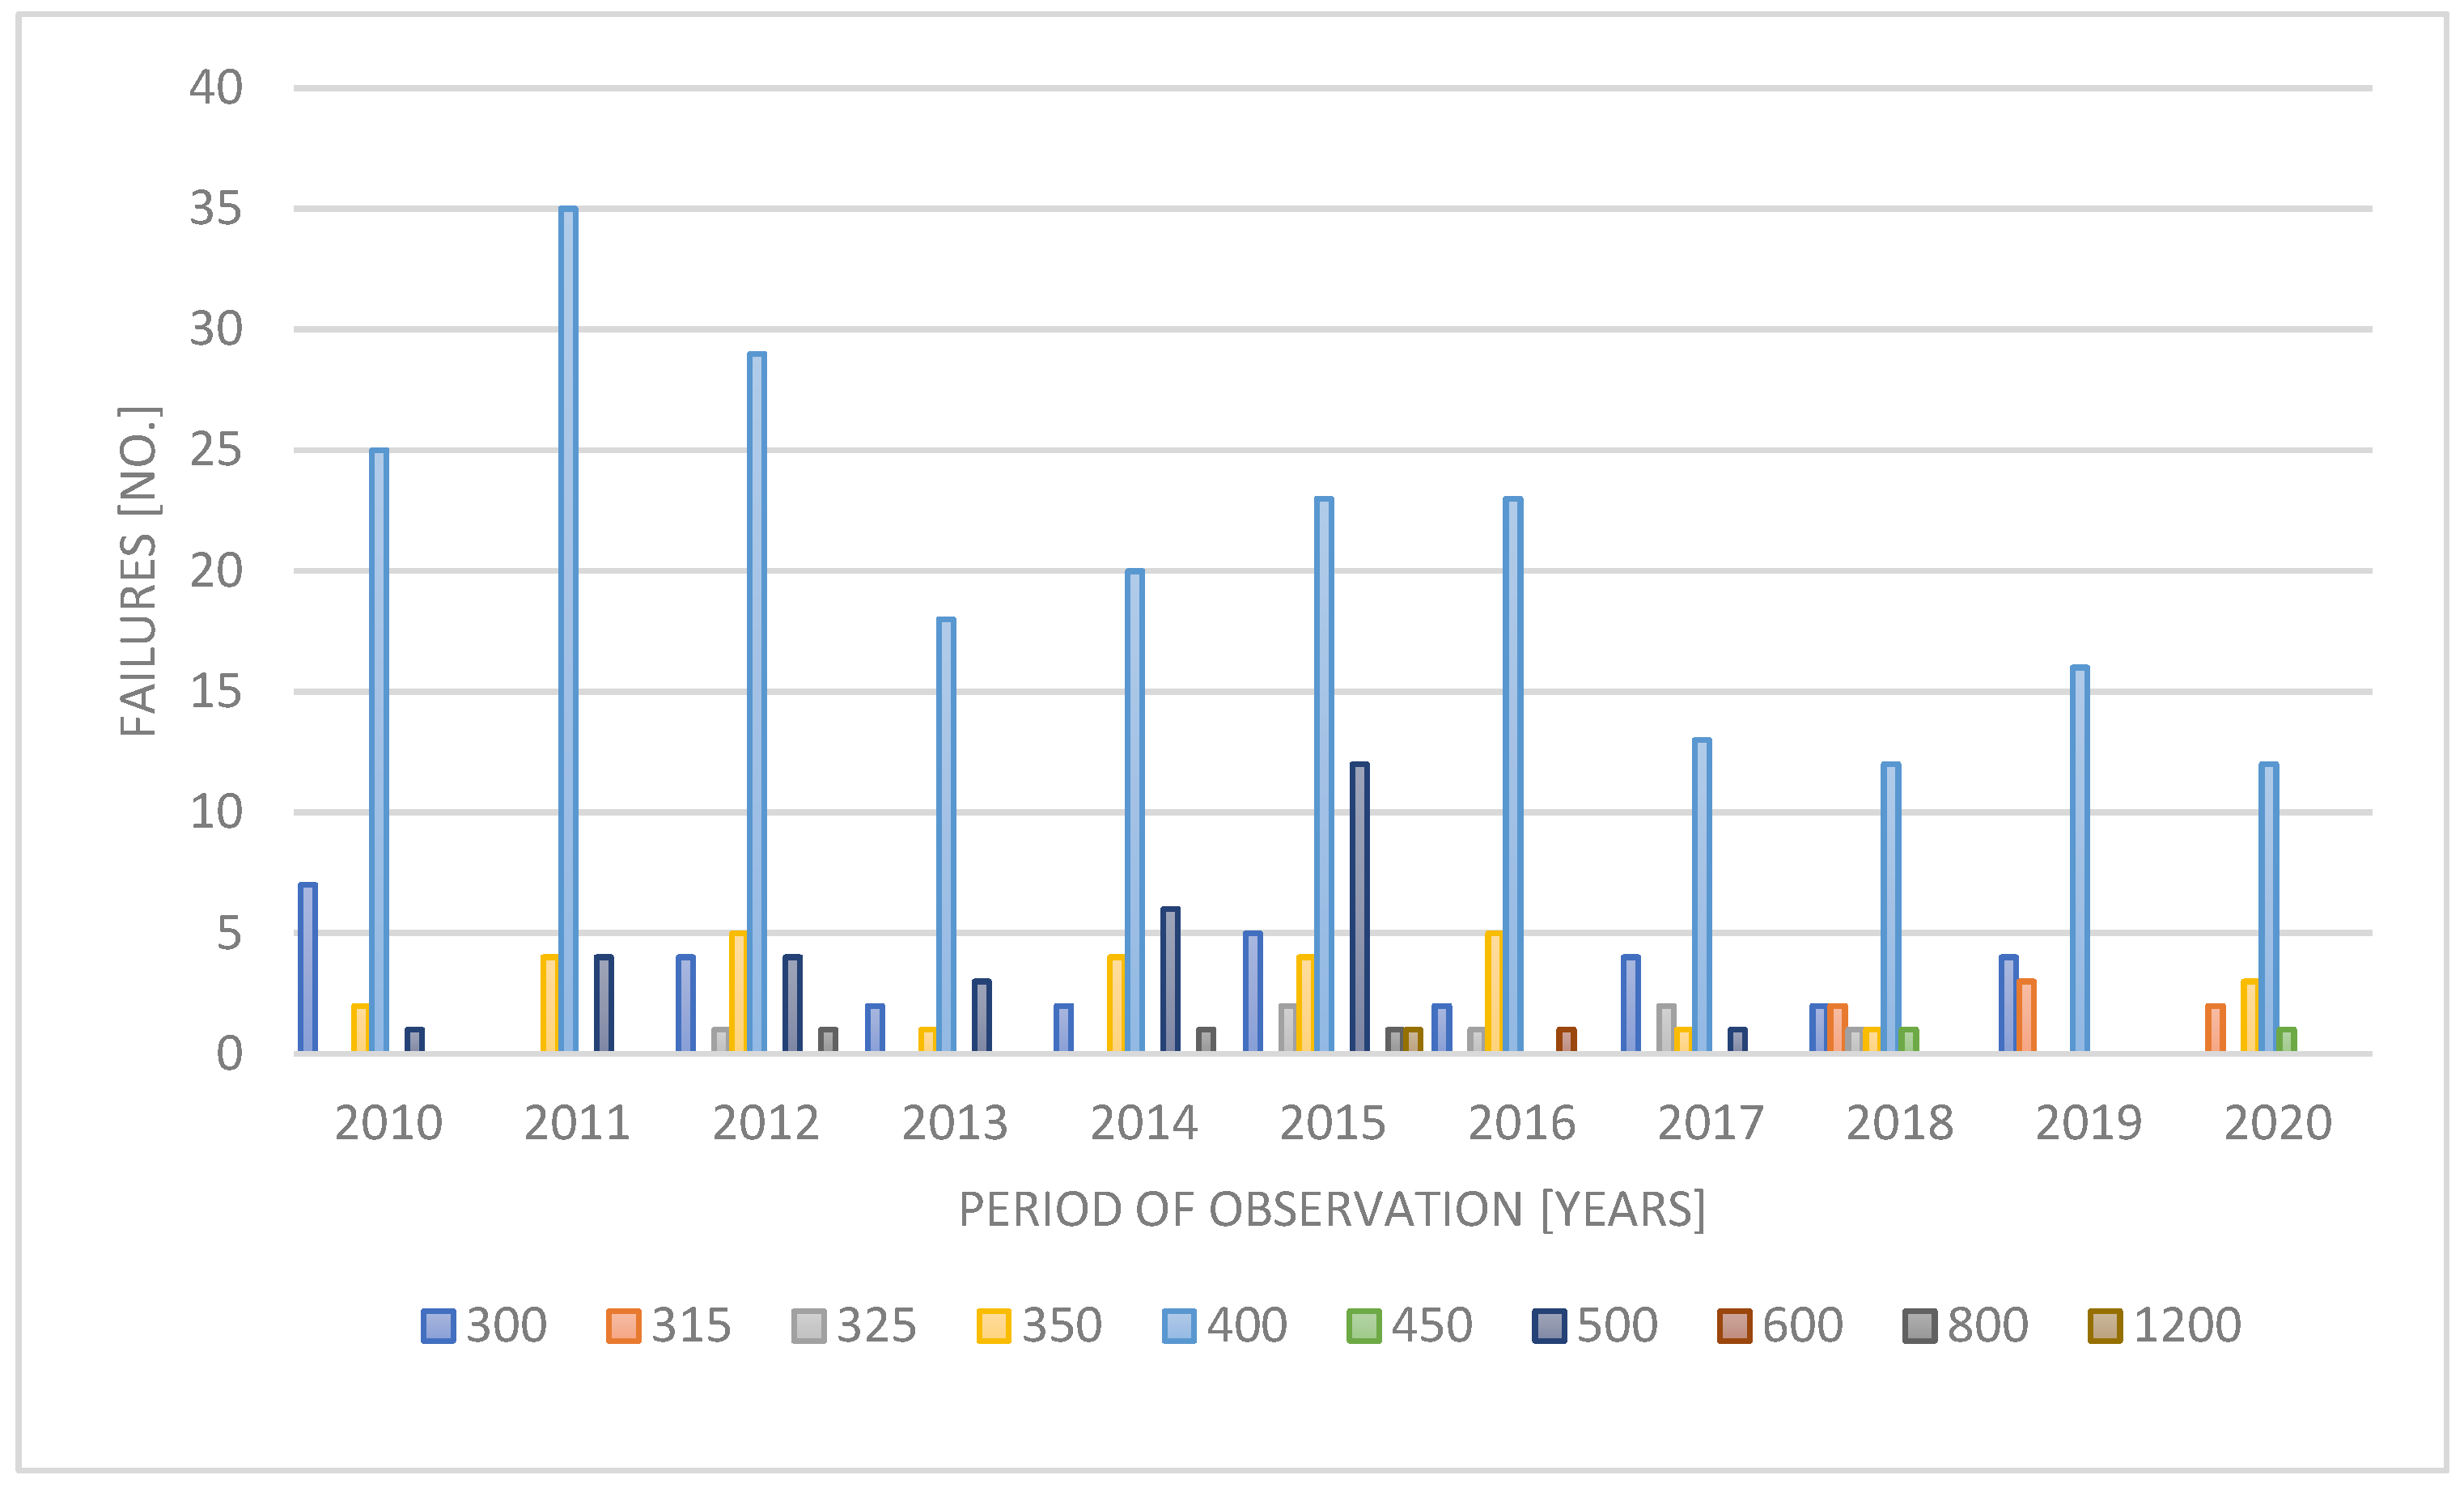
- the mains consist of pipes with diameters ≥ 300 mm;
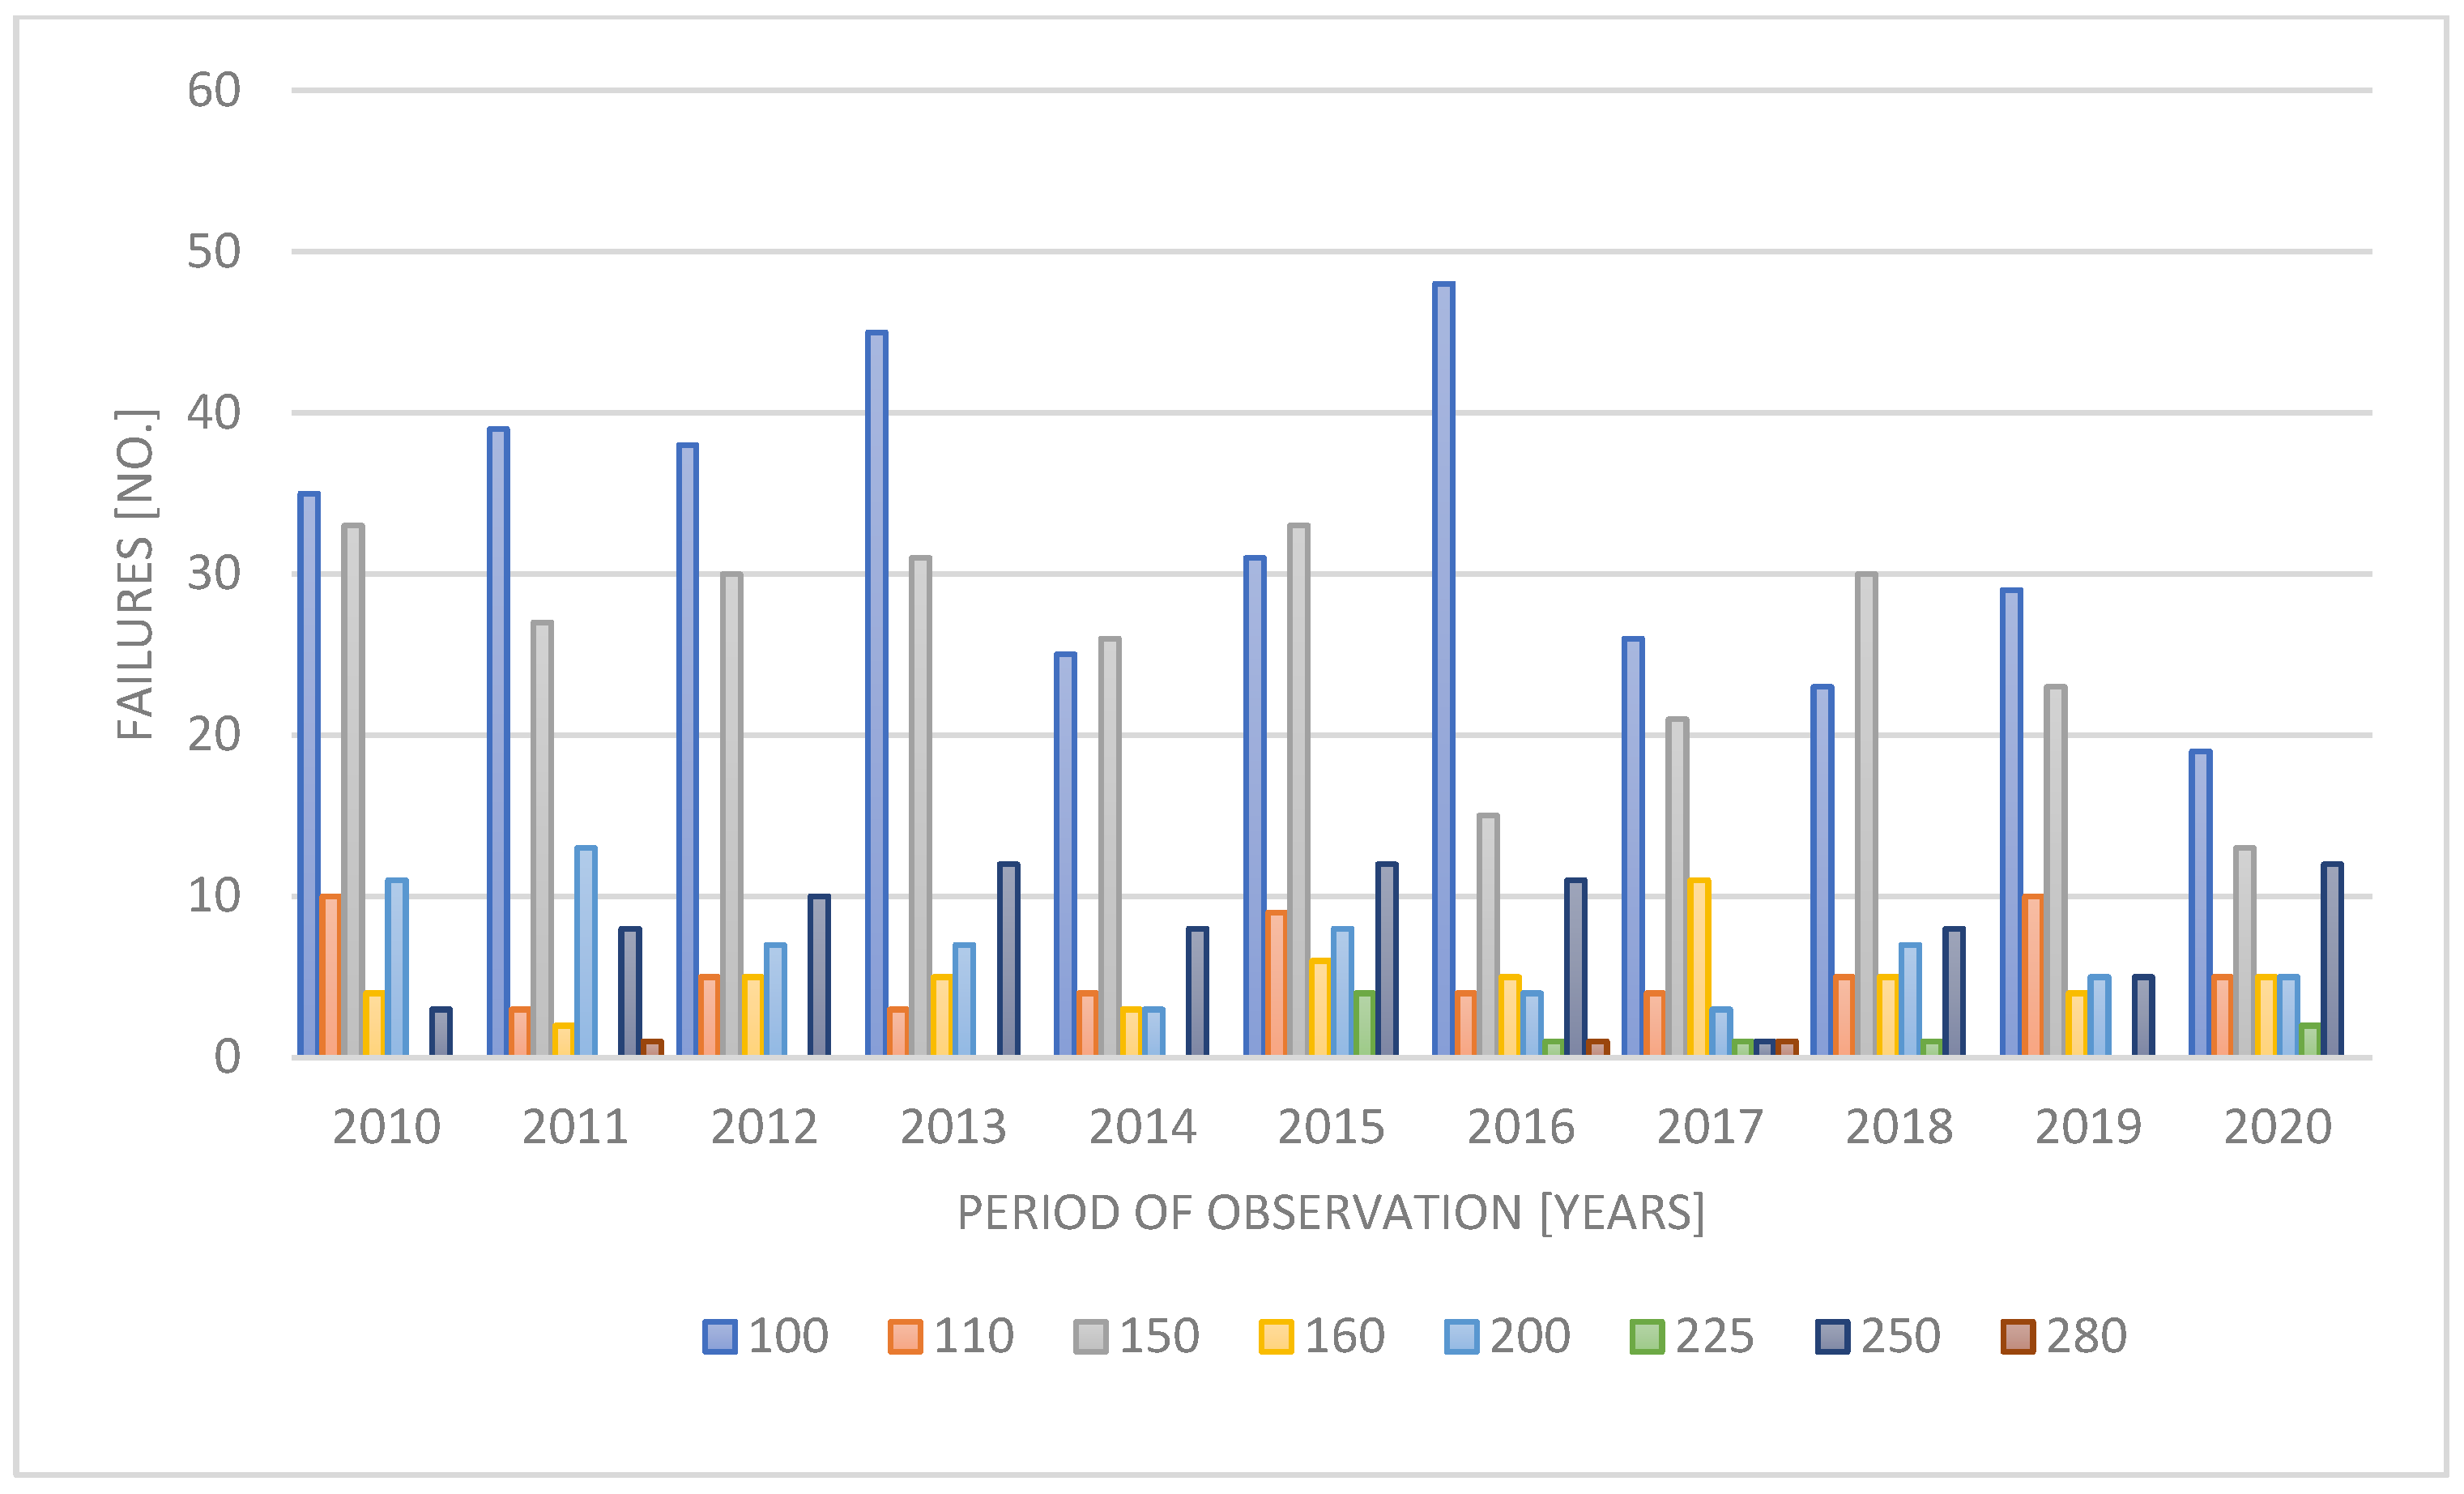
- the distribution network consists of tpipes with diameters of 90–280 mm.
4.2. Analysis of the Chemical Stability of Water
4.3. Failure Risk Analysis of Water Supply Network
4.3.1. Case One Assumes Failure on the Main, Diameter Φ 400 Made of Cast Iron
- main water supply pipe located in the southern part of the city, Φ 400 mm made of cast iron;
- according to the Table 2, the value of the P parameter has been assumed at P = 1 because, based on the number of failures recorded in 2020, i.e., <20 failures per year, the failure frequency parameter has been assumed as fi ≤ 0.1 events/year;
- according to Table 1, the value of the C parameter has been assumed at the level of C = 2;
4.3.2. Case Two Assumes the Failure of the Distribution Network Pipe, Diameter Φ 90 Made of PE Plastic
- water distribution pipe located in the south-western part of the city, Φ 90 made of PE plastic;
- according to Table 2, the value of the P parameter has been assumed at P = 1 because, based on the number of failures recorded in 2020, i.e., <20 failures per year, the failure frequency parameter has been assumed as fi ≤ 0.1 events/year;
- according to Table 1, the value of the C parameter has been assumed at the level of C = 1;
5. Conclusions and Perspectives
Author Contributions
Funding
Data Availability Statement
Conflicts of Interest
References
- Dawood, T.; Elwakil, E.; Novoa, H.M.; Delgado, J.F.G. Artificial Intelligence for the Modeling of Water Pipes Deterioration Mechanisms. Autom. Constr. 2020, 120, 103398. [Google Scholar] [CrossRef]
- Zhang, W.; Lai, T.; Li, Y. Risk Assessment of Water Supply Network Operation Based on ANP-Fuzzy Comprehensive Evaluation Method. J. Pipeline Syst. Eng. Pract. 2021, 13, 04021068. [Google Scholar] [CrossRef]
- Robles-Velasco, A.; Cortés, P.; Muñuzuri, J.; De Baets, B. Prediction of Pipe Failures in Water Supply Networks for Longer Time Periods through Multi-Label Classification. Expert Syst. Appl. 2023, 213, 119050. [Google Scholar] [CrossRef]
- Farah, E.; Shahrour, I. Leakage Detection Using Smart Water System: Combination of Water Balance and Automated Minimum Night Flow. Water Resour Manag. 2017, 31, 4821–4833. [Google Scholar] [CrossRef]
- Baloïtcha, G.M.P.; Mayabi, A.O.; Home, P.G. Evaluation of Water Quality and Potential Scaling of Corrosion in the Water Supply Using Water Quality and Stability Indices: A Case Study of Juja Water Distribution Network, Kenya. Heliyon 2022, 8, e09141. [Google Scholar] [CrossRef]
- Fiorini Morosini, A.; Shaffiee Haghshenas, S.; Shaffiee Haghshenas, S.; Choi, D.Y.; Geem, Z.W. Sensitivity Analysis for Performance Evaluation of a Real Water Distribution System by a Pressure Driven Analysis Approach and Artificial Intelligence Method. Water 2021, 13, 1116. [Google Scholar] [CrossRef]
- Van Der Kooij, D. Biological Stability: A Multidimensional Quality Aspect of Treated Water. In Environmental Challenges; Belkin, S., Ed.; Springer: Dordrecht, The Netherlands, 2000; pp. 25–34. ISBN 978-94-011-4369-1. [Google Scholar]
- Valis, D.; Hasilová, K.; Forbelská, M.; Pietrucha-Urbanik, K. Modelling Water Distribution Network Failures and Deterioration. In Proceedings of the 2017 IEEE International Conference on Industrial Engineering and Engineering Management (IEEM), Singapore, 10–13 December 2017; Volume 2017, pp. 924–928. [Google Scholar]
- Völker, S.; Schreiber, C.; Kistemann, T. Drinking Water Quality in Household Supply Infrastructure—A Survey of the Current Situation in Germany. Int. J. Hyg. Environ. Health 2010, 213, 204–209. [Google Scholar] [CrossRef]
- Wu, C.; Wang, X.; Jin, J.; Zhou, Y.; Bai, X.; Zhou, L.; Tong, F.; Zhang, L.; Cui, Y. Structure Simulation and Equilibrium Evaluation Analysis of Regional Water Resources, Society, Economy and Ecological Environment Complex System. Entropy 2023, 25, 181. [Google Scholar] [CrossRef]
- Zhang, R.; Gomaa, S.M.M.H.; Hussein, M.; Zayed, T.; Meguid, M. Review of Numerical Approaches Used in Soil-Pipe Interaction Analysis of Water Mains. Transp. Geotech. 2023, 42, 101008. [Google Scholar] [CrossRef]
- Piegdoń, I. A New Concept of Crisis Water Management in Urban Areas Based on the Risk Maps of Lack of Water Supply in Response to European Law. Resources 2022, 11, 17. [Google Scholar] [CrossRef]
- Szpak, D.; Boryczko, K.; Żywiec, J.; Piegdoń, I.; Tchórzewska-Cieślak, B.; Rak, J.R. Risk Assessment of Water Intakes in South-Eastern Poland in Relation to the WHO Requirements for Water Safety Plans. Resources 2021, 10, 105. [Google Scholar] [CrossRef]
- Tchórzewska-Cieślak, B.; Rak, J.; Pietrucha-Urbanik, K.; Piegdoń, I.; Boryczko, K.; Szpak, D.; Żywiec, J. Water Supply Safety Assessment Considering the Water Supply System Resilience. DWT 2023, 288, 26–36. [Google Scholar] [CrossRef]
- Zaman, D.; Tiwari, M.K.; Gupta, A.K.; Sen, D. A Review of Leakage Detection Strategies for Pressurised Pipeline in Steady-State. Eng. Fail. Anal. 2020, 109, 104264. [Google Scholar] [CrossRef]
- Żywiec, J.; Szpak, D.; Piegdoń, I.; Boryczko, K.; Pietrucha-Urbanik, K.; Tchórzewska-Cieślak, B.; Rak, J. An Approach to Assess the Water Resources Reliability and Its Management. Resources 2023, 12, 4. [Google Scholar] [CrossRef]
- Kabir, G.; Tesfamariam, S.; Francisque, A.; Sadiq, R. Evaluating Risk of Water Mains Failure Using a Bayesian Belief Network Model. Eur. J. Oper. Res. 2015, 240, 220–234. [Google Scholar] [CrossRef]
- Karamouz, M.; Yousefi, A.; Zahmatkesh, Z.; Mahmoodzadeh, D.; Pirooz, M.D. Simulation of Chlorine Injection in Water Distribution Networks in Response to Contaminations. Int. J. Environ. Res. 2021, 16, 6. [Google Scholar] [CrossRef]
- Eliades, D.G.; Vrachimis, S.G.; Moghaddam, A.; Tzortzis, I.; Polycarpou, M.M. Contamination Event Diagnosis in Drinking Water Networks: A Review. Annu. Rev. Control. 2023, 55, 420–441. [Google Scholar] [CrossRef]
- Gong, J.; Guo, X.; Yan, X.; Hu, C. Review of Urban Drinking Water Contamination Source Identification Methods. Energies 2023, 16, 705. [Google Scholar] [CrossRef]
- Craun, G.F.; Calderon, R.L.; Craun, M.F. Outbreaks Associated with Recreational Water in the United States. Int. J. Environ. Health Res. 2005, 15, 243–262. [Google Scholar] [CrossRef]
- Calero Preciado, C.; Husband, S.; Boxall, J.; del Olmo, G.; Soria-Carrasco, V.; Maeng, S.K.; Douterelo, I. Intermittent Water Supply Impacts on Distribution System Biofilms and Water Quality. Water Res. 2021, 201, 117372. [Google Scholar] [CrossRef]
- Papciak, D.; Tchórzewska-Cieslak, B.; Pietrucha-Urbanik, K.; Pietrzyk, A. Analysis of the Biological Stability of Tap Water on the Basis of Risk Analysis and Parameters Limiting the Secondary Growth of Microorganisms in Water Distribution Systems. DWT 2018, 117, 1–8. [Google Scholar] [CrossRef]
- Prest, E.I.; Hammes, F.; van Loosdrecht, M.C.M.; Vrouwenvelder, J.S. Biological Stability of Drinking Water: Controlling Factors, Methods, and Challenges. Front. Microbiol. 2016, 7, 45. [Google Scholar] [CrossRef] [PubMed]
- Urbanik, M.; Tchórzewska-Cieślak, B.; Pietrucha-Urbanik, K. Analysis of the Safety of Functioning Gas Pipelines in Terms of the Occurrence of Failures. Energies 2019, 12, 3228. [Google Scholar] [CrossRef]
- Tchórzewska-Cieślak, B.; Pietrucha-Urbanik, K.; Urbanik, M.; Rak, J. Approaches for Safety Analysis of Gas-Pipeline Functionality in Terms of Failure Occurrence: A Case Study. Energies 2018, 11, 1589. [Google Scholar] [CrossRef]
- Wolf-Baca, M.; Siedlecka, A. Seasonal and Spatial Variations of Antibiotic Resistance Genes and Bacterial Biodiversity in Biofilms Covering the Equipment at Successive Stages of Drinking Water Purification. J. Hazard. Mater. 2023, 456, 131660. [Google Scholar] [CrossRef] [PubMed]
- Duong, T.H.; Park, J.W.; Maeng, S.K. Assessment of Organic Carbon Migration and Biofilm Formation Potential on Polymeric Tubes in Contact with Water. J. Hazard. Mater. 2021, 411, 125095. [Google Scholar] [CrossRef]
- Alzarooni, E.; Ali, T.; Atabay, S.; Yilmaz, A.G.; Mortula, M.M.; Fattah, K.P.; Khan, Z. GIS-Based Identification of Locations in Water Distribution Networks Vulnerable to Leakage. Appl. Sci. 2023, 13, 4692. [Google Scholar] [CrossRef]
- Adeloye, A. The Relative Utility of Regression and Artificial Neural Networks Models for Rapidly Predicting the Capacity of Water Supply Reservoirs. Environ. Model. Softw. 2009, 24, 1233–1240. [Google Scholar] [CrossRef]
- Hluštík, P.; Zeleňáková, M. Risk Analysis of Failure in Sewer Systems in Czech Municipalities. Pol. J. Environ. Stud. 2019, 28, 4183–4190. [Google Scholar] [CrossRef]
- Rak, J.; Wartalska, K.; Kaźmierczak, B. Weather Risk Assessment for Collective Water Supply and Sewerage Systems. Water 2021, 13, 1970. [Google Scholar] [CrossRef]
- Barton, N.A.; Farewell, T.S.; Hallett, S.H.; Acland, T.F. Improving Pipe Failure Predictions: Factors Affecting Pipe Failure in Drinking Water Networks. Water Res. 2019, 164, 114926. [Google Scholar] [CrossRef] [PubMed]
- Taiwo, R.; Shaban, I.A.; Zayed, T. Development of Sustainable Water Infrastructure: A Proper Understanding of Water Pipe Failure. J. Clean. Prod. 2023, 398, 136653. [Google Scholar] [CrossRef]
- Tchórzewska-Cieślak, B.; Pietrucha-Urbanik, K. Water System Safety Analysis Model. Energies 2023, 16, 2809. [Google Scholar] [CrossRef]
- Młyński, D.; Bergel, T.; Młyńska, A.; Kudlik, K. A Study of the Water Supply System Failure in Terms of the Seasonality: Analysis by Statistical Approaches. AQUA—Water Infrastruct. Ecosyst. Soc. 2021, 70, 289–302. [Google Scholar] [CrossRef]
- Yang, Z.; Barroca, B.; Weppe, A.; Bony-Dandrieux, A.; Laffréchine, K.; Daclin, N.; November, V.; Omrane, K.; Kamissoko, D.; Benaben, F.; et al. Indicator-Based Resilience Assessment for Critical Infrastructures—A Review. Saf. Sci. 2023, 160, 106049. [Google Scholar] [CrossRef]
- Bouledroua, O.; Zelmati, D.; Hassani, M. Inspections, Statistical and Reliability Assessment Study of Corroded Pipeline. Eng. Fail. Anal. 2019, 100, 1–10. [Google Scholar] [CrossRef]
- Chang, L.; Lee, J.H.W.; Fung, Y.S. Prediction of Lead Leaching from Galvanic Corrosion of Lead-Containing Components in Copper Pipe Drinking Water Supply Systems. J. Hazard. Mater. 2022, 436, 129169. [Google Scholar] [CrossRef]
- Bogalecka, M.; Dąbrowska, E. Monte Carlo Simulation Approach to Shipping Accidents Consequences Assessment. Water 2023, 15, 1824. [Google Scholar] [CrossRef]
- Richter, K.; dos Santos, D.C.; Schmid, A.L. Efficiency Analysis of Water Conservation Measures in Sanitary Infrastructure Systems by Means of a Systemic Approach. Sustainability 2020, 12, 3055. [Google Scholar] [CrossRef]
- Tornyeviadzi, H.M.; Neba, F.A.; Mohammed, H.; Seidu, R. Nodal Vulnerability Assessment of Water Distribution Networks: An Integrated Fuzzy AHP-TOPSIS Approach. Int. J. Crit. Infrastruct. Prot. 2021, 34, 100434. [Google Scholar] [CrossRef]
- Mehryar, M.; Hafezalkotob, A.; Azizi, A.; Sobhani, F.M. Dynamic Zoning of the Network Using Cooperative Transmission and Maintenance Planning: A Solution for Sustainability of Water Distribution Networks. Reliab. Eng. Syst. Saf. 2023, 235, 109260. [Google Scholar] [CrossRef]
- Rak, J.R.; Tchórzewska-Cieślak, B.; Pietrucha-Urbanik, K. A Hazard Assessment Method for Waterworks Systems Operating in Self-Government Units. Int. J. Environ. Res. Public Health 2019, 16, 767. [Google Scholar] [CrossRef] [PubMed]
- Yerri, S.R.; Piratla, K.R.; Matthews, J.C.; Yazdekhasti, S.; Cho, J.; Koo, D. Empirical Analysis of Large Diameter Water Main Break Consequences. Resour. Conserv. Recycl. 2017, 123, 242–248. [Google Scholar] [CrossRef]
- Tiong, A.; Vergara, H.A. A Two-Stage Stochastic Multi-Objective Resilience Optimization Model for Network Expansion of Interdependent Power–Water Networks under Disruption. Int. J. Crit. Infrastruct. Prot. 2023, 40, 100588. [Google Scholar] [CrossRef]
- Gurung, T.R.; Stewart, R.A.; Beal, C.D.; Sharma, A.K. Smart Meter Enabled Water End-Use Demand Data: Platform for the Enhanced Infrastructure Planning of Contemporary Urban Water Supply Networks. J. Clean. Prod. 2015, 87, 642–654. [Google Scholar] [CrossRef]
- Ji, J.; Hong Lai, J.; Fu, G.; Zhang, C.; Kodikara, J. Probabilistic Failure Investigation of Small Diameter Cast Iron Pipelines for Water Distribution. Eng. Fail. Anal. 2020, 108, 104239. [Google Scholar] [CrossRef]
- Jiang, R.; Rathnayaka, S.; Shannon, B.; Zhao, X.-L.; Ji, J.; Kodikara, J. Analysis of Failure Initiation in Corroded Cast Iron Pipes under Cyclic Loading Due to Formation of Through-Wall Cracks. Eng. Fail. Anal. 2019, 103, 238–248. [Google Scholar] [CrossRef]
- Wang, F.; Zheng, X.; Li, N.; Shen, X. Systemic Vulnerability Assessment of Urban Water Distribution Networks Considering Failure Scenario Uncertainty. Int. J. Crit. Infrastruct. Prot. 2019, 26, 100299. [Google Scholar] [CrossRef]
- Butler, D.; Farmani, R.; Fu, G.; Ward, S.; Diao, K.; Astaraie-Imani, M. A New Approach to Urban Water Management: Safe and Sure. Procedia Eng. 2014, 89, 347–354. [Google Scholar] [CrossRef]
- Pérez-Padillo, J.; Puig, F.; García Morillo, J.; Montesinos, P. IoT Platform for Failure Management in Water Transmission Systems. Expert Syst. Appl. 2022, 199, 116974. [Google Scholar] [CrossRef]
- Son, J.; Kim, I.; Park, J. Random Network Model for Assessing the Topological Performance of Water Distribution Systems. KSCE J. Civ. Eng. 2023, 27, 4101–4114. [Google Scholar] [CrossRef]
- Kneier, F.; Woltersdorf, L.; Peiris, T.A.; Döll, P. Participatory Bayesian Network Modeling of Climate Change Risks and Adaptation Regarding Water Supply: Integration of Multi-Model Ensemble Hazard Estimates and Local Expert Knowledge. Environ. Model. Softw. 2023, 168, 105764. [Google Scholar] [CrossRef]
- Marsili, V.; Mazzoni, F.; Marzola, I.; Alvisi, S.; Franchini, M. Intermittent Water Supply System Rehabilitation through a Multiphase Methodology Based on Network Analysis and Hydraulic Modeling. J. Water Resour. Plan. Manag. 2023, 149, 04023048. [Google Scholar] [CrossRef]
- Best, K.B.; Miro, M.E.; Kirpes, R.M.; Kaynar, N.; Najera Chesler, A. Data-Driven Decision Support Tools for Assessing the Vulnerability of Community Water Systems to Groundwater Contamination in Los Angeles County. Environ. Sci. Policy 2021, 124, 393–400. [Google Scholar] [CrossRef]
- Taner, M.Ü.; Ray, P.; Brown, C. Incorporating Multidimensional Probabilistic Information Into Robustness-Based Water Systems Planning. Water Resour. Res. 2019, 55, 3659–3679. [Google Scholar] [CrossRef]
- Orojloo, M.; Hashemy Shahdany, S.M.; Roozb0ahani, A. Developing an Integrated Risk Management Framework for Agricultural Water Conveyance and Distribution Systems within Fuzzy Decision Making Approaches. Sci. Total Environ. 2018, 627, 1363–1376. [Google Scholar] [CrossRef]
- Tiong, A.; Vergara, H.A. Evaluation of Network Expansion Decisions for Resilient Interdependent Critical Infrastructures with Different Topologies. Int. J. Crit. Infrastruct. Prot. 2023, 42, 100623. [Google Scholar] [CrossRef]
- Apostolakis, G.; Kaplan, S. Pitfalls in Risk Calculations. Reliab. Eng. 1981, 2, 135–145. [Google Scholar] [CrossRef]
- Sage, A.P. Risk Modeling, Assessment, and Management, 4th ed.; Haimes, Y.Y., Ed.; Wiley: Hoboken, NJ, USA, 2015; ISBN 978-1-119-01798-1. [Google Scholar]
- Aven, T. Risk Assessment and Risk Management: Review of Recent Advances on Their Foundation. Eur. J. Oper. Res. 2016, 253, 1–13. [Google Scholar] [CrossRef]
- Aven, T.; Reniers, G. How to Define and Interpret a Probability in a Risk and Safety Setting. Saf. Sci. 2013, 51, 223–231. [Google Scholar] [CrossRef]
- Ma, Q.; Zhang, J.; Xiong, B.; Zhang, Y.; Ji, C.; Zhou, T. Quantifying the Risks That Propagate from the Inflow Forecast Uncertainty to the Reservoir Operations with Coupled Flood and Electricity Curtailment Risks. Water 2021, 13, 173. [Google Scholar] [CrossRef]
- Rak, J. Safety of Water Supply System; Polish Academy of Science: Warsaw, Poland, 2009. [Google Scholar]
- Regulation (EU) No. 305/2011 of the European Parliament and of the Council of 9 March 2011 Establishing Harmonized Conditions for Placing Construction Products on the Market and Repealing Council Directive 89/106/EEC. Available online: https://Eur-Lex.Europa.Eu/Legal-Content/Cs/TXT/?uri=CELEX%3A32011R0305 (accessed on 10 December 2022).
- Giugni, M.; Kanakoudis, V.; Paola, F.D.; Keramaris, E. The 5th EWaS International Conference: “Water Security and Safety Management: Emerging Threats or New Challenges? Moving from Therapy and Restoration to Prognosis and Prevention”. Environ. Sci. Proc. 2022, 21, 39. [Google Scholar] [CrossRef]
- Tsitsifli, S.; Kanakoudis, V. Determining Hazards’ Prevention Critical Control Points in Water Supply Systems. Environ. Sci. Proc. 2020, 2, 53. [Google Scholar] [CrossRef]
- Kourbasis, N.; Patelis, M.; Tsitsifli, S.; Kanakoudis, V. Optimizing Water Age and Pressure in Drinking Water Distribution Networks. Environ. Sci. Proc. 2020, 2, 51. [Google Scholar] [CrossRef]
- Kaplan, S.; Garrick, B.J. On The Quantitative Definition of Risk. Risk Anal. 1981, 1, 11–27. [Google Scholar] [CrossRef]
- Haimes, Y.Y. Total Risk Management. Risk Anal. 1991, 11, 169–171. [Google Scholar] [CrossRef]
- Haimes, Y.Y.; Moser, D.A.; Stakhiv, E.Z. Risk-Based Decisionmaking in Water Resources X. In Proceedings of the Tenth Conference, Santa Barbara, CA, USA, 3–8 November 2002; Amer Society of Civil Engineers: Reston, VA, USA, 2003. ISBN 978-0-7844-0694-6. [Google Scholar]
- Płuciennik-Koropczuk, E.; Kumanowska, P. Chemical Stability of Water in the Water Supply Network—Preliminary Research. Civ. Environ. Eng. Rep. 2018, 28, 79–89. [Google Scholar] [CrossRef]
- Tchórzewska-Cieślak, B.; Pietrucha-Urbanik, K.; Papciak, D. An Approach to Estimating Water Quality Changes in Water Distribution Systems Using Fault Tree Analysis. Resources 2019, 8, 162. [Google Scholar] [CrossRef]
- García-Ávila, F.; Ramos-Fernández, L.; Zhindón-Arévalo, C. Estimation of Corrosive and Scaling Trend in Drinking Water Systems in the City of Azogues, Ecuador. Rev. Ambient. Água 2018, 13, e2237. [Google Scholar] [CrossRef]
- Pietrucha-Urbanik, K.; Tchórzewska-Cieślak, B.; Papciak, D.; Skrzypczak, I. Analysis of Chemical Stability of Tap Water in Terms of Required Level of Technological Safety. Arch. Environ. Prot. 2017, 43, 3–12. [Google Scholar] [CrossRef]
- PN-EN-805:2002; Water Supply. Requirements for Systems External and Their Components. CEN: Brussels, Belgium, 2000.
- Directive (EU) 2020/2184 of the European Parliament and of the Council of 16 December 2020 on the Quality of Water Intended for Human Consumption, OJ L 435, 23 December 2020. Available online: https://Eur-Lex.Europa.Eu/Legal-Content/EN/TXT/PDF/?uri=CELEX:32020L2184&from=EN (accessed on 20 December 2020).
- World Health Organization. Guidelines for Drinking-Water Quality, 4th ed.; World Health Organization: Geneva, Switzerland, 2011; Available online: https://Apps.Who.Int/Iris/Bitstream/Handle/10665/44584/9789241548151_eng.Pdf;jsessionid=FB26DE4E81767BC7525DC61A1537C754?Sequence=1 (accessed on 15 December 2022).

| Point Weight (k) | Value of VI |
|---|---|
| 1 | <100 |
| 2 | 101–160 |
| 3 | >160 |
| Risk Level | Point Range |
|---|---|
| Accepted | 1–8 |
| Controlled | 9–18 |
| Unacceptable | 19–27 |
| Statistical Characteristics | Diameter | |||||||
|---|---|---|---|---|---|---|---|---|
| 100 | 110 | 150 | 160 | 200 | 225 | 250 | 280 | |
| Std. Dev. | 8.85 | 2.57 | 7.14 | 2.17 | 3.02 | 1.19 | 3.61 | 0.45 |
| Median | 31.00 | 5.00 | 27.00 | 5.00 | 7.00 | 0.00 | 8.00 | 0.00 |
| Avg. value | 32.55 | 5.64 | 25.00 | 5.00 | 6.64 | 0.82 | 8.18 | 0.27 |
| Variance | 78.25 | 6.60 | 50.91 | 4.73 | 9.14 | 1.42 | 13.06 | 0.20 |
| perc. 0.25 | 25.50 | 4.00 | 18.50 | 4.00 | 4.50 | 0.00 | 6.50 | 0.00 |
| perc. 0.55 | 33.00 | 5.00 | 28.50 | 5.00 | 7.00 | 0.50 | 9.00 | 0.00 |
| perc. 0.75 | 38.50 | 7.00 | 30.50 | 5.00 | 7.50 | 1.00 | 11.50 | 0.50 |
| Statistical Characteristics | No. of Failures | |||||||||
|---|---|---|---|---|---|---|---|---|---|---|
| Diameter | ||||||||||
| 300 | 315 | 325 | 350 | 400 | 450 | 500 | 600 | 800 | 1200 | |
| Std. Dev. | 2.02 | 1.07 | 0.77 | 1.71 | 7.02 | 0.39 | 3.51 | 0.29 | 0.45 | 0.29 |
| Median | 2.00 | 0.00 | 0.00 | 3.00 | 20.00 | 0.00 | 1.00 | 0.00 | 0.00 | 0.00 |
| Avg. value | 2.91 | 0.64 | 0.64 | 2.73 | 20.55 | 0.18 | 2.82 | 0.09 | 0.27 | 0.09 |
| Variance | 4.08 | 1.14 | 0.60 | 2.93 | 49.34 | 0.15 | 12.33 | 0.08 | 0.20 | 0.08 |
| perc. 0.25 | 2.00 | 0.00 | 0.00 | 1.00 | 14.50 | 0.00 | 0.00 | 0.00 | 0.00 | 0.00 |
| perc. 0.55 | 3.00 | 0.00 | 0.50 | 3.50 | 21.50 | 0.00 | 2.00 | 0.00 | 0.00 | 0.00 |
| perc. 0.75 | 4.00 | 1.00 | 1.00 | 4.00 | 24.00 | 0.00 | 4.00 | 0.00 | 0.50 | 0.00 |
| Statistical Characteristics | No. of Failures | |||||
|---|---|---|---|---|---|---|
| Material | ||||||
| Steel | Galvanized Steel | Grey Cast Iron | PE | PCV | AC | |
| Std. Dev. | 32.51 | 7.44 | 18.17 | 5.12 | 2.93 | 1.30 |
| Median | 62.00 | 34.00 | 87.00 | 29.00 | 15.00 | 2.00 |
| Avg. value | 77.09 | 35.64 | 89.55 | 28.00 | 15.64 | 2.36 |
| Variance | 1056.81 | 55.32 | 330.25 | 26.18 | 8.60 | 1.69 |
| perc. 0.25 | 55.00 | 30.00 | 80.00 | 23.50 | 14.00 | 1.50 |
| perc. 0.55 | 74.50 | 35.50 | 90.50 | 29.00 | 16.00 | 2.50 |
| perc. 0.75 | 94.50 | 42.00 | 105.50 | 31.50 | 18.00 | 3.50 |
| Influencing Factor | Weight of the Factor wij | Rank Ri |
|---|---|---|
| 3 | 9 | |
| Network material: grey cast iron | 3 | 6 |
| Good hydrogeological factors influencing the network | 1 | 8 |
| Above standard monitoring of the network operations | 1 | 5 |
| No measures taken to prevent corrosion | 3 | 4 |
| Average dynamic loads and average density of underground utilities | 2 | 3 |
| Good hydraulic conditions within the network | 1 | 7 |
| Low susceptibility for the chemical stability of the water supplied by the network | 1 | 8 |
| Influencing Factor | Weight of the Factor wij | Rank Ri |
|---|---|---|
| Age of the water supply network: 10–30 years | 2 | 9 |
| Network material: plastic | 1 | 6 |
| Good hydrogeological factors influencing the network | 1 | 8 |
| Above standard monitoring of the network operations | 1 | 5 |
| Standard measures taken to prevent corrosion | 2 | 4 |
| Low dynamic loads and low density of underground utilities | 1 | 3 |
| Good hydraulic conditions within the network | 1 | 7 |
| Low susceptibility for the chemical stability of the water supplied by the network | 1 | 8 |
| Type of Failure/Risk | P | C | V | r |
|---|---|---|---|---|
| Failure of the main | 1 | 2 | 1 | 2 |
| Failure of the distribution network | 1 | 1 | 1 | 1 |
Disclaimer/Publisher’s Note: The statements, opinions and data contained in all publications are solely those of the individual author(s) and contributor(s) and not of MDPI and/or the editor(s). MDPI and/or the editor(s) disclaim responsibility for any injury to people or property resulting from any ideas, methods, instructions or products referred to in the content. |
© 2023 by the authors. Licensee MDPI, Basel, Switzerland. This article is an open access article distributed under the terms and conditions of the Creative Commons Attribution (CC BY) license (https://creativecommons.org/licenses/by/4.0/).
Share and Cite
Tchórzewska-Cieślak, B.; Pietrucha-Urbanik, K.; Piegdoń, I. The Failure Risk Analysis of the Water Supply Network. Water 2023, 15, 3815. https://doi.org/10.3390/w15213815
Tchórzewska-Cieślak B, Pietrucha-Urbanik K, Piegdoń I. The Failure Risk Analysis of the Water Supply Network. Water. 2023; 15(21):3815. https://doi.org/10.3390/w15213815
Chicago/Turabian StyleTchórzewska-Cieślak, Barbara, Katarzyna Pietrucha-Urbanik, and Izabela Piegdoń. 2023. "The Failure Risk Analysis of the Water Supply Network" Water 15, no. 21: 3815. https://doi.org/10.3390/w15213815
APA StyleTchórzewska-Cieślak, B., Pietrucha-Urbanik, K., & Piegdoń, I. (2023). The Failure Risk Analysis of the Water Supply Network. Water, 15(21), 3815. https://doi.org/10.3390/w15213815


