Brief Report

Remote Sensing with UAVs for Flood Modeling: A Validation with Actual Flood Records

1
Department of Civil Engineering, Universidad Católica de la Santísima Concepción, Concepción 4090541, Chile
2
Centro de Investigación en Biodiversidad y Ambientes Sustentables (CIBAS), Universidad Católica de la Santísima Concepción, Concepción 4090541, Chile
3
Department of Water Resources, Universidad de Concepción, Chillán 3812120, Chile
4
Centro Fondap CRHIAM, Universidad de Concepción, Concepción 4070411, Chile
5
Department of Envioromental Engineering, Universidad de Concepción, Concepción 4070386, Chile
*
Author to whom correspondence should be addressed.
Water 2023, 15(21), 3813; https://doi.org/10.3390/w15213813
Submission received: 21 September 2023 / Revised: 28 October 2023 / Accepted: 29 October 2023 / Published: 31 October 2023
(This article belongs to the Special Issue Global Flood Hazard: Applications in Flood Modelling and Mapping)

Abstract

:
The use of unmanned aerial vehicles (UAVs) is steadily increasing due to their capacity to capture terrain elevation data with remarkable precision and cost-effectiveness. Nonetheless, their application for estimating water surface elevations and submerged terrain, such as channel bathymetry, remains constrained. Consequently, the development of a digital terrain model that relies on UAV data during low-water periods assumes a more extensive dry channel surface area, thus alleviating the information gap regarding submerged terrain. The objective of this brief report is to validate a hydraulic model for flood calculation. To this end, a 1D steady-state hydrological model of the Ñuble River based on a UAV survey in the low-water period of 2016 was constructed in HEC-RAS v.5.0.3 and compared to water surface elevation observations of the flood on 24 June 2023. The model tends to overestimate the flood, but the errors are considered tolerable for flood calculation (on average, a 10.6% depth error was obtained for a 30-year return period flood); therefore, the hydraulic model derived from remote sensing seems to be an effective alternative for the construction of hydraulic models for flood studies.

1. Introduction

During 2022, a total of 387 natural disasters were reported, 176 of which were floods, affirming their status as the most frequent type of natural disaster [1]. These floods, along with heat waves and droughts, stood out as the catastrophic events that unfortunately caused the most human losses, according to the Center for Research on the Epidemiology of Disasters (CRED). As the global effects of climate change continue to intensify, the human and economic consequences of natural disasters are also on the rise [1,2].
Morphological river characterization is essential for accurate topological discretization. When combined with numerical analysis, it facilitates hydraulic modeling for a diverse range of applications. These include designing structures [3], implementing flood protection measures, managing and controlling water resources [4,5,6], investigating fluvial processes and the dynamics of pollutant transport [7], predicting scenarios to effectively respond to extreme events [8,9,10], and upholding the proper functioning of the social systems that develop around river systems [11,12], among others.
In the context of topography and mapping, the Earth’s surface encompasses terrestrial terrain, water bodies, vegetation, and man-made structures. A digital terrain model (DTM) is a depiction of the Earth’s surface that excludes vegetation and infrastructure [13]. Meanwhile, a comprehensive topo-bathymetric description of a watercourse is needed to create a hydraulic model. The level of precision achieved in the hydraulic model largely relies on the accuracy of the DTM [14].
Traditionally, gathering topo-bathymetric data has required extensive fieldwork, particularly in terms of bathymetric measurements. This process involves inherent risks for the individuals conducting the fieldwork [15,16,17,18]. Traditional approaches for measuring and modeling bathymetry in shallow water involve techniques like differential GPS (D-GPS), real-time kinematic GPS (RTK-GPS) [19], and total stations [20,21,22], which provide precise data, but involve a trade-off between the size of the area and spatial resolution, leading to a fragmented survey of the channel. This fragmentation may result in an erroneous interpretation of phenomena like erosion and sedimentation volumes [21,23]. Such techniques require direct contact with the riverbed and are limited to regions where it is safe to wade. Meanwhile, methods such as airborne LiDAR bathymetry (ALB) [24,25] and echo sounding techniques are suitable for collecting bathymetric information [26,27], but their commercial availability is limited [28,29]. Considering the substantial expenses associated with implementing and accessing this technology, it becomes imperative to explore alternative means of gathering information [30].
Remote sensing using unmanned aerial vehicles (UAVs) has emerged as a crucial method for flood surveillance and emergency assessment, owing to its agility and extensive coverage [30,31,32]. Airborne remote sensors have proven to be efficient tools for topographic characterization, primarily due to their cost-effectiveness in data acquisition and processing [33,34,35,36,37], along with their ability to estimate terrain elevation with centimeter-level precision [38,39,40]. Nevertheless, when dealing with water-covered surfaces, the accuracy of a digital terrain model (DTM) can be compromised by factors such as water transparency and the absence of consistent photogrammetric control points [38].
UAVs are employed in a non-invasive manner to remotely sense, access, and assess the shape and composition of elements within river basins, as well as hydrological processes across various spatial and temporal scales [41]. UAVs have been used to measure river flow [42,43], to calculate the environmental flow of a river [44], to determine land cover [45], and for landslide mapping and characterization [46], among other purposes.
Given that during low-water periods rivers present diminished flow rates and larger exposed riverbed areas [47,48], these periods are optimal for collecting topo-bathymetric data using UAVs [29]. The surface area that can be surveyed using aerial topography expands, while the portion requiring bathymetric measurements decreases. This results in a reduction in the uncharted area, making it feasible to create a robust and representative hydraulic model for river flood modeling and design. Consequently, this approach decreases the time and cost associated with gathering topo-bathymetric information [49].
Clasing et al. [49] carried out an exploratory analysis in three rivers of south-central Chile to develop hydraulic models based on remote sensing with UAVs that are representative for flood calculation. To this end, approaches based on aerial images, geometric characterization, and river classification were used. Two hydraulic models were constructed for each analyzed river: (i) one based on the traditional measuring techniques using RTK-GPS to measure the bathymetry and (ii) using remote sensing, with the assumption that the bathymetry represents a flat bed. The results showed that the hydraulic models tend to overestimate the flood, and that as the flow increases, the differences in water surface elevation between the two compared models decrease. The authors highlight the importance of UAVs as an effective, low-cost alternative for the construction of hydraulic models obtained via remote sensing compared to traditional methods to collect information.
Therefore, the objective of this study is to validate a hydraulic model built based on remote sensing using the methodology described by Clasing et al. [49], together with actual measurements of a flood. To this end, the Ñuble River flood, which occurred during an extreme event on 24 June 2023, was considered. During this event, flooding due to overflowing of rivers, streams, and canals was recorded in study area and surroundings, causing loss of connectivity, damage to homes, and a red alert in zones near the main channel [50,51].
In this context, despite the availability of various technologies that enable bathymetry measurements with sufficient accuracy to map river cross-sections, practitioners face the challenging task of transporting heavy, expensive equipment into the field, where they often spend hours or even days collecting data [52,53]. This logistical complexity, as noted in several studies [54,55], has generated a paucity of research in this area, which in turn has limited the scope of studies or restricted them to locations of specific interest.
It is essential to emphasize that this study focuses on flood estimation, with the objective of providing a practical application for practitioners. The decision to forego bathymetric data represents a deliberate balance between the accuracy of model estimates and ease of measurement, cost effectiveness, and breadth of coverage, in addition to other benefits associated with UAV-DTM-derived data.

2. Materials and Methods
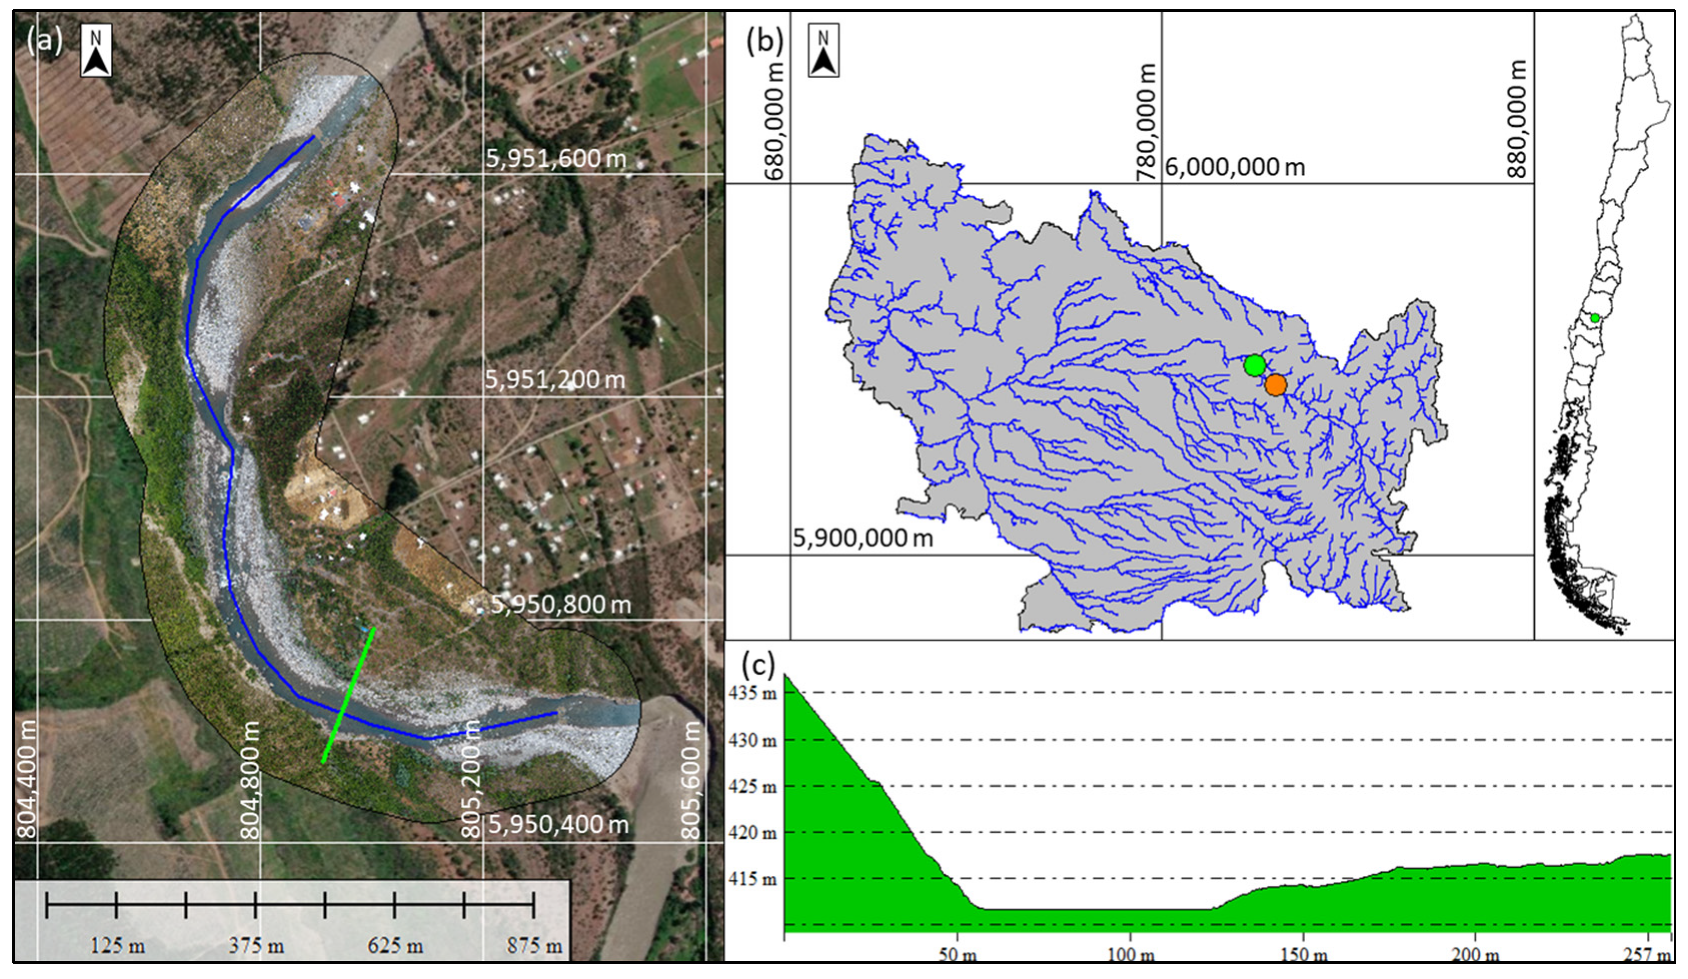
2.1. Study Area

The Ñuble River, situated in south-central Chile (Figure 1), rises west of Nevados de Chillan in the Andes Mountains. It exhibits a mixed flow regime (rain–snow, rain-dominated), characterized by a streamflow exceeding 100 m3/s between May and June due to precipitation, and between October and November due to snowmelt, while low flows (<30 m3/s) are observed between February and April [56].
The research area encompasses a specific section of the Ñuble River, close to the town of San Fabián de Alico. It measures approximately 1.6 km in length and is located 8 km downstream of the Río Ñuble en San Fabián N2 stream gauge station (Figure 1b).

2.2. 24 June 2023, Event

Between 21 and 26 June 2023, an extreme meteorological event affected central Chile, generating both social and environmental impacts [50,57,58]. The magnitude of the phenomenon led authorities to declare a state of catastrophe in the affected areas. Nationwide, there were around 10,000 people isolated, 4000 people with damaged homes, 3 missing, and 2 dead [59]. Public infrastructure impacts included road closures, disabled bridges, and drinking water supply suspensions for urban and rural communities [50,57,58].
Overflows and floods occurred in the study area, where the Chilean National Disaster Prevention and Response Service (SENAPRED) issued a red alert due to the threat of flooding, evacuating families from different areas along the channel [50,51,60]. At the Río Ñuble en San Fabián N2 stream gauging station, at 05:42 a flow of 2578.2 m3/s was recorded, which was the peak flow recorded in June. Based on statistics from 78 years (1946–2023) of flow records, along with Gumbel and Pearson III theoretical probability density functions suitable for high flows in the study area [61], and the Kolmogorov–Smirnov goodness-of-fit test, the Ñuble River flood is linked to a return period of T = 30 years. Considering the relationship between the stream gauge basin and the study area basin, by means of transposition by area, a flood flow of 2626.8 m3/s was determined for the study area. This method represents an approximation for flow estimations based on the hydrologic similarity between a basin and it sub-basin [62]. It assumes that the flow per unit of area is the same in the monitored and studied basins, allowing the flow of the studied basin to be estimated as a proportion of the area and precipitation of the gauged basin [63].

2.3. UAV Measurements

During a field campaign performed on 27 January 2016, an aerophotogrammetric survey of a section of the Ñuble River was conducted via remote sensing equipment transported on a fixed-wing UAV, which characterized the study area. The survey was georeferenced, and its precision was verified through the measurement of four ground control points (GCPs) using RTK-GPS. The UAV-captured images were processed using Pix4D® version 4.5. This processing facilitated the generation of a georeferenced orthophoto and a point cloud with a 50-centimeter spacing in LAZ format. A classification of points into terrain and non-terrain categories was conducted based on relative differences from the local mean, considering factors like color and elevation and using orthorectified aerial photography. Points designated as terrain were then employed in the creation of the river’s topographic data.

2.4. RTK-GPS Flood Measurements

After the 24 June 2023 Ñuble River flood, RTK-GPS was used to obtain flood elevation records. It bears mentioning that due to the danger associated with river floods, official restrictions on approaching channels at times of increased flows are imposed by the authorities [50]. Therefore, the acquisition of precise water level elevation measurements was a challenging task.
To address this limitation, a topographic survey was conducted using RTK-GPS, in which visible traces left by the flood, such as alterations to vegetation along the banks, accumulation of plant matter on the banks, and evident high-water marks, were taken into account. This approach allowed the determination of probable levels reached by the river during its peak flood stage. The data obtained during this field observation were established as a reference for analysis, and are referred to as observed water surface elevation (WSEOBS) data.

2.5. DTM—Remote Sensing (DTMRS)

Using the aerophotogrammetric information acquired in 2016 and following the methodology developed by Clasing et al. [49], a DTMRS was created. During this process, the demarcation between the submerged and exposed portions of the river was determined by analyzing the aerial imagery. Based on this distinction, the processing was carried out separately for the wet and dry areas. The topographic data were derived from the point cloud, specifically the portions classified as terrain, which were generated from the UAV-captured photographs. The bathymetry of the wet zone was established using water level data derived from the aerophotogrammetric survey. This involved identifying points along the channel banks that represented the water surface level. Consequently, the submerged section of the river was treated as having a flat bed. Figure 1a shows the aerophotogrammetric survey area, Figure 1b shows the study area relative to the Río Ñuble en San Fabián N2 stream gauging station, and Figure 1c shows a cross-section of the DTMRS, which has a flat bed.

2.6. Channel Classification

The classification system proposed by Rosgen [64] was used to characterize the channels. This categorization comprises four tiers: basic morphological characterization (level I), morphological description (level II), survey of river stability conditions (level III), and verification (level IV). This classification system has been employed to understand processes within river systems and their corresponding morphology [65], for the design of stream restoration projects [66,67], and to determine the ecological status of terrain [68], among other purposes.
In this research, classification level II was implemented, offering a detailed morphological depiction of the channel derived from field-collected data. This level of morphological characterization requires the computation of the ratio between the width of the flood-prone area to the surface width of the bankfull channel, the entrenchment ratio (ER) [64], the width-to-depth ratio (W/D), sinuosity, and surface slope, in addition to identification of the composition of the bed material.

2.7. Hydraulic Modeling

Following the methodology in Clasing et al. [49], a remote sensing hydraulic model, referred to as HMRS, was constructed using DTMRS. To extract geometric data pertaining to the active channel and its floodplain from a digital terrain model (DTM), ArcGIS (version 10.5) and its extension, the Geographic Information System Geo-Spatial River Analysis System (HEC-GeoRAS), were employed. To this end, the georeferenced orthophoto derived from the UAV was used to delineate the primary channel and demarcate the boundary between the active channel and the floodplain. The cross-sections were drawn every 20 m perpendicular to the main channel.
To represent the geometric data of the river extracted from the DTM in a model, HEC-RAS v.5.0.3, developed by U.S. Army Corps of Engineers, was used. The modeling conducted in HEC-RAS employed a one-dimensional (1D), steady-state approach. This approach is considered effective for predicting flood extents in the context of hydraulic design and for conducting risk assessments [69,70,71]. The water surface slope, determined through DTMRS and the orthophoto, was used as a boundary condition. This slope was calculated by identifying the water surface elevation at the initial and final cross-sections of the river based on the 2016 aerial photogrammetric survey. Additionally, for the entire modeled section, the Manning’s roughness coefficient (n) was estimated based on ranges presented by Chow [72] (which accounted for vegetation and irregularities) and pictures and metrics presented by the USGS [73]. Specifically, river images, metrics (flow, bed grain size, river width, among others), and a roughness coefficient were compared with images and metrics derived from the orthophoto of the studied river in order to estimate n. Estimated values of n = 0.043 for the riverbed and n = 0.050 for the floodplain were determined for the Ñuble River.
To analyze the behavior of the HMRS, linear interpolation of the cross-sections at 1 m intervals was performed, thereby adding the observed flood level points, which were considered correct and representative of the 24 June 2023 flood.
To assess the reliability of the results of the water surface elevation of HMRS (WSERS), two objective functions were used: the root mean square error (RMSE) (Equation (1)) and the mean absolute error (MAE) (Equation (2)). The observed water surface elevation (WSEOBS) served as the reference elevation. N indicates the number of studied cross-sections.
Furthermore, the mean absolute percentage error (MAPE) function (Equation (3)) was applied to assess the percentage variation in the depths. Depth measurements were determined using the bed elevation from the HMRS as a reference, in conjunction with the WSERS and WSEOBS results. The depth calculated using the observed data (DepthOBS) served as a reference for this comparison, and DeptRS means for the depth estimated with the HMRS.
The RMSE and MAE measure the differences between the observed and estimated (modeled) values, representing the magnitudes of deviations between the estimated and observed water surface elevations. Values close to zero indicate a good fit between the model and observations. On the other hand, the MAPE accounts for percentage differences between estimated and observed values, allowing the observation of relative differences that do not depend on the magnitude of the river’s elevation.
R M S E = 1 N j = 1 N W S E O B S W S E R S 2
M A E = 1 N j = 1 N | W S E O B S W S E R S |
M A P E = 1 N j = 1 N ( D e p t h O B S D e p t h R S / D e p t h O B S ) · 100

3. Results

Figure 2 shows the results obtained from the modeling, along with a comparison of the results. Figure 2a shows the longitudinal profile of the Ñuble River obtained from the HMRS. Also shown are the observed data from after the June 2023 flood. By means of a boxplot, Figure 2b shows the obtained differences between the WSEOBS and WSERS. Similarly, Figure 2c shows the MAPE obtained from the depth comparison.
Table 1 shows the RMSE and MAE results for the comparison between the WSEOBS and WSERS. The maximum WSE differences were 0.96 m and 0.98 m for the RMSE and MAE, respectively, while the minimum differences were 0.02 and 0.13 m for the RMSE and MAE, respectively. Meanwhile, the mean depths are 6 m according to observed data and 6.5 m according to simulated data (HMRS).
The studied section of the Ñuble River has a slight entrenchment ratio (ER > 2.2), an elevated width/depth ratio (W/D > 12), and high sinuosity (sinuosity >1.4). It was assumed that the river slope is 0.005 m/m and the bed material consists of boulders. Considering these variables, along with the shape of the cross-sections shown by Rosgen [64], the studied section of the Ñuble River was classified as C2.

4. Discussion

In this study, the HMRS results were compared with field observations of the water surface level of the 24 June 2023 flood. To this end, an HMRS was constructed based on a DTMRS, which covered approximately 1.6 km of river, where the dry area, that is, the topography, was obtained from measurements with a UAV in the low-water season of 2016, while the wet area was assumed to be a flat bed. Gathering measurements during the low-water period implies a reduced wet surface area, which in turn mitigates the scarcity of bathymetric data when assuming a flat bed.
The assumption of a flat bed in the DTMRS bathymetry results in an increase in both the channel bottom elevation and the water surface elevation, as depicted in Figure 2a, where the longitudinal profile of the river is generally higher than the observed data; that is, the HMRS overestimates the flood level due to the increase in the bed level. Similarly, in Figure 2b the discrepancies between WSEOBS and WSERS mainly indicate negative values (WSEOBS < WSERS).
The error results suggest that the WSERS tends to overestimate flooding, making the output more conservative for hydraulic design and flood risk analysis. On average, an MAPE percentage difference of 10.6% was obtained for the depths, and for the WSE comparison, an RMSE of 0.68 m and an MAE of 0.63 m were obtained. These results are consistent with the findings of Clasing et al. [49], where for type C rivers (Bellavista and Curanilahue rivers) flooding is overestimated. For a return period equivalent in years (T = 30 years) in Bellavista and Curanilahue, an RMSE of 0.25 m and an MAE of 0.20 m, approximately, were obtained for each river. In both cases, an MAPE below 10% on average was obtained in the equivalent return period.
Although there are differences between the modeling results for equivalent return periods of the Ñuble, Bellavista, and Curanilahue rivers, the magnitudes of the studied sections bear mentioning; the Ñuble River has a T = 30-year flow approximately 20 times greater than the T = 150-year flows of the Bellavista and Curanilahue rivers.
Meanwhile, the HMRS enables flood modeling with conservative outcomes compared to the observed data. Consequently, the HMRS appears to be a secure, cost-effective alternative that is particularly suitable for critical situations, and is efficient for the creation of hydraulic models for flood calculations.
Due to the morphological characteristics of the Ñuble River (classified as type C according to the Level II Rosgen classification), for rivers with a modest degree of entrenchment (e.g., types C, D, DA, and E), when flows exceed the bankfull level, they spill over the riverbanks and spread out onto the floodplain; therefore, the flood width increases more than the flood level, which does not occur for deeply entrenched channels (types A, F, G), since, in these cases, at flows that surpass the banks, the depth increases much faster than the width as the flow increases. Since the Ñuble River is type C, the WSE will vary less than the flood width as the flow increases.
It bears mentioning that the restrictions on flood level measurement on 24 June 2023 may introduce minor inaccuracies to the interpretation of field observations, increasing uncertainty and possibly affecting the comparative analysis of the obtained results. However, for a flood of 2626 m3/s, the analysis presents an MAPE error of 10.6% with maximum depths of 7.9 m; therefore, the errors are considered tolerable according to the conditions of the model, making it valid for flood calculation.
Information obtained from UAVs during periods of low water levels provides the opportunity to develop a valid and representative hydraulic model for simulating river flood scenarios. These models tend to yield conservative results when compared to observed data, indicating that the use of an HMRS can serve as a reliable alternative. This is particularly valuable in critical situations, such as extreme events intensified by climate change, and is effective for creating accurate hydraulic models for flood prediction. In addition, climate change is forcing us to tackle more frequent extreme event such as floods and related disasters.
Dealing with climate change and its associated challenges such as flooding is a complex and urgent task, with floods posing a significant threat to communities and ecosystems. Addressing these challenges requires an informed decision-making process. This report presents a straightforward and cost-effective alternative for estimating flood coverage, velocity, inundated areas, and other vital flood-related components. It serves as a practical tool for practitioners and stakeholders, contributing to better preparedness for the climate-induced challenges that societies are currently grappling with.

5. Conclusions

In this study, the validity of a hydraulic flood model obtained from remote sensing was analyzed relative to flood records obtained in the field. Topographic information obtained using a UAV in the low-water period of 2016 and observations of the T = 30-year flood that occurred on 24 June 2023 were used.
Using a DTMRS of the study area, an HMRS was constructed, and the WSERS results were compared to the WSEOBS. In addition, the river underwent classification according to the Rosgen classification system.
The HMRS of the Ñuble River allows floods to be modeled with conservative results relative to those obtained by field observations of the 24 June 2023 flood, as it overestimates depths by 10.6%. Considering that the maximum depths exceed 7 m, the RMSE is 0.68 m; therefore, the model is considered valid for representing a flood.
The comparison with the results obtained by Clasing et al. [49] serves as a motivation for the analysis of other rivers with different morphologies and magnitudes.
The methodology used to create the HMRS is well-suited for rivers that exhibit more pronounced dry areas during their low-water seasons. The classification of channel morphology enables a better comprehension of WSE behavior during floods, consequently reducing the uncertainty stemming from areas unmeasured by the UAV.

Author Contributions

Conceptualization, R.C. and E.M.; methodology, R.C. and E.M.; software, R.C.; validation, R.C. and E.M.; formal analysis, R.C., E.M., J.L.A. and V.P.; investigation, R.C. and E.M.; resources, E.M.; data curation, R.C.; writing—original draft preparation, R.C., E.M., J.L.A. and V.P.; writing—review and editing, R.C., E.M. and J.L.A.; visualization, R.C. and E.M.; supervision, E.M. and J.L.A.; project administration, E.M.; funding acquisition, E.M. and J.L.A. All authors have read and agreed to the published version of the manuscript.

Funding

This research was funded by the CIBAS 2019-01 project, DI-FME 03/2021, and by the CRHIAM Center project ANID/FONDAP/15130015.

Institutional Review Board Statement

Not applicable.

Informed Consent Statement

Not applicable.

Data Availability Statement

Acknowledgments

The authors thank Pix4d for providing an educational license for their products and CRHIAM, project ANID/FONDAP/15130015.

Conflicts of Interest

The authors declare no conflict of interest.

References

  1. Jones, R.L.; Guha-Sapir, D.; Tubeuf, S. Human and economic impacts of natural disasters: Can we trust the global data? Sci. Data 2022, 9, 572. [Google Scholar] [CrossRef] [PubMed]
  2. Chatzichristaki, C.; Stefanidis, S.; Stefanidis, P.; Stathis, D. Analysis of the flash flood in Rhodes Island (South Greece) on 22 November 2013. Silva 2015, 16, 76–86. [Google Scholar]
  3. Açıl, A.; Aydın, A.; Eker, R.; Duyar, A. Use of UAV Data and HEC-RAS Model for Dimensioning of Hydraulic Structures on Forest Roads. Croat. J. For. Eng. J. Theory Appl. For. Eng. 2023, 44, 171–188. [Google Scholar] [CrossRef]
  4. Bures, L.; Roub, R.; Sychova, P.; Gdulova, K.; Doubalova, J. Comparison of bathymetric data sources used in hydraulic modelling of floods. Flood Risk Manag. 2018, 12, e12495. [Google Scholar] [CrossRef]
  5. Wang, X.; Xie, H. A Review on Applications of Remote Sensing and Geographic Information Systems (GIS) in Water Resources and Flood Risk Management. Water 2018, 10, 608. [Google Scholar] [CrossRef]
  6. Watanabe, Y.; Kawahara, Y. UAV Photogrammetry for Monitoring Changes in River Topography and Vegetation. Procedia Eng. 2016, 154, 317–325. [Google Scholar] [CrossRef]
  7. Kim, J.S.; Baek, D.; Seo, I.W.; Shin, J. Retrieving shallow stream bathymetry from UAV-assisted RGB imagery using a geospatial regression method. Geomorphology 2019, 341, 102–114. [Google Scholar] [CrossRef]
  8. Degiorgis, M.; Gnecco, G.; Gorni, S.; Roth, G.; Sanguineti, M.; Taramasso, A.C. Classifiers for the detection of flood-prone areas using remote sensed elevation data. J. Hydrol. 2012, 470–471, 302–315. [Google Scholar] [CrossRef]
  9. Petrović, A.M.; Kovačević-Majkić, J.; Milošević, M. V Application of run-off model as a contribution to the torrential flood risk management in Topčiderska Reka watershed, Serbia. Nat. Hazards 2016, 82, 1743–1753. [Google Scholar] [CrossRef]
  10. Salmoral, G.; Casado, M.R.; Muthusamy, M.; Butler, D.; Menon, P.P.; Leinster, P. Guidelines for the use of unmanned aerial systems in flood emergency response. Water 2020, 12, 521. [Google Scholar] [CrossRef]
  11. Castellarin, A.; Domeneghetti, A.; Brath, A. Identifying robust large-scale flood risk mitigation strategies: A quasi-2D hydraulic model as a tool for the Po river. Phys. Chem. Earth Parts A/B/C 2011, 36, 299–308. [Google Scholar] [CrossRef]
  12. Koc, K.; Isik, Z. A multi-agent-based model for sustainable governance of urban flood risk mitigation measures. Nat. Hazards 2020, 104, 1079–1110. [Google Scholar]
  13. Pandjaitan, N.H.; Sutoyo; Rau, M.I.; Febrita, J.; Dharmawan, I.; Akhmat, I. Comparison between DSM and DTM from photogrammetric UAV in Ngantru Hemlet, Sekaran Village, Bojonegoro East Java. In Proceedings of the Sixth International Symposium on LAPAN-IPB Satellite, Bogor, Indonesia, 17–18 September 2019; Volume 11372. [Google Scholar]
  14. Papaioannou, G.; Loukas, A.; Vasiliades, L.; Aronica, G.T.; Gr, G. Flood inundation mapping sensitivity to riverine spatial resolution and modelling approach. Nat. Hazards 2016, 83, 117–132. [Google Scholar] [CrossRef]
  15. Ballesteros Cánovas, J.A.; Eguibar, M.; Bodoque, J.M.; Díez-Herrero, A.; Stoffel, M.; Gutiérrez-Pérez, I. Estimating flash flood discharge in an ungauged mountain catchment with 2D hydraulic models and dendrogeomorphic palaeostage indicators. Hydrol. Process. 2011, 25, 970–979. [Google Scholar] [CrossRef]
  16. Bodoque, J.M.; Díez-Herrero, A.; Eguibar, M.A.; Benito, G.; Ruiz-Villanueva, V.; Ballesteros-Cánovas, J.A. Challenges in paleoflood hydrology applied to risk analysis in mountainous watersheds—A review. J. Hydrol. 2015, 529, 449–467. [Google Scholar] [CrossRef]
  17. Flener, C.; Lotsari, E.; Alho, P.; Käyhkö, J. Comparison of empirical and theoretical remote sensing based bathymetry models in river environments. River Res. Appl. 2012, 28, 118–133. [Google Scholar] [CrossRef]
  18. Jawak, S.D.; Vadlamani, S.S.; Luis, A.J.; Jawak, S.D.; Vadlamani, S.S.; Luis, A.J. A Synoptic Review on Deriving Bathymetry Information Using Remote Sensing Technologies: Models, Methods and Comparisons. Adv. Remote Sens. 2015, 4, 147–162. [Google Scholar] [CrossRef]
  19. Brasington, J.; Rumsby, B.T.; McVey, R.A. Monitoring and modelling morphological change in a braided gravel-bed river using high resolution GPS-based survey. Earth Surf. Process. Landforms 2000, 25, 973–990. [Google Scholar] [CrossRef]
  20. Koljonen, S.; Huusko, A.; Mäki-Petäys, A.; Louhi, P.; Muotka, T. Assessing Habitat Suitability for Juvenile Atlantic Salmon in Relation to In-Stream Restoration and Discharge Variability. Restor. Ecol. 2013, 21, 344–352. [Google Scholar] [CrossRef]
  21. Lane, S.N.; Richards, K.S.; Chandler, J.H. Developments in monitoring and modelling small-scale river bed topography. Earth Surf. Process. Landforms 1994, 19, 349–368. [Google Scholar] [CrossRef]
  22. Milne, J.A.; Sear, D.A. Modelling river channel topography using GIS. Int. J. Geogr. Inf. Sci. 1997, 11, 499–519. [Google Scholar] [CrossRef]
  23. Westaway, R.M.; Lane, S.N.; Hicks, D.M. Remote sensing of clear-water, shallow, gravel-bed rivers using digital photogrammetry. Photogramm. Eng. Remote Sens. 2001, 67, 1271–1282. [Google Scholar]
  24. Guenther, G.C. Airborne lidar bathymetry. Digit. Elev. Model Technol. Appl. DEM Users Man. 2007, 2, 253–320. [Google Scholar]
  25. Kinzel, P.J.; Legleiter, C.J.; Nelson, J.M. Mapping River Bathymetry With a Small Footprint Green LiDAR: Applications and Challenges1. JAWRA J. Am. Water Resour. Assoc. 2013, 49, 183–204. [Google Scholar] [CrossRef]
  26. Guerrero, M.; Lamberti, A. Flow field and morphology mapping using ADCP and multibeam techniques: Survey in the Po River. J. Hydraul. Eng. 2011, 137, 1576–1587. [Google Scholar] [CrossRef]
  27. Kasvi, E.; Laamanen, L.; Lotsari, E.; Alho, P. Flow Patterns and Morphological Changes in a Sandy Meander Bend during a Flood—Spatially and Temporally Intensive ADCP Measurement Approach. Water 2017, 9, 106. [Google Scholar] [CrossRef]
  28. Costa, B.M.; Battista, T.A.; Pittman, S.J. Comparative evaluation of airborne LiDAR and ship-based multibeam SoNAR bathymetry and intensity for mapping coral reef ecosystems. Remote Sens. Environ. 2009, 113, 1082–1100. [Google Scholar] [CrossRef]
  29. Flener, C.; Vaaja, M.; Jaakkola, A.; Krooks, A.; Kaartinen, H.; Kukko, A.; Kasvi, E.; Hyyppä, H.; Hyyppä, J.; Alho, P. Seamless mapping of river channels at high resolution using mobile LiDAR and UAV-photography. Remote Sens. 2013, 5, 6382–6407. [Google Scholar]
  30. Genchi, S.A.; Vitale, A.J.; Perillo, G.M.E.; Seitz, C.; Delrieux, C.A. Mapping Topobathymetry in a Shallow Tidal Environment Using Low-Cost Technology. Remote Sens. 2020, 12, 1394. [Google Scholar] [CrossRef]
  31. Karamuz, E.; Romanowicz, R.J.; Doroszkiewicz, J. The use of unmanned aerial vehicles in flood hazard assessment. J. Flood Risk Manag. 2020, 13, e12622. [Google Scholar] [CrossRef]
  32. Zhang, J.; Xu, S.; Zhao, Y.; Sun, J.; Xu, S.; Zhang, X. Aerial orthoimage generation for UAV remote sensing. Inf. Fusion 2023, 89, 91–120. [Google Scholar]
  33. Granados-Bolaños, S.; Quesada-Román, A.; Alvarado, G.E. Low-cost UAV applications in dynamic tropical volcanic landforms. J. Volcanol. Geotherm. Res. 2021, 410, 107143. [Google Scholar] [CrossRef]
  34. Hill, D.J.; Pypker, T.G.; Church, J. Applications of Unpiloted Aerial Vehicles (UAVs) in Forest Hydrology BT—Forest-Water Interactions; Levia, D.F., Carlyle-Moses, D.E., Iida, S., Michalzik, B., Nanko, K., Tischer, A., Eds.; Springer International Publishing: Cham, Switzerland, 2020; pp. 55–85. ISBN 978-3-030-26086-6. [Google Scholar]
  35. Koutalakis, P.; Tzoraki, O.; Zaimes, G. Drones UAVs for Hydrologic Scopes: Application of a Low-Cost UAV to Estimate Surface Water Velocity by Using Three Different Image-Based Methods. Drones 2019, 3, 14. [Google Scholar] [CrossRef]
  36. Lei, T.; Wang, J.; Li, X.; Wang, W.; Shao, C.; Liu, B. Flood Disaster Monitoring and Emergency Assessment Based on Multi-Source Remote Sensing Observations. Water 2022, 14, 2207. [Google Scholar] [CrossRef]
  37. Mazzoleni, M.; Paron, P.; Reali, A.; Juizo, D.; Manane, J.; Brandimarte, L. Testing UAV-derived topography for hydraulic modelling in a tropical environmentderived topography LiDAR RTK-GPS·SRTM Hydraulic model Tropical environment. Nat. Hazards 2020, 103, 139–163. [Google Scholar] [CrossRef]
  38. Bandini, F.; Sunding, T.P.; Linde, J.; Smith, O.; Jensen, I.K.; Köppl, C.J.; Butts, M.; Bauer-Gottwein, P. Unmanned Aerial System (UAS) observations of water surface elevation in a small stream: Comparison of radar altimetry, LIDAR and photogrammetry techniques. Remote Sens. Environ. 2020, 237, 111487. [Google Scholar] [CrossRef]
  39. Carbonneau, P.E.; Dietrich, J.T. Cost-effective non-metric photogrammetry from consumer-grade sUAS: Implications for direct georeferencing of structure from motion photogrammetry. Earth Surf. Process. Landforms 2016, 42, 473–486. [Google Scholar] [CrossRef]
  40. Santise, M.; Fornari, M.; Forlani, G.; Roncella, R. Evaluation of dem generation accuracy from UAS imagery. Int. Arch. Photogramm. Remote Sens. Spat. Inf. Sci. 2014, 45, 529–536. [Google Scholar] [CrossRef]
  41. Acharya, B.S.; Bhandari, M.; Bandini, F.; Pizarro, A.; Perks, M.; Joshi, D.R.; Wang, S.; Dogwiler, T.; Ray, R.L.; Kharel, G.; et al. Unmanned Aerial Vehicles in Hydrology and Water Management: Applications, Challenges, and Perspectives. Water Resour. Res. 2021, 57, e2021WR029925. [Google Scholar] [CrossRef]
  42. Koutalakis, P.; Zaimes, G.N. River Flow Measurements Utilizing UAV-Based Surface Velocimetry and Bathymetry Coupled with Sonar. Hydrology 2022, 9, 148. [Google Scholar] [CrossRef]
  43. Tauro, F.; Porfiri, M.; Grimaldi, S. Surface flow measurements from drones. J. Hydrol. 2016, 540, 240–245. [Google Scholar] [CrossRef]
  44. Zhao, C.S.; Zhang, C.B.; Yang, S.T.; Liu, C.M.; Xiang, H.; Sun, Y.; Yang, Z.Y.; Zhang, Y.; Yu, X.Y.; Shao, N.F.; et al. Calculating e-flow using UAV and ground monitoring. J. Hydrol. 2017, 552, 351–365. [Google Scholar] [CrossRef]
  45. Furukawa, F.; Laneng, L.A.; Ando, H.; Yoshimura, N.; Kaneko, M.; Morimoto, J. Comparison of RGB and Multispectral Unmanned Aerial Vehicle for Monitoring Vegetation Coverage Changes on a Landslide Area. Drones 2021, 5, 97. [Google Scholar] [CrossRef]
  46. Rossi, G.; Tanteri, L.; Tofani, V.; Vannocci, P.; Moretti, S.; Casagli, N. Multitemporal UAV surveys for landslide mapping and characterization. Landslides 2018, 15, 1045–1052. [Google Scholar] [CrossRef]
  47. Hicks, D.M. Remotely Sensed Topographic Change in Gravel Riverbeds with Flowing Channels. In Gravel-Bed Rivers; John Wiley & Sons, Ltd.: Hoboken, NJ, USA, 2012; pp. 303–314. ISBN 9781119952497. [Google Scholar]
  48. Williams, R.D.; Brasington, J.; Vericat, D.; Hicks, D.M. Hyperscale terrain modelling of braided rivers: Fusing mobile terrestrial laser scanning and optical bathymetric mapping. Earth Surf. Process. Landforms 2014, 39, 167–183. [Google Scholar] [CrossRef]
  49. Clasing, R.; Muñoz, E.; Arumí, J.L.; Caamaño, D.; Alcayaga, H.; Medina, Y. Remote Sensing with UAVs for Modeling Floods: An Exploratory Approach Based on Three Chilean Rivers. Water 2023, 15, 1502. [Google Scholar] [CrossRef]
  50. SENAPRED. Servicio Nacional de Prevención y Respuesta ante Desastres. Ministerio del Interior y Seguridad Pública de Chile. Available online: https://web.senapred.cl/monitoreo-por-evento-meteorologico-entre-las-regiones-de-ohiggins-y-los-lagos/ (accessed on 29 October 2023).
  51. LaDiscusión. Ñuble en Alerta Roja por Desbordes de Ríos, Esteros y Canales. 2023. Available online: https://www.ladiscusion.cl/nuble-en-alerta-roja-por-desbordes-de-rios-esteros-y-canales/ (accessed on 17 August 2023).
  52. Bures, L.; Sychova, P.; Maca, P.; Roub, R.; Marval, S. River Bathymetry Model Based on Floodplain Topography. Water 2019, 11, 1287. [Google Scholar] [CrossRef]
  53. Kammerer, E.; Charlot, D.; Guillaudeux, S.; Michaux, P. Comparative study of shallow water multibeam imagery for cleaning bathymetry sounding errors. In Proceedings of the MTS/IEEE Oceans 2001. An Ocean Odyssey. Conference Proceedings (IEEE Cat. No. 01CH37295), Honolulu, HI, USA, 5–8 November 2001; IEEE: Piscataway, NJ, USA, 2001; Volume 4, pp. 2124–2128. [Google Scholar]
  54. Lee, C.-H.; Liu, L.-W.; Wang, Y.-M.; Leu, J.-M.; Chen, C.-L. Drone-Based Bathymetry Modeling for Mountainous Shallow Rivers in Taiwan Using Machine Learning. Remote Sens. 2022, 14, 3343. [Google Scholar] [CrossRef]
  55. Pacheco, A.; Horta, J.; Loureiro, C.; Ferreira, Ó. Retrieval of nearshore bathymetry from Landsat 8 images: A tool for coastal monitoring in shallow waters. Remote Sens. Environ. 2015, 159, 102–116. [Google Scholar] [CrossRef]
  56. Buzolic, B.; Arumí, J.L.; Jimenez, J. How Much Does Water Management Cost? The Case of the Water Market in the Ñuble River of South-Central Chile. Water 2021, 13, 258. [Google Scholar] [CrossRef]
  57. CR2. Center for Climate and Resilience Research. 2023. Available online: www.cr2.cl (accessed on 18 August 2023).
  58. Garreaud, R. Análisis (CR)2|Vuelven Los Gigantes: Un Análisis Preliminar de la Tormenta Ocurrida Entre el 21 y 26 de Junio de 2023 en Chile Central. 2023. Available online: https://www.cr2.cl/analisis-cr2-vuelven-los-gigantes-un-analisis-preliminar-de-la-tormenta-ocurrida-entre-el-21-y-26-de-junio-de-2023-en-chile-central/ (accessed on 20 October 2023).
  59. Tribuna, L. Balance por Inundaciones: Dos Fallecidos, Tres Desaparecidos y Sobre Cuatro Mil Damnificados. 2023. Available online: https://www.latribuna.cl/medio-ambiente/2023/06/26/balance-por-inundaciones-dos-fallecidos-tres-desaparecidos-y-sobre-cuatro-mil-damnificado.html (accessed on 22 August 2023).
  60. BiobioChile. Evacúan a Familias en San Fabián de Alico por Crecida de Ríos Ñuble y Perquilauquén. Available online: https://www.biobiochile.cl/noticias/nacional/region-de-nuble/2023/06/23/evacuan-a-familias-en-san-fabian-de-alico-por-crecida-de-rios-nuble-y-perquilauquen.shtml (accessed on 17 August 2023).
  61. Aguilera Navarro, M.A.; Pizarro Tapía, R. Estimación de Funciones de Distribución de Probabilidad, Para Caudales Màximos, en la Región del Maule; Universidad de Talca: Maule, Chile, 2007. [Google Scholar]
  62. Wagener, T.; Sivapalan, M.; Troch, P.; Woods, R. Catchment classification and hydrologic similarity. Geogr. Compass 2007, 1, 901–931. [Google Scholar] [CrossRef]
  63. DGA. Guías Metodológicas Para Presentación y Revisión Técnica de Proyectos de Modificación de Cauces Naturales y Artificiales; Departamento de Adminisración de Recursos Hídricos, Dirección General de Aguas, Ministerio de Obras Públicas: Santiago, Chile, 2016.
  64. Rosgen, D.L. A classification of natural rivers. CATENA 1994, 22, 169–199. [Google Scholar] [CrossRef]
  65. Rajabi, M.; Shahram, R.; Barzkar, M. Morphological classification stability of Zab river channel on Rosgen method. Geogr. Plan. 2021, 25, 141–155. [Google Scholar] [CrossRef]
  66. Rosgen, D.L. Rosgen geomorphic channel design. In Stream Restoration Design National Engineering Handbook; United States Department of Agriculture: Washington, DC, USA, 2007; Part 654. [Google Scholar]
  67. Schwartz, J.S. Use of Ecohydraulic-Based Mesohabitat Classification and Fish Species Traits for Stream Restoration Design. Water 2016, 8, 520. [Google Scholar] [CrossRef]
  68. Meehan, M.A.; O’Brien, P.L. Using the Rosgen Stream Classification System to Aid in Riparian Complex Ecological Site Descriptions Development. Rangel. Ecol. Manag. 2019, 72, 729–735. [Google Scholar] [CrossRef]
  69. Horritt, M.S.; Bates, P.D. Evaluation of 1D and 2D numerical models for predicting river flood inundation. J. Hydrol. 2002, 268, 87–99. [Google Scholar] [CrossRef]
  70. Lamichhane, N.; Sharma, S. Development of Flood Warning System and Flood Inundation Mapping Using Field Survey and LiDAR Data for the Grand River near the City of Painesville, Ohio. Hydrology 2017, 4, 24. [Google Scholar] [CrossRef]
  71. Namara, W.G.; Damisse, T.A.; Tufa, F.G. Application of HEC-RAS and HEC-GeoRAS model for Flood Inundation Mapping, the case of Awash Bello Flood Plain, Upper Awash River Basin, Oromiya Regional State, Ethiopia. Model. Earth Syst. Environ. 2021, 8, 1449–1460. [Google Scholar] [CrossRef]
  72. Te Chow, V. Open-Channel Hydraulics, Classical Textbook Reissue; MC Graw Hill: New York, NY, USA, 1988. [Google Scholar]
  73. Barnes, H.H. Roughness Characteristics of Natural Channels; no. 1849; US Government Printing Office: Washington, DC, USA, 1967.
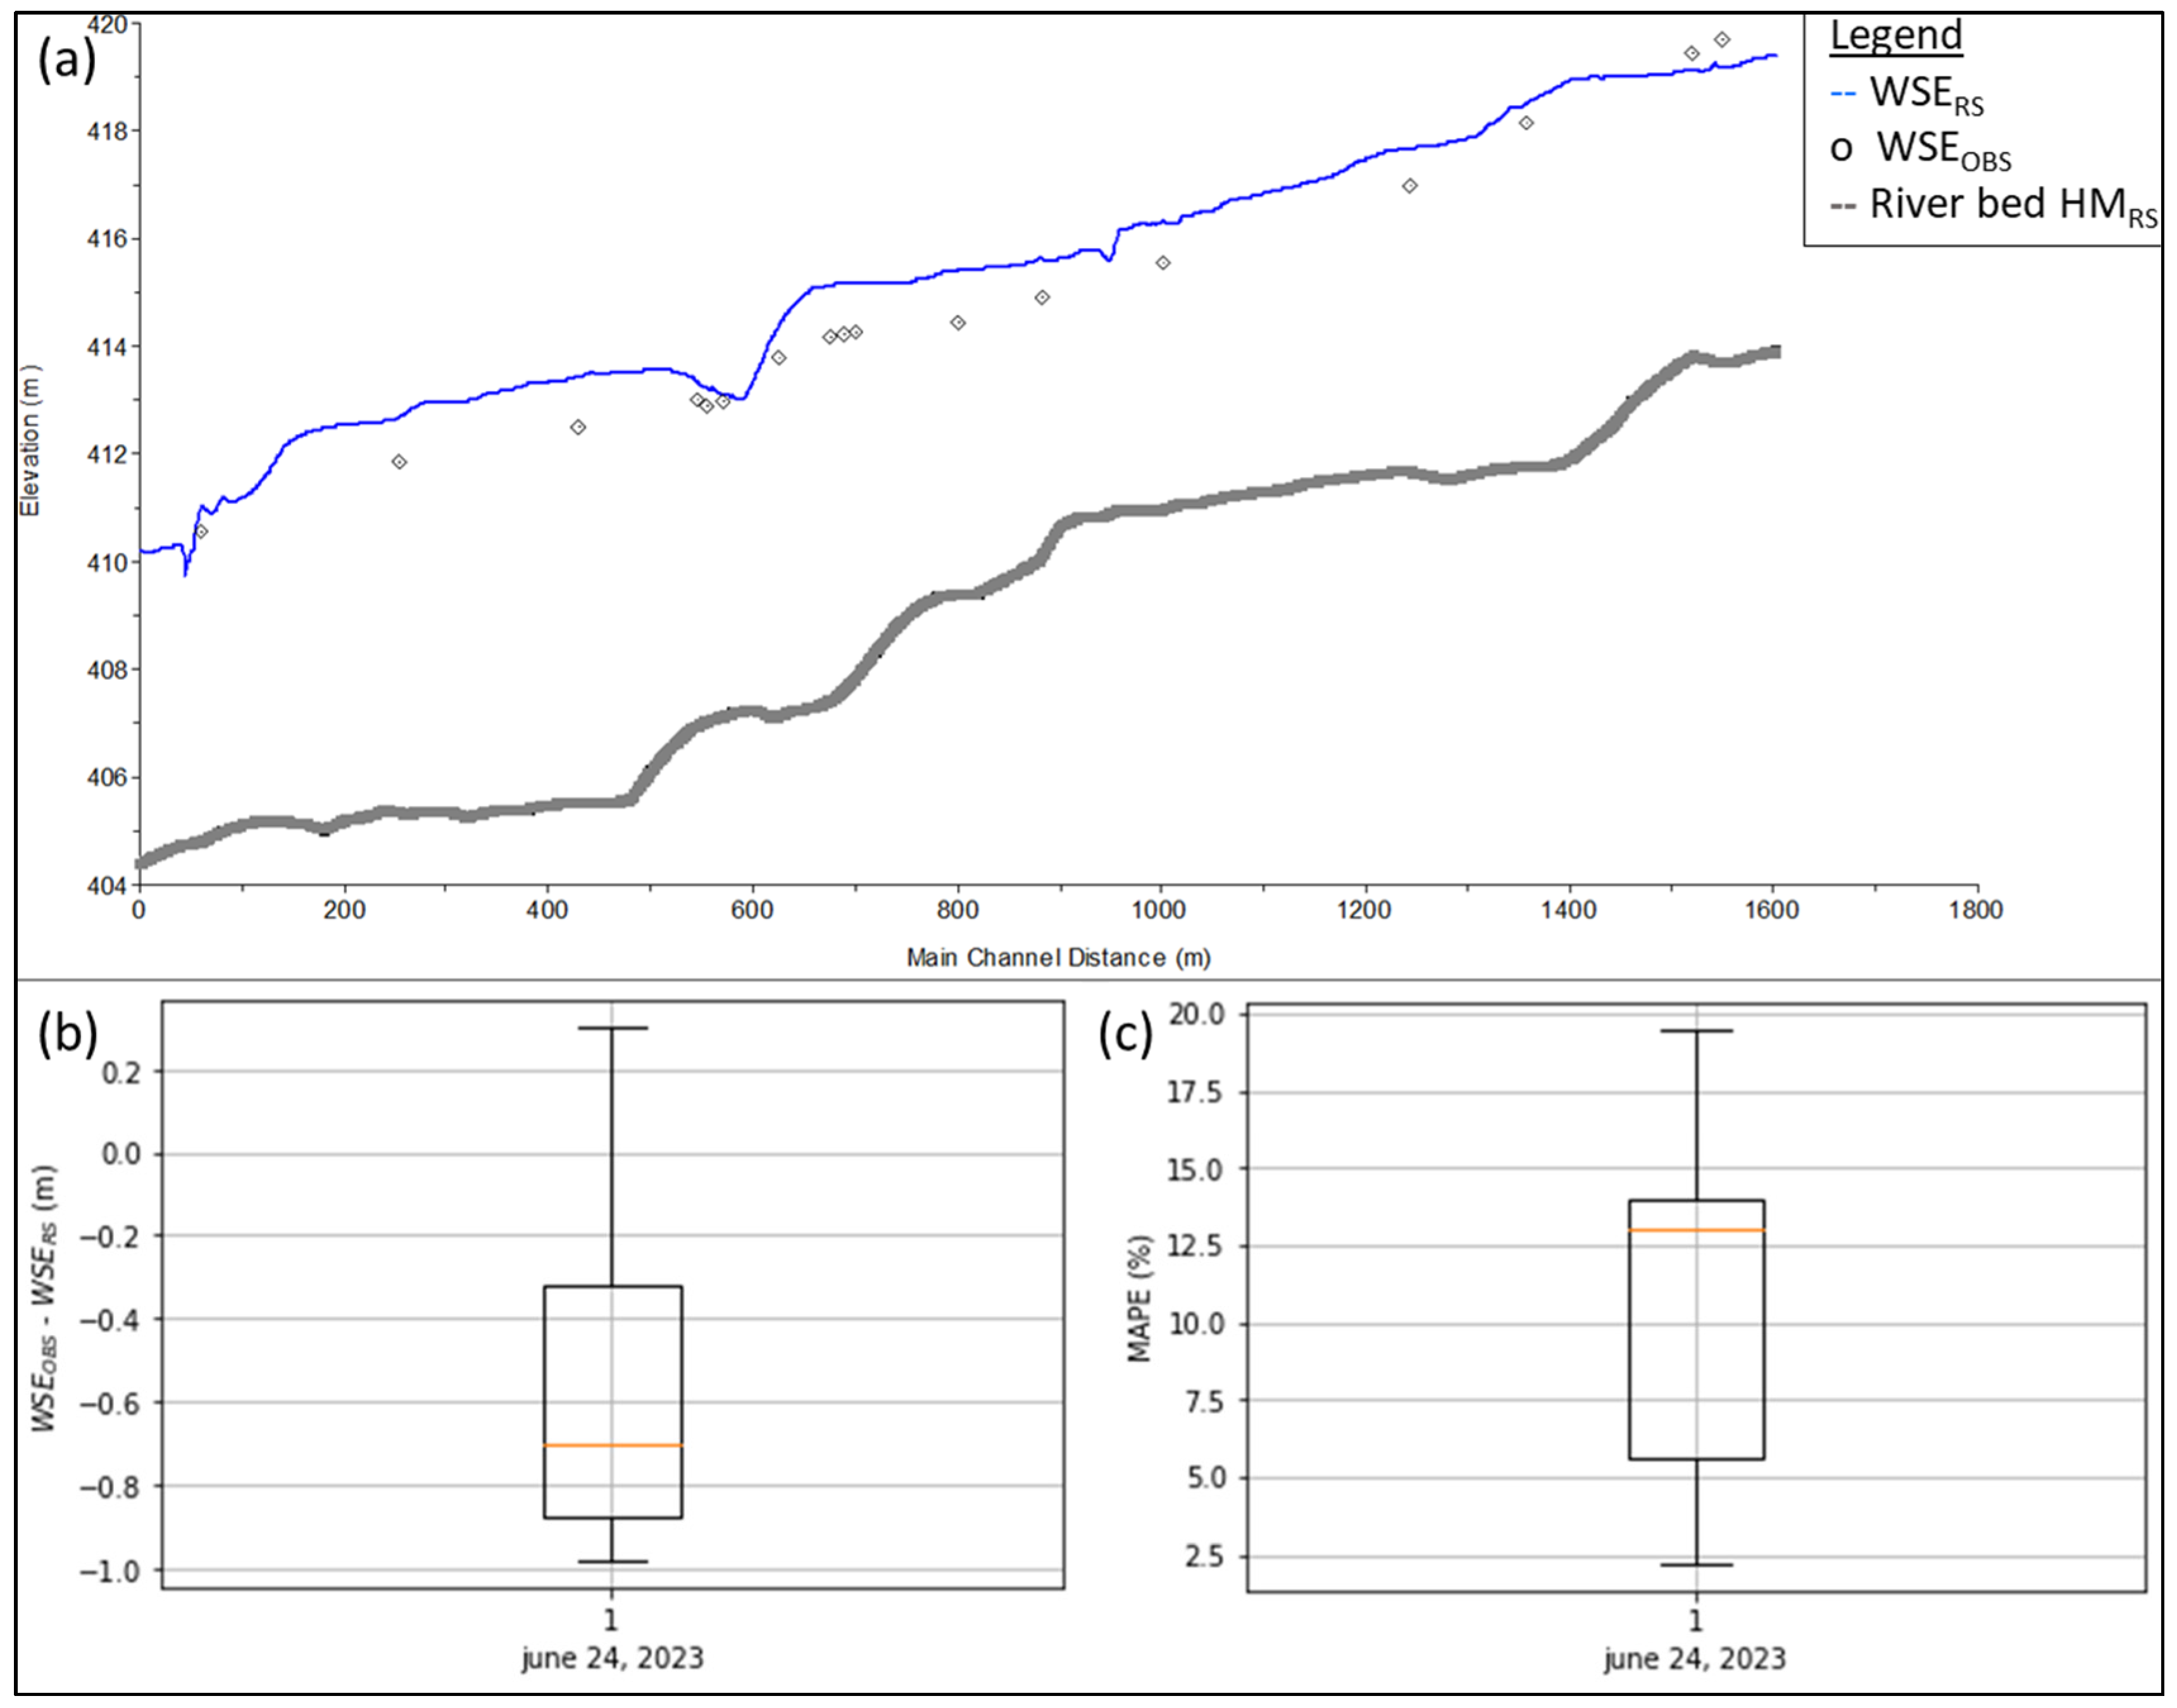
Figure 1. Study area on the Ñuble River. (a) Studied river section. The main river channel is marked by the blue line, and the green line denotes the position of a cross-section. (b) Location of the study area relative to Chile. The green dot indicates the measured river area and the orange dot shows the location of the Río Ñuble en San Fabián N2 stream gauging station (Lat/Lon 36° 35′ 09″ S, 71° 31′ 32″ W). (c) Cross-section of the DTMRS indicated by a green line in (a).
Water 15 03813 g001
Figure 2. Results of the modeling of the Ñuble River for the 24 June 2023, flood. (a) Longitudinal profile of the WSERS results, along with WSEOBS. (b) Distribution of differences between WSEOBS and WSERS. (c) Boxplot of the MAPE between DepthRS and DepthOBS. In the boxplots, the lower whisker represents the minimum value in the dataset, or the 1st percentile, while the upper whisker represents the maximum value in the dataset, or the 99th percentile.
Water 15 03813 g002
Table 1. Root mean square error (RMSE) and mean absolute error (MAE) for the comparison between simulated and observed WSE for the 24 June 2023 flood.
RiverOFWSEOBS vs. WSERS (m)
ÑubleRMSE0.68
MAE0.63
Disclaimer/Publisher’s Note: The statements, opinions and data contained in all publications are solely those of the individual author(s) and contributor(s) and not of MDPI and/or the editor(s). MDPI and/or the editor(s) disclaim responsibility for any injury to people or property resulting from any ideas, methods, instructions or products referred to in the content.

