Article

Numerical Study on the Influence of Aquitard Layer Distribution and Permeability Parameters on Foundation Pit Dewatering

School of Earth Science and Engineering, Hohai University, Nanjing 210098, China
*
Author to whom correspondence should be addressed.
Water 2023, 15(21), 3722; https://doi.org/10.3390/w15213722
Submission received: 14 September 2023 / Revised: 15 October 2023 / Accepted: 21 October 2023 / Published: 25 October 2023

Abstract

:
Evaluating the influence of geologic features on dewatering efficiency, particularly within strata of varying permeability, is critical to optimizing dewatering designs for deep excavations. In river valley areas, river sedimentation results in a discontinuous distribution of relatively aquitard layers (clay layers). The evaluation and calculation of the distribution and permeability parameters for foundation pit dewatering are very important when on-site geological data are insufficient. For this purpose, the deep excavation pit on the right bank and floodplain of Chongjiang River is taken as an example in this article. A three-dimensional groundwater flow model was constructed using the Unstructured Grid (MODFLOW-USG) software package version 1. The model was carefully calibrated using hydrogeologic features and observed groundwater levels to ensure its reliability. The simulation results effectively reproduce actual dewatering processes. The study reveals the following findings: (1) Increased aquitard layers (clay layer) enhance the barrier effect, thereby improving dewatering efficiency. (2) Increased clay layer permeability and storage coefficients reduce dewatering efficiency, while the specific yield of the clay layer has less pronounced effects. (3) Due to the discontinuous nature of the clay layer, dewatering rates are higher when the clay layer is below the riverbed than when it is in the flow boundary area (foothills).

1. Introduction

With the continuous development of modern civil engineering, the issue of excavation has become increasingly important, whether for urban construction or hydraulic engineering needs [1,2,3]. Excavation, especially the deep ones, is critical to the safety of structures. It can be affected by groundwater, leading to phenomena, such as sand boiling, piping, and even potential damage to aquifers [4,5]. The complex geological conditions and constraints imposed by site and design conditions can affect the stability and safety of excavations. Therefore, the study of the effects of complex geological conditions on dewatering techniques for excavation pits is of great importance [6,7,8].
The combination of cutoff walls with in situ dewatering systems is the most important trend in groundwater control for civil engineering projects [9,10,11]. Yang et al. [12] presented analytical solutions for lowering the groundwater level in a hanging cutoff wall under unsteady flow conditions. These analytical solutions showed good agreement with the empirical formula for groundwater drawdown in actual hanging cutoff walls, and its accuracy was verified by pumping tests and finite element analysis. Wang et al. [13] presented a novel horizontal seepage resistance barrier (HSRB) that reduces the depth of the vertical cutoff wall and effectively controls groundwater drawdown, greatly reducing the cost and difficulty of construction. Wang et al. [14] proposed a novel coupled non-Darcian flow control method that allows greater drawdown in deep construction projects in highly permeable geologic formations. This approach was supported by conceptual models and numerical simulations for practical implementation.
Many researchers found that geological environments have a significant impact on dewatering techniques in practical projects. Liu et al. [15] used finite difference methods to perform a three-dimensional seepage analysis for dewatering engineering with partially permeable cutoff walls. They quantified the blockage effect, established empirical formulas for predicting inflow under uniform flow, and proposed a drainage design method based on prediction formulas for sand and gravel formations. Mao [16] successfully applied new drainage technologies to solve drainage problems in deep soft soils, significantly improving water absorption and air pumping efficiency, resulting in remarkable economic and environmental benefits. Wang et al. [17] conducted physical modeling experiments with transparent soil and simulated stressed aquifers and groundwater with high-purity fused silica and mixed kerosene oil. In these experiments, the coupling mechanism of sealing walls and dewatering wells was successfully modeled, which is a novel research method for dewatering in deep soft soil excavations. Li et al. [18] proposed a novel approach combining particle size distribution and pore diameter of sand and gravel formations with line flow modeling and numerical methods to evaluate the risk of casing in unconfined sand and gravel aquifers during the dewatering of deep excavations. Chen et al. [19] in designing and optimizing dewatering schemes for excavation pits found that the permeability and distribution of clay layers significantly affect the dewatering efficiency when the cutoff wall is deeper than the pumping well, and the bottom of the pumping well is in sandy clay layers. Liu et al. [20] observed that in a deep well pumping and recharge project within a soft soil formation mainly composed of silty clay, settlement occurred mainly in the soft soil layer. Irfan et al. [21] investigated the influence of four critical parameters of clay layers on the safety factor of civil engineering projects. Based on regression model analysis, they found that the cohesion of clay layers was the most important factor affecting safety. Gallikova and Rehman [22] analyzed the settlements of high-rise buildings by using a quasi-plastic model to predict the deformation of clay foundations and compared the results with monitoring data, verifying the accuracy and applicability of the finite element model (FEM).
There have been many researches on foundation pit dewatering, but few have systematically studied the influence of aquitard layer distribution and permeability parameters on foundation pit dewatering. In recognition of the above problem, this study quantitatively evaluates the effects of clay layers on foundation pit drainage. A novel three-dimensional groundwater flow model was created using the MODFLOW-USG software package version 1, with calibration of the model based on hydrogeologic features and observed groundwater levels. Taking into account the direction of the cutoff walls and external water flows, the influence of aquitard layers (clay layer) distribution on dewatering efficiency was analyzed. In addition to achieving the specified engineering objectives, the study also discusses the effects of various clay layer parameters on the excavation dewatering technique.

2. Study Area

This study was carried out on the basis of the Chongjiang River Inlet Culvert, an important section of the Central Yunnan Water Diversion Project. The main objective of this project is to divert water from the spring to an underground pumping station by connecting the intake tower of the water source to the right bank of the Chongjiang River. The study area is located in the Hengduan Mountains, which are characterized by a juxtaposition of high mountains and river valleys (Figure 1). The elevation of the mountainous terrain varies from 2300 to 2900 m, with slopes ranging from 25° to 40°, and steep cliffs in some areas. The valleys of the Jinsha and Chongjiang rivers form a broad “U”-shaped profile. The elevation of the Jinsha River valley is generally between 1815 and 1820 m and that of the Chongjiang River valley is between 1820 and 1840 m.
The study area mainly covers the right bank and floodplain of the Chongjiang River. The subsurface conditions revealed by borehole investigations show that the upper layer of the right bank mainly consists of thin silt, fine sand, and minor clay layers with gravel intercalation and a loose structure. The lower layers contain a mixture of gravel and cobbles interbedded with lenses of grayish brown clay with low plasticity. These low plasticity clays and sandy clays have a soft to plastic consistency and are distributed in lenticular patterns between about 1758 and 1777 m elevation. Although these strata have some spatial continuity, they may be unaffected near the main river channel due to the development of the Chongjiang River course. The permeability degree of the sandy clays ranges from weak to low, which contributes to their limited water permeability. Meanwhile, the relatively large thickness of this clay layer complicates dewatering during excavation. The gravel-stone layers, which are characterized by strong to moderate permeability, are distributed over an elevation range from 1700 to 1829 m. This interval includes clays with low plasticity, which are mainly located in the range from 7 to 23 m above the ceiling of the culvert.
The study area is characterized by a semi-arid and hot valley climate with high altitude and low temperatures. The average annual rainfall is 753.7 mm and mainly falls from May to October, accounting for 91.3% of the annual total. The average annual temperature is 12.7 °C.
The surface drainage is well developed in the study area. There are numerous gullies, and the main reference point for surface and subsurface drainage is the Jinsha River and the Chongjiang River, with an elevation of about 1816 to 1825 m. As for the subsurface water, intergranular pore waters, rock fracture waters, fissure waters, and karst waters are distinguished in the study area based on the conditions of groundwater occurrence and the characteristics of groundwater movement. Intergranular pore water is mainly stored in the quaternary unconsolidated strata and is strongly influenced by seasonal variations. Rock fracture and fissure water are stored in rock joints, limestone fissures, and fissures. They exhibit marked differences in hydraulic connectivity with deeper strata. Karst water is mainly stored in the left bank of the Chongjiang River. Since the Chongjiang River flows through the Tuo-Ding-Kai-Wen fault zone, karst water is classified as fault source water with greatly varied flow between rainy and dry seasons. The depth of groundwater varies from region to region. In general, the depth of groundwater in the mountains ranges from 106.1 to 360.2 m, with the upper part characterized by deep groundwater influenced by the restraining effect of the shale, resulting in deep gullies.
The project is situated within a highland-valley topography, characterized by mountainous terrain and river valleys.

3. Method

3.1. Mathematical Model

The non-steady-state groundwater flow mathematical model of an equivalent anisotropic continuous medium was used in this research [23,24]:
{ x ( K x H x ) + y ( K y H y ) + z ( K z H z ) + ε = S S H t ( x , y , z ) Ω , t > 0 H ( x , y , z , t ) = H 0 ( x , y , z ) ( x , y , z ) Ω , t = 0 H ( x , y , z , t ) = H Γ ( x , y , z , t ) ( x , y , z ) Γ 1 , t > 0 K x H x + K y H y + K z H z = q 0 ( x , y , z , t ) ( x , y , z ) Γ 2 , t > 0
where H represents the groundwater head (m); Kx, Ky, and Kz are the anisotropic principal hydraulic conductivities (m/d); t is time (d); Ss denotes the specific storage of the aquifer (1/m); Γ1 stands for the specified head boundary of the simulated area; Γ2 represents the flow rate boundary of the simulated area; H0 (x, y, z) corresponds to the initial groundwater head in the aquifer (m); HΓ (x, y, z) signifies the boundary groundwater head under the specified head boundary conditions (m); q0 (x, y, z) indicates the specific discharge at the flow rate boundary per unit area (m2/d); ε refers to the strength of source/sink terms (including extraction rates, etc.) (1/d); Ω denotes the groundwater flow region.

3.2. Modeling Approach

The discretization of the numerical model affects both the accuracy and the efficiency of the calculations. GMS software (https://www.aquaveo.com/software/gms-learning, accessed on 13 September 2023) operates primarily on the basis of grid discretization, with denser grid distributions leading to higher simulation accuracy and better fit of model results to real-world conditions [25]. Conversely, using an excessive number of grids can increase the runtime of the model and increase the likelihood of convergence problems in the computational results. A new version of MODFLOW called MODFLOW-USG [26] was developed and released implementing unstructured grids and finite volume numerical solutions, to enable a solution to the above-mentioned problem. The flexibility of grid design in MODFLOW-USG can be used to discretize individual layers to better represent hydrostratigraphic units [27,28].
MODPATH [29] is a key module of the GMS software that accurately records groundwater flow paths and volumes and provides a robust solution to digital transport problems. This module has been used to determine the origin and extent of water sources within the basin, providing an initial prediction of inflow. This knowledge facilitates the management, protection, and optimization of water resources and the adaptation of drainage strategies.

4. Numerical Simulation

4.1. Model Construction

The study area covers an approximate area of 3.05 km2, with groundwater mainly occurring in gravel and stone layers which form the main conduit for water flow. Groundwater primarily recharges through atmospheric precipitation, streambed infiltration, and lateral runoff, with lateral runoff being the primary discharge mechanism. The groundwater flow system in the study area is conceptualized as a nonuniform anisotropic three-dimensional flow system (Figure 2).
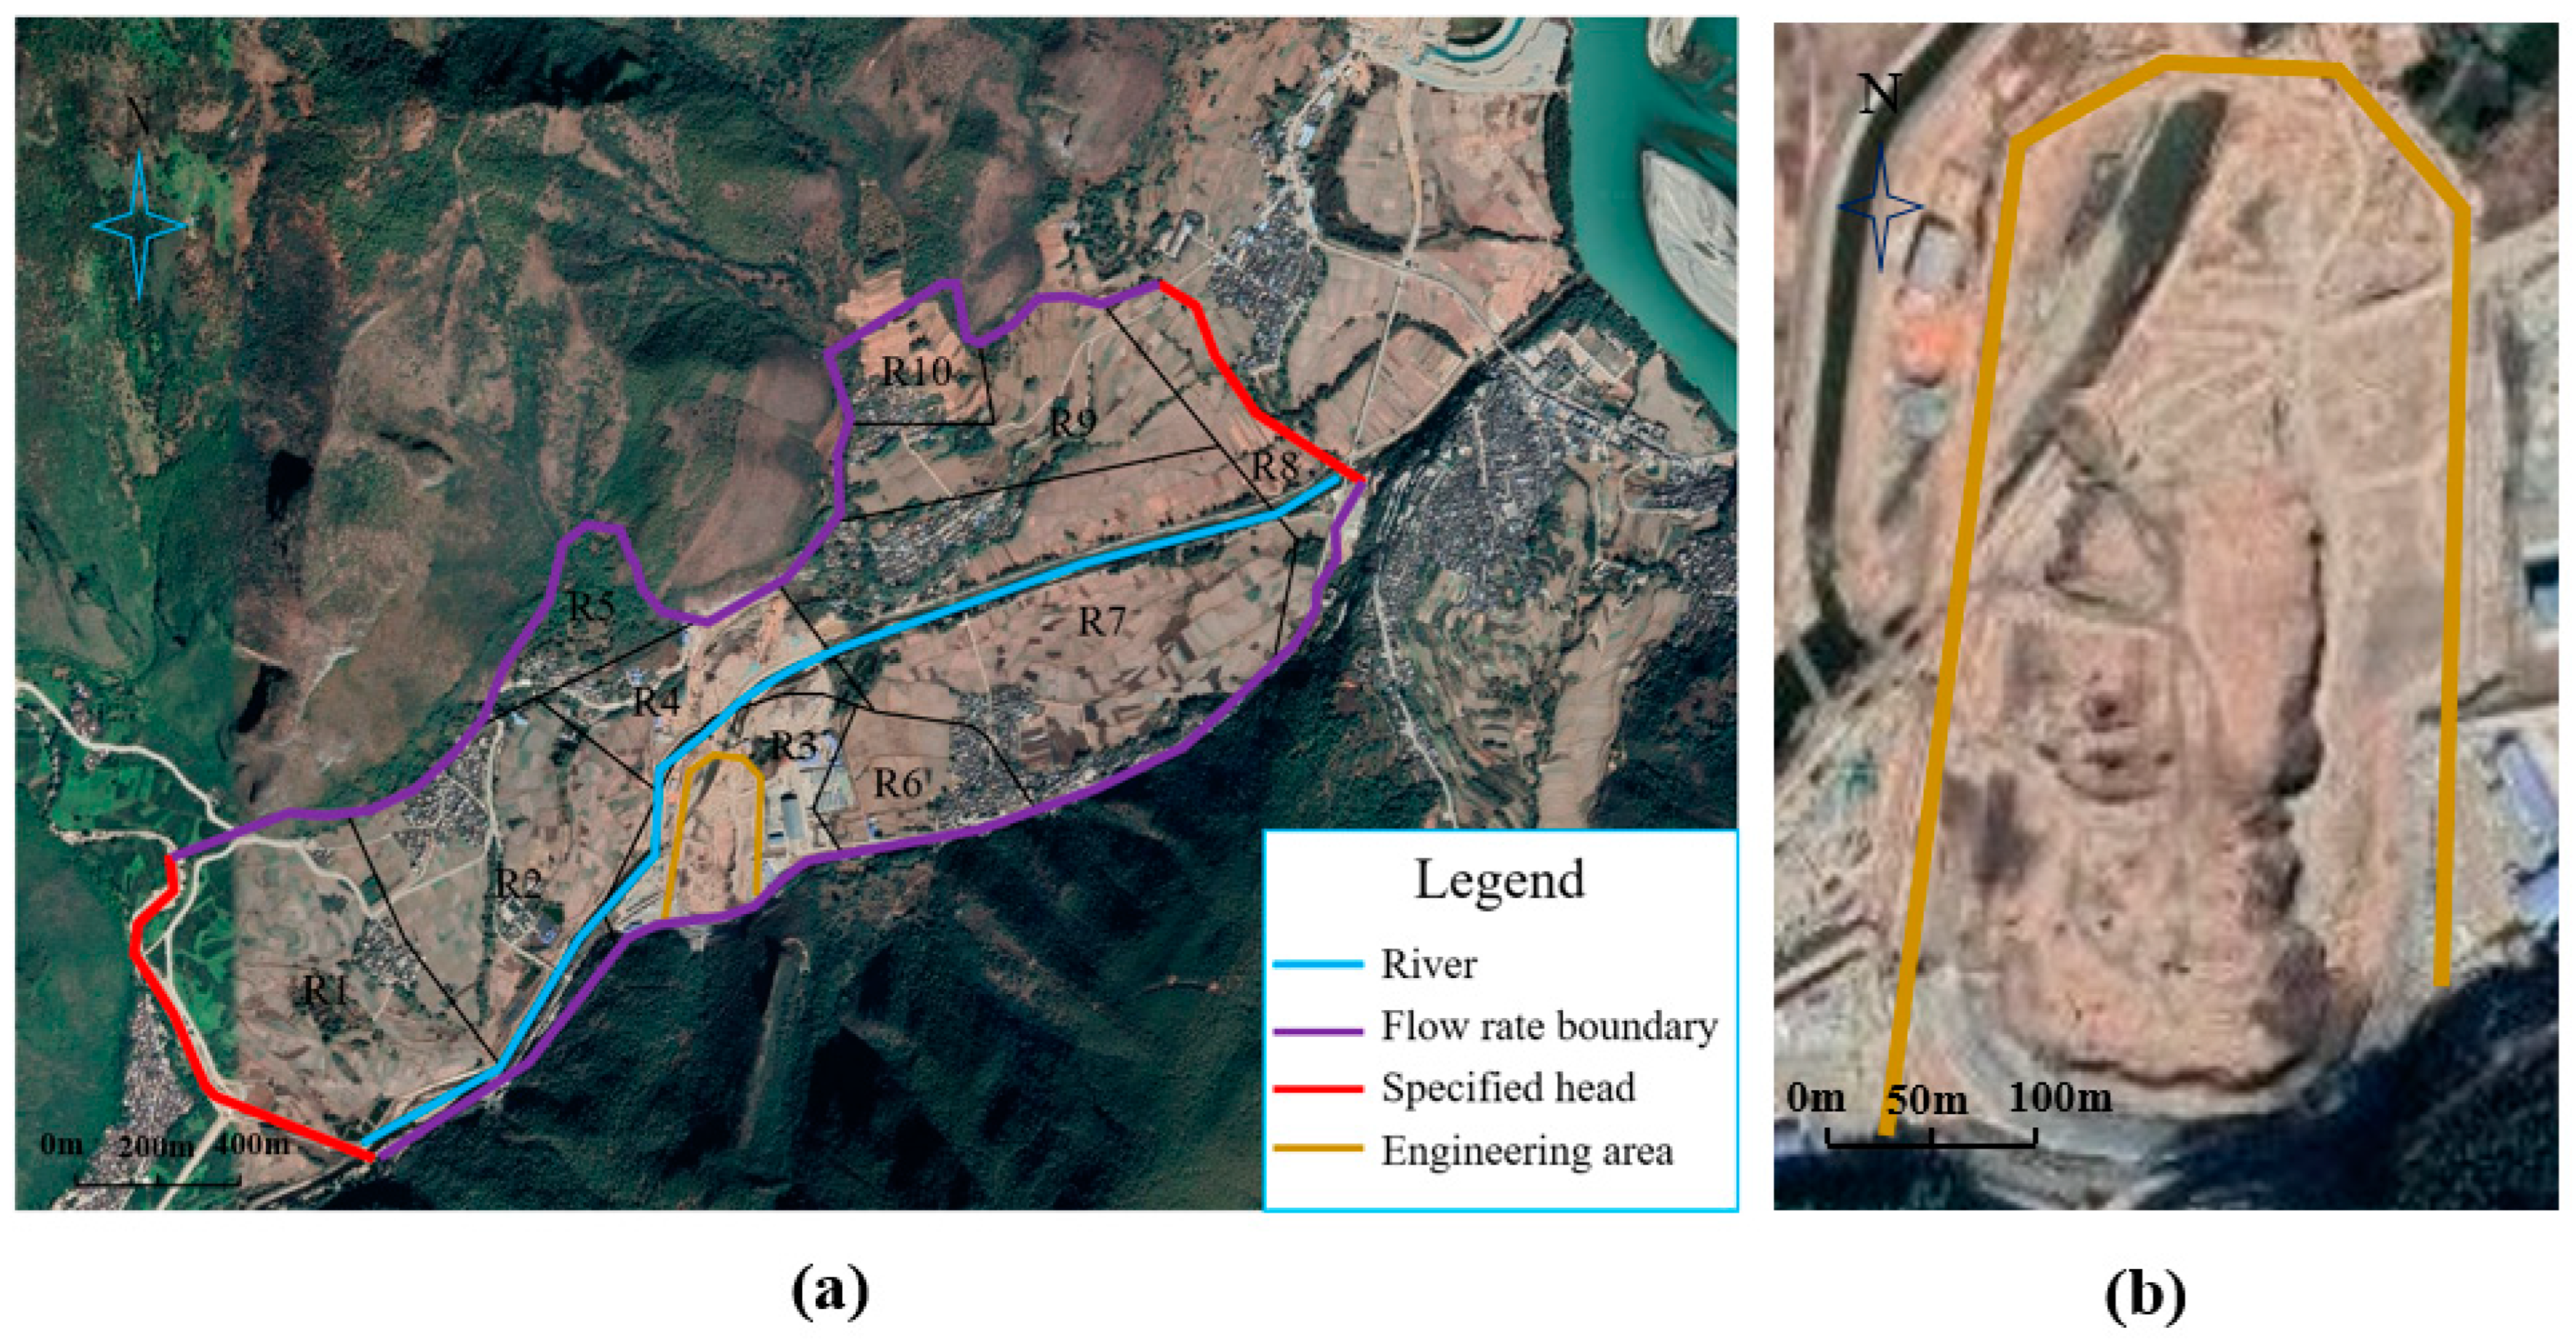
The boundary conditions are set as follows: The northern and southern boundaries of the study area are defined as flow rate boundaries. The assigned flow rates are calculated using Darcy’s law based on the hydraulic gradient between exposed lithologies and both sides to the overburden. The western boundary, represented by the river, and the eastern boundary are identified as specified head boundaries. The head values are determined based on the elevation of the river and the water table. Since the Chongjiang River flows through our study area, it was recognized as a river boundary.
The hydrogeological system within the basin includes the unconfined aquifer of the overburden (first aquifer) and the low-confined fractured aquifer of the bedrock (second aquifer). The first aquifer consists mainly of sand, gravel, and boulders with a thickness of about 50 m. The second aquifer, located below the overlying layer, is a permeable fractured aquifer. The withdrawable water volume of the second aquifer is minimal, and the hydraulic connectivity between the first and second aquifers is low. Therefore, this study focuses exclusively on the first aquifer.
Model parameters are summarized based on on-site pumping tests, laboratory geotechnical investigations, and experience from similar projects in the study area. The hydrogeologic parameters for the three major lithologies in the study area are summarized in Table 1. Due to the limited number of pumping tests, hydraulic conductivity varies within a specific range rather than a fixed value. In the following simulations, different parameter combinations are used within specific ranges to calculate drainage results and consider different possible scenarios.
Considering the terrain, lithology, permeability, and recharge conditions of the study area, it is divided into 10 subregions for rainfall infiltration. Using data from meteorological stations, the average annual precipitation is 753.7 mm and the multi-year average precipitation intensity is 2.06 mm/d for the study area. Multiplying the rainfall infiltration coefficients for each subarea by the average precipitation intensity yields the infiltration intensities for each subarea (Figure 2a and Table 2).
The model also accounts for river recharge and runoff. The river package (RIV) [30] of GMS is used to simulate the recharge and discharge of the Chongjiang River in the study area (Figure 2a). The water head in the model was determined based on perennial monitoring. The hydraulic exchange between the Chongjiang River and groundwater depends on the hydraulic gradient between the river and the groundwater system.
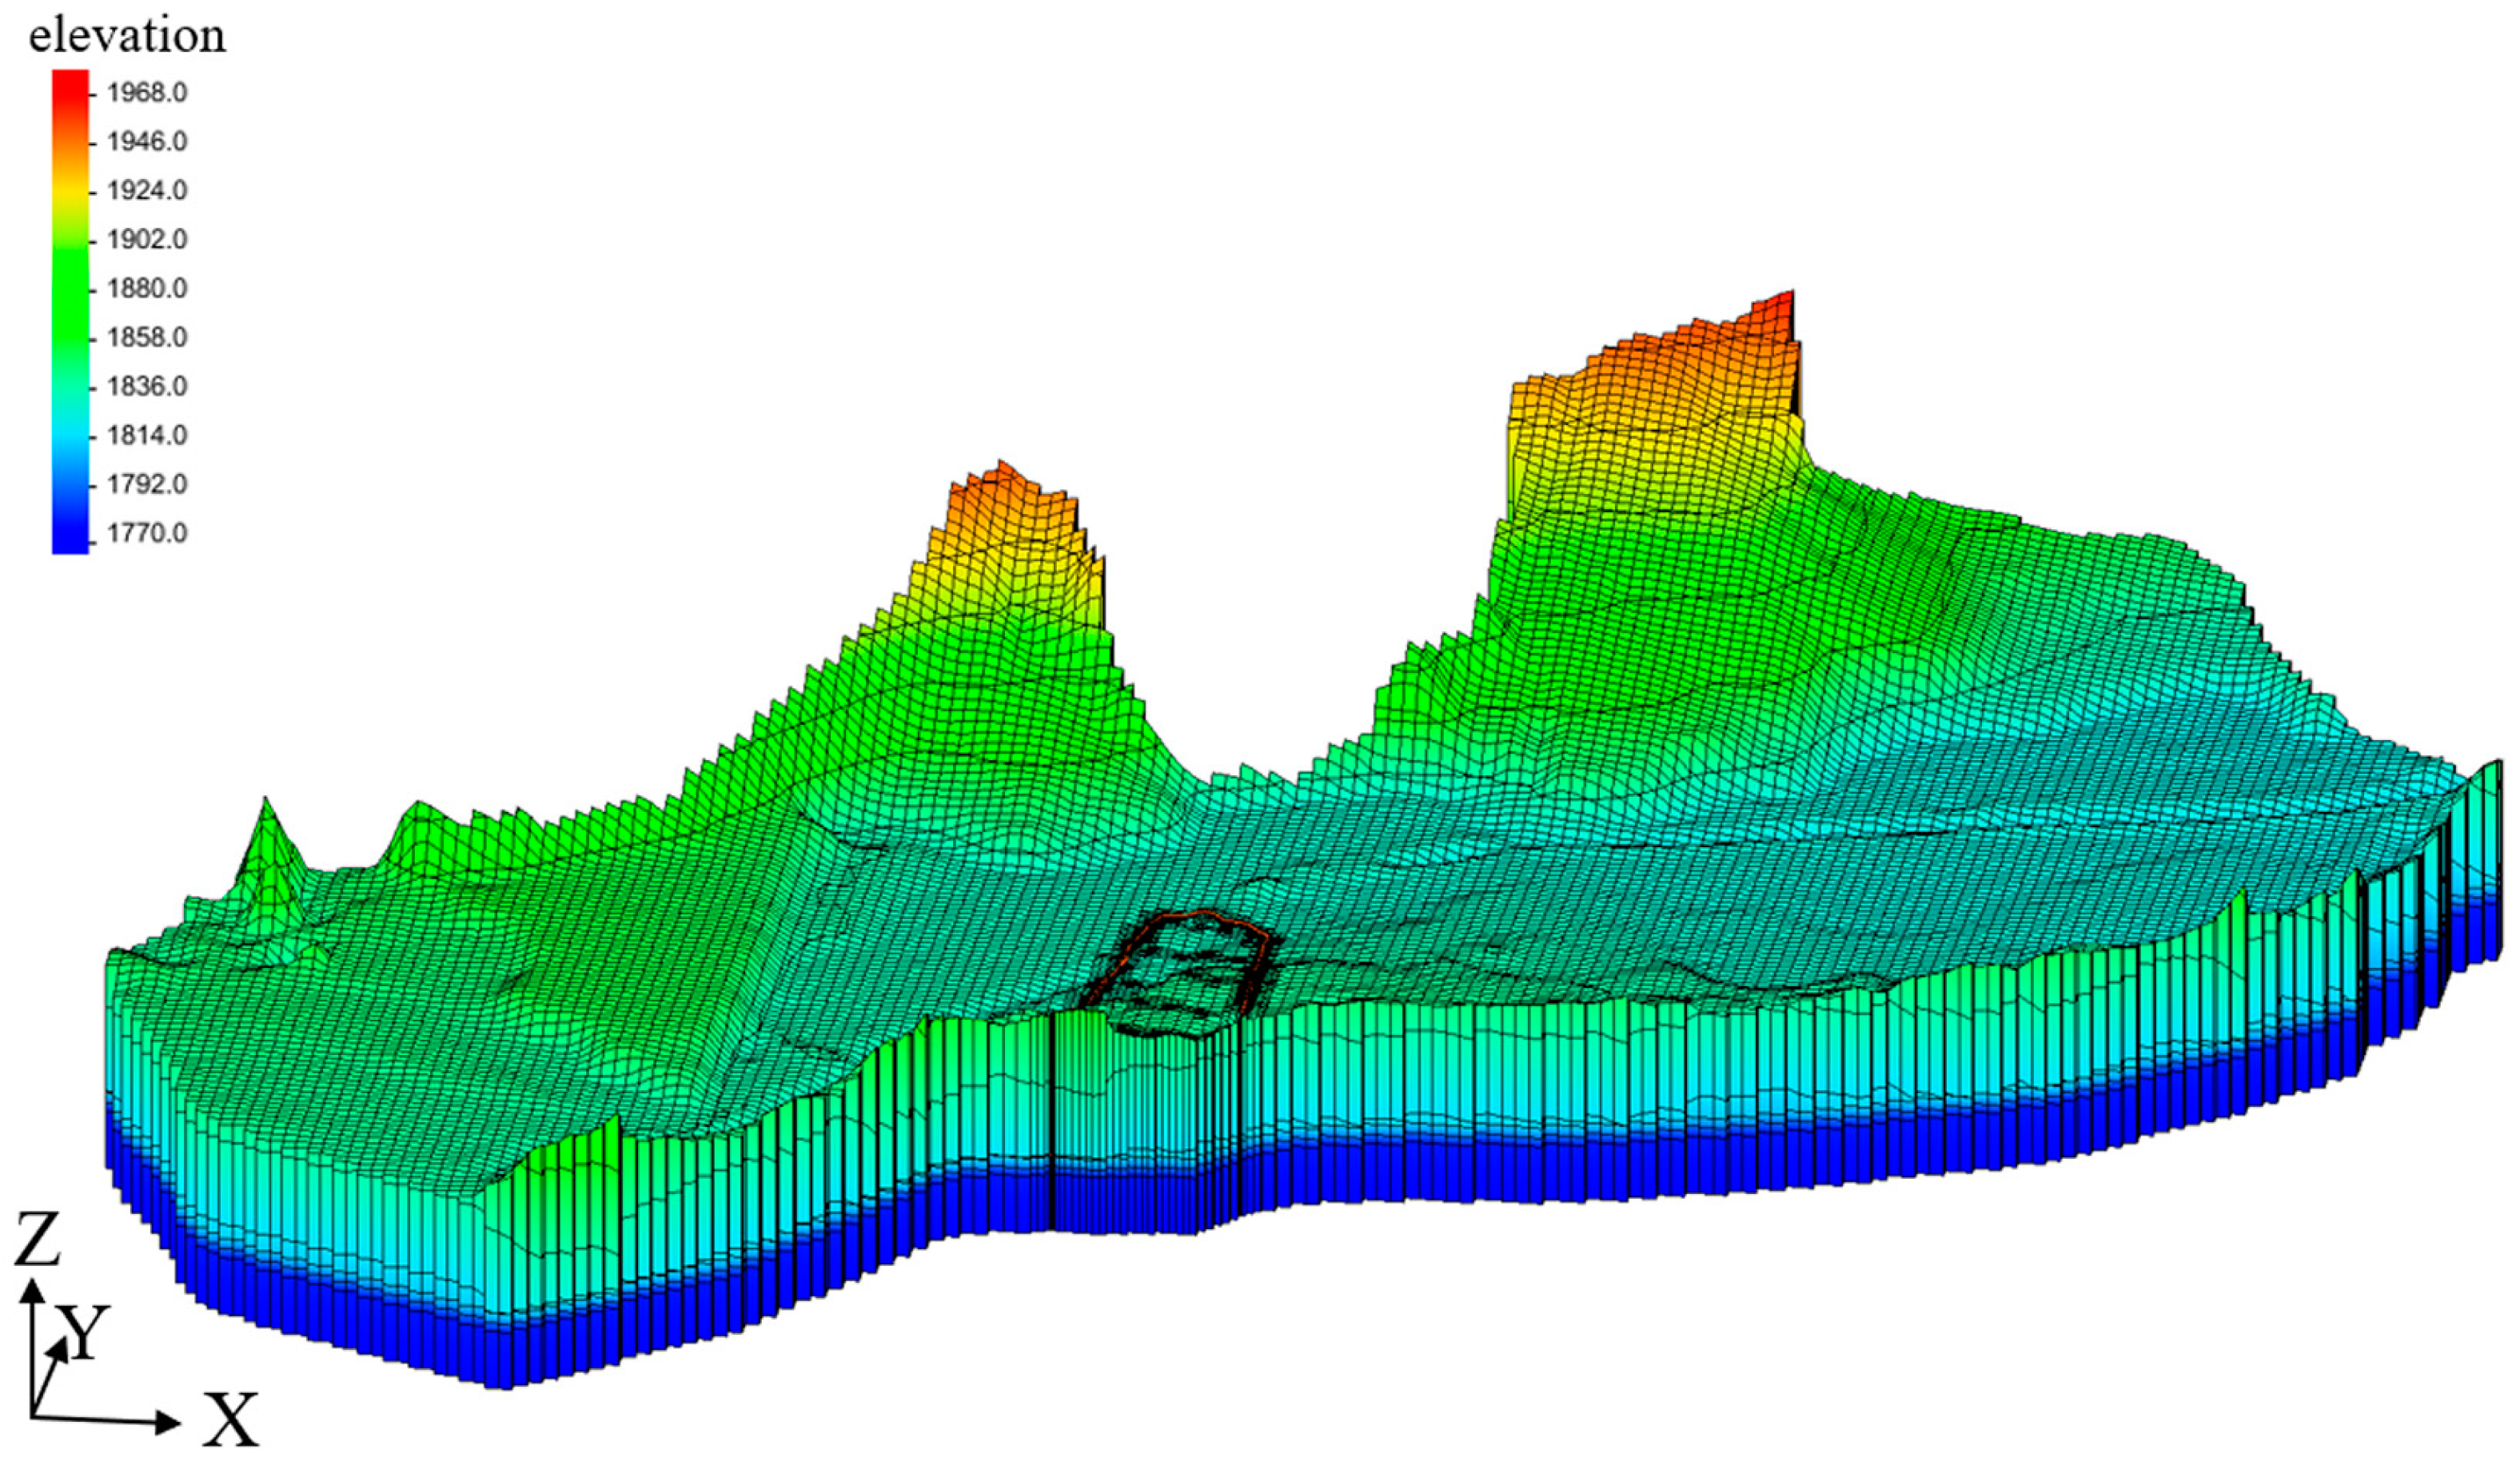
The simulated domain spans three dimensions with lengths of 3300 m in the X direction, 2300 m in the Y direction, and 200 m in the Z direction. In the vertical direction, the model is divided into three layers representing different geological formations. These layers are characterized by structured grids and refined uniform grids, each with a length and width of 50 m and a depth of 10 m. The structured grid consists of a total of 4077 active cells with 17,784 nodes. A quadtree-based approach was used to create unstructured grids in MODFLOW-USG. Local grid refinement is applied to specific features, such as rivers, curtains, and pumping wells. Specifically, rivers are refined with a grid size of 30 m, while curtains and pumping wells are refined with a grid size of 0.6 m. The refined uniform grid consists of 93,576 active cells with 429,660 nodes. Figure 3 shows the three-dimensional diagram of the model.
A steady-state model was built to reflect the perennial hydrogeological condition and it was also used as the initial condition for the following transient simulation, which simulates the foundation pit dewatering progress. In the transient model, the simulation time is 300 days and a total of 300 stress periods were established.

4.2. Model Calibration

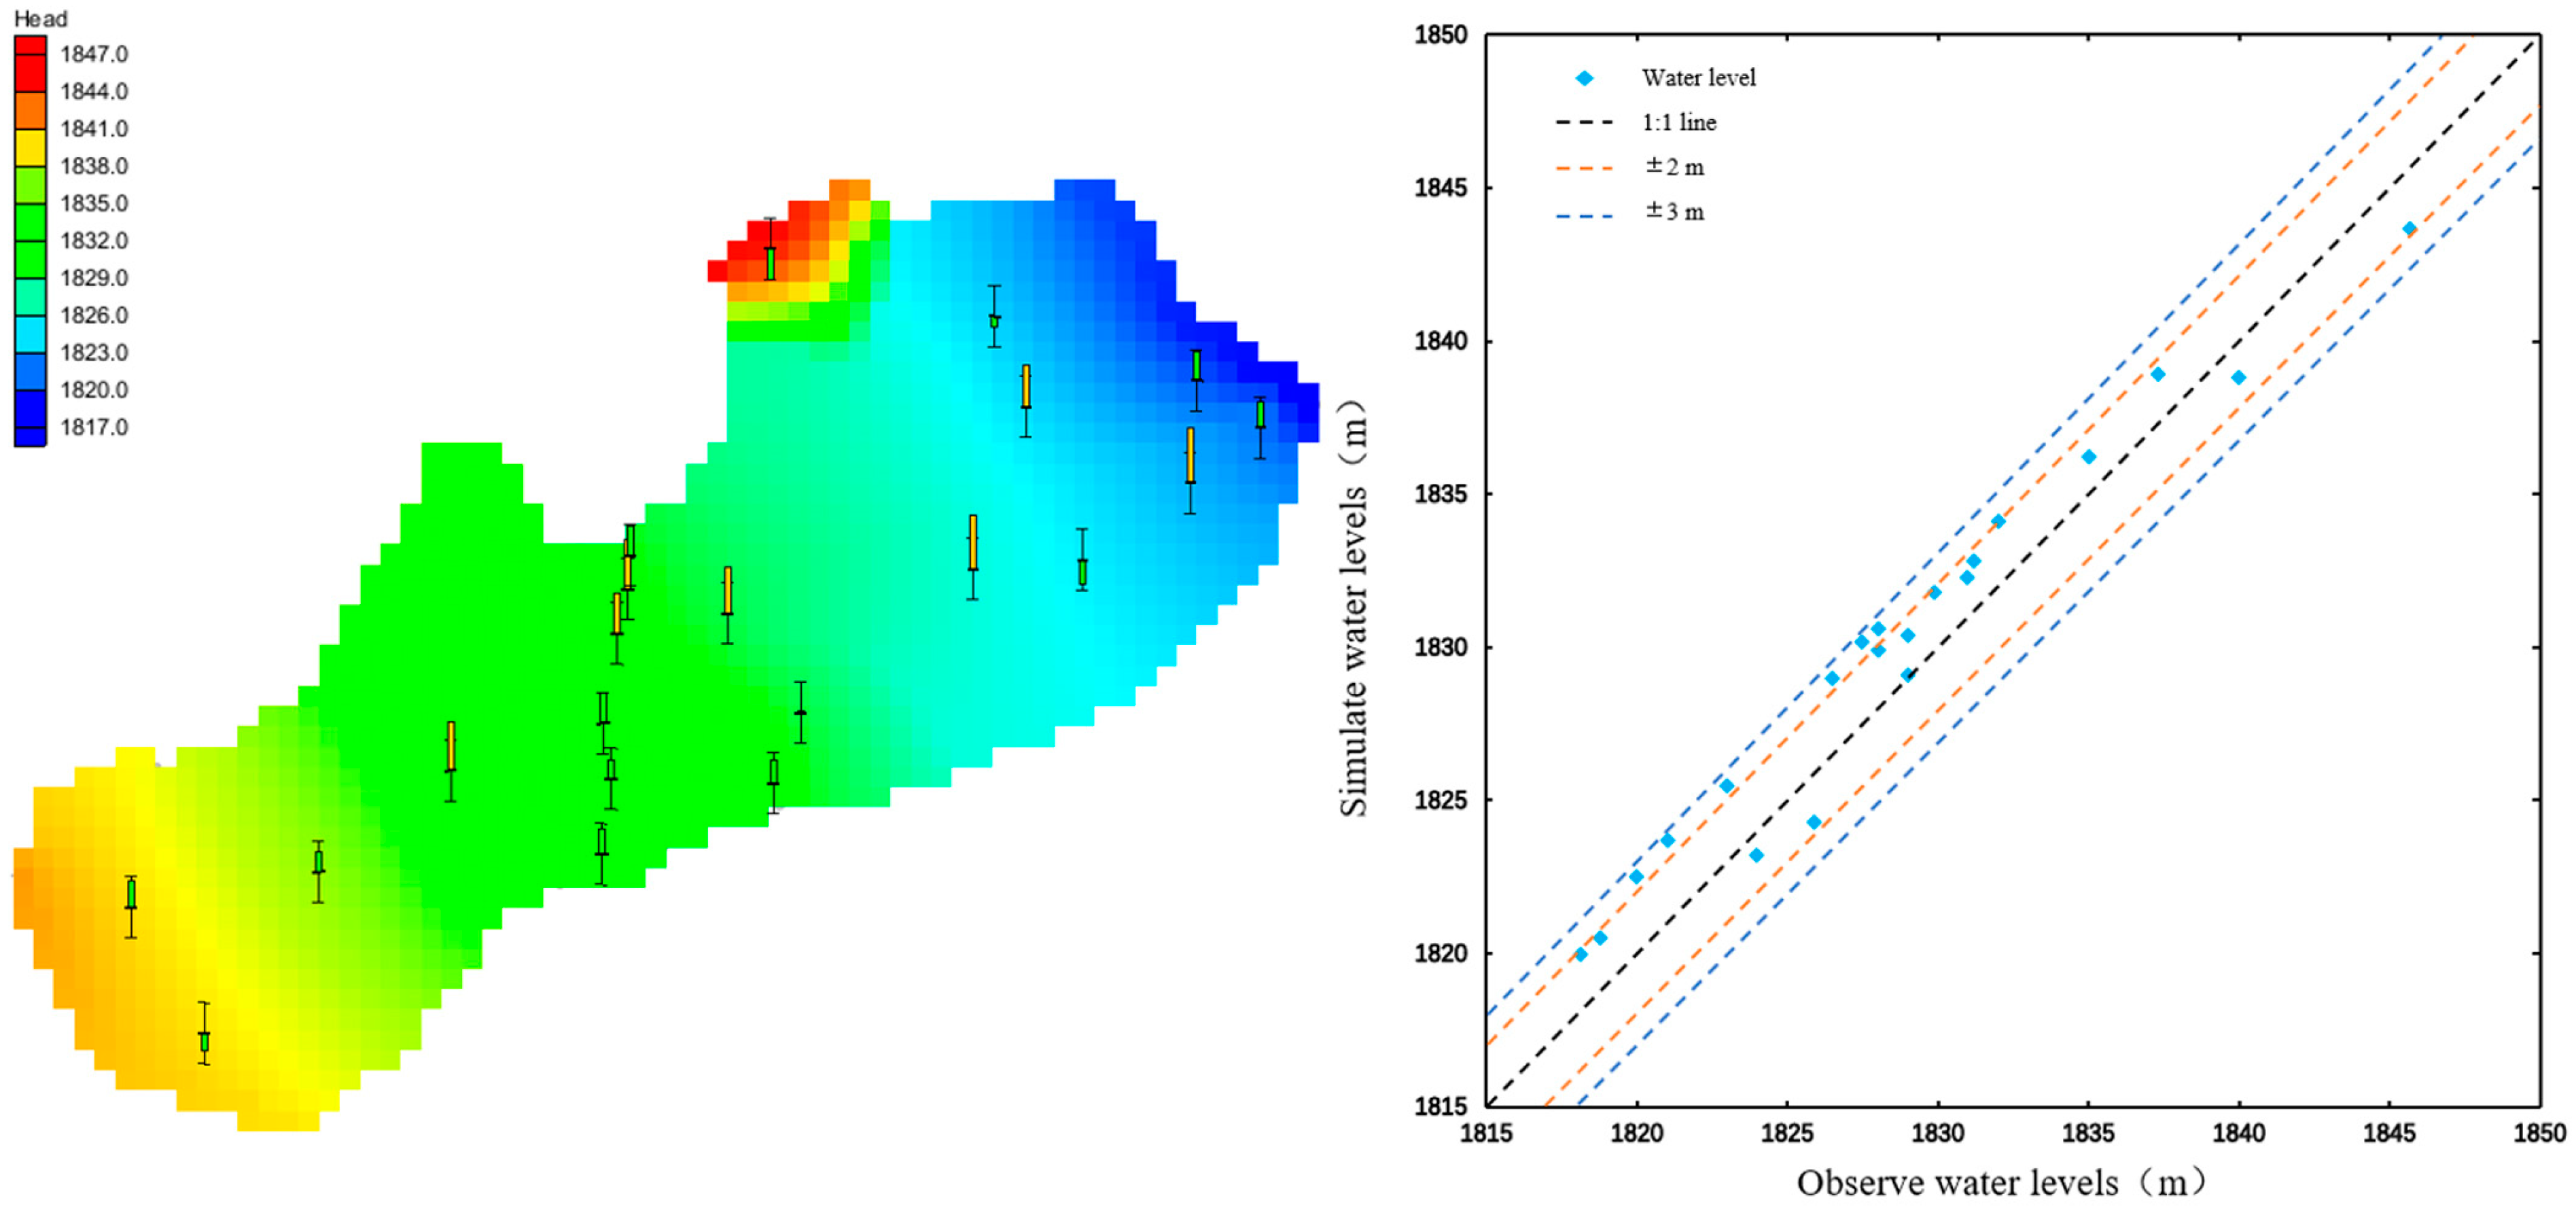
The perennial average groundwater level generated from 21 monitoring wells in the study area was used for the model calibration and parameter optimization in the steady-state model. Comparing the results calculated by the model with the observed data, it can be seen that the errors in water level calculation are generally less than 3 m. In particular, 13 of the monitoring sites have calculation errors of less than 2 m, which corresponds to 61.9% of the total observed groundwater levels (Figure 4). In simulating the Longtan spring discharge, the model predicts a spring discharge of 234.6 L/s, which agrees well with the observed perennial discharge of 200–300 L/s. In all aspects of the simulation results, it can be seen that the model results agree very well with the actual field data. Consequently, the model effectively reflects the groundwater hydrology in the study area. The value of hydraulic conductivity and parameters used in the RIV package were calibrated in the steady-state model, as given in Table 3.
Comparison between simulated results and actual measured water levels shows errors within ±3 m.

4.3. Scenarios

The integration of cutoff walls with mine water containment is a prevailing trend in groundwater control of civil engineering projects. The project uses large-scale excavation methods, with the impermeable axis of a containment dam extending approximately 940 m in length. Along the periphery of the culvert on the right bank of the Chongjiang River, cutoff walls are spaced 10 to 20 m from the excavation limits. The cutoff wall was constructed with plastic concrete, with a depth varying from 50.0 to 60.0 m, and a thickness of about 0.6 m, considering the safety aspects of construction and excavation.
In pit dewatering, most of the extracted water should be stored statically: First, if the injection structure is sealed against the formation, the water volume calculations are relatively simple by multiplying the thickness of the aquifer by the corresponding porosity and further by the sealing area (taking into account the overflow supply if high water stresses are present in the lower part). Second, if the lower part of the grout structure does not penetrate the cap layer, the estimate is based on inflow from a large diameter well at the bottom.
The drainage area is 88,060 m2. If the drainage area consists entirely of clay layers with a rock porosity of 0.15 and an aquifer thickness of 50 m, the predicted inflow volume from the pit is 660,450 m3. Alternatively, if we assume that the drainage area consists entirely of quaternary overburden with a rock porosity of 0.3, the projected inflow volume from the pit is 1,320,900 m3. Due to the uncertain proportion of clay layers and quaternary overburden in the dewatering area, the actual pit inflow volume during dewatering is between 660,450 and 1,320,900 m3.
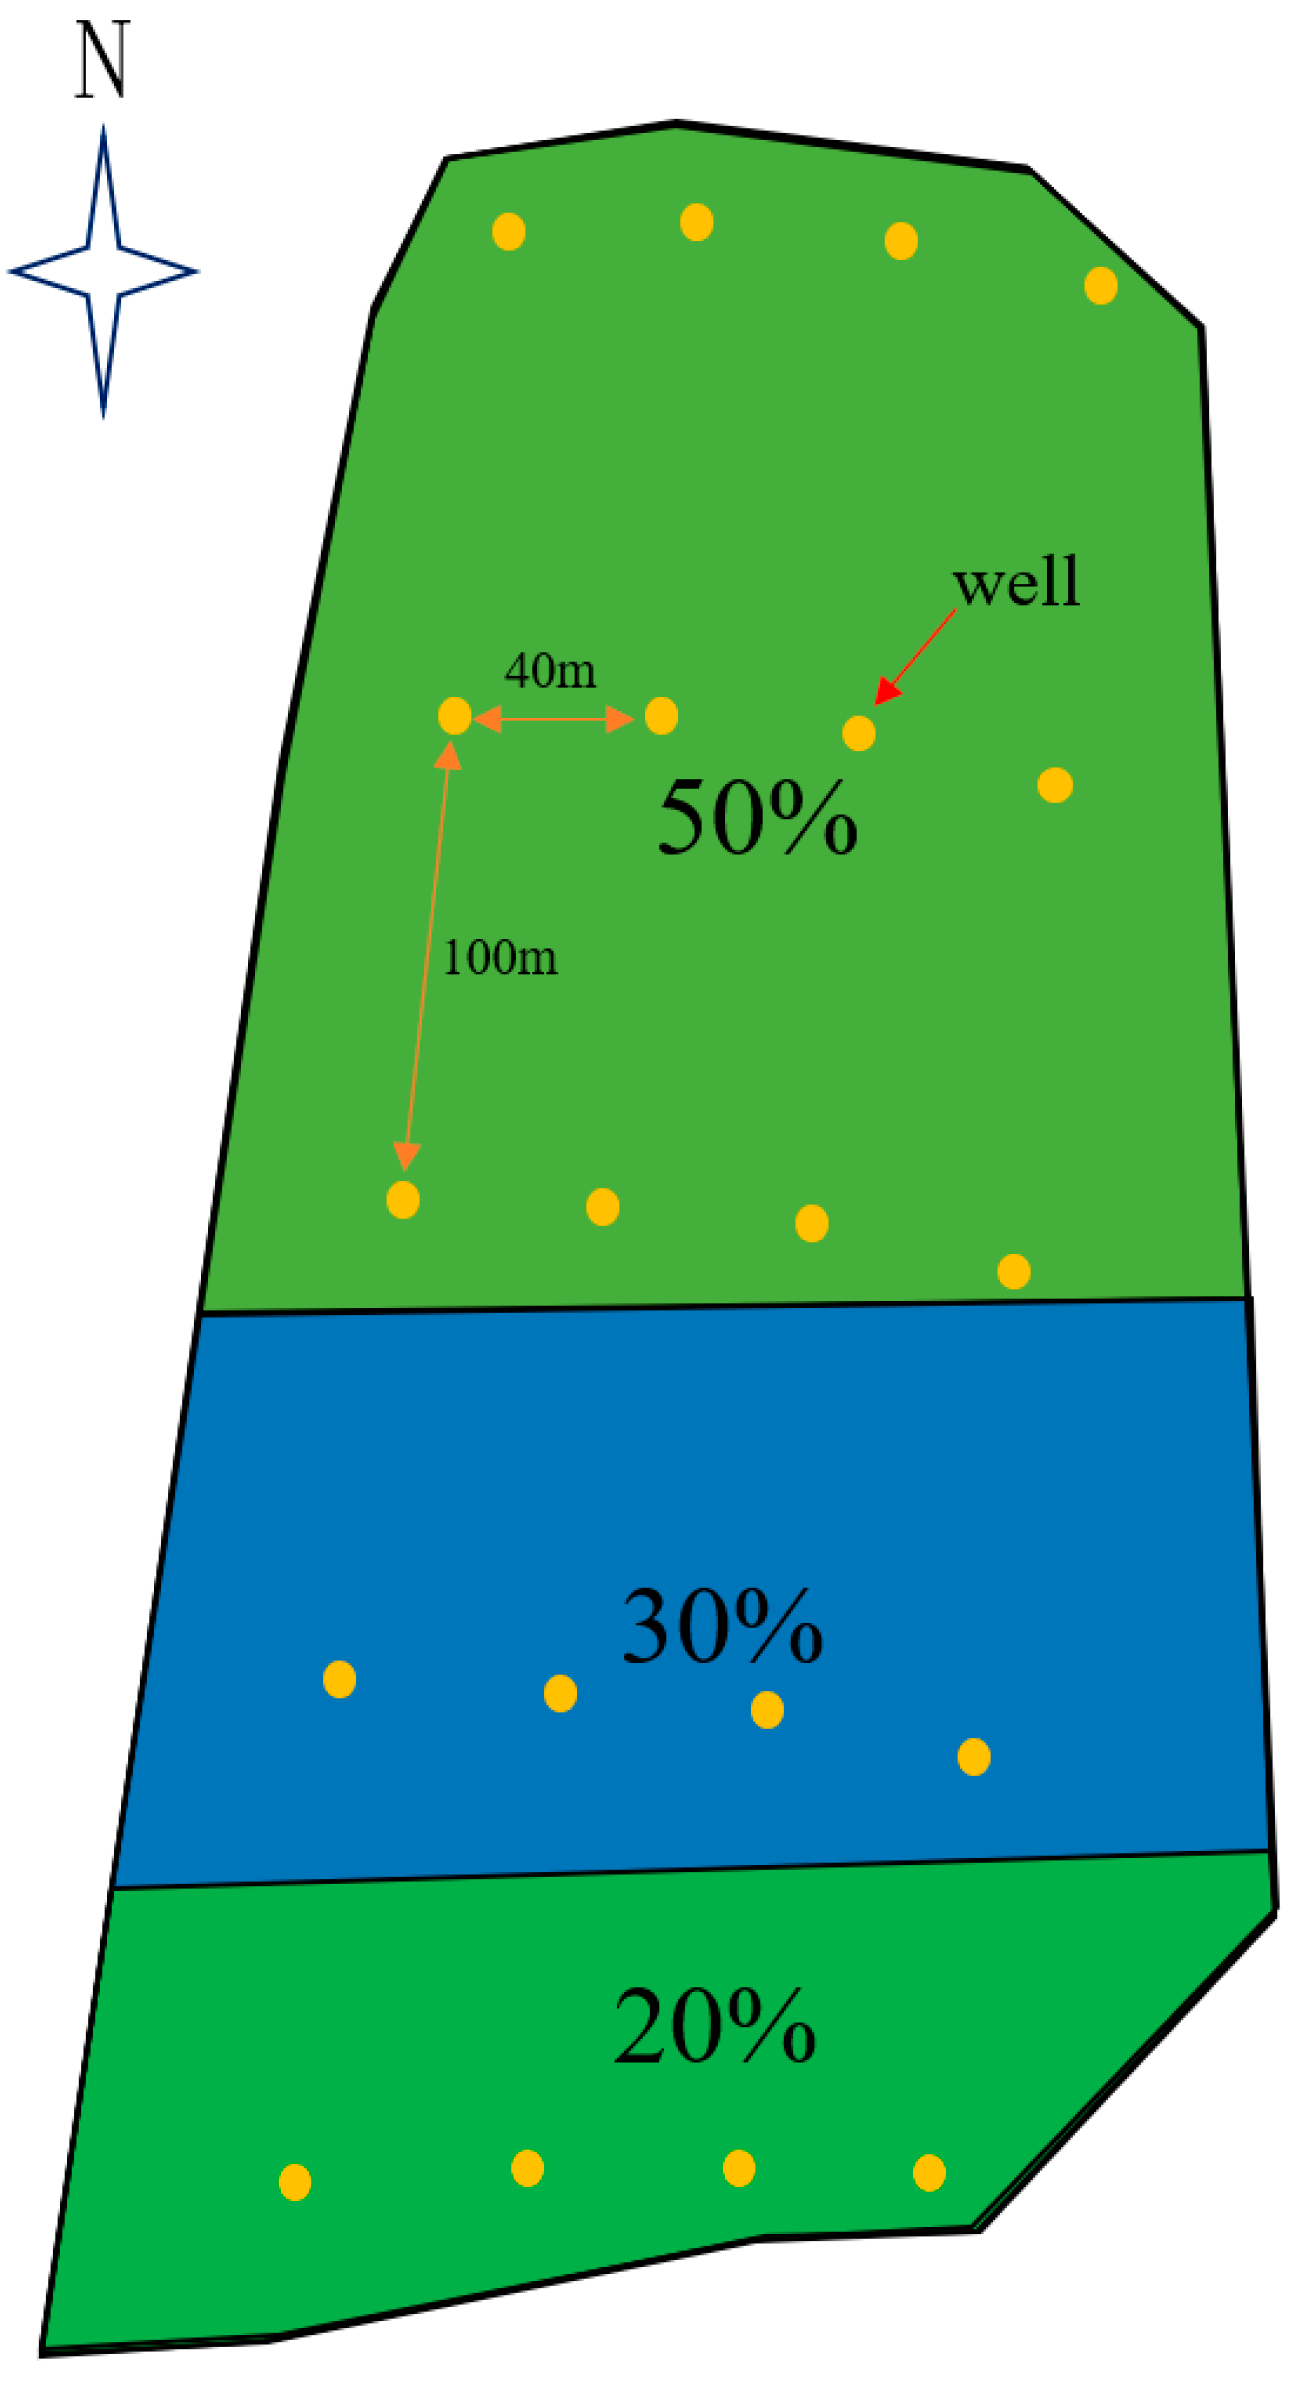
The current simulation considers the effects of different hydraulic conductivity (0.432, 2, 4.32 m/d), storage coefficient (0.01, 0.04, 0.1), specific yield (0.0035, 0.035, 0.06), and degrees of cover (100%, 80%, 50%) of the clay layer and its location on groundwater drawdown (Table 4). For the simulation, 20 dewatering wells are installed 100 m apart in the north–south direction and 40 m apart in the east–west direction. This allows for comparison of 30 scenarios (Figure 5). In order to meet the requirements of the actual project, the groundwater level in the catchment area must be lowered to below 1795 m. In order to make different scenarios have the same initial hydrological conditions, the simulation result of the steady-state model for parameter optimization was used as the initial conditions. The transient model used to predict the foundation pit dewatering was simulated for 300 days.
The coverage of the clay layer is determined sequentially based on the percentage of the precipitation area, e.g., 100%, 80%, and 50%.

5. Results and Discussion

5.1. Influence of Cutoff Walls

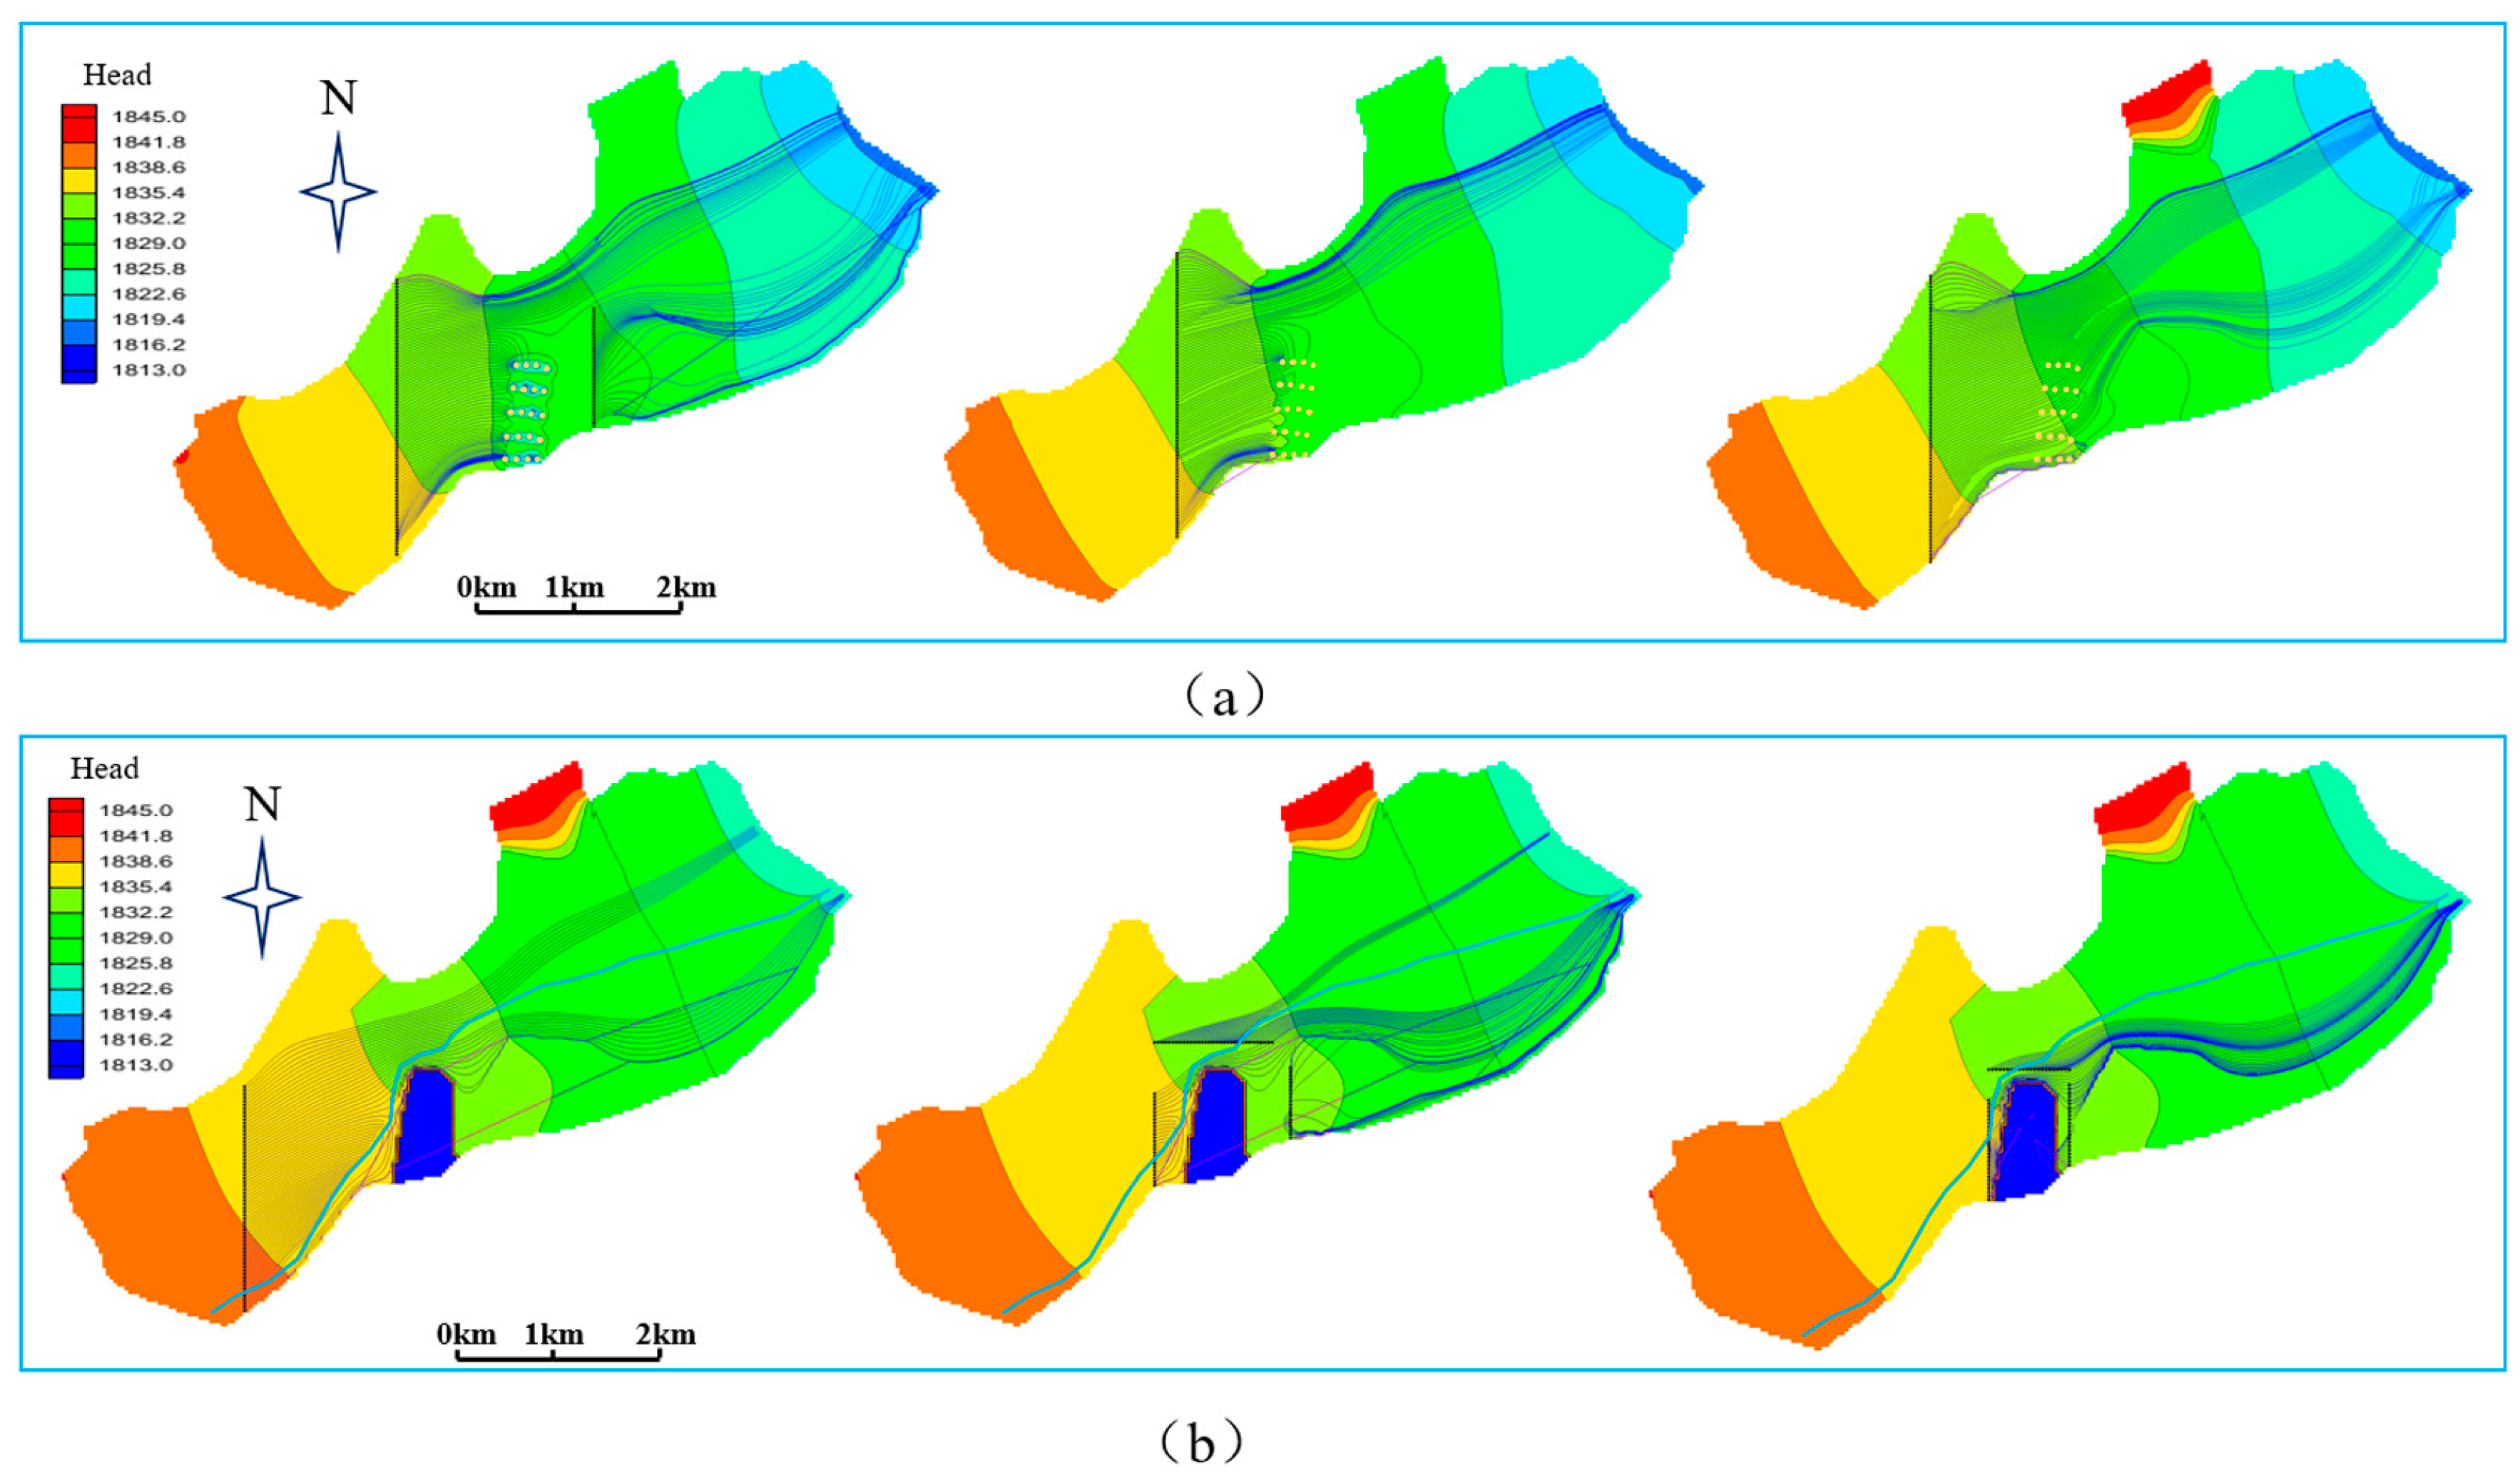
To compare the effectiveness of cutoff walls, this study presents drainage impacts under two scenarios: with and without cutoff walls. The results of the MODPATH simulations (Figure 6a) show that without cutoff walls, water originally flowing downstream is captured by the drainage wells in the drainage area due to the formation of a funnel. In particular, the water from the upper layers flows more toward the rivers and downstream, while the lower layers are captured by the drainage area and only a small amount enters the rivers. In mortar curtains, the influence of the funnel is limited to the area around the curtains (Figure 6b). Water draining from more distant regions encounters mortar curtains during its runoff, with a small amount of water entering the interior of the mortar curtain from outside the drainage area due to the leakage effects of the mortar curtain. The remaining water flows into streams or follows the terrain downstream. A similar effect is seen in closer regions, but more water from closer regions penetrates further into the drainage area due to the “interception effect”. In general, only a negligible amount of water infiltrates from outside the drainage area, and most of the mine water originates from the drainage area aquifer. The impact of precipitation outside the drainage area is small. Therefore, the presence of injection curtains greatly increases the dewatering effect.

5.2. Influence of Clay Layer Cover on Drainage Effect

Considering the irregular distribution of clay within the space, the study area has a strong heterogeneity. The distribution pattern of the clay layer has a significant influence on the drainage performance within the site, so a parameter sensitivity analysis of the clay layer distribution is required prior to the drainage simulations.
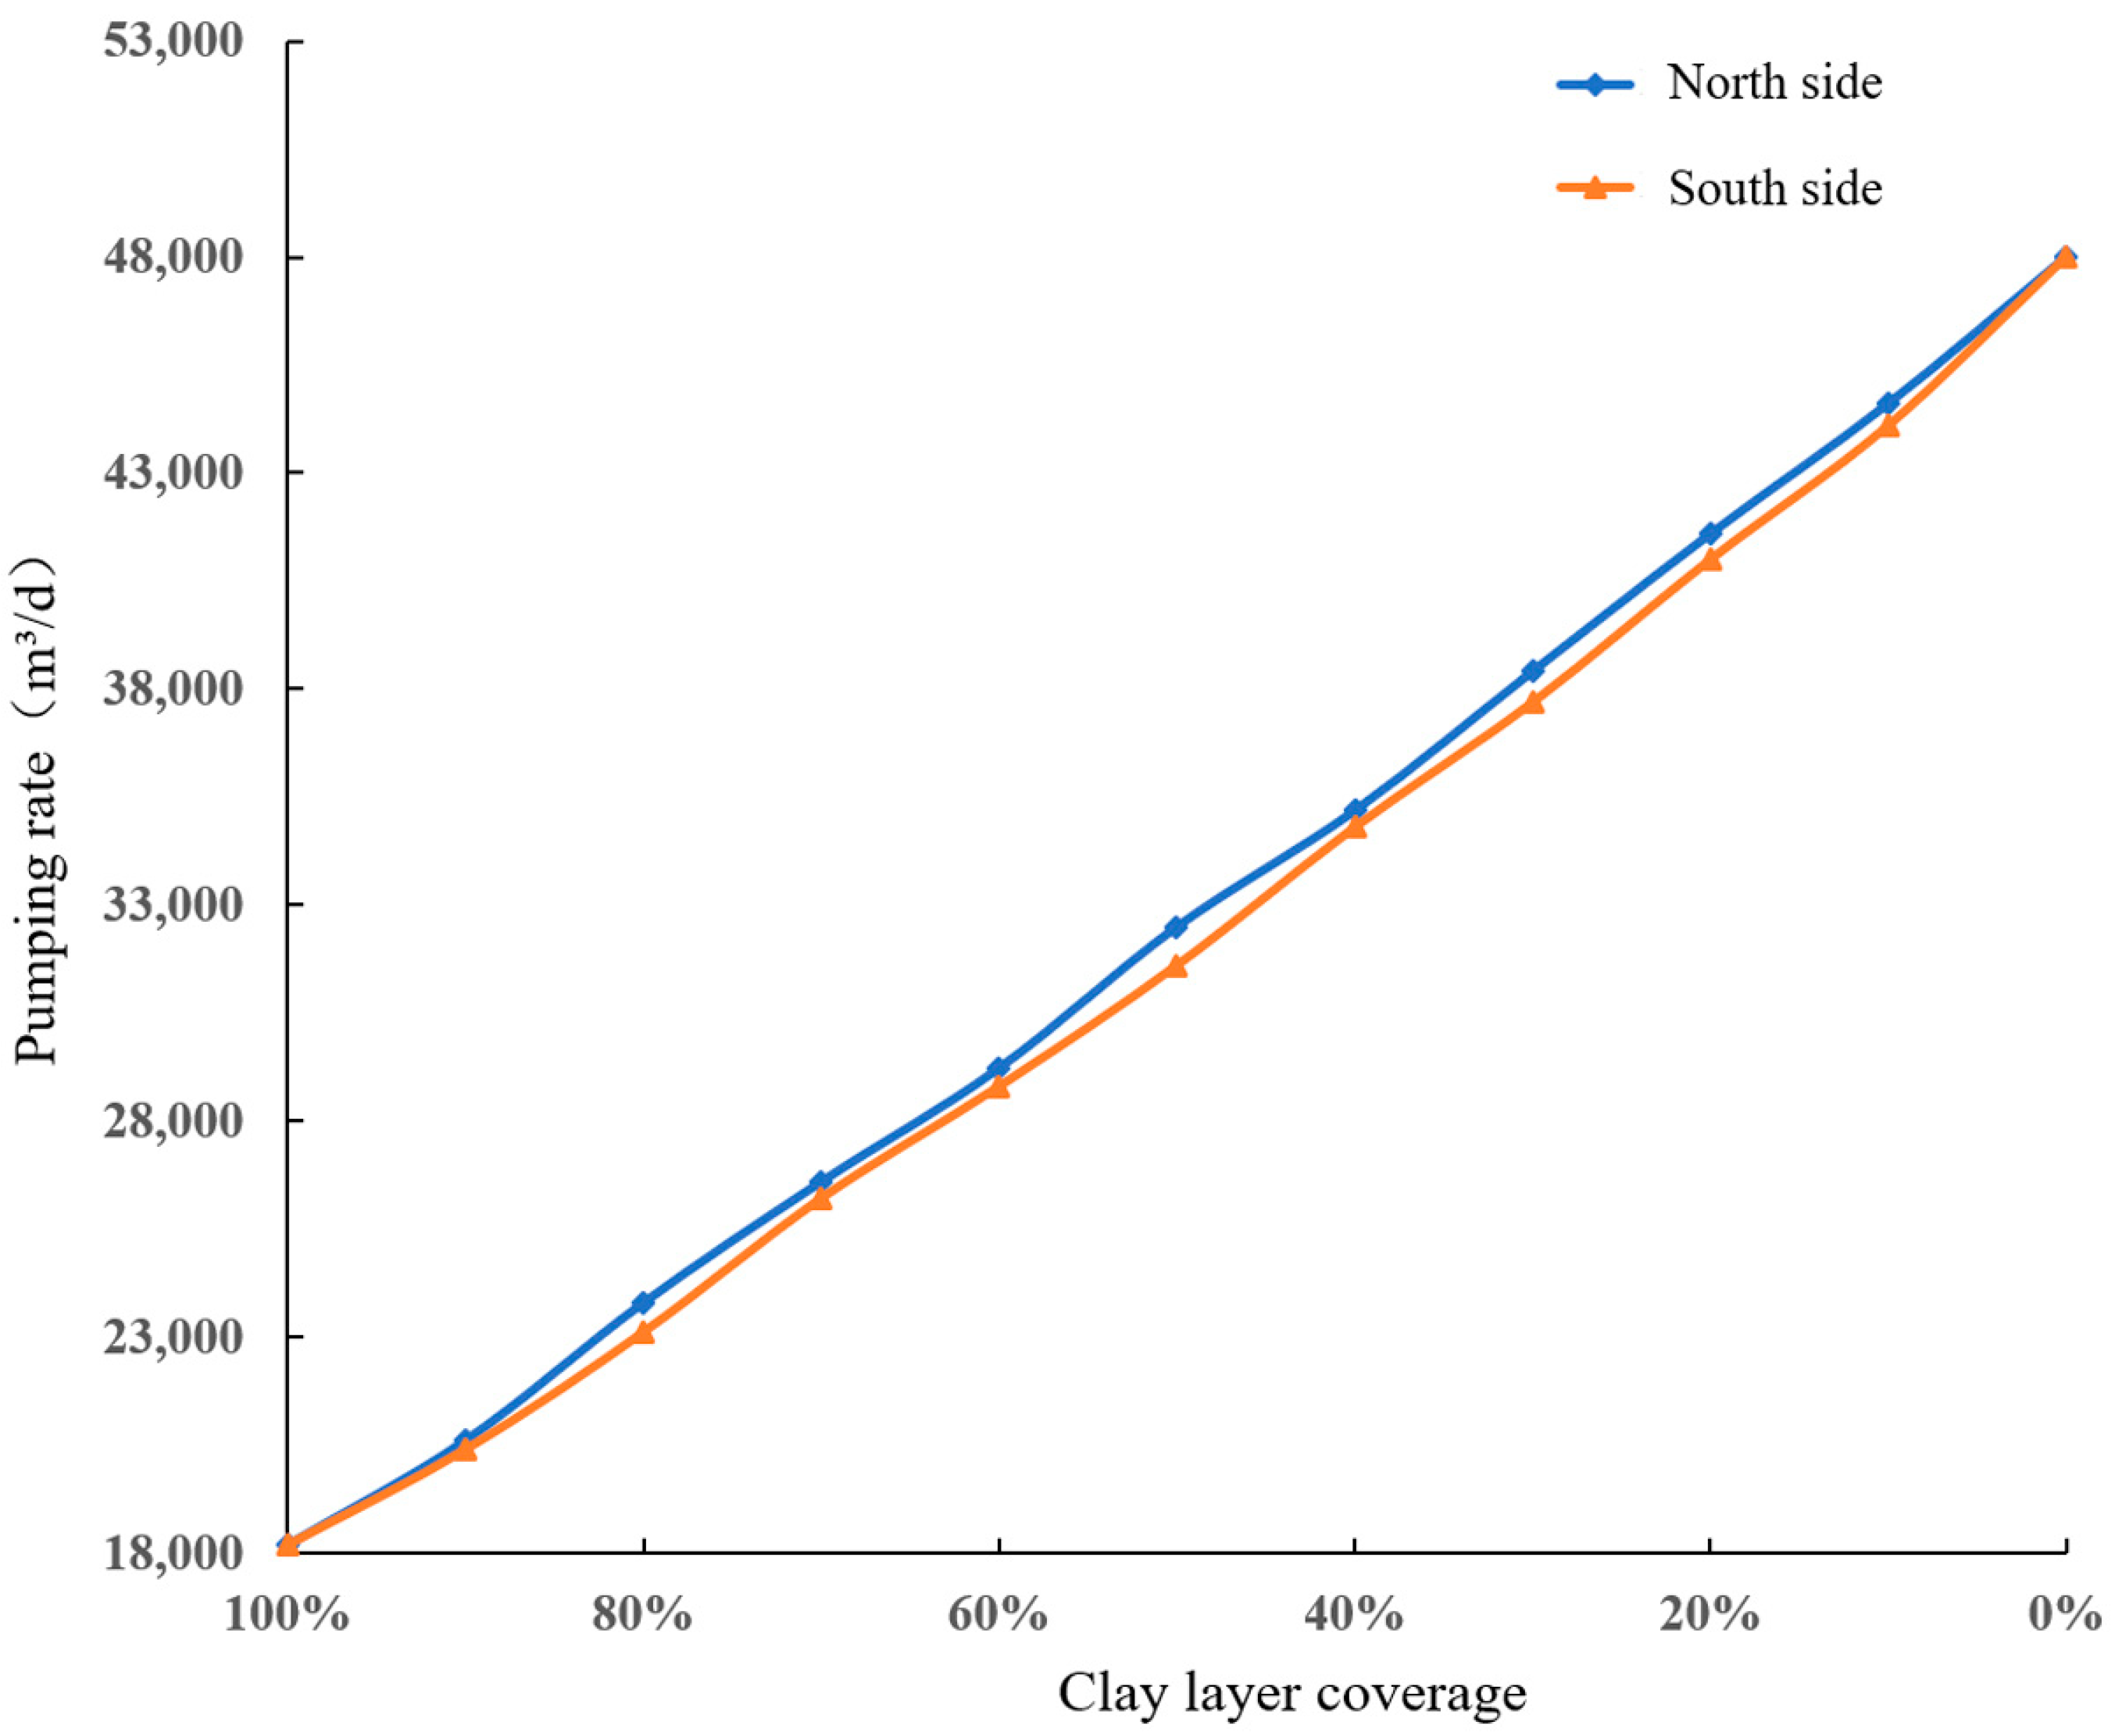
Calculations were performed to determine the pumping rates required to lower the water table at the extraction wells to the target depth under various clay layer overburden conditions. This resulted in a curve representing the relationship between clay layer overburden and pumping rates. The blue curve in Figure 7 reflects the changing trend of pumping rate when clay coverage gradually decreases from north to south, and the yellow curve shows its trend when clay coverage gradually decreases from south to north. From the two curves, it can be seen that pumping rates increase when the clay layer overburden decreases, indicating a clear relationship between the two factors. The simulation results show that under constant conditions, pumping rates at the production wells can increase from a minimum of 18,200 m3/d at 100% clay layer cover to a maximum of 48,000 m3/d at 0% clay layer cover. At 100% clay layer cover, the combination of clay layer and curtain acts as a “sealed box” that reduces groundwater recharge in the lower and lateral aquifers and significantly lowers pumping rates. As the clay layer cover decreases, the effect of this “sealed box” gradually weakens, resulting in a denser connection between the upper and lower aquifers and thus higher pumping rates. Although the distribution of clay layers at different locations can affect pumping rates, the influence of the “sealed box” effect outweighs the effects of location. The decreasing trend of the “sealed box” effect means that regardless of the location of the clay layer distribution, total pumping rates increase with decreasing overburden.
As the clay layer cover decreases, the pumping rate gradually increases. The pumping rate is higher when the clay layer is in the north than when it is in the south.

5.3. Simulation Results and Discussion

For the 30 simulated scenarios, the daily runoff rates vary due to several influencing factors. The minimum daily discharge rate is 18,200 m3/d (Scenario 1), while the maximum rate is 37,400 m3/d (Scenario 27). In particular, Scenario 12 has a daily discharge rate of 20,700 m3/d, which is very close to the actual discharge capacity (Table 4).
The distribution location of the clay layer significantly affects the drainage results. A comparison between the clay distribution in the riverbed (north) and in the foothills (south) shows significant differences in well discharge rates. When the clay layer is in the riverbed, higher pumping rates are generally required than when the clay layer is distributed in the foothills (Figure 7). This discrepancy results from the fact that, under equivalent cover conditions, there is no curtain in the south, allowing groundwater from the uplands to continuously recharge the catchment. As a result, the required pumping rates increase significantly. On the other hand, if the clay layer is located in the foothills, the groundwater from the uplands is effectively screened by the properties of the clay layer, creating a curtain-like effect and reducing the required pumping rates.
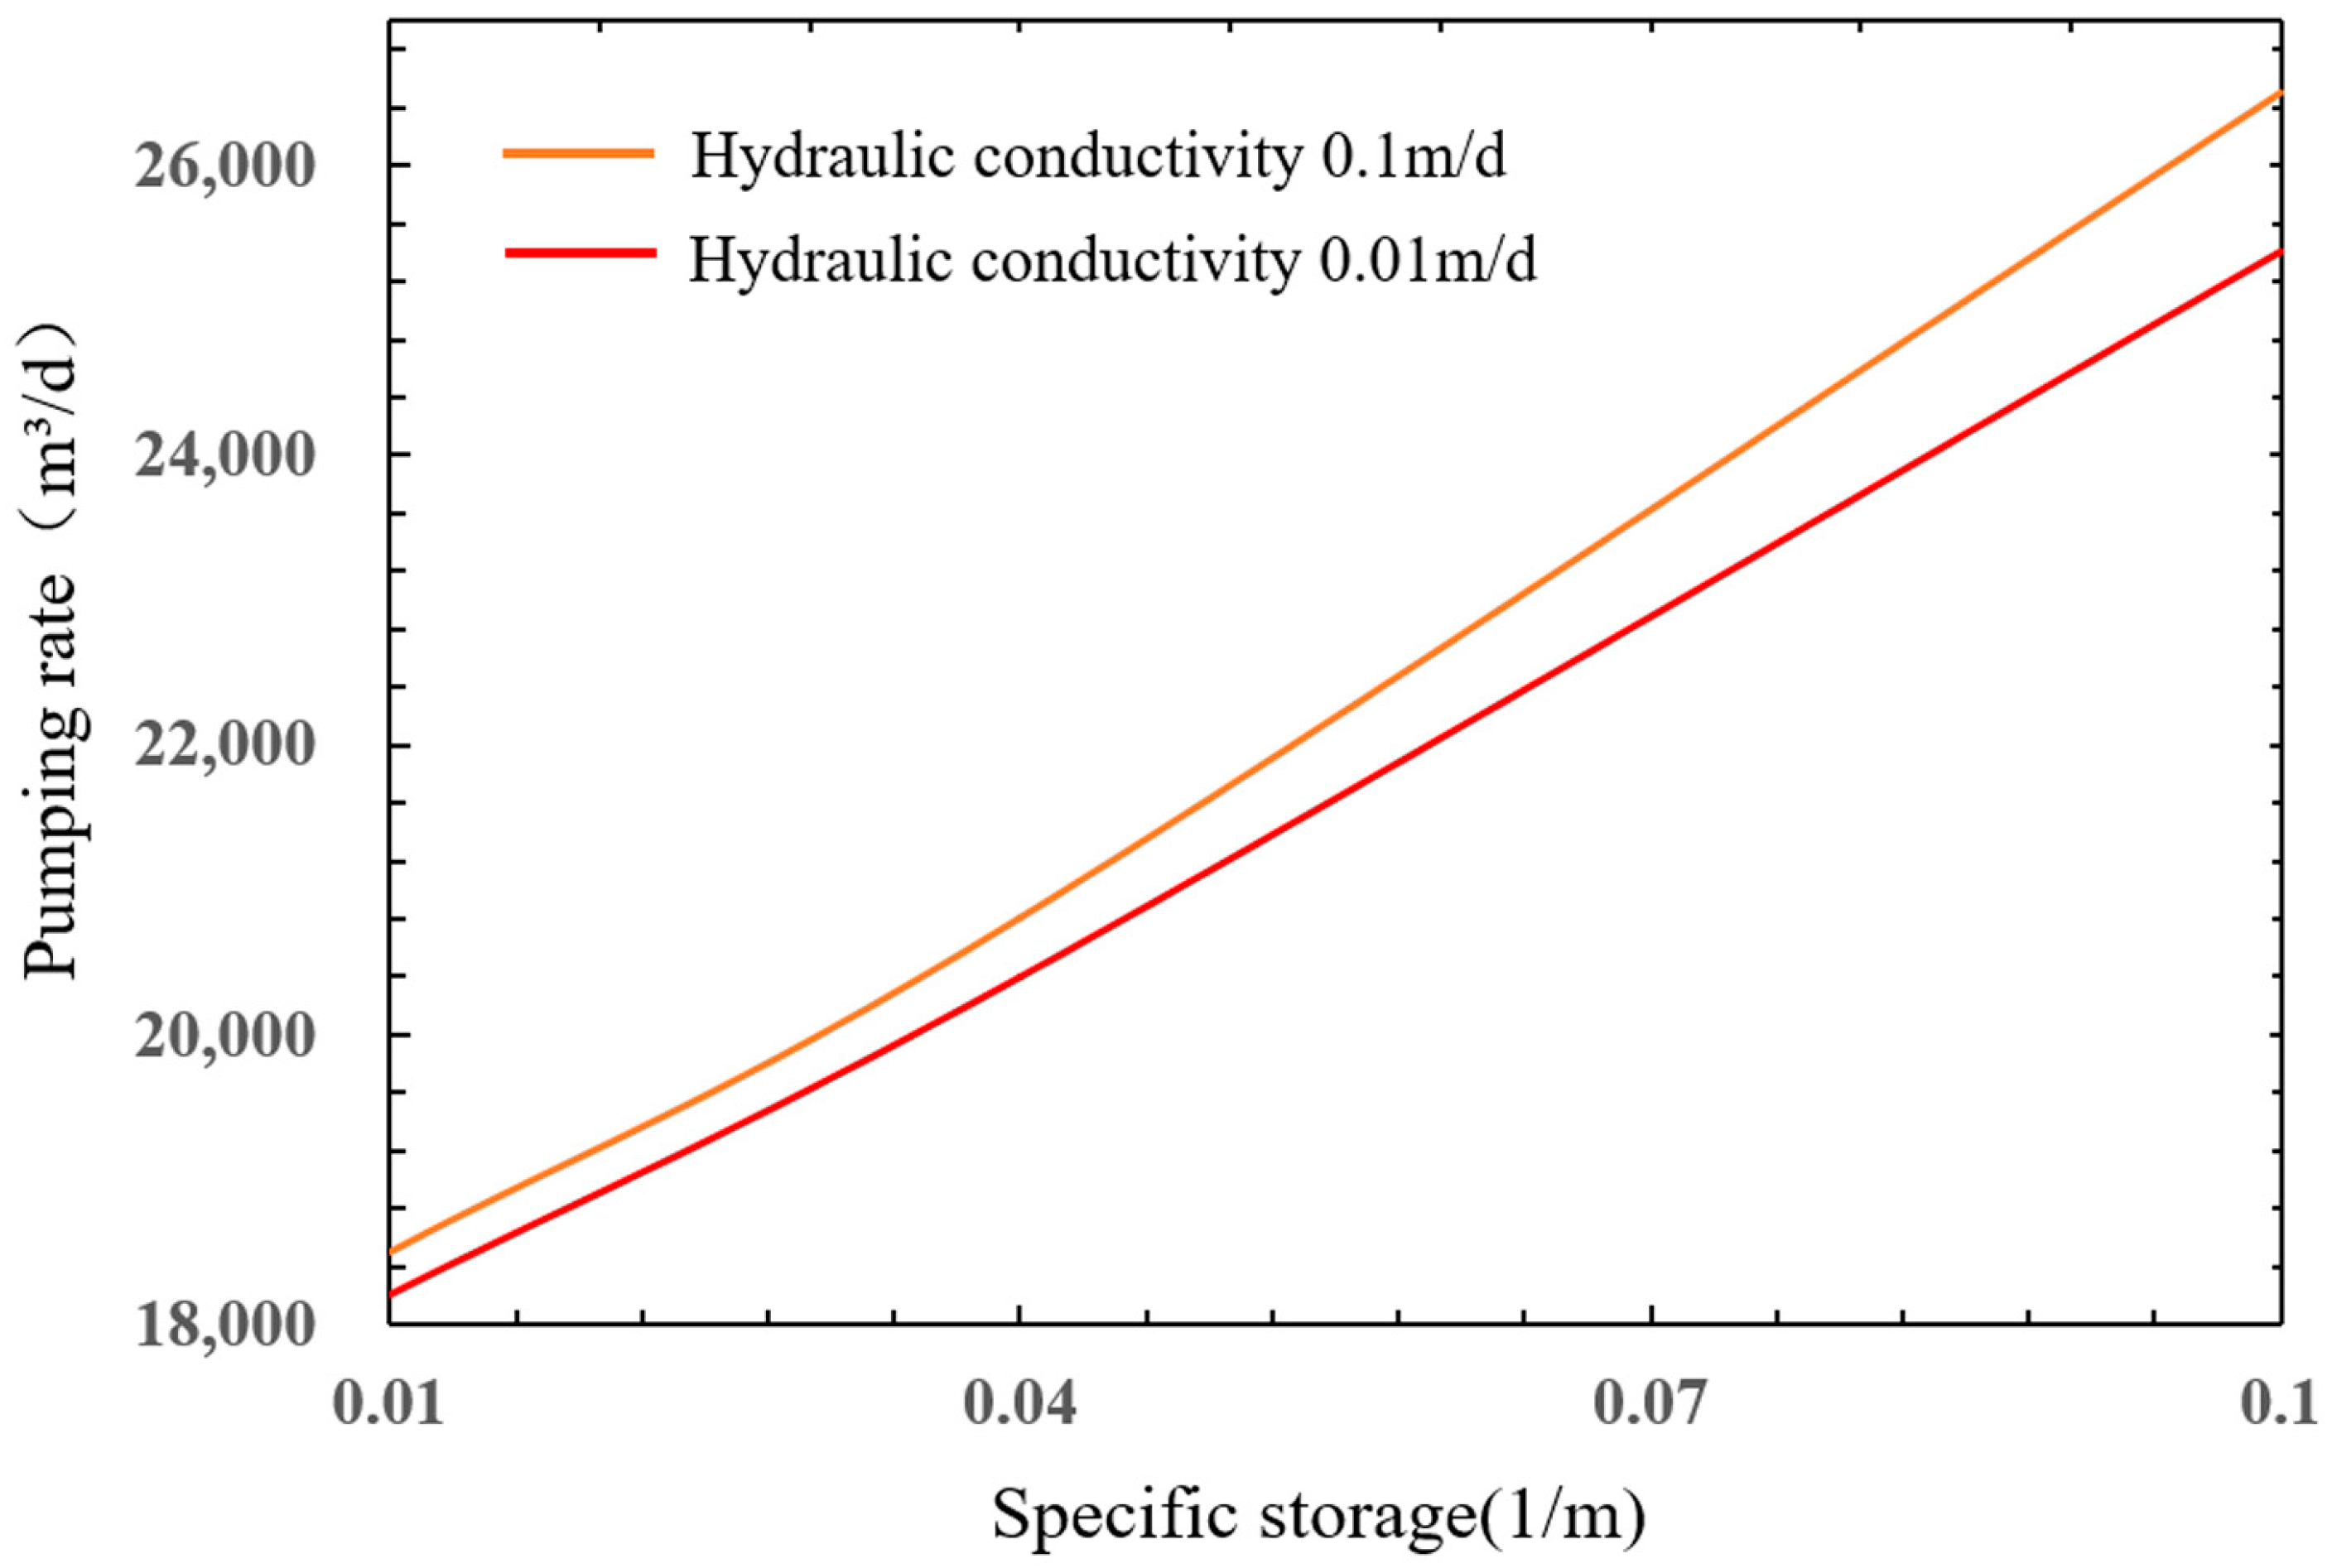
Regardless of the distribution of the clay layer, variations in the hydraulic conductivity, storage coefficient, and specific yield under constant conditions result in significant changes in the simulated drainage effects. As the hydraulic conductivity increases (from 0.432 to 4.32 m/d), pumping rates at the extraction wells gradually increase. The effects of variations in storage coefficient (from 0.01 to 0.1) on dewatering results mirror the effects of hydraulic conductivity. Overall, higher permeability and storage coefficients result in higher pumping rates.
However, it is noteworthy that under constant conditions, when the storage coefficient is 0.01, the daily dewatering rates for hydraulic conductivities of 0.432 and 4.32 for clay layers are 18,200 m3/d and 18,500 m3/d, respectively, a difference of only 300 m3/d. For a storage coefficient of 0.1, these values are 25,400 m3/d and 26,500 m3/d, respectively, a difference of 1100 m3/d. This indicates a cumulative effect of the various factors, and the effect of a higher hydraulic conductivity becomes more apparent when combined with a higher storage coefficient (Figure 8).
The influence of the hydraulic conductivity of the clay layer and the specific yield on the pumping rate is studied. The increasing size of the shaded area shows that the influence of the various factors on the pumping results becomes more evident as the size of these factors increases.
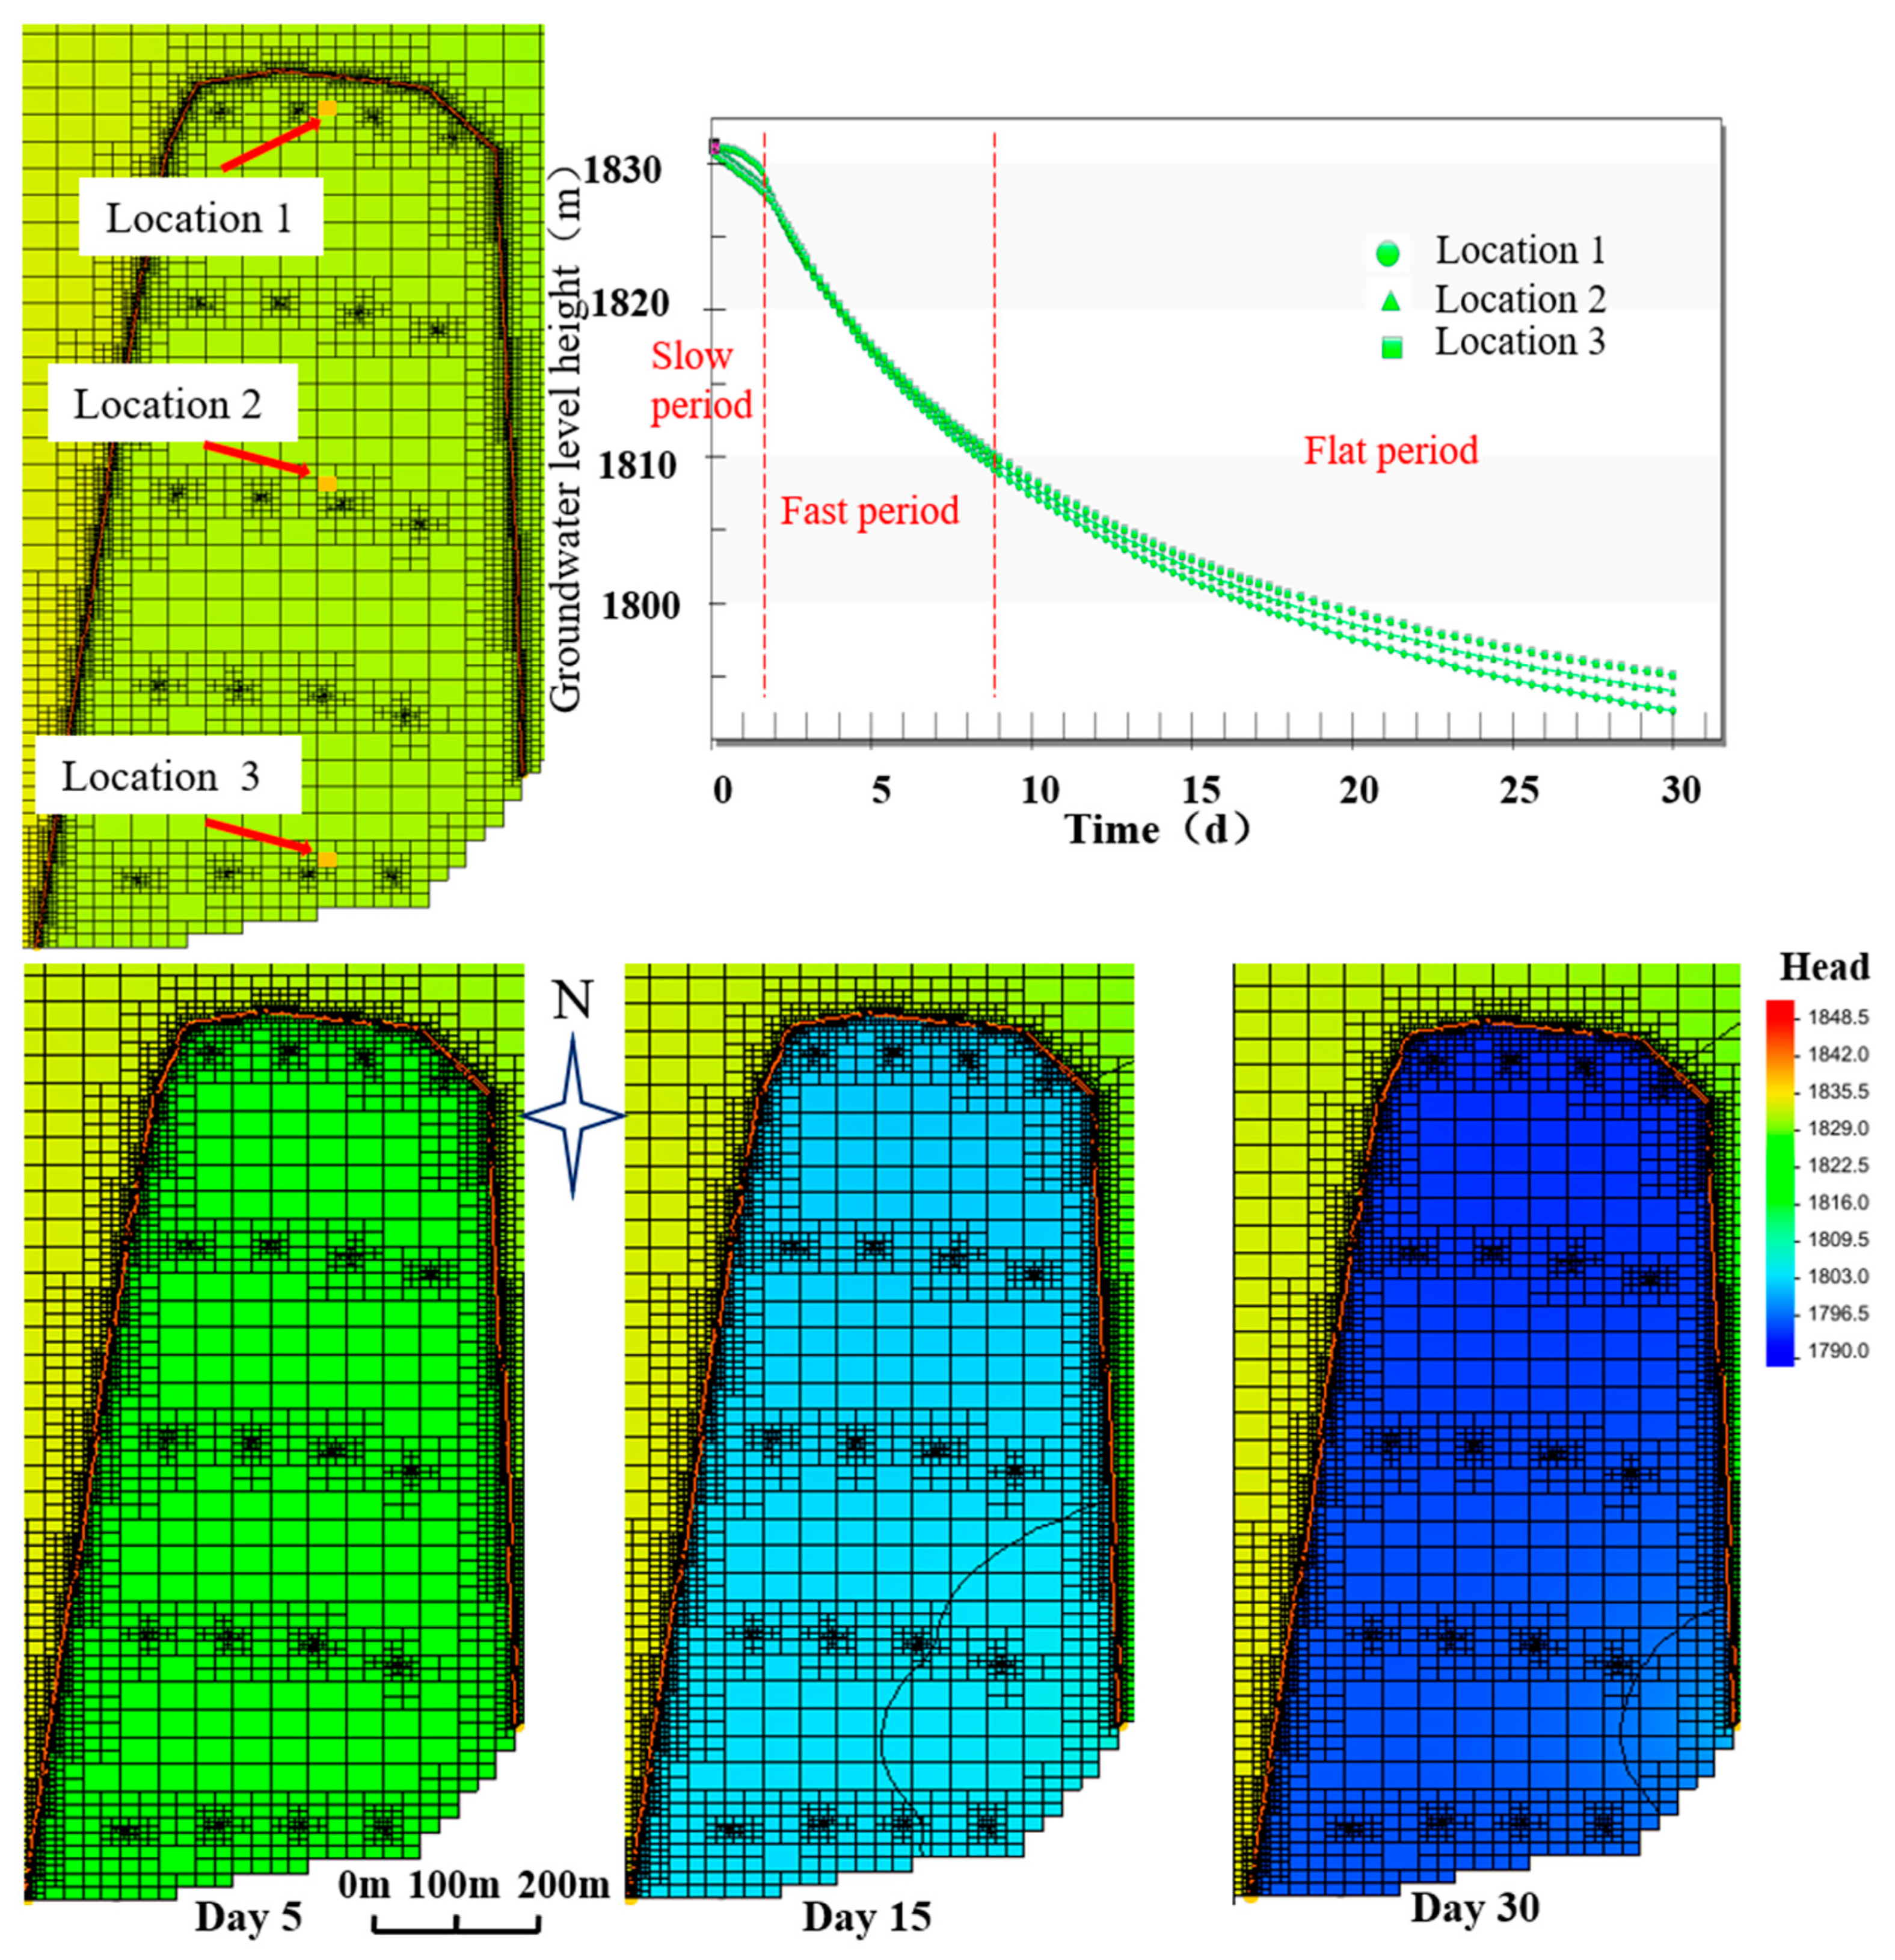
The curve of simulation results shows that the water level decreases gradually in the initial phase of drainage. In this phase, the drainage rate gradually slows down from north to south. This is followed by a phase of rapid water level decline, characterized by a rapid drop in the water level within the drainage area (Figure 9). The duration of this rapid phase is closely related to the location of the withdrawal wells. Under the condition of 100% clay layer cover, the duration of this rapid phase is shorter in areas close to the hills. After the end of the rapid phase, the water level shows a slightly decreasing tendency in the entire catchment area. Figure 9 shows the process of groundwater level decline in the engineering area. It can be seen that before the dewatering, the average groundwater level in the engineering was around 1832 m. In the five days after the dewatering, the average water level dropped to 1822 m, later to 1803 on the 15th day, and to 1790 on the 30th day.
The change in groundwater level over time is studied for several monitoring wells. In the two days before the rains, the water level shows a gradual decline. Then, from the 2nd to the 9th day, a phase of rapid decline is observed. After the phase of rapid decline, the water level stabilizes with a gradual downward trend.
In cases where cover, storage coefficient, hydraulic conductivity, and porosity remain unchanged, the variation in simulated results with changes in specific yield is relatively small. Therefore, specific yield within the parameter range has limited effect on the calculated pumping station discharge.

6. Conclusions

In order to investigate the impact of aquitard layers (clay layers) on drainage projects, this work created a heterogeneous geological model based on geological knowledge and performed a comparative analysis of different grid models within the GMS software in terms of their advantages and limitations in simulation calculations. The grid model MODFLOW-USG allows local refinement that provides accurate simulation results while saving computational time. Using MODFLOW-USG, a coupled numerical model was developed that accounts for engineered structures, complex geologic strata, hydrogeologic boundaries, cutoff walls, and dewatering well configurations.
In addition, the MODPATH module in the GMS software was used to track the flow direction of water outside the drainage area. The results show that the water outside the drainage area follows the flow direction. The cutoff walls effectively prevent water from outside the drainage area from entering the precipitation zone. The model created provides a visual representation of changes in the water table in the study area as the drainage project progresses.
The presence of aquitard layers (clay layers) significantly affects the drainage effect. Here, the permeability and storage coefficient of the aquitard layers (clay layers) have a negative effect on the drainage effect, while the overburden of the aquitard layers (clay layers) has a positive effect. Although different distributions of the aquitard layers (clay layers) result in different drainage effects, their positioning is not the primary factor; instead, changes in the specific yield of the aquitard layers (clay layers) have minimal effect on the drainage effect.
By comparing calculated results from formulas, actual dewatering data, and model simulations, it was found that the model simulations reflect the actual dewatering process very well within the range of calculated results from formulas. This established model accurately reflects the real dewatering processes in the field and can provide valuable insights for dewatering projects under complex geologic conditions.

Author Contributions

J.W.: conceptualization, methodology, writing—original draft and validation, and funding acquisition; Z.M.: software, formal analysis, investigation, and writing—original draft; J.Z.: software, validation, formal analysis, and investigation; Z.C.: conceptualization, formal analysis, writing—review and editing, and visualization; G.L.: resources, investigation, and software. All authors have read and agreed to the published version of the manuscript.

Funding

This research was funded by the Jiangsu Provincial Natural Science Foundation General Project [grant number: BK20221507]; the National Key Research and Development Program of China [grant number: 2019YFC1804302]; the Fundamental Research Funds for the Central Universities [grant number: B220202053]; the Shandong Provincial Water Diversion Project Operation and Maintenance Center Science and Technology Project [grant number: 2019001].

Data Availability Statement

No new data were created or analyzed in this study. Data sharing is not applicable to this article.

Acknowledgments

The authors acknowledge valuable comments from the reviewers, which led to significant improvement of the paper.

Conflicts of Interest

The authors declare no conflict of interest.

References

  1. Wang, J.; Deng, Y.; Wang, X.; Liu, X.; Zhou, N. Numerical evaluation of a 70-m deep hydropower station foundation pit dewatering. Environ. Earth Sci. 2022, 81, 364. [Google Scholar] [CrossRef]
  2. Zhang, X.; Wang, X.; Xu, Y. Influence of Filter Tube of Pumping Well on Groundwater Drawdown during Deep Foundation Pit Dewatering. Water 2021, 13, 3297. [Google Scholar] [CrossRef]
  3. Zeng, C.-F.; Xue, X.-L.; Li, M.-K. Use of cross wall to restrict enclosure movement during dewatering inside a metro pit before soil excavation. Tunn. Undergr. Space Technol. 2021, 112, 103909. [Google Scholar] [CrossRef]
  4. Wang, X.-w.; Xu, Y.-s. Impact of the depth of diaphragm wall on the groundwater drawdown during foundation dewatering considering anisotropic permeability of aquifer. Water 2021, 13, 418. [Google Scholar] [CrossRef]
  5. Ahmad, I.; Tayyab, M.; Zaman, M.; Anjum, M.N.; Dong, X. Finite-difference numerical simulation of dewatering system in a large deep foundation pit at Taunsa Barrage, Pakistan. Sustainability 2019, 11, 694. [Google Scholar] [CrossRef]
  6. Wang, J.; Huang, T.; Hu, J.; Wu, L.; Li, G.; Yang, P. Field experiments and numerical simulations of whirlpool foundation pit dewatering. Environ. Earth Sci. 2014, 71, 3245–3257. [Google Scholar] [CrossRef]
  7. Ma, Z.; Tang, S.; Yang, Z. Numerical analysis of metro station pit dewatering and its influence. Front. Earth Sci. 2023, 10, 1120772. [Google Scholar] [CrossRef]
  8. Lu, W.; Chen, Z.; Wu, R.; Zhang, Z. Numerical modeling of foundation pit dewatering based on Visual Modflow. In Proceedings of the IOP Conference Series: Earth and Environmental Science, Surakarta, Indonesia, 24–25 August 2021; p. 022003. [Google Scholar]
  9. Du, S.; Liu, P.; Wang, W.; Shi, W.; Li, Q.; Li, J.; Li, J. Numerical Simulation and Analysis of the Influencing Factors of Foundation Pit Dewatering under a Coupled Radial Well and Curtain. Water 2023, 15, 1839. [Google Scholar] [CrossRef]
  10. She, J. Dewatering control of foundation pit under the condition of failure of water-stop curtain. In Proceedings of the IOP Conference Series: Earth and Environmental Science, Surakarta, Indonesia, 24–25 August 2021; p. 012101. [Google Scholar]
  11. Wu, L. Design and Construction of Engineering Dewatering and Seepage Theory of Foundation Pit; People’s Communications Press: Beijing, China, 2003. [Google Scholar]
  12. Yang, K.; Xu, C.; Chi, M.; Wang, P. Analytical analysis of the groundwater drawdown difference induced by foundation pit dewatering with a suspended waterproof curtain. Appl. Sci. 2022, 12, 10301. [Google Scholar] [CrossRef]
  13. Wang, J.; Long, Y.; Zhao, Y.; Liu, X.; Pan, W.; Qu, J.; Wang, H.; Shi, Y. Numerical simulation of foundation pit dewatering using horizontal seepage reducing body. Sci. Rep. 2022, 12, 1397. [Google Scholar] [CrossRef]
  14. Wang, J.; Liu, X.; Wu, Y.; Liu, S.; Wu, L.; Lou, R.; Lu, J.; Yin, Y. Field experiment and numerical simulation of coupling non-Darcy flow caused by curtain and pumping well in foundation pit dewatering. J. Hydrol. 2017, 549, 277–293. [Google Scholar] [CrossRef]
  15. Liu, L.; Lei, M.; Cao, C.; Shi, C. Dewatering characteristics and inflow prediction of deep foundation pits with partial penetrating curtains in sand and gravel strata. Water 2019, 11, 2182. [Google Scholar] [CrossRef]
  16. Mao, X. Application of new pumping technology in dewatering in deep soft soil pit. In Proceedings of the IOP Conference Series: Earth and Environmental Science, Surakarta, Indonesia, 24–25 August 2021; p. 012083. [Google Scholar]
  17. Wang, J.; Liu, X.; Liu, S.; Zhu, Y.; Pan, W.; Zhou, J. Physical model test of transparent soil on coupling effect of cut-off wall and pumping wells during foundation pit dewatering. Acta Geotech. 2019, 14, 141–162. [Google Scholar] [CrossRef]
  18. Li, D.; Ma, J.; Wang, C.; Gao, X.; Fang, M. A New Method for Piping Risk Evaluation on Unconfined Aquifers under Dewatering of Deep Foundation Pits. KSCE J. Civ. Eng. 2022, 26, 3275–3286. [Google Scholar] [CrossRef]
  19. Chen, Z.; Huang, J.; Zhan, H.; Wang, J.; Dou, Z.; Zhang, C.; Chen, C.; Fu, Y. Optimization schemes for deep foundation pit dewatering under complicated hydrogeological conditions using MODFLOW-USG. Eng. Geol. 2022, 303, 106653. [Google Scholar] [CrossRef]
  20. Liu, N.-W.; Peng, C.-X.; Li, M.-G.; Chen, J.-J. Hydro-mechanical behavior of a deep excavation with dewatering and recharge in soft deposits. Eng. Geol. 2022, 307, 106780. [Google Scholar] [CrossRef]
  21. Irfan, M.; Akbar, A.; Aziz, M.; Khan, A.H. A parametric study on stability of open excavations in alluvial soils of Lahore district, Pakistan. Geotech. Geol. Eng. 2013, 31, 729–738. [Google Scholar] [CrossRef]
  22. Gallikova, Z.; ur Rehman, Z. Appraisal of the hypoplastic model for the numerical prediction of high-rise building settlement in Neogene clay based on real-scale monitoring data. J. Build. Eng. 2022, 50, 104152. [Google Scholar] [CrossRef]
  23. Bear, J. Dynamics of Fluids in Porous Media; Dover Publications, Incorporated: New York, NY, USA, 1972. [Google Scholar]
  24. Neuman, S.P. Adaptive Eulerian-Lagrangian finite element method for advection-dispersion. Numer. Method Eng. 1984, 20, 321–337. [Google Scholar] [CrossRef]
  25. Aquaveo Groundwater Modeling System (GMS, v.10), Aquaveo: Provo, UT, USA, 2014.
  26. Panday, S.; Langevin, C.D.; Niswonger, R.G.; Ibaraki, M.; Hughes, J.D. MODFLOW–USG Version 1: An Unstructured Grid Version of MODFLOW for Simulating Groundwater Flow and Tightly Coupled Processes Using a Control Volume Finite-Difference Formulation; Report 6-A45; US Geological Survey: Reston, VA, USA, 2013.
  27. Krcmár, D.; Sracek, O. MODFLOW-USG: The New Possibilities in Mine Hydrogeology Modelling (or What is Not Written in the Manuals). Mine Water Environ. 2014, 33, 376–383. [Google Scholar] [CrossRef]
  28. Duran, L.; Gill, L. Modeling spring flow of an Irish karst catchment using Modflow-USG with CLN. J. Hydrol. 2021, 597, 125971. [Google Scholar] [CrossRef]
  29. Pollock, D.W. User guide for MODPATH Version 6: A Particle Tracking Model for MODFLOW; US Geological Survey: Reston, VA, USA, 2012.
  30. Miller, R. User’s Guide for Riv2—A Package for Routing and Accounting of River Discharge for a Modular, Ground-Water Flow Model; US Geological Survey: Reston, VA, USA, 1988.
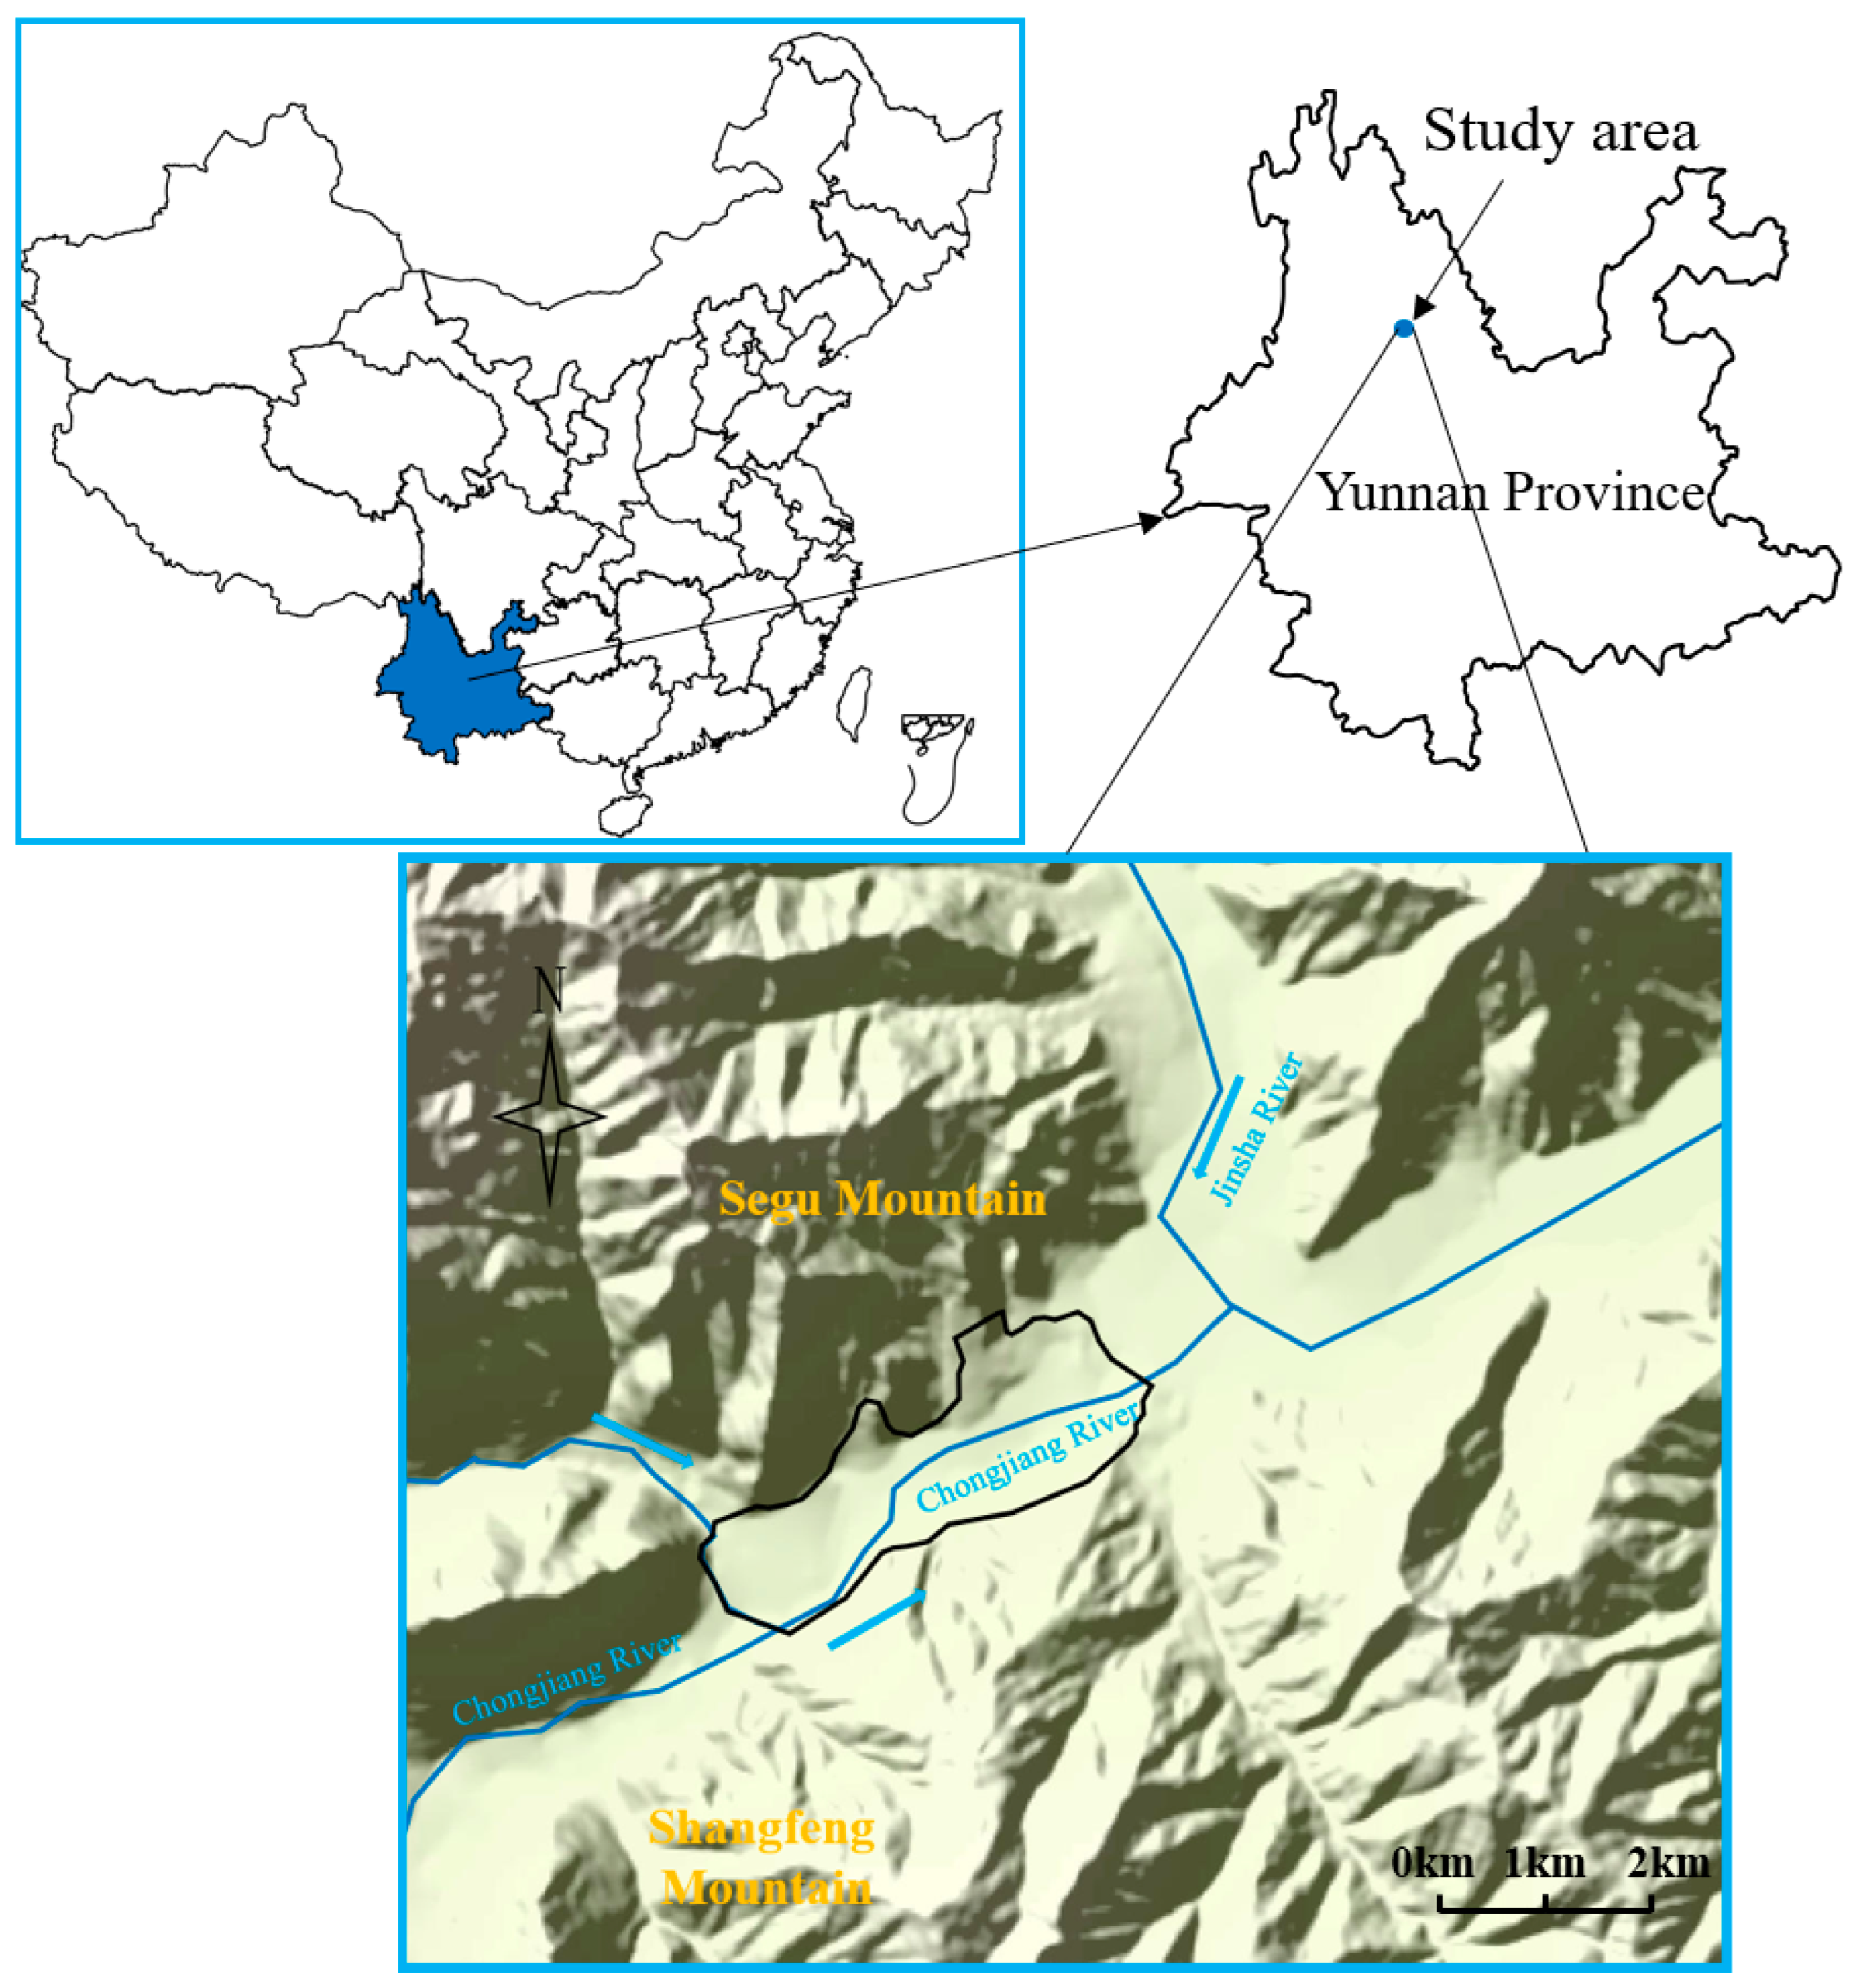
Figure 1. The location and layout of the foundation pit dewatering project.
Water 15 03722 g001
Figure 2. (a) Schematic diagram of generalization of model boundary conditions and recharge zonation of rainfall infiltration coefficients and (b) engineering area.
Water 15 03722 g002
Figure 3. Three-dimensional diagram of the model.
Water 15 03722 g003
Figure 4. Contour map of groundwater level during the low-flow period and simulation errors.
Water 15 03722 g004
Figure 5. Schematic representation of the precipitation arrangement.
Water 15 03722 g005
Figure 6. MODPATH simulation results are shown, with the purple lines indicating the main groundwater flow direction. (a) Without cutoff walls, groundwater flow directions are shown at various depths. Deeper groundwater infiltrates into the drainage area and is captured by the drainage wells, while shallower groundwater flows to the river and eventually downstream. (b) With the walls, groundwater flow directions are shown in different areas. Water from outside the drainage area has limited ability to infiltrate into the drainage area, except for a small amount near the cutoff wall.
Water 15 03722 g006
Figure 7. Effect of variation in clay layer cover on pumping rate.
Water 15 03722 g007
Figure 8. Influence of various factors on pumping results.
Water 15 03722 g008
Figure 9. Change in groundwater level over time.
Water 15 03722 g009
Table 1. Parameter’s ranges in the study area.
LithologyHydraulic Conductivity (m/d)Specific YieldStorage Coefficient
Horizontal (Kx = Ky)Vertical Anisotropy
Sandy conglomerate43.2–86.410.3–0.45-
Sandy clay0.432–4.32100.0035–0.060.01–0.1
Weathered bedrock0.00432–0.43210-0.001–0.002
Note: Vertical anisotropy equal to Horizontal Hydraulic conductivity (Kx)/Vertical Hydraulic conductivity (Kz).
Table 2. Rainfall infiltration intensity values for each zone.
Serial NumberInfiltration Intensity
(m/d)
Serial NumberInfiltration Intensity
(m/d)
R10.014R60.01
R20.0002R70.0001
R30.0005R80.002
R40.002R90.0035
R50.015R100.04
Table 3. Value of parameters used in the steady-state model.
ParametersUnitValue
Sandy ConglomerateSandy ClayWeathered Bedrock
HorizontalVertical AnisotropyHorizontalVertical AnisotropyHorizontalVertical Anisotropy
Km/d501110110
dm30
Crm2/d500
Notes: K is the hydraulic conductivity, d is the river width, and Cr is the river conductance.
Table 4. Different excavation dewatering scenarios and simulation results.
Scenarios No.CoverageStorage CoefficientHydraulic Conductivity (m/d)Specific YieldSingle Well Pumping (m3/d)Average Daily Water Pumping (m3)Amount of Water Pumped (m3)
11000.010.4320.003591018,200546,000
2 2 92018,400552,000
3 4.32 92518,500555,000
480 0.432 119023,800714,000
5 2 119323,860715,800
6 4.32 119523,900717,000
750 0.432 162532,500975,000
8 2 163532,700981,000
9 4.32 164532,900987,000
101000.040.432 102020,400612,000
11 2 103520,700621,000
12 4.32 104020,800624,000
1380 0.432 130026,000780,000
14 2 131526,300789,000
15 4.32 132026,400792,000
1650 0.432 169033,8001,014,000
17 2 171134,2201,026,600
18 4.32 171534,3001,029,000
191000.10.432 127025,400762,000
20 2 131026,200786,000
21 4.32 132526,500795,000
2280 0.432 150530,100903,000
23 2 156031,200936,000
24 4.32 157031,400942,000
2550 0.432 183036,6001,098,000
26 2 186037,2001,116,000
27 4.32 187037,4001,122,000
281000.014.320.0692518,500555,000
29 0.04 104020,800624,000
30 0.1 132026,400792,000
Disclaimer/Publisher’s Note: The statements, opinions and data contained in all publications are solely those of the individual author(s) and contributor(s) and not of MDPI and/or the editor(s). MDPI and/or the editor(s) disclaim responsibility for any injury to people or property resulting from any ideas, methods, instructions or products referred to in the content.