
Numerical Study on the Influence of Aquitard Layer Distribution and Permeability Parameters on Foundation Pit Dewatering


Abstract
:1. Introduction
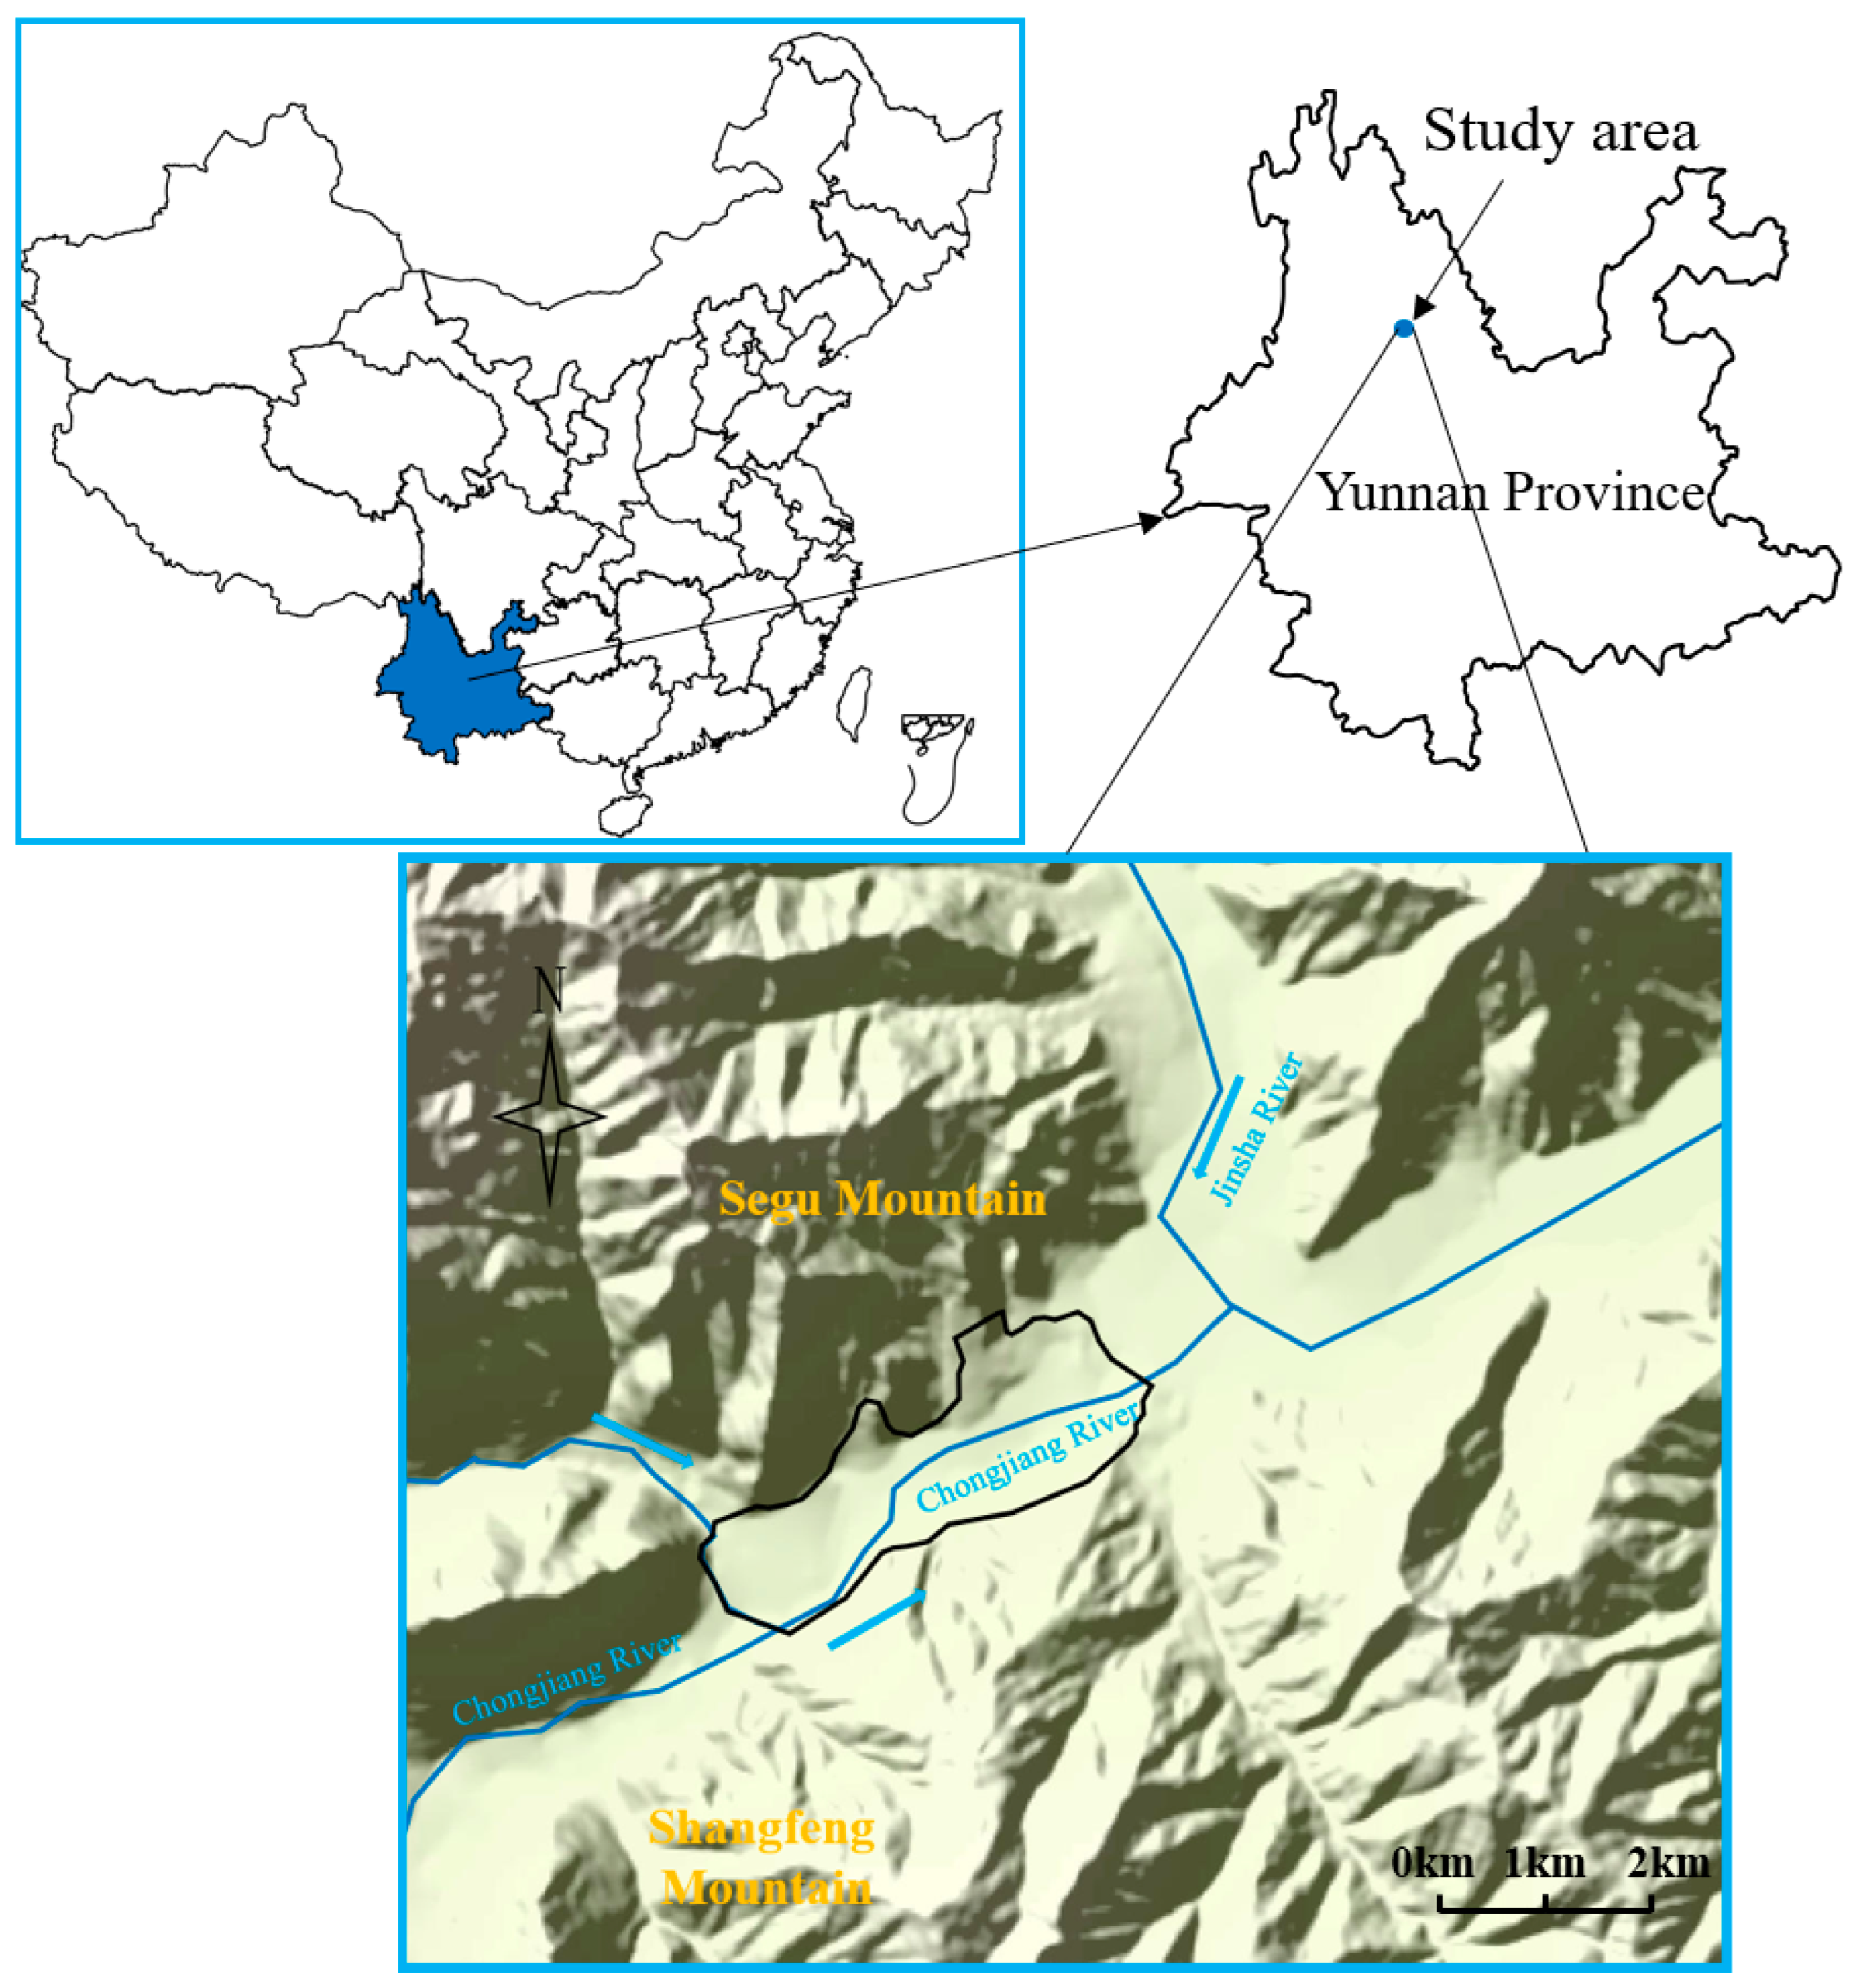
2. Study Area
3. Method
3.1. Mathematical Model
3.2. Modeling Approach
4. Numerical Simulation
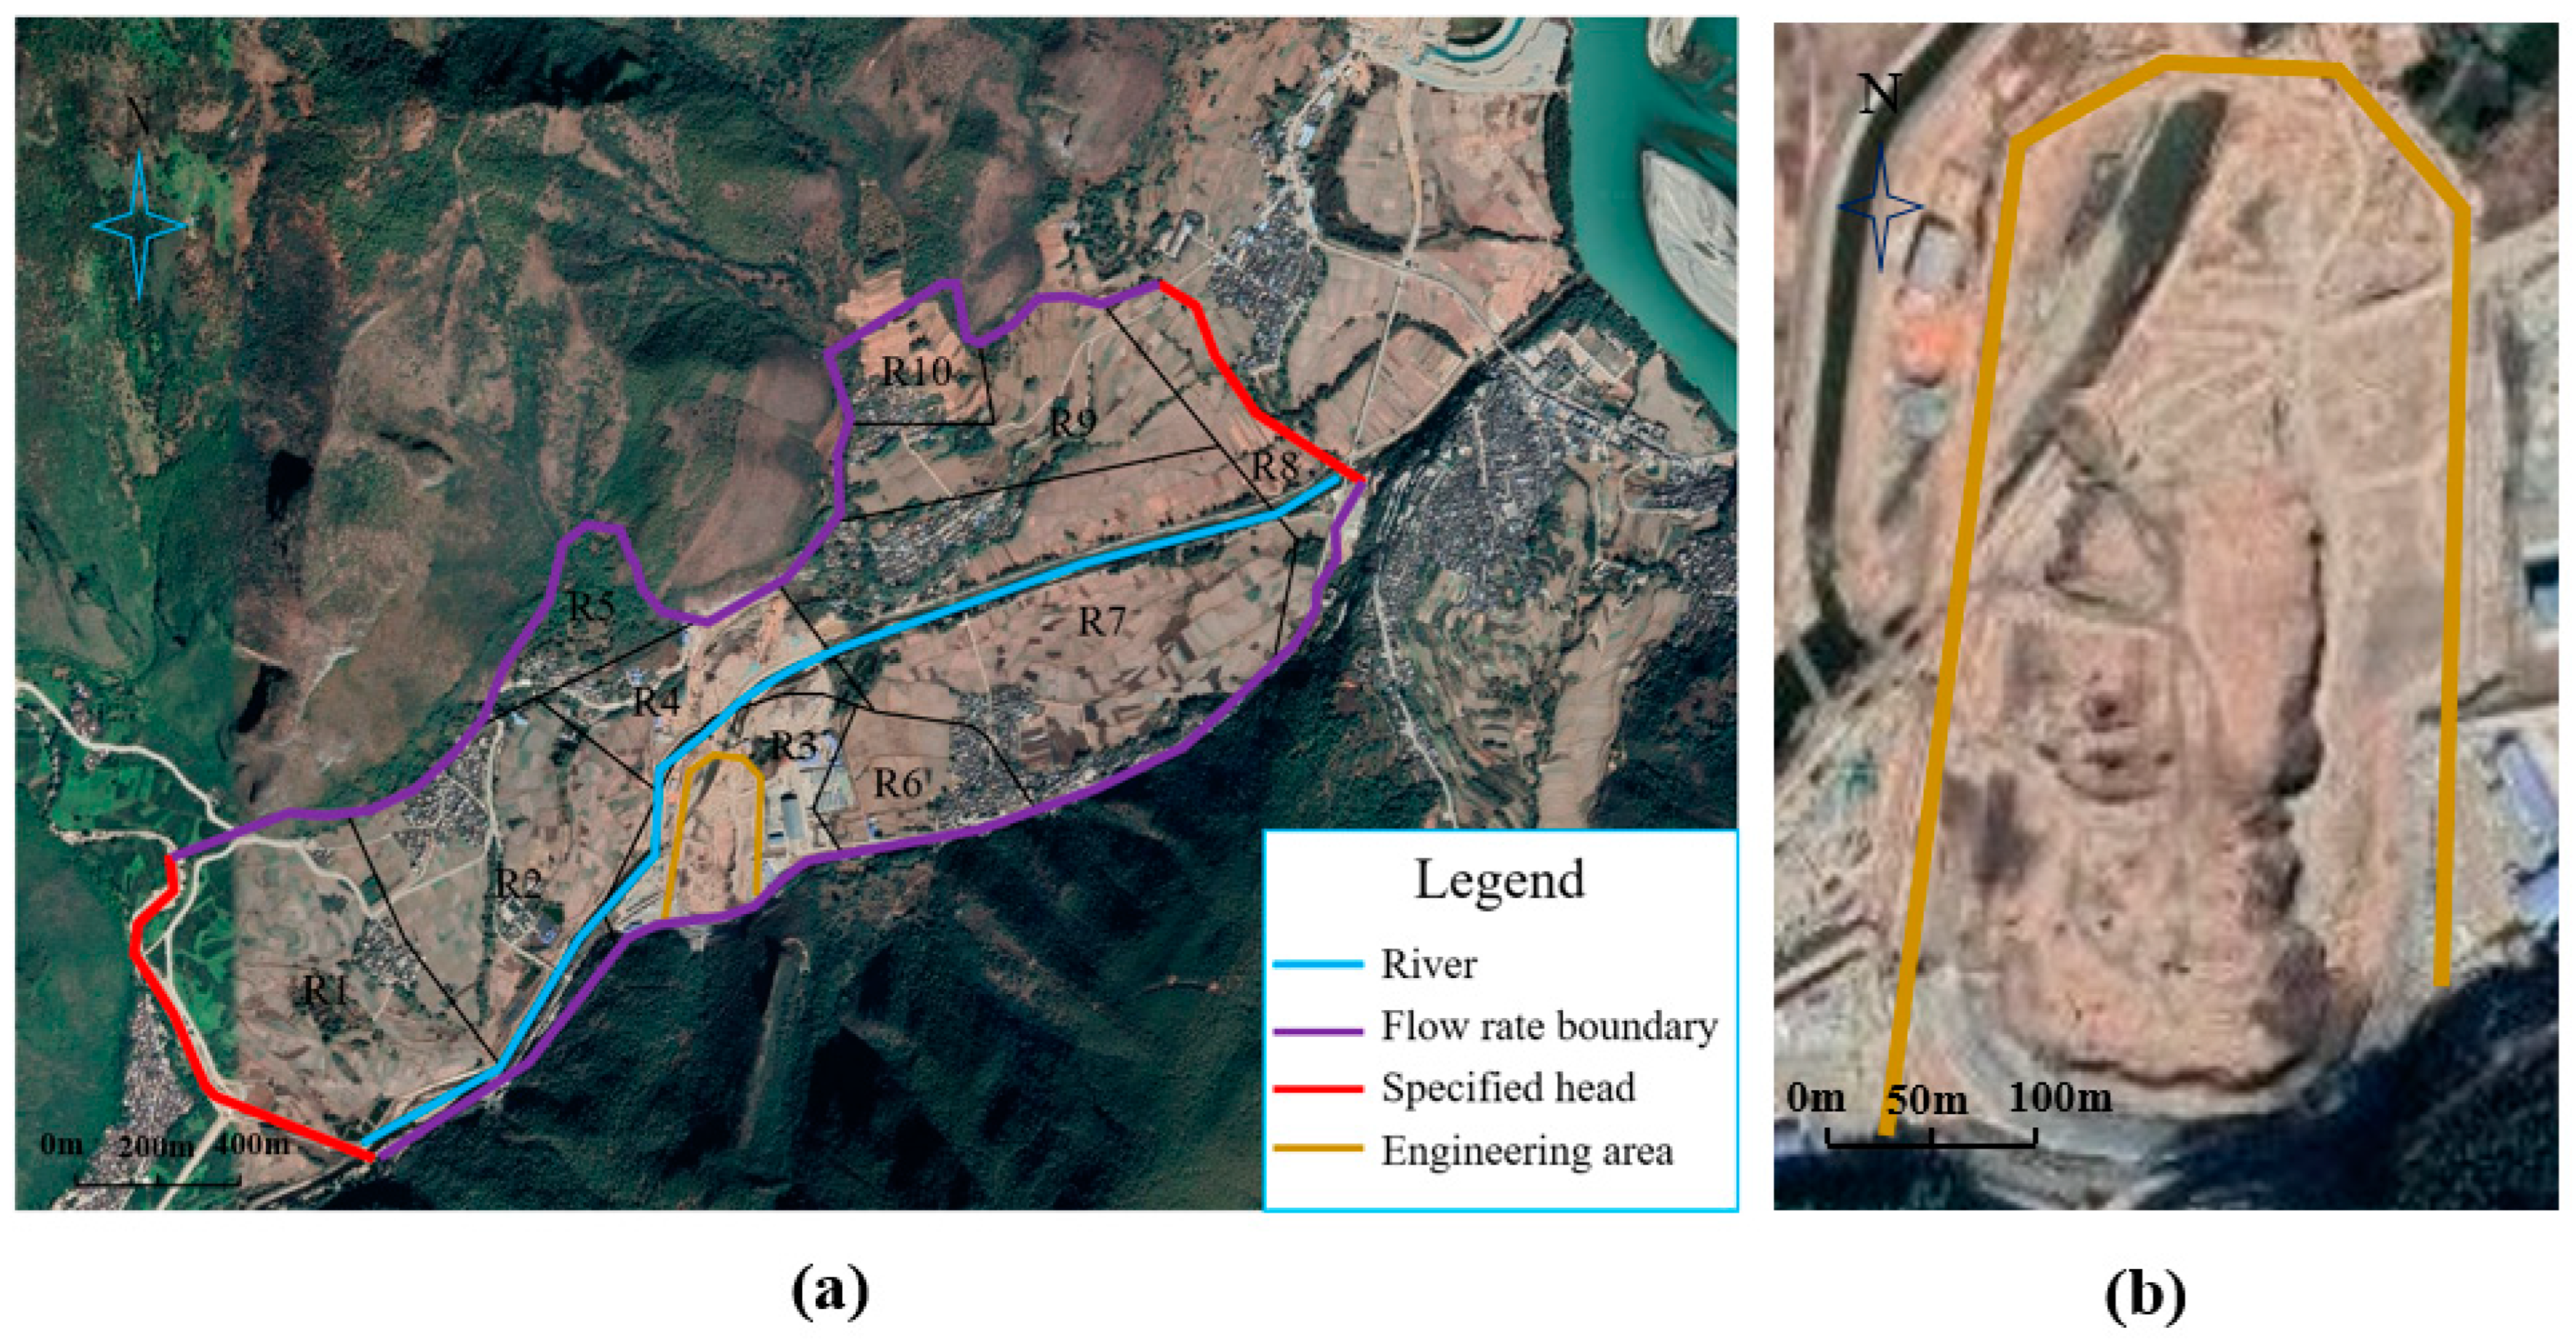
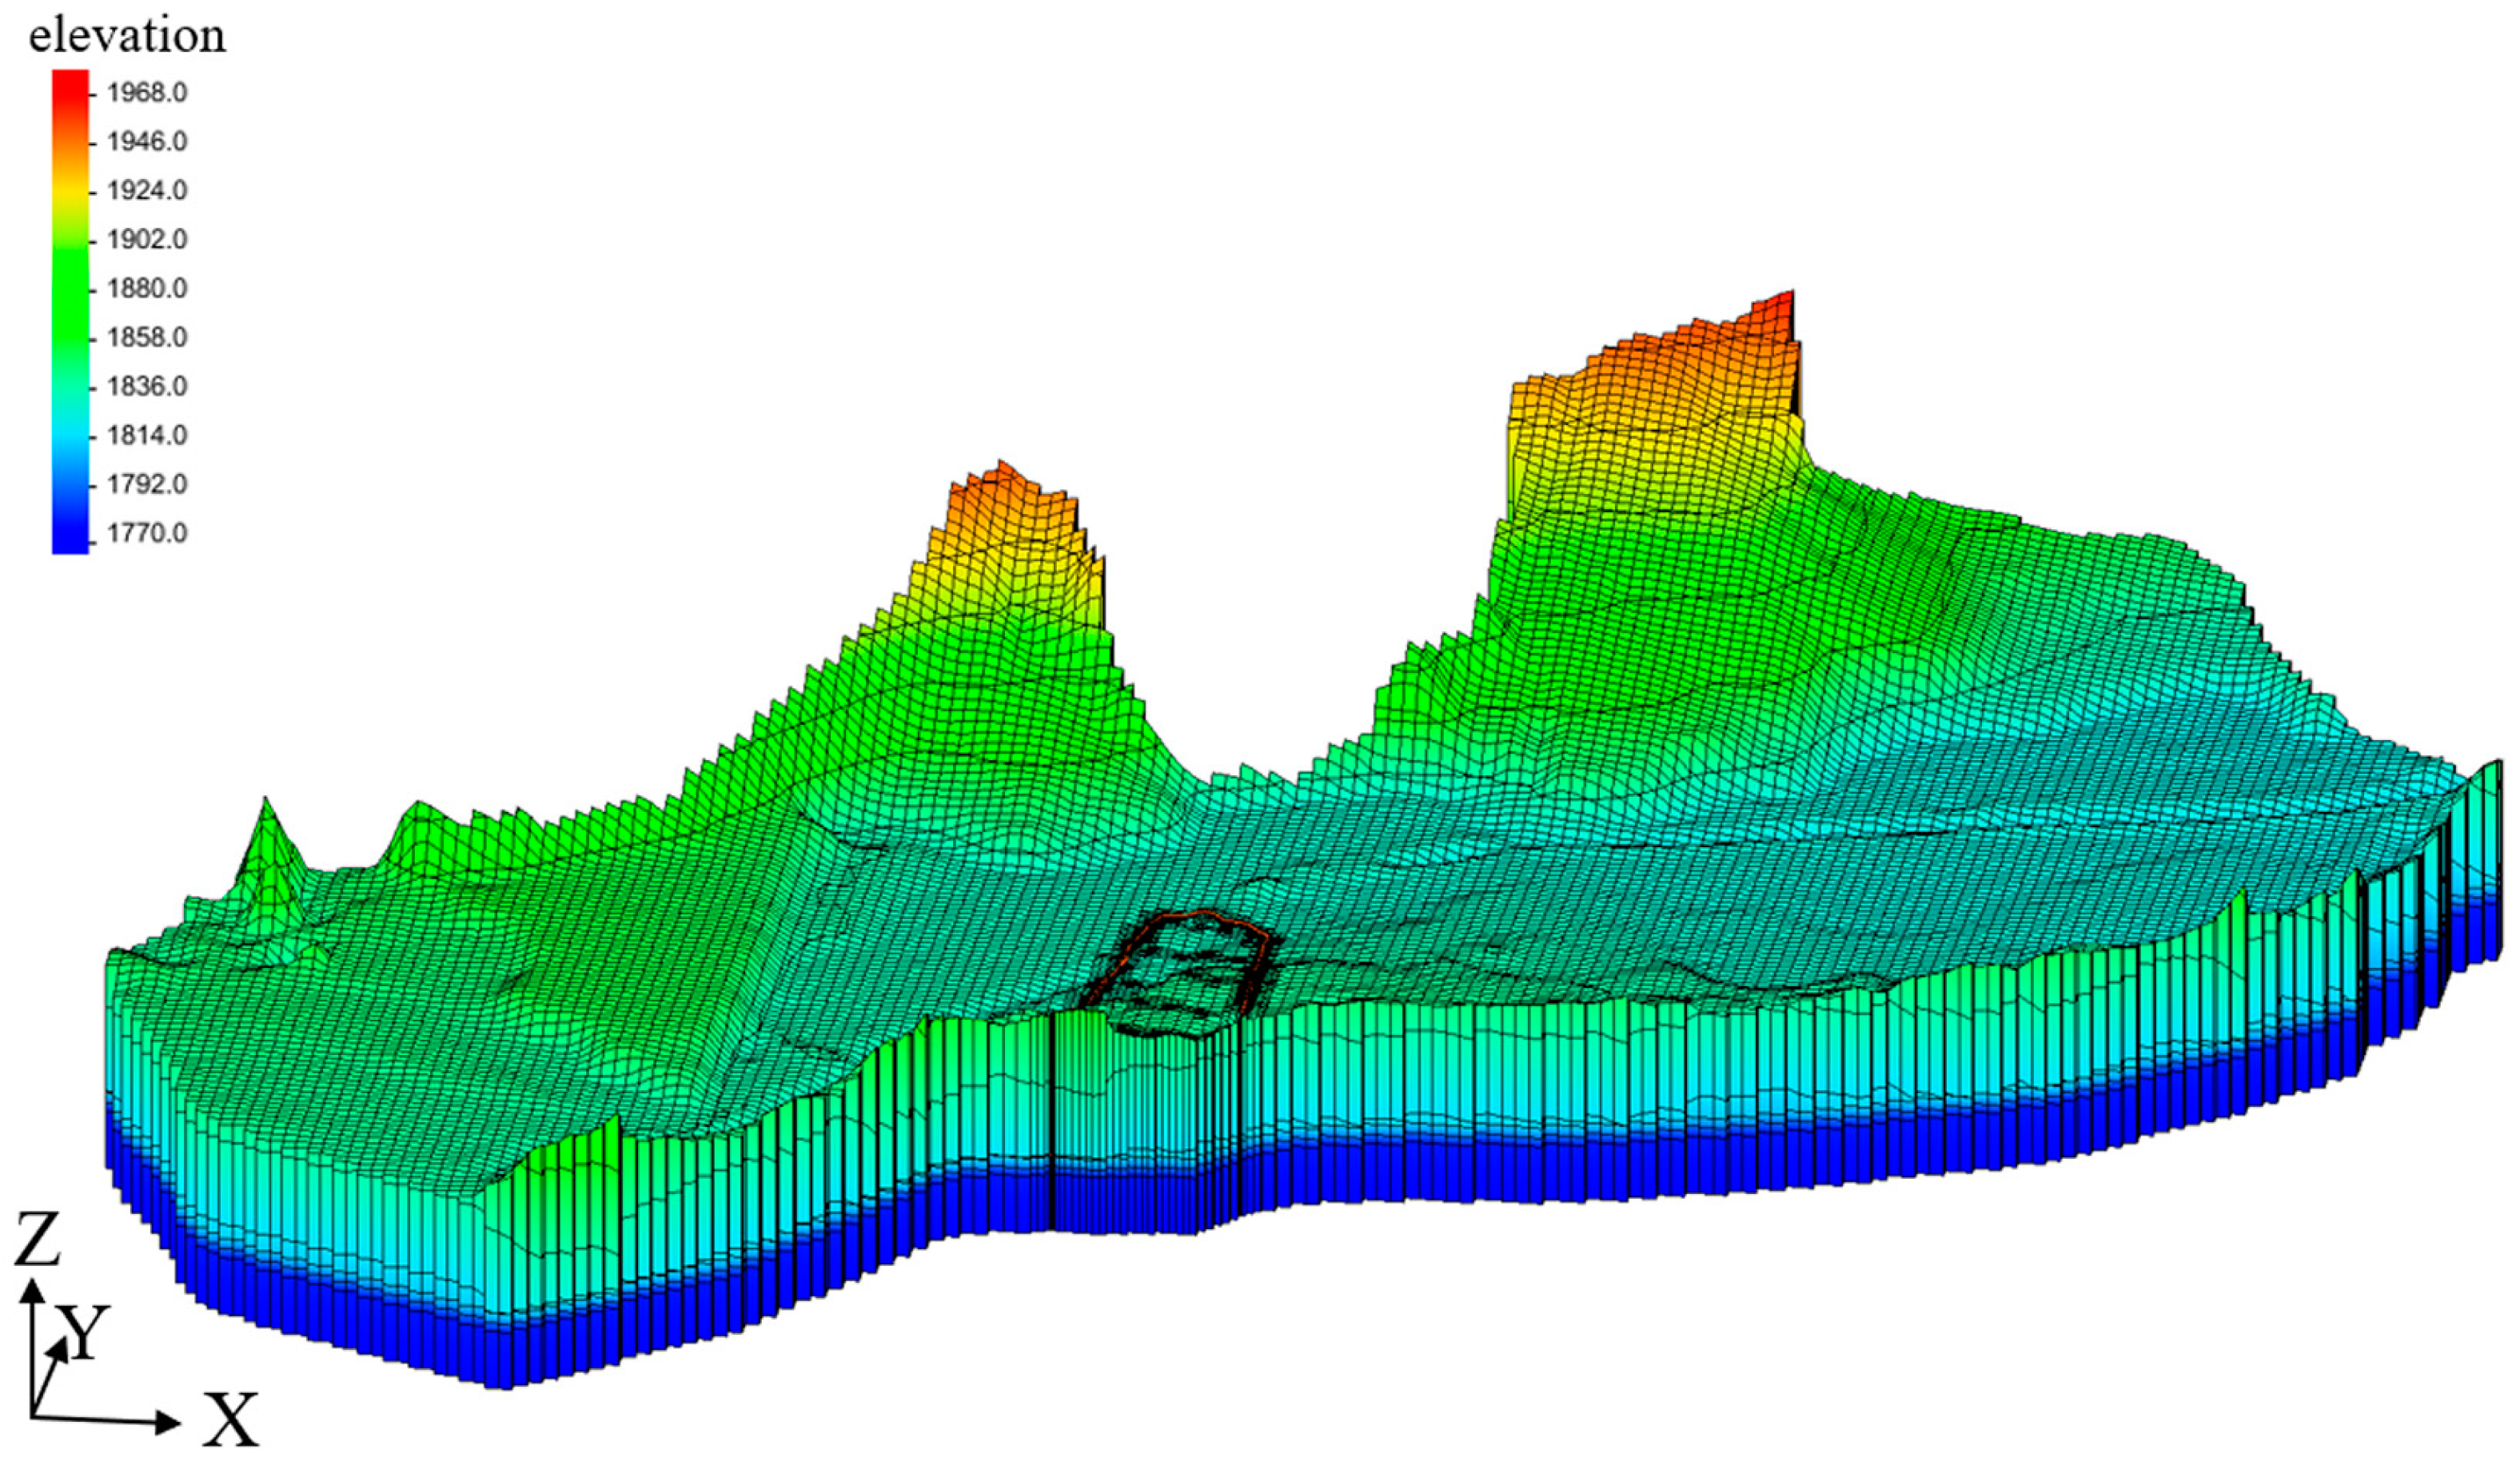
4.1. Model Construction
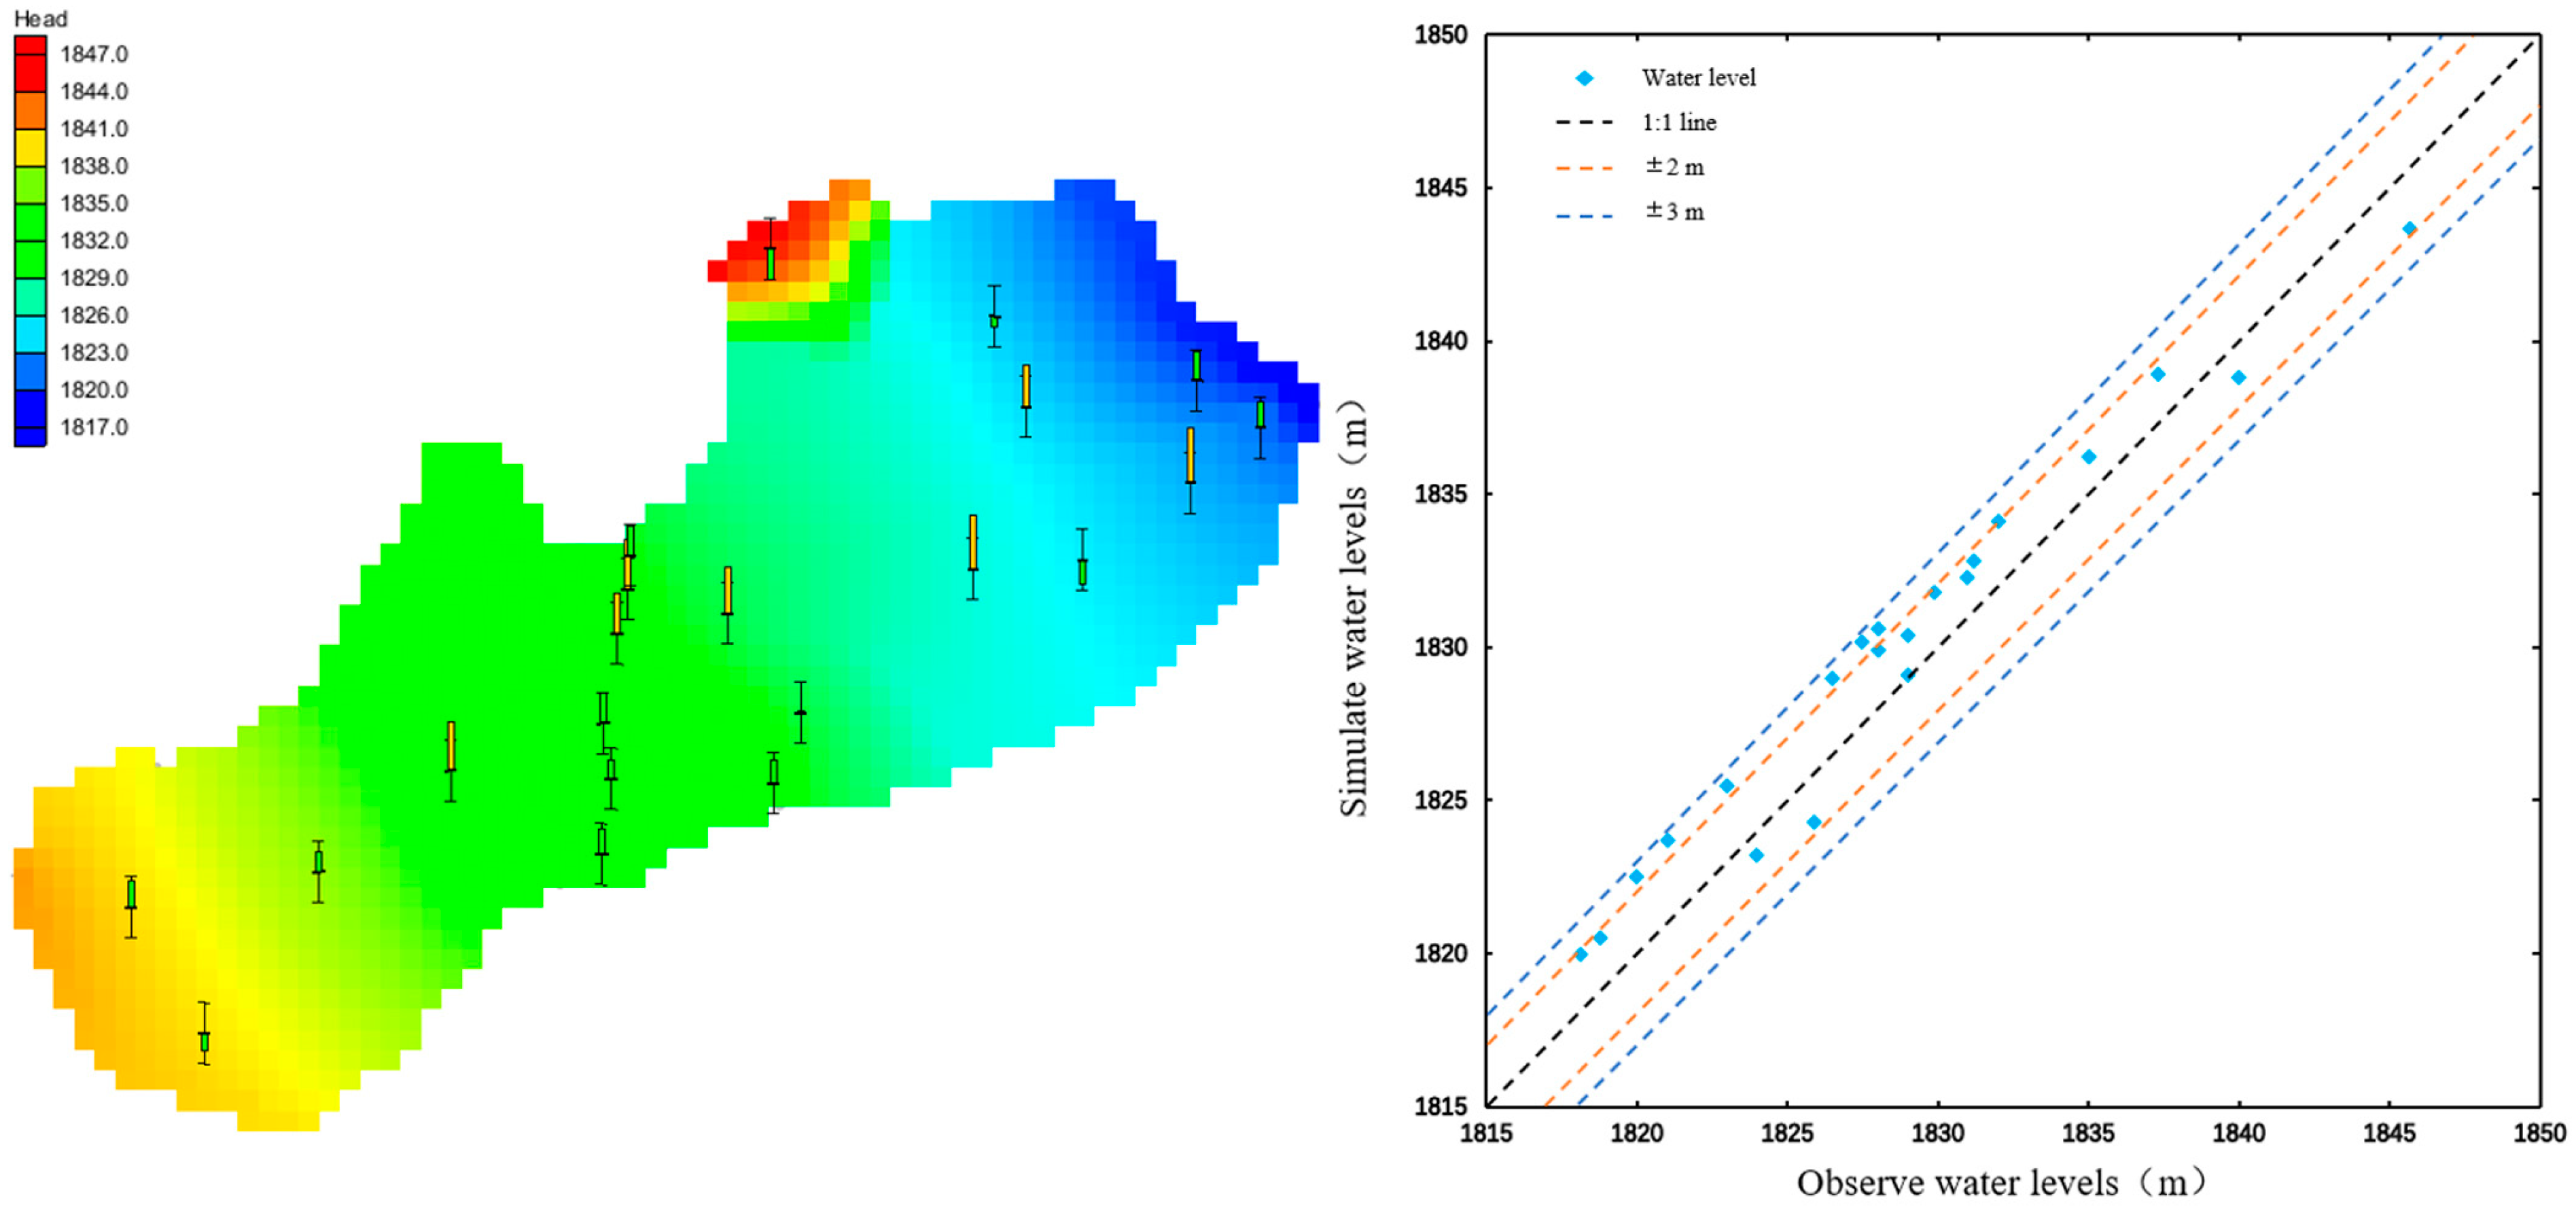
4.2. Model Calibration
4.3. Scenarios
5. Results and Discussion
5.1. Influence of Cutoff Walls
5.2. Influence of Clay Layer Cover on Drainage Effect
5.3. Simulation Results and Discussion
6. Conclusions
Author Contributions
Funding
Data Availability Statement
Acknowledgments
Conflicts of Interest
References
- Wang, J.; Deng, Y.; Wang, X.; Liu, X.; Zhou, N. Numerical evaluation of a 70-m deep hydropower station foundation pit dewatering. Environ. Earth Sci. 2022, 81, 364. [Google Scholar] [CrossRef]
- Zhang, X.; Wang, X.; Xu, Y. Influence of Filter Tube of Pumping Well on Groundwater Drawdown during Deep Foundation Pit Dewatering. Water 2021, 13, 3297. [Google Scholar] [CrossRef]
- Zeng, C.-F.; Xue, X.-L.; Li, M.-K. Use of cross wall to restrict enclosure movement during dewatering inside a metro pit before soil excavation. Tunn. Undergr. Space Technol. 2021, 112, 103909. [Google Scholar] [CrossRef]
- Wang, X.-w.; Xu, Y.-s. Impact of the depth of diaphragm wall on the groundwater drawdown during foundation dewatering considering anisotropic permeability of aquifer. Water 2021, 13, 418. [Google Scholar] [CrossRef]
- Ahmad, I.; Tayyab, M.; Zaman, M.; Anjum, M.N.; Dong, X. Finite-difference numerical simulation of dewatering system in a large deep foundation pit at Taunsa Barrage, Pakistan. Sustainability 2019, 11, 694. [Google Scholar] [CrossRef]
- Wang, J.; Huang, T.; Hu, J.; Wu, L.; Li, G.; Yang, P. Field experiments and numerical simulations of whirlpool foundation pit dewatering. Environ. Earth Sci. 2014, 71, 3245–3257. [Google Scholar] [CrossRef]
- Ma, Z.; Tang, S.; Yang, Z. Numerical analysis of metro station pit dewatering and its influence. Front. Earth Sci. 2023, 10, 1120772. [Google Scholar] [CrossRef]
- Lu, W.; Chen, Z.; Wu, R.; Zhang, Z. Numerical modeling of foundation pit dewatering based on Visual Modflow. In Proceedings of the IOP Conference Series: Earth and Environmental Science, Surakarta, Indonesia, 24–25 August 2021; p. 022003. [Google Scholar]
- Du, S.; Liu, P.; Wang, W.; Shi, W.; Li, Q.; Li, J.; Li, J. Numerical Simulation and Analysis of the Influencing Factors of Foundation Pit Dewatering under a Coupled Radial Well and Curtain. Water 2023, 15, 1839. [Google Scholar] [CrossRef]
- She, J. Dewatering control of foundation pit under the condition of failure of water-stop curtain. In Proceedings of the IOP Conference Series: Earth and Environmental Science, Surakarta, Indonesia, 24–25 August 2021; p. 012101. [Google Scholar]
- Wu, L. Design and Construction of Engineering Dewatering and Seepage Theory of Foundation Pit; People’s Communications Press: Beijing, China, 2003. [Google Scholar]
- Yang, K.; Xu, C.; Chi, M.; Wang, P. Analytical analysis of the groundwater drawdown difference induced by foundation pit dewatering with a suspended waterproof curtain. Appl. Sci. 2022, 12, 10301. [Google Scholar] [CrossRef]
- Wang, J.; Long, Y.; Zhao, Y.; Liu, X.; Pan, W.; Qu, J.; Wang, H.; Shi, Y. Numerical simulation of foundation pit dewatering using horizontal seepage reducing body. Sci. Rep. 2022, 12, 1397. [Google Scholar] [CrossRef]
- Wang, J.; Liu, X.; Wu, Y.; Liu, S.; Wu, L.; Lou, R.; Lu, J.; Yin, Y. Field experiment and numerical simulation of coupling non-Darcy flow caused by curtain and pumping well in foundation pit dewatering. J. Hydrol. 2017, 549, 277–293. [Google Scholar] [CrossRef]
- Liu, L.; Lei, M.; Cao, C.; Shi, C. Dewatering characteristics and inflow prediction of deep foundation pits with partial penetrating curtains in sand and gravel strata. Water 2019, 11, 2182. [Google Scholar] [CrossRef]
- Mao, X. Application of new pumping technology in dewatering in deep soft soil pit. In Proceedings of the IOP Conference Series: Earth and Environmental Science, Surakarta, Indonesia, 24–25 August 2021; p. 012083. [Google Scholar]
- Wang, J.; Liu, X.; Liu, S.; Zhu, Y.; Pan, W.; Zhou, J. Physical model test of transparent soil on coupling effect of cut-off wall and pumping wells during foundation pit dewatering. Acta Geotech. 2019, 14, 141–162. [Google Scholar] [CrossRef]
- Li, D.; Ma, J.; Wang, C.; Gao, X.; Fang, M. A New Method for Piping Risk Evaluation on Unconfined Aquifers under Dewatering of Deep Foundation Pits. KSCE J. Civ. Eng. 2022, 26, 3275–3286. [Google Scholar] [CrossRef]
- Chen, Z.; Huang, J.; Zhan, H.; Wang, J.; Dou, Z.; Zhang, C.; Chen, C.; Fu, Y. Optimization schemes for deep foundation pit dewatering under complicated hydrogeological conditions using MODFLOW-USG. Eng. Geol. 2022, 303, 106653. [Google Scholar] [CrossRef]
- Liu, N.-W.; Peng, C.-X.; Li, M.-G.; Chen, J.-J. Hydro-mechanical behavior of a deep excavation with dewatering and recharge in soft deposits. Eng. Geol. 2022, 307, 106780. [Google Scholar] [CrossRef]
- Irfan, M.; Akbar, A.; Aziz, M.; Khan, A.H. A parametric study on stability of open excavations in alluvial soils of Lahore district, Pakistan. Geotech. Geol. Eng. 2013, 31, 729–738. [Google Scholar] [CrossRef]
- Gallikova, Z.; ur Rehman, Z. Appraisal of the hypoplastic model for the numerical prediction of high-rise building settlement in Neogene clay based on real-scale monitoring data. J. Build. Eng. 2022, 50, 104152. [Google Scholar] [CrossRef]
- Bear, J. Dynamics of Fluids in Porous Media; Dover Publications, Incorporated: New York, NY, USA, 1972. [Google Scholar]
- Neuman, S.P. Adaptive Eulerian-Lagrangian finite element method for advection-dispersion. Numer. Method Eng. 1984, 20, 321–337. [Google Scholar] [CrossRef]
- Aquaveo Groundwater Modeling System (GMS, v.10), Aquaveo: Provo, UT, USA, 2014.
- Panday, S.; Langevin, C.D.; Niswonger, R.G.; Ibaraki, M.; Hughes, J.D. MODFLOW–USG Version 1: An Unstructured Grid Version of MODFLOW for Simulating Groundwater Flow and Tightly Coupled Processes Using a Control Volume Finite-Difference Formulation; Report 6-A45; US Geological Survey: Reston, VA, USA, 2013.
- Krcmár, D.; Sracek, O. MODFLOW-USG: The New Possibilities in Mine Hydrogeology Modelling (or What is Not Written in the Manuals). Mine Water Environ. 2014, 33, 376–383. [Google Scholar] [CrossRef]
- Duran, L.; Gill, L. Modeling spring flow of an Irish karst catchment using Modflow-USG with CLN. J. Hydrol. 2021, 597, 125971. [Google Scholar] [CrossRef]
- Pollock, D.W. User guide for MODPATH Version 6: A Particle Tracking Model for MODFLOW; US Geological Survey: Reston, VA, USA, 2012.
- Miller, R. User’s Guide for Riv2—A Package for Routing and Accounting of River Discharge for a Modular, Ground-Water Flow Model; US Geological Survey: Reston, VA, USA, 1988.

| Lithology | Hydraulic Conductivity (m/d) | Specific Yield | Storage Coefficient | |
|---|---|---|---|---|
| Horizontal (Kx = Ky) | Vertical Anisotropy | |||
| Sandy conglomerate | 43.2–86.4 | 1 | 0.3–0.45 | - |
| Sandy clay | 0.432–4.32 | 10 | 0.0035–0.06 | 0.01–0.1 |
| Weathered bedrock | 0.00432–0.432 | 10 | - | 0.001–0.002 |
| Serial Number | Infiltration Intensity (m/d) | Serial Number | Infiltration Intensity (m/d) |
|---|---|---|---|
| R1 | 0.014 | R6 | 0.01 |
| R2 | 0.0002 | R7 | 0.0001 |
| R3 | 0.0005 | R8 | 0.002 |
| R4 | 0.002 | R9 | 0.0035 |
| R5 | 0.015 | R10 | 0.04 |
| Parameters | Unit | Value | |||||
|---|---|---|---|---|---|---|---|
| Sandy Conglomerate | Sandy Clay | Weathered Bedrock | |||||
| Horizontal | Vertical Anisotropy | Horizontal | Vertical Anisotropy | Horizontal | Vertical Anisotropy | ||
| K | m/d | 50 | 1 | 1 | 10 | 1 | 10 |
| d | m | 30 | |||||
| Cr | m2/d | 500 | |||||
| Scenarios No. | Coverage | Storage Coefficient | Hydraulic Conductivity (m/d) | Specific Yield | Single Well Pumping (m3/d) | Average Daily Water Pumping (m3) | Amount of Water Pumped (m3) |
|---|---|---|---|---|---|---|---|
| 1 | 100 | 0.01 | 0.432 | 0.0035 | 910 | 18,200 | 546,000 |
| 2 | 2 | 920 | 18,400 | 552,000 | |||
| 3 | 4.32 | 925 | 18,500 | 555,000 | |||
| 4 | 80 | 0.432 | 1190 | 23,800 | 714,000 | ||
| 5 | 2 | 1193 | 23,860 | 715,800 | |||
| 6 | 4.32 | 1195 | 23,900 | 717,000 | |||
| 7 | 50 | 0.432 | 1625 | 32,500 | 975,000 | ||
| 8 | 2 | 1635 | 32,700 | 981,000 | |||
| 9 | 4.32 | 1645 | 32,900 | 987,000 | |||
| 10 | 100 | 0.04 | 0.432 | 1020 | 20,400 | 612,000 | |
| 11 | 2 | 1035 | 20,700 | 621,000 | |||
| 12 | 4.32 | 1040 | 20,800 | 624,000 | |||
| 13 | 80 | 0.432 | 1300 | 26,000 | 780,000 | ||
| 14 | 2 | 1315 | 26,300 | 789,000 | |||
| 15 | 4.32 | 1320 | 26,400 | 792,000 | |||
| 16 | 50 | 0.432 | 1690 | 33,800 | 1,014,000 | ||
| 17 | 2 | 1711 | 34,220 | 1,026,600 | |||
| 18 | 4.32 | 1715 | 34,300 | 1,029,000 | |||
| 19 | 100 | 0.1 | 0.432 | 1270 | 25,400 | 762,000 | |
| 20 | 2 | 1310 | 26,200 | 786,000 | |||
| 21 | 4.32 | 1325 | 26,500 | 795,000 | |||
| 22 | 80 | 0.432 | 1505 | 30,100 | 903,000 | ||
| 23 | 2 | 1560 | 31,200 | 936,000 | |||
| 24 | 4.32 | 1570 | 31,400 | 942,000 | |||
| 25 | 50 | 0.432 | 1830 | 36,600 | 1,098,000 | ||
| 26 | 2 | 1860 | 37,200 | 1,116,000 | |||
| 27 | 4.32 | 1870 | 37,400 | 1,122,000 | |||
| 28 | 100 | 0.01 | 4.32 | 0.06 | 925 | 18,500 | 555,000 |
| 29 | 0.04 | 1040 | 20,800 | 624,000 | |||
| 30 | 0.1 | 1320 | 26,400 | 792,000 |
Disclaimer/Publisher’s Note: The statements, opinions and data contained in all publications are solely those of the individual author(s) and contributor(s) and not of MDPI and/or the editor(s). MDPI and/or the editor(s) disclaim responsibility for any injury to people or property resulting from any ideas, methods, instructions or products referred to in the content. |
© 2023 by the authors. Licensee MDPI, Basel, Switzerland. This article is an open access article distributed under the terms and conditions of the Creative Commons Attribution (CC BY) license (https://creativecommons.org/licenses/by/4.0/).
Share and Cite
Wang, J.; Ma, Z.; Zeng, J.; Chen, Z.; Li, G. Numerical Study on the Influence of Aquitard Layer Distribution and Permeability Parameters on Foundation Pit Dewatering. Water 2023, 15, 3722. https://doi.org/10.3390/w15213722
Wang J, Ma Z, Zeng J, Chen Z, Li G. Numerical Study on the Influence of Aquitard Layer Distribution and Permeability Parameters on Foundation Pit Dewatering. Water. 2023; 15(21):3722. https://doi.org/10.3390/w15213722
Chicago/Turabian StyleWang, Jinguo, Zhiheng Ma, Jiale Zeng, Zhou Chen, and Guoqing Li. 2023. "Numerical Study on the Influence of Aquitard Layer Distribution and Permeability Parameters on Foundation Pit Dewatering" Water 15, no. 21: 3722. https://doi.org/10.3390/w15213722
APA StyleWang, J., Ma, Z., Zeng, J., Chen, Z., & Li, G. (2023). Numerical Study on the Influence of Aquitard Layer Distribution and Permeability Parameters on Foundation Pit Dewatering. Water, 15(21), 3722. https://doi.org/10.3390/w15213722