Article

Evolution Characteristics of Long Time Series of Secondary Perched River in Typical Reaches of the Lower Yellow River

1
School of Water Conservancy, North China University of Water Resources and Electric Power, Zhengzhou 450046, China
2
Key Laboratory of Lower Yellow River Channel and Estuary Regulation, MWR, Yellow River Institute of Hydraulic Research, YRCC, Zhengzhou 450003, China
3
School of Civil Engineering, Henan Polytechnic University, Jiaozuo 454000, China
4
School of Water Resources and Transportation, Zhengzhou University, Zhengzhou 450003, China
*
Author to whom correspondence should be addressed.
Water 2023, 15(20), 3674; https://doi.org/10.3390/w15203674
Submission received: 19 September 2023 / Revised: 9 October 2023 / Accepted: 18 October 2023 / Published: 20 October 2023
(This article belongs to the Special Issue River Sedimentary Processes and Modelling)

Abstract

:
Secondary perched rivers are extensively distributed in the lower section of the Yellow River, and their condition is grave, representing a significant peril to the flood control safety of this region. Consequently, conducting an analysis of their evolution characteristics holds immense engineering importance for ensuring the flood control safety of the lower reaches of the Yellow River. This study focuses on the downstream section of the Yellow River, specifically from Dongbatou-Taochengpu. This research is based on extensive data, including topographic measurements of large cross-sections and water and sand data from Huayuankou spanning from 1960 to 2022. The transverse slope of the beach, which indicates the level of development of the secondary perched rivers, was chosen as the calculation index. To analyze the trend and mutation of the transverse slope, statistical methods such as the Theil–Sen slope estimation, Mann–Kendall test, Pettitt test, and double cumulative curve method were employed. The findings indicate that the average transverse slope along the wandering section (Dongbatou-Gaocun) is 5.81‱, is significantly lower compared to the transitional section (Gaocun-Taochengpu), with an average transverse slope of 8.89‱. Furthermore, the range of fluctuation in the variation in the transverse slope along the wandering section (3.19–8.18‱) is considerably narrower than that observed in the transitional section (2.94–19.51‱). Prior to the implementation of Xiaolangdi, there was a significant increase in the transverse slope. Notably, the transitional section experienced a sudden change in 1975, while the wandering section experienced a sudden change in 1990. The abrupt alteration in the transitional section can be attributed to the substantial variation in the water and sand conditions. Conversely, the sudden change in the wandering section resulted from the insufficient flow rate of the flat beach. However, following the implementation of Xiaolangdi, the rapid increase in the transverse slope was effectively mitigated.

1. Introduction

The Yellow River has less water and more sediment; the relationship between water and sediment is not coordinated [1]. The Lower Yellow River has less water because of its long-term siltation [2], but also because of the formation of the world-famous perched river [3,4]. Since 1986, due to the decrease in rainfall, the joint application of Sanmenxia in the middle reaches and the Longyangxia and Liujiaxia reservoirs in the upper reaches, as well as the increase in water use for industry and agriculture along the coast, etc., which led to the obvious change in downstream water and sediment conditions, the Lower Yellow River’s water and sediment have become extremely uncoordinated [5]. Coupled with the influence of the production embankment [6], the Lower Yellow River has gradually formed a secondary perched river (Figure 1), which is characterized by the following features: “high channel, low beach, lower levee root”. The unfavorable channel morphology of the secondary perched river is prone to the formation of the “Heng River, Xie River, and Gun River”, which increases the chances of flooding along the levee and exposes the levee to the risk of overtopping and breaching. When a rolling river occurs, it is necessary to carry out river training again. In this context, the study of the evolution characteristics of the secondary perched river is of great engineering significance for the flood control safety of the Lower Yellow River.
Sediment is the crux of the problem of the secondary perched river. A large number of workers in the Yellow River Control have analyzed the development process of the secondary perched river and the influencing factors of the changes in the secondary perched river from the two aspects of the water–sediment relationship and boundary conditions. For example, Yang Jishan [7] studied the development process of the secondary perched river under different water and sediment conditions in different time periods and pointed out that the production embankment has a facilitating effect on the development of the secondary perched river; Jiang Enhui [8] divided the development of the secondary perched river into three stages: initial formation, slow change, and rapid development, and pointed out that the main reason for the formation of the secondary perched river is the long-term unfavorable water–sediment combination as well as the high sediment content floods, and the construction of the river improvement project is not the main influencing factor for the formation of the secondary perched river. When the river is flooded, the water and sediment exchange in the channel is frequent, especially when the flood has a high sediment content. The siltation mode of the river channel is mostly “silt beach and scouring channel” [9], and under the goal of “maintaining the healthy life of the Yellow River” [10], one of the aspects that reflects the ultimate goal is to maintain the riverbed as not being raised, and the “silt beach and brush channel” siltation mode is conducive to increasing the flow of the main channel. In the case of the siltation and shrinkage of the main channel, the pattern of “siltation beach and scouring channel” is conducive to increasing the bank-full discharge of the main channel and improving the sediment transport capacity of the main channel. After the operation of Xiaolangdi, the chance of overbank flooding in the Lower Yellow River is significantly reduced. The sediment transfer capacity of the main channel is increased through water and sediment transfer, which shapes the cross-section pattern of the main channel with a larger flooding capacity, and the bank-full discharge of the Gaocun cross-section of the flat beach is increased from 2000 m3/s before the flood in 2002 to 6650 m3/s after the flood in 2022. Floodwaters generally do not roam the beach, because the beach siltation is comparably small and the development of the secondary perched river has been curbed. However, with the continuous accumulation of the time of use of Xiaolangdi, the adequate reservoir capacity gradually declined, and the problem of insufficient follow-up power was highlighted [11]. The secondary perched river has been formed, and with the increased frequency of extreme weather around the globe, the existing secondary perched river is still a major threat to flood control.
The secondary perched river threatens the flood control safety in the Lower Yellow River with far-reaching hazards. The formation of the existing secondary perched river has taken over half a century. The related research on the sediment problem in the Lower Yellow River has been successful, such as the study on the evolution of the long time series of water and sediment fluxes in the Lower Yellow River [12,13]; the modeling of the bank-full discharge driving response [14] and the study of the cycle evolution pattern [15]; and the study of the water–sediment exchange pattern [16] and the water–sediment regulation model of the beach channel for the flooding of the bank [17,18]. Most studies on the morphology of the river cross-section are about the adjustment of the main channel [19], and most of the studies on the morphology of the beach are about the stage changes across time [20]. Continuous long-time series evolution studies are yet to be common, and long-time series analysis can be an excellent way to determine the characteristics of the variable changes, trends, and development patterns, and is widely used in climate and hydrological analysis [21,22]. The linear tendency approach can be employed to identify major changes in the trend of a sequence. The Theil–Sen estimator is a commonly employed technique in nonparametric statistics due to its robustness against outliers and its superior accuracy compared to basic linear regression [23]. The Mann–Kendall (M–K) test [24] and Pettitt test [25] were among the initial methods used for climate diagnosis and prediction. These tests are capable of identifying any changes or mutations in a given time series and may also establish the specific moment at which such mutations happened. The double cumulative curve is a frequently employed technique for assessing the coherence and variability of the correlation between two parameters. This article serves the purpose of doing additional assessments on the precision of mutation spots. Based on this, this paper systematically organizes the measured large cross-section topographic data and the incoming water and sediment data from Huayuankou in the Lower Yellow River section of Dongbatou-Taochengpu from 1960 to 2022. It utilizes the methods of linear regression, the M–K test, Pettitt’s test, double cumulative curves, etc., to reveal the evolution of the transverse slope in terms of the trend and mutations in the development of the time series.

2. Materials and Methods

2.1. Study Area

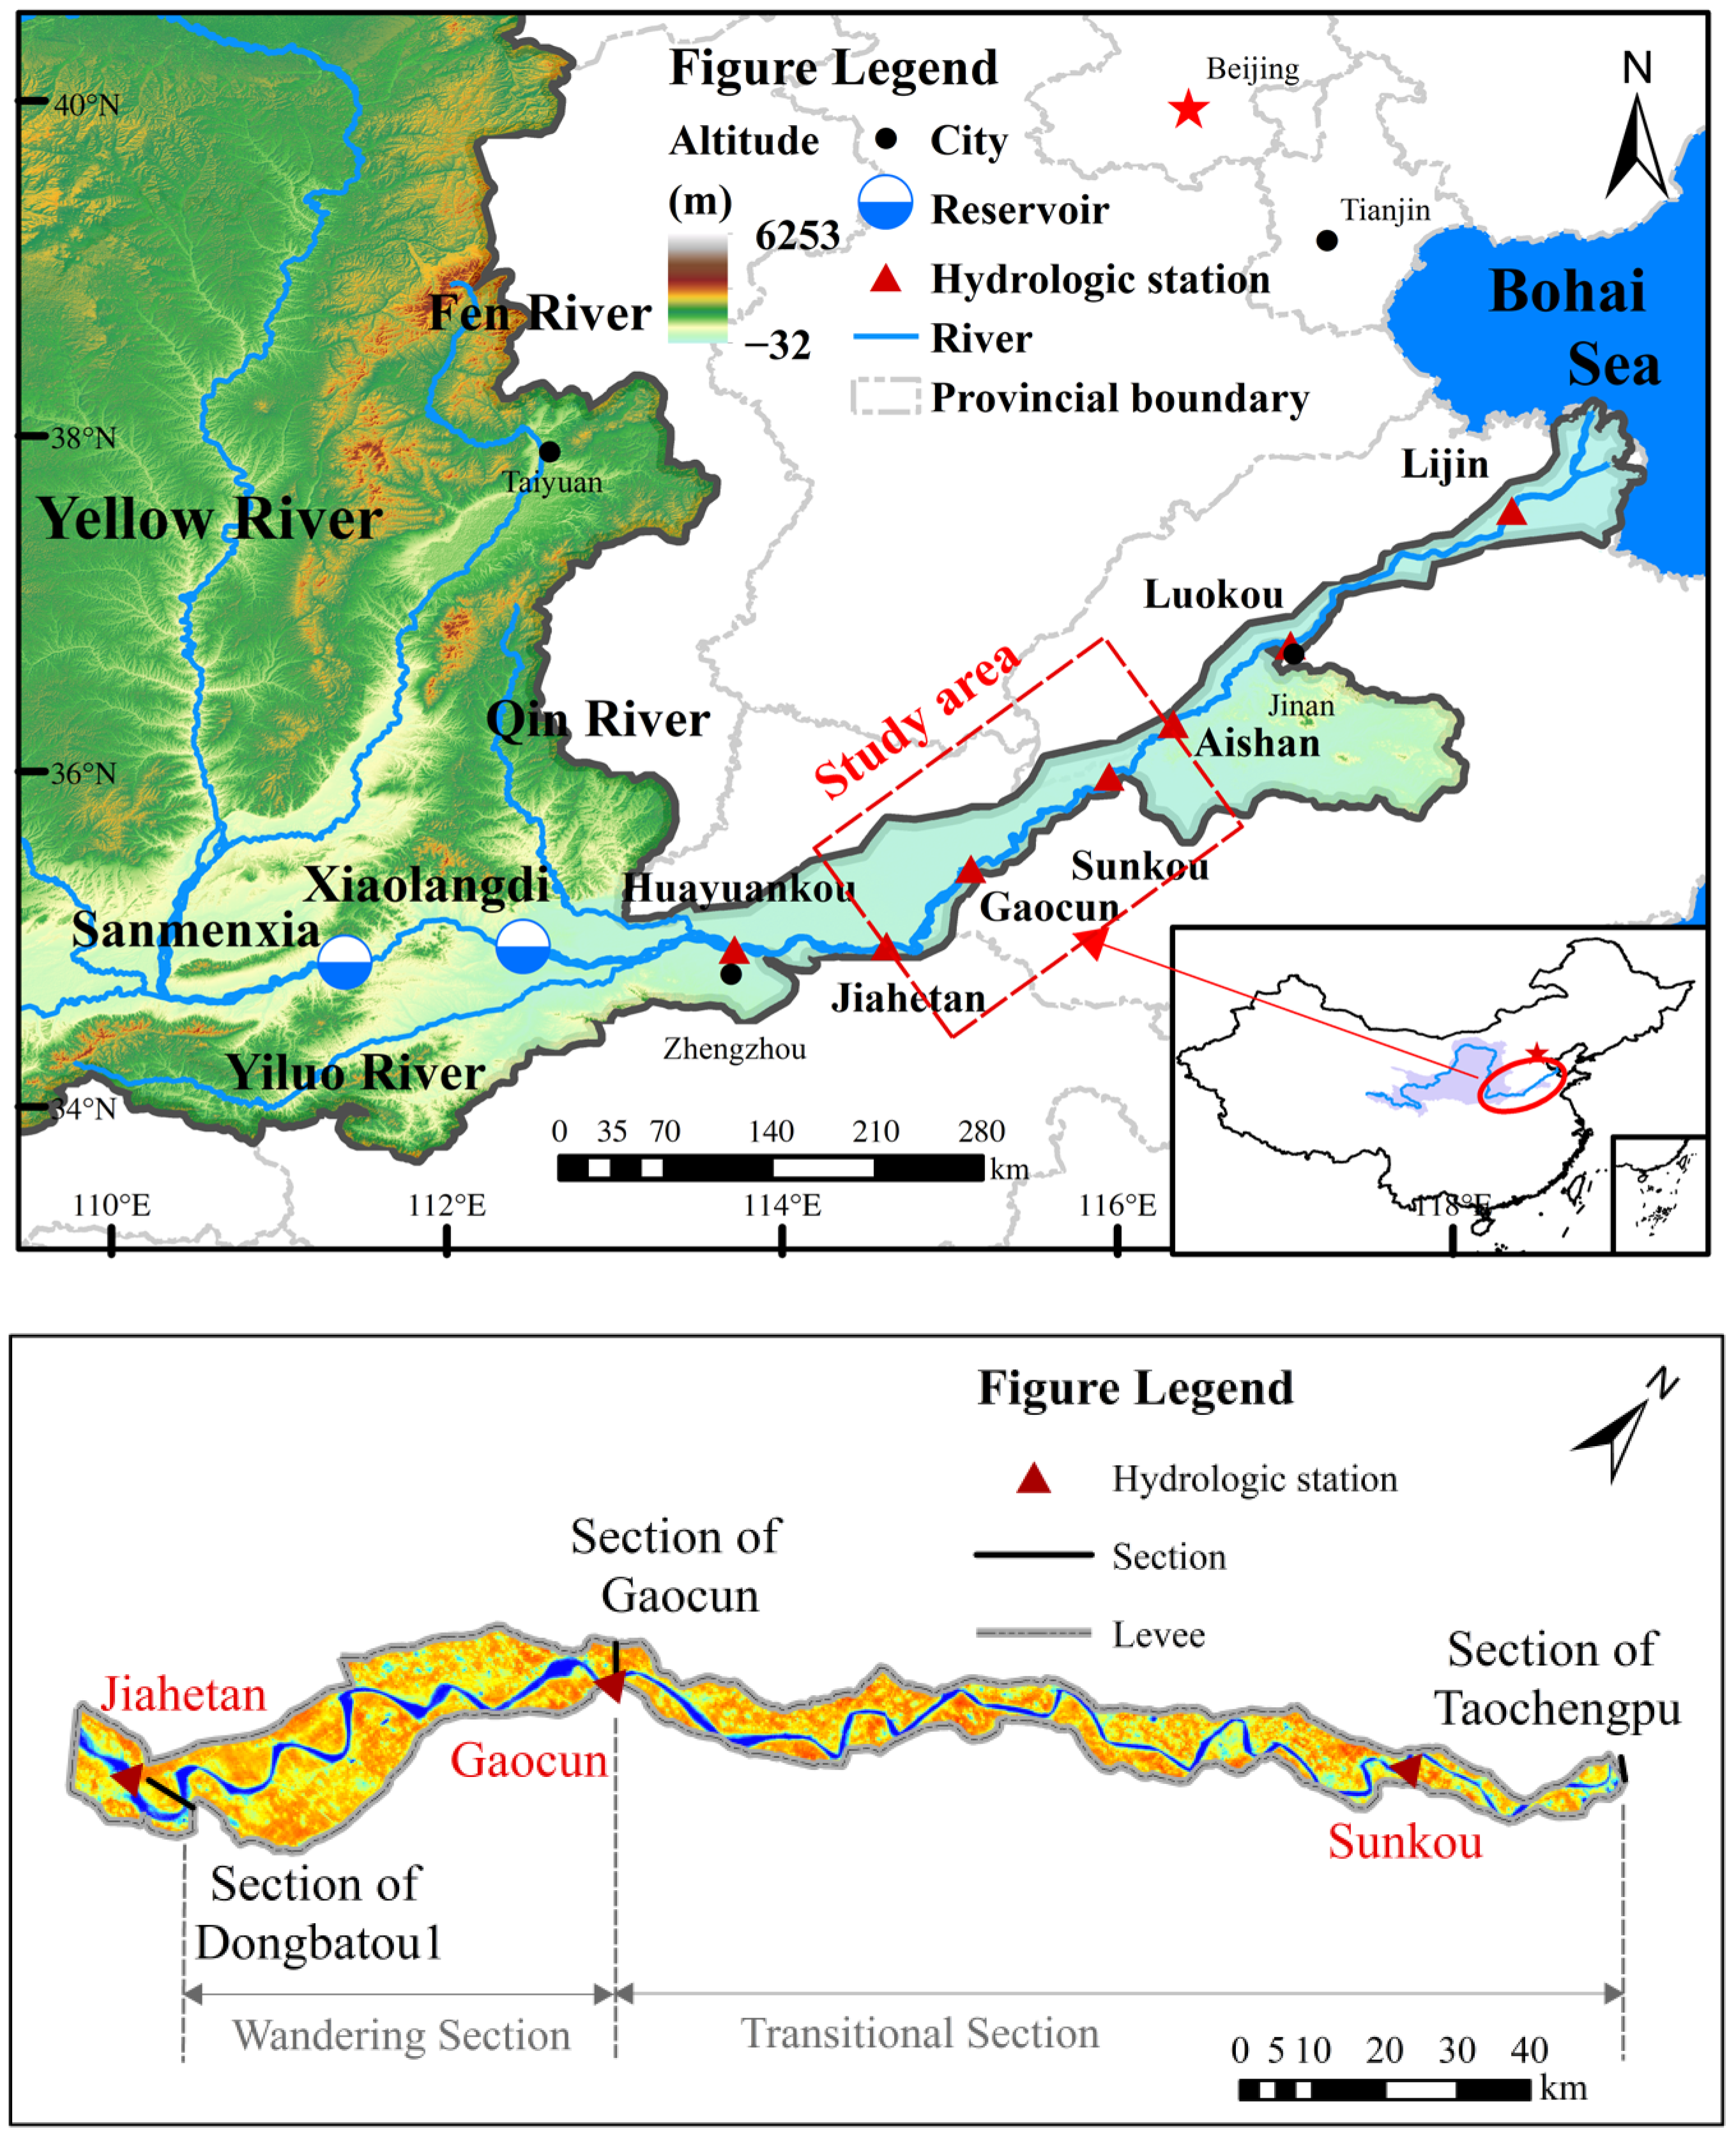
The total length of the Lower Yellow River section of Dongbatou-Taochengpu (Figure 2) is 220 km, which is the most severe area of the secondary perched river [8], of which the section of Dongbatou-Gaocun is a wandering river with a length of about 66 km, with a Yellow River embankment levee distance of about 5~10 km. The widest part of the embankment reaches more than 20 km, with a river-specific drop of 1.72~2.65‱. There are two tributaries of the Yiluo River and Qin River converging into it. The Gaocun-Taochengpu River section belongs to the transitional channel transformed from wandering to bending, with a length of about 154 km controlled by river improvement projects, a stable mainstream area, a Yellow River embankment dyke distance ranging from 1.4 to 8.5 km, most of which is over 5 km, and an average specific drop of the river channel of 1.15‱. In the Lower Yellow River, there is a vast beach with a total area of 3544 km2, accounting for 84% of the river area, most of which is located in the river section above Taochengpu, with about 2770 km2 accounting for 78% of the total area. In the case of flooding, the beach can be used as a channel for flooding and sediment transfer, but at the same time, it is the habitat of nearly 3 million residents, so the problem of human–water–land conflict is highlighted.

2.2. Study Methods

2.2.1. Data Sources

The period studied in this paper is 1960–2022. The basic data involved are topographic data of each section between the Dongbatou-Taochengpu section of the Lower Yellow River, a series of annual water and sediment data, and flood element data, of which the topographic data of the section are stored in the form of elevation coordinates (Dagu elevation coordinate system). The cross-section topographic data are provided by the Yellow River Conservancy Commission (YRCC), and the series of annual water and sediment data information and flood element data are from the Yellow River Sediment Bulletin of the YRCC and the Hydrographic Yearbook of the People’s Republic of China, Volume IV (Book V). The beach transverse slope is one of the main parameters characterizing the degree of development of the secondary perched river and is calculated as follows:
i = H 1 H 2 d 1 d 2 × 10 , 000 0 000
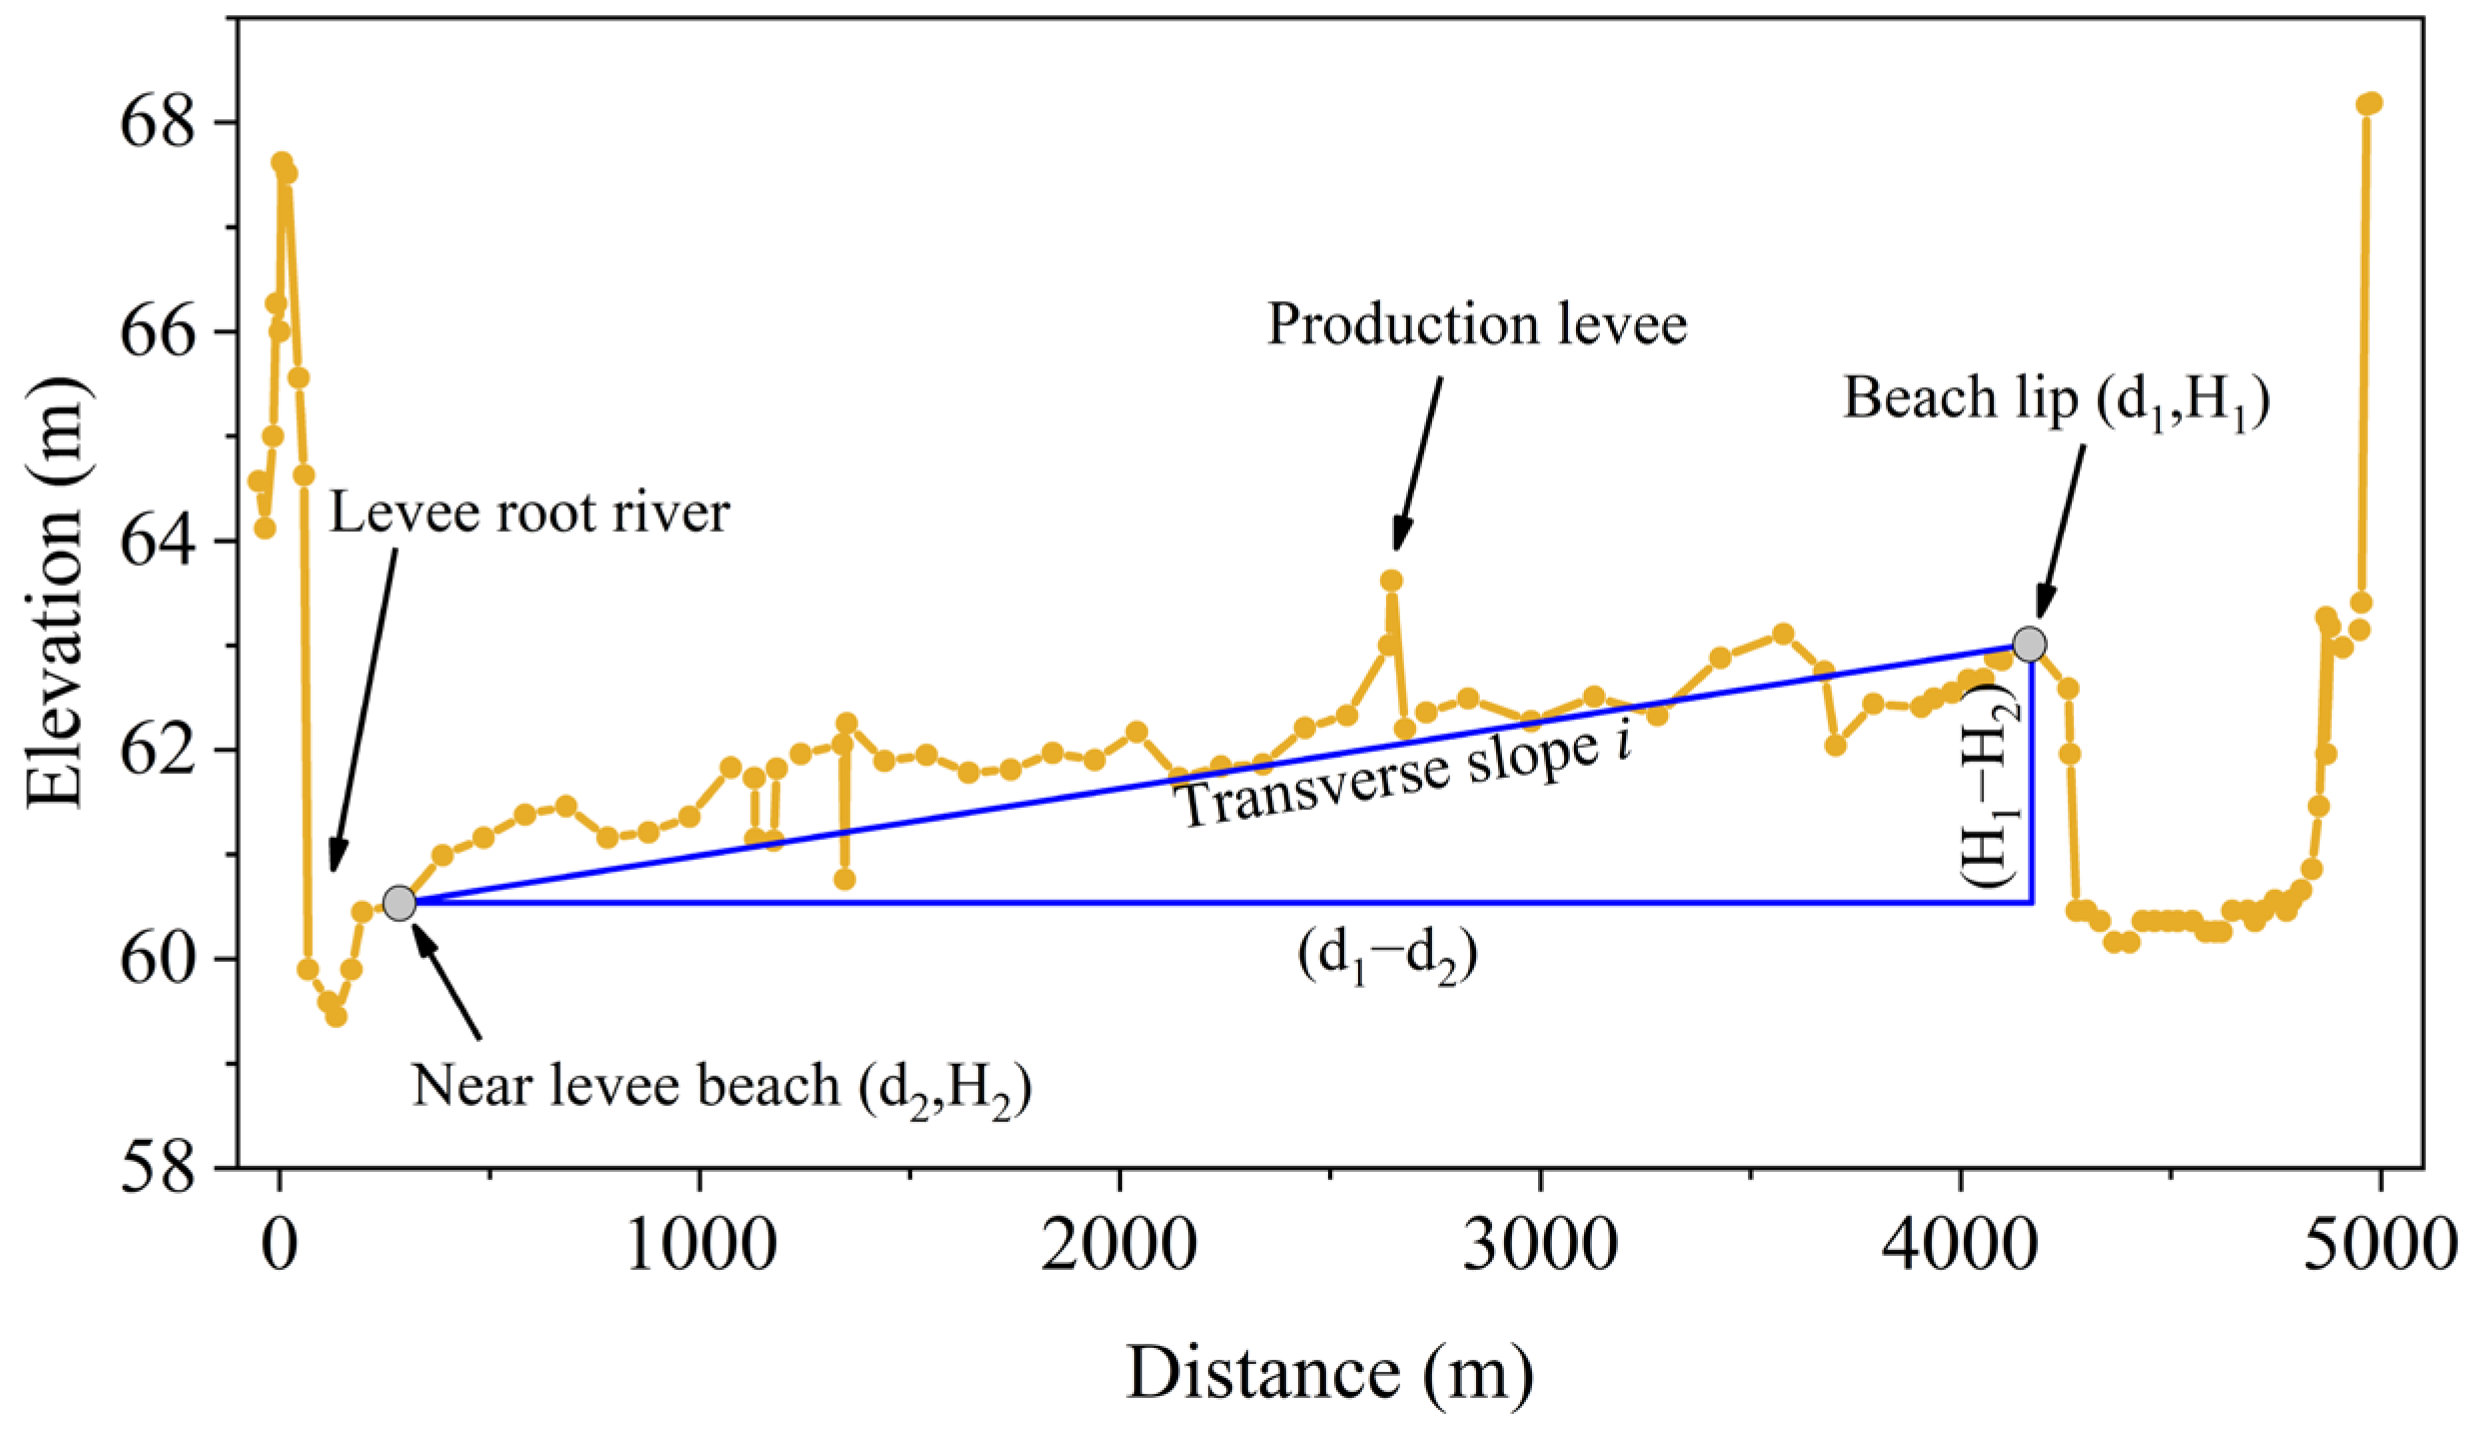
where i is the beach transverse specific drop, ‱; H1 and H2 are the elevation of the beach lip and the elevation of the beach near the levee, m; d1 and d2 are the distance from the start of the beach lip and the distance from the beginning of the beach near the levee, m, respectively; (H1H2) is the difference in the elevation, m; and (d1d2) is the width of the beach, m. Due to the change in the main channel position along the course, the width of the beach on the left and right banks varies greatly, resulting in a significant difference between the two banks of the same section of the transverse slope. In order to better represent the section of the beach’s transverse slope, take the average value of the left and right banks, and when there is no beach on one bank, the transverse slope of the other bank is the average transverse slope of the beach in the section.
Taking the terrain data of the Gaocun section after the flood season in 1996 as an example, the transverse slope is calculated as shown in Figure 3.

2.2.2. Data Processing Methods

(1)
Theil–Sen estimator
The application of the Theil–Sen estimator in the estimation of the linear slope is regarded as a robust nonparametric statistical technique for calculating trends. This method has the advantages of a high computational efficiency and is not affected by measurement errors and discrete data [23], and is widely used for trend analysis of long time series data. The calculation formula is as follows:
k = M e d i a n x j x i j i , j > i
in the formula, Median represents taking the median; xj and xi are the sample data corresponding to time j and time i (j > i), respectively. k is the trend degree of the time series. When k > 0, the time series shows an upward trend, while k < 0 shows a downward trend.
(2)
Mann–Kendall test
The M–K test is a non-parametric statistical test method, which has the advantage of not requiring samples to follow a certain distribution and not being affected by abnormal data. It can be used to detect the trend of changes in a set of sequences. Under the null hypothesis, the rank sequence Sk of the normal distribution statistic can be calculated using the following equation:
S k = i = 1 k r i   ,   ( k = 2 , 3 , , n )
the rank sequence Sk is the cumulative total number when xi > xj.
r i = 1 , x i > x j 0 , x i x j   ( j = 1 , 2 , , i 1 )
where xi is the variable of the i-th time series x. Under the assumption of random independence in the time series, the statistics are defined as the following:
U F k = S k E ( S k ) V a r ( S k ) ( k = 1 , 2 , , n )
in the formula, UF1 = 0, Var (Sk), and E (Sk) are the variance and mean of the cumulative number Sk, at x1, x2, ... xn are independent of each other and have the same continuous distribution; they can be calculated by the following equation:
E ( S k ) = k ( k + 1 ) 4 ( k = 2 , 3 , , n )
V a r ( S k ) = k ( k 1 ) ( 2 k + 5 ) 72 ( k = 2 , 3 , , n )
UFk is a sequential time series, while UBk is a reverse time series calculated using the same function, and their relationship is UFk = −UBk.
In the bilateral trend test, if |UFk| ≤ (UFk)1−α/2, then accept the null hypothesis at the significance level, which is (UFk)1−α/2. The critical value of the standard normal distribution when the null hypothesis is rejected, expressed as probability α when any point in UFk exceeds the confidence interval of ±1.96, p = 0.05, a significant upward or downward trend is determined. UFk > 0 indicates a significant upward trend, while UFk < 0 indicates a significant downward trend.
(3)
The Pettitt test
Assuming a time series xi of length n (i = 1,2,..., n), define the statistical variable as the following:
k ( τ ) = i = 1 τ j = τ + 1 n sgn ( x j x i )
in the equation, τ (1 ≤ τ ≤ n) for any time node. When the absolute value of the k (τ) statistic reaches its maximum, it is the mutation point. Then, the corresponding statistic for this point is as follows:
P = 2 exp [ 6 k τ 0 2 ( n 3 + n 2 ) ]
if p ≤ 0.05, it is considered that detecting the mutation point has significant statistical significance.

3. Evolution Characteristics of the Secondary Perched River from Dongbatou to Taochengpu

3.1. Evolution Trend of Transverse Slope

Figure 4 shows box plots of the transverse slope of the beach at each section within the Dongbatou-Gaocun (wandering section), Gaocun-Taochengpu (transitional section), and Dongbatou-Taochengpu that was reached in 2022. The fluctuation in the transverse slope change along the wandering section is small; the maximum transverse slope is 8.18‱, the minimum is 3.19‱, the difference is 4.99‱, and the average value is 5.81‱. The range of change in the transverse slope in different sections of the transitional section is larger, with a maximum transverse slope of 19.51‱, the minimum is 2.94‱, the maximum difference is 16.57‱, and the average transverse slope is 8.89‱, which is 1.53 times that of the average value of wandering section. From the Dongbatou-Taochengpu box diagram, it can be seen that the distribution of the two transverse slopes is obviously in different river segments, and the analysis of its temporal change pattern should also be considered in river segments.
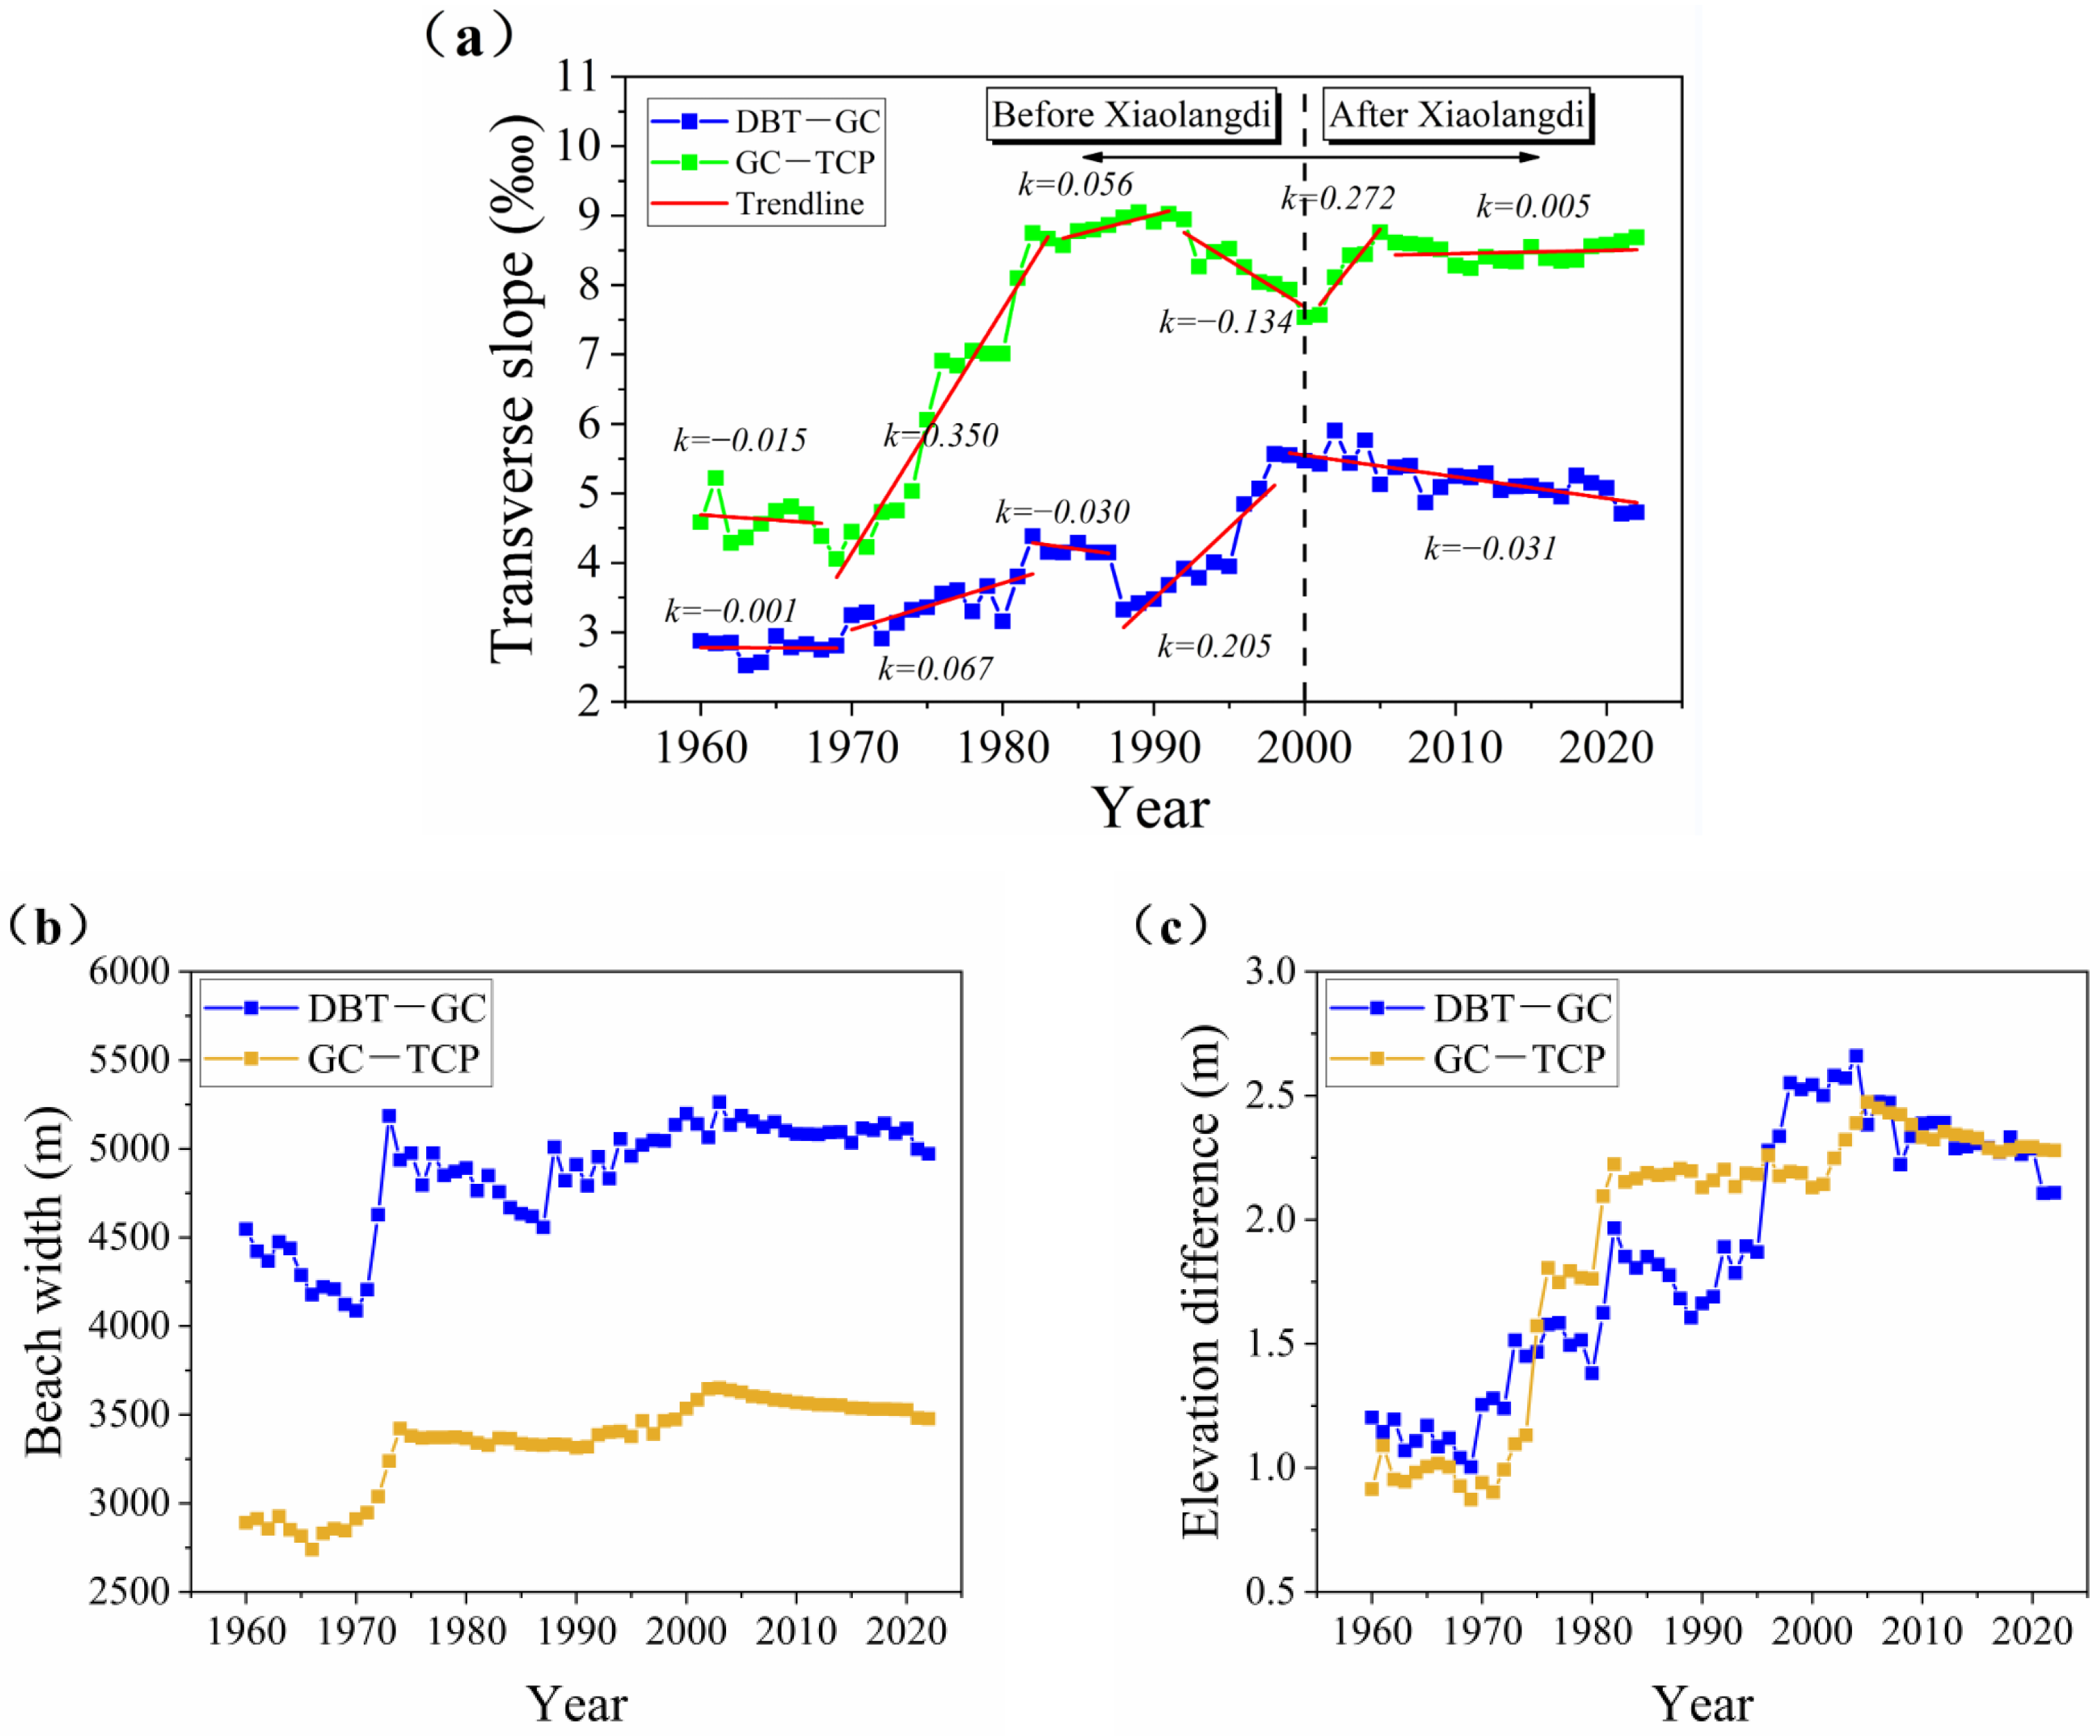
Figure 5 shows the evolution of the transverse slope, beach width, and elevation difference in the wandering and transitional sections from 1960 to 2022. The transverse slope has fluctuated through many ups and downs, and the overall trend is gradually increasing, and the wandering section is lower than the transitional section throughout the time period due to the larger width of the beach. The trend of the transverse slope is analyzed by the slope, and the degree of the trend is expressed by the value of k. The results are shown in Table 1. The 1960–1969 transverse slope was relatively low, with average transverse slopes of 2.78‱ and 4.57‱ for the two reaches, respectively, and the trend degree of the transverse slope change was relatively flat, with slopes k of −0.001 and −0.015, respectively. In 1970–1982, the transverse slope gradually increased, and the average transverse slopes of the two reaches were 3.44‱ and 6.22‱, respectively, which increased by 23.9% and 36.1% compared with 1960–1969. The trends of the transverse slope changes were all increasing, but the growth trend of the Gaocun-Taochengpu reach was much larger (k = 0.350), and the growth trend of the Dongbatou-Taochengpu reach was relatively smaller (k = 0.067). The trend of the transverse slope change in the Dongbatou-Gaocun reach slowed down from 1983 to 1987, with slope k = −0.030, and the trend of the transverse slope change in the Gaocun-Taochengpu reach also slowed down relatively from 1983 to 1990, with k = 0.056. In the Dongbatou-Gaocun River section in 1987 and the Dongbatou-Gaocun River section in 1990, before the operation of Xiaolangdi (1999), two sections of the transverse slope trend were diametrically opposite. The Dongbatou-Gaocun river section height difference increased substantially; although the beach had a certain widening, the trend of the increasing transverse slope was still more obvious, with k = 0.205. The Gaocun-Taochengpu section of the height difference did not have obvious changes, but the width of the beach increased, and the transverse slope gradually reduced. After 2000, Xiaolangdi was gradually put into use and began to transfer water and sediment, which has dramatically alleviated the increasing trend of the transverse slope, in which the Dongbatou-Gaocun river section showed a decreasing trend, with a slope of −0.031. The Gaocun-Taochengpu river section was still increasing before the water and sediment regulation in the Xiaolangdi reservoir (2004) (k = 0.272). After the water and sediment regulation in the Xiaolangdi reservoir, the slope changed to 0.272, with a slope of 0.032 and 0.032. The slope changed to 0.005 after the sediment transfer.
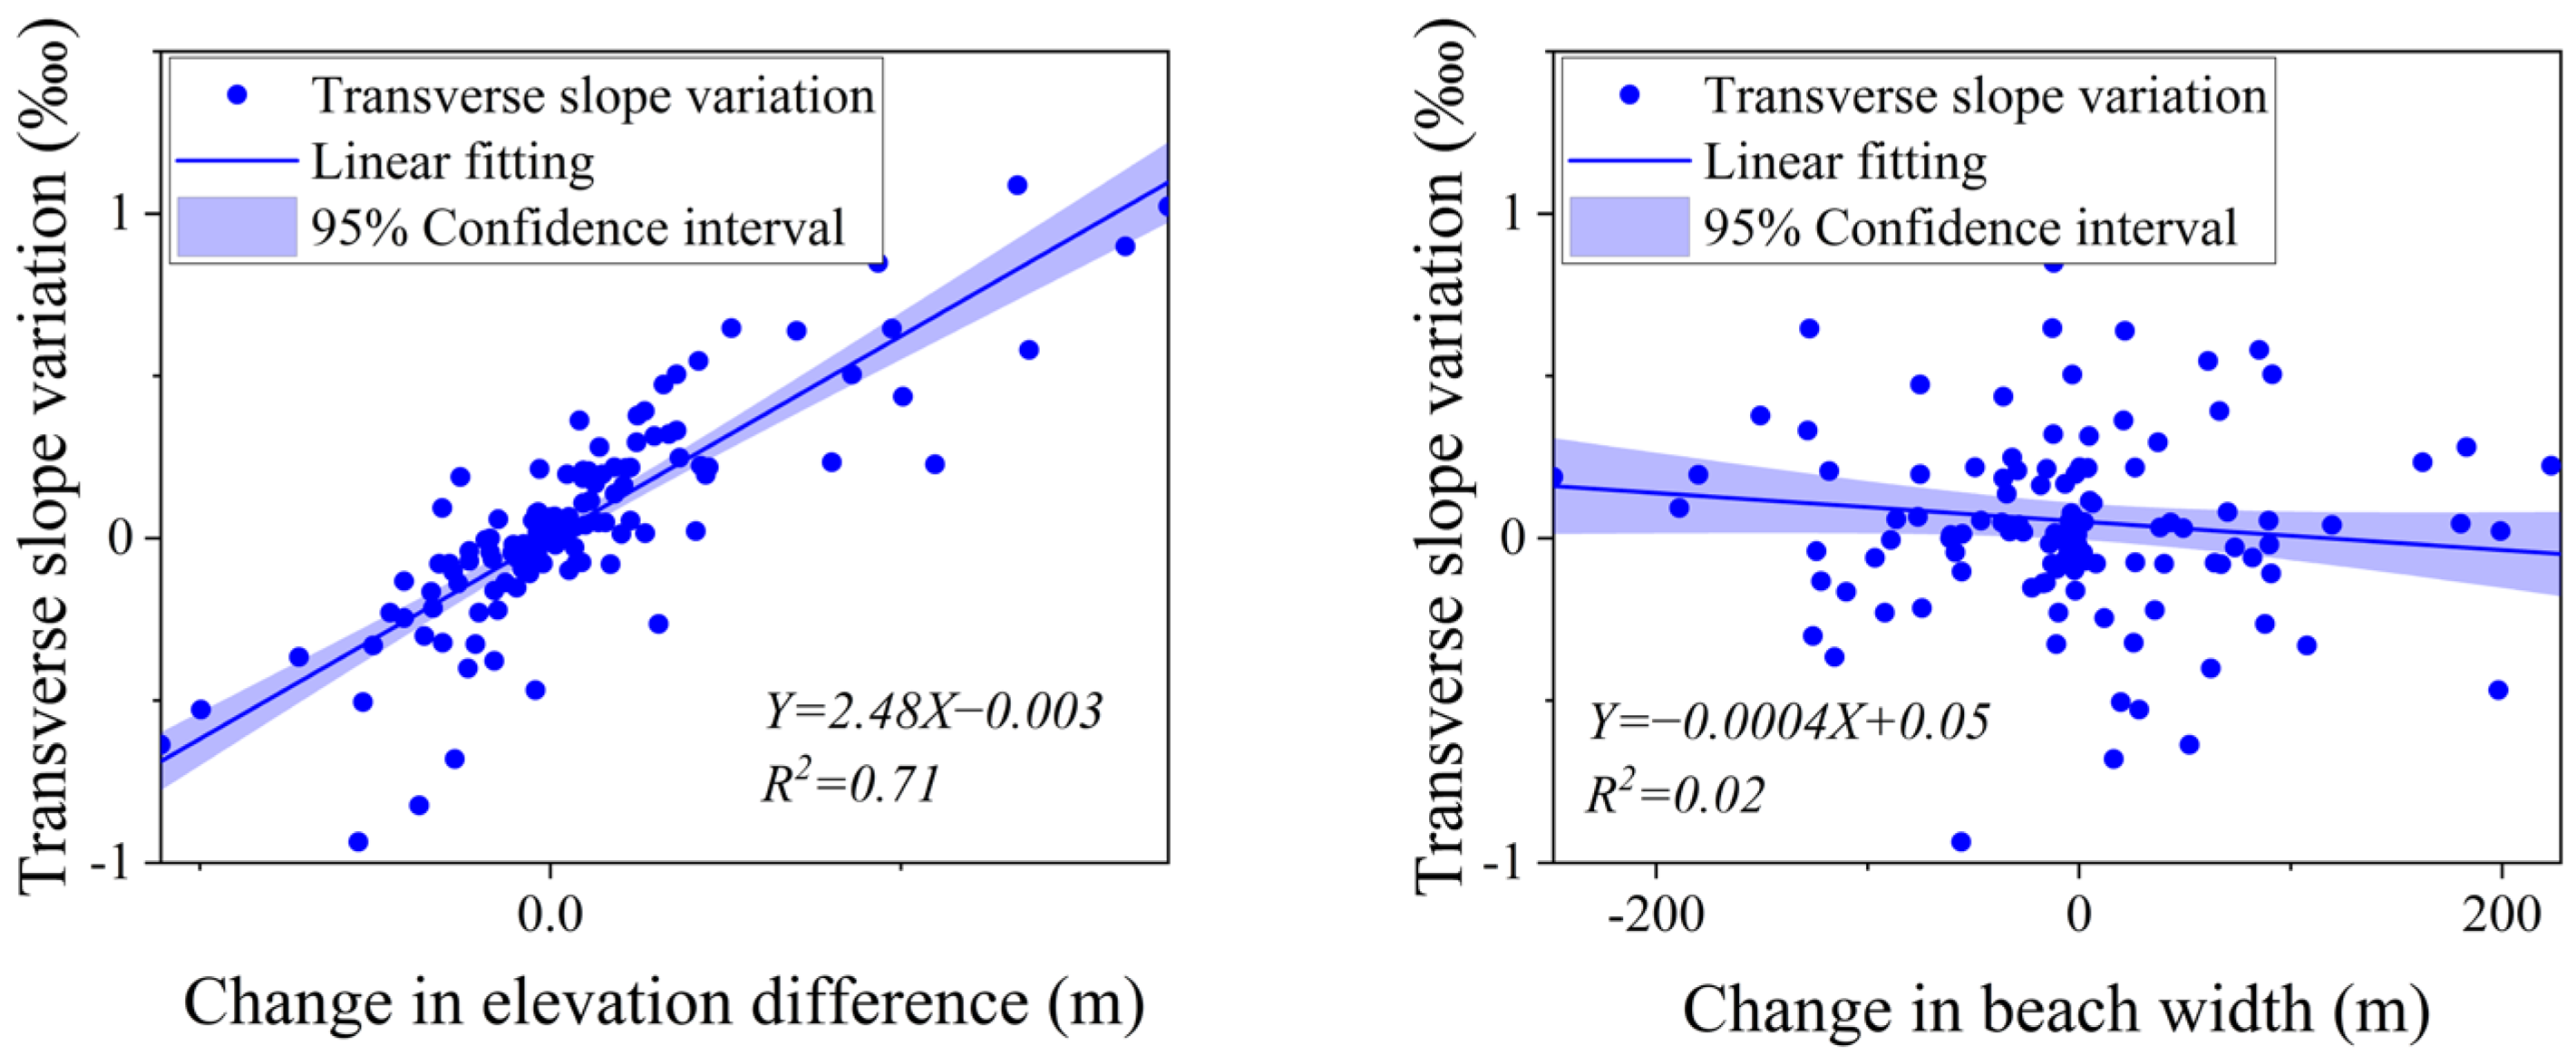
The transverse slope is the ratio of the height difference to the beach width. In the secondary perched river, the height difference and beach width change directly affects the transverse slope change. To explore the tendency of the evolution trend of the transverse slope when both the height difference and beach width were changed, the relationship between the change in the transverse slope, the change in the height difference, and the change in the beach width was plotted (Figure 6). The correlation of the change in the transverse slope with the change in the height difference is higher (R2 = 0.71), and the correlation of the transverse slope and beach width is lower (R2 = 0.02), which shows that the change in the elevation difference dominates the change in the transverse slope in the secondary perched river.

3.2. Mutability of Transverse Slope

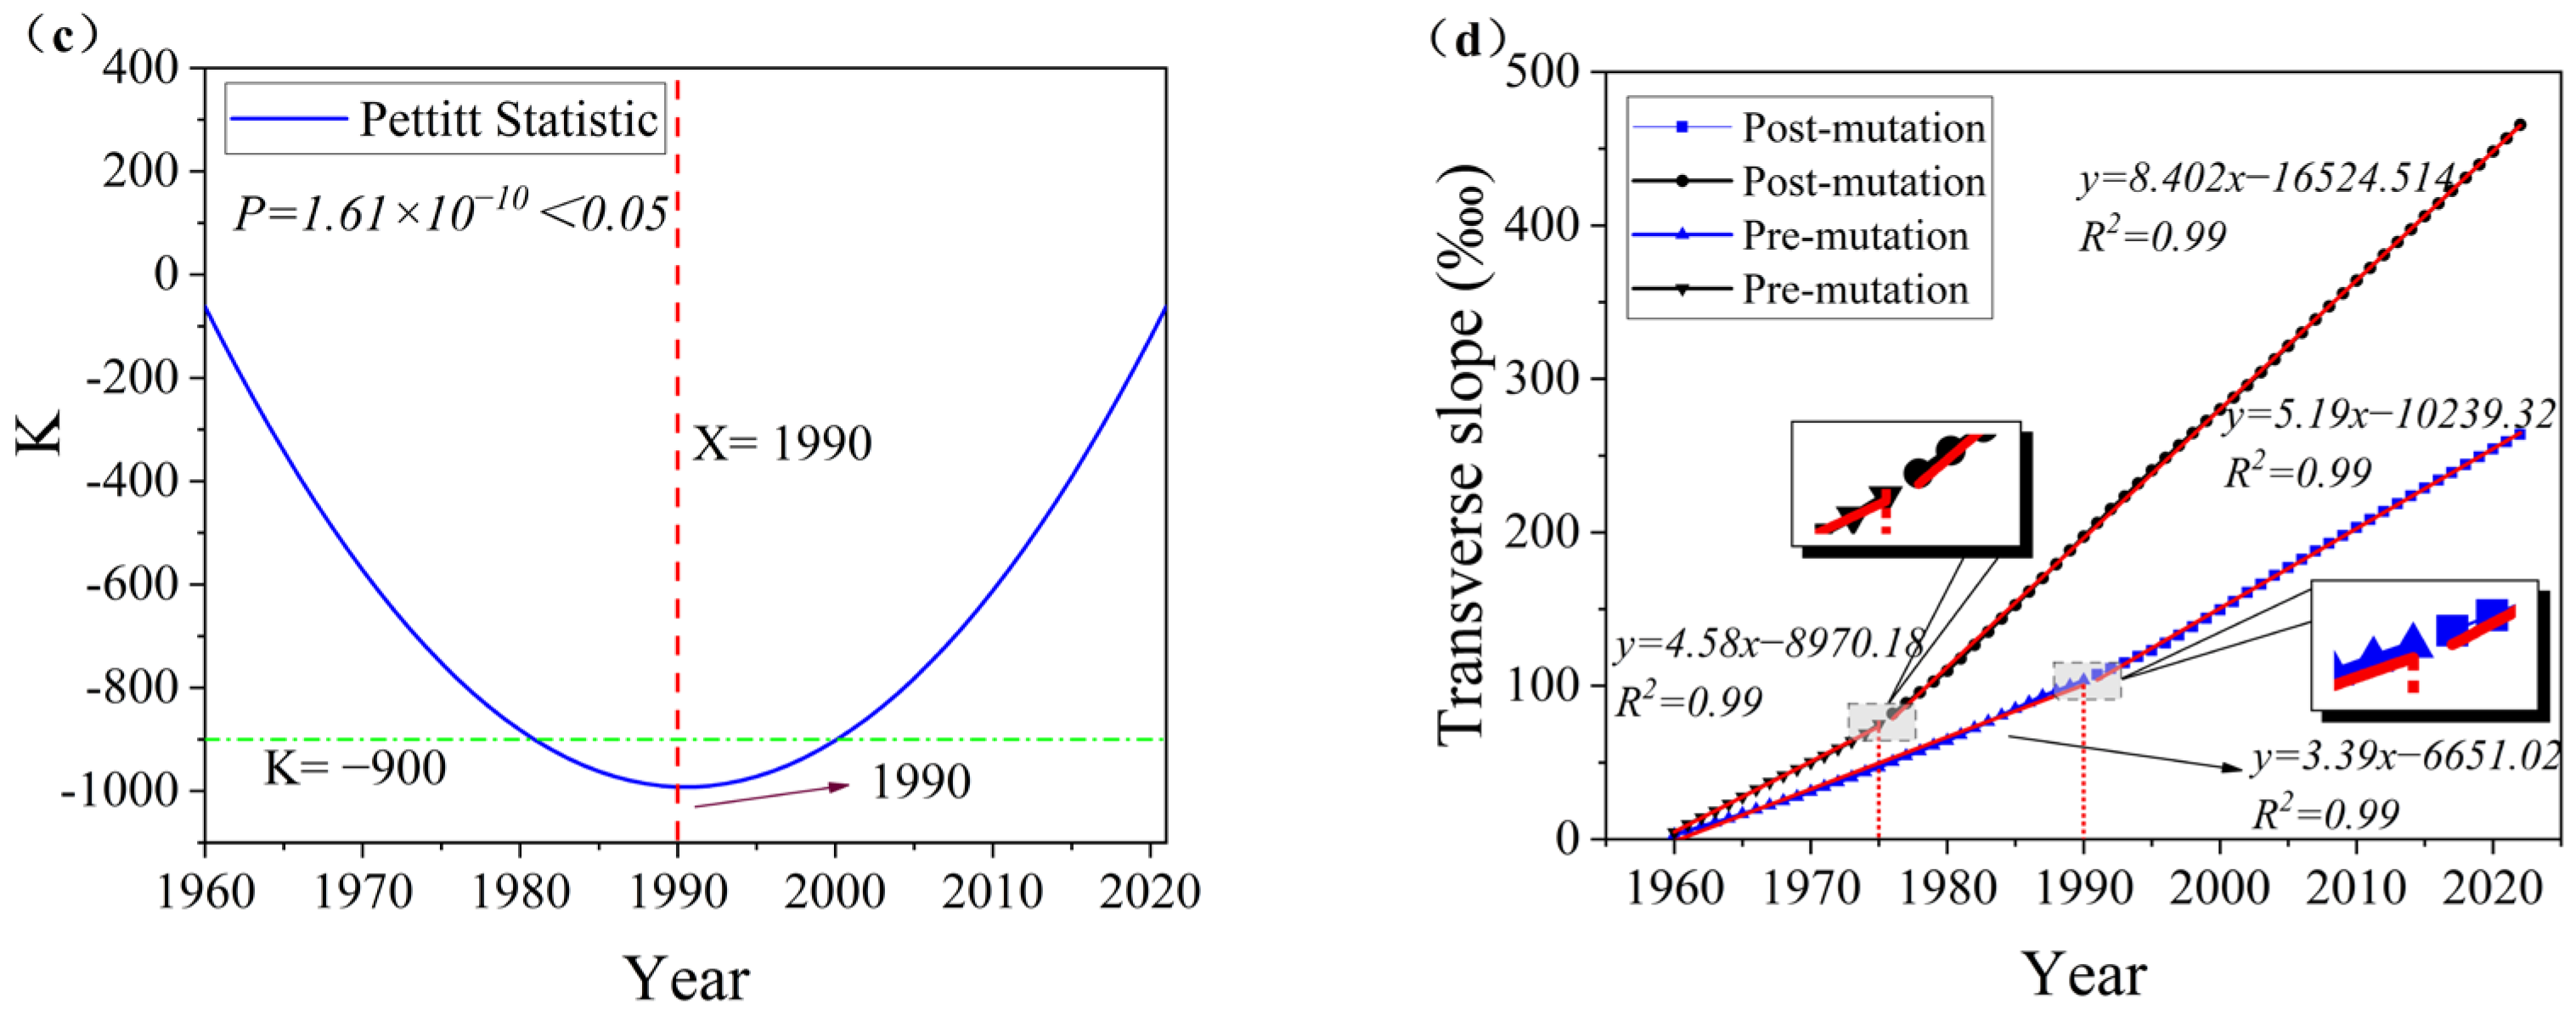
Figure 7 shows the M–K mutability analysis of the transverse slope time series in the Dongbatou-Gaocun and Gaocun-Taochengpu river segments. It can be seen that in the M–K test, except for the trend of decreasing before 1970, the rest of the increasing trend and the transverse slope of the Dongbatou-Gaocun river segment mutated at the time point of 1978. Still, the intersection point is located outside the critical line, which did not pass the test of significance [26] and needed to be further tested. The time point of the transverse slope mutation in the Gaocun-Taochengpu reach is 1975, and the intersection is located within the confidence interval. The Pettitt mutation test was used to identify further the mutation point of the transverse slope time series in the Dongbatou-Gaocun river section, and the results are shown in Figure 7c. The mutation point is 1990 and passes the significance test. The Pettitt test for the Dongbatou-Gaocun break differs from the M–K test results, and the double cumulative curve method is used to analyze the transverse slope of the two river sections. The results are shown in Figure 7d, which shows that the cumulative curves of the transverse slopes of the two sections have obvious turning points; the two-time points of the sudden change in the two river sections are in 1990 and 1975, respectively, and the cumulative curves of the sections have an excellent fitting effect (R2 = 0.99). A series of mutation tests showed that the time points of the transverse slope mutations in the Dongbatou-Gaocun and Gaocun-Taochengpu reaches were 1990 and 1975, respectively.
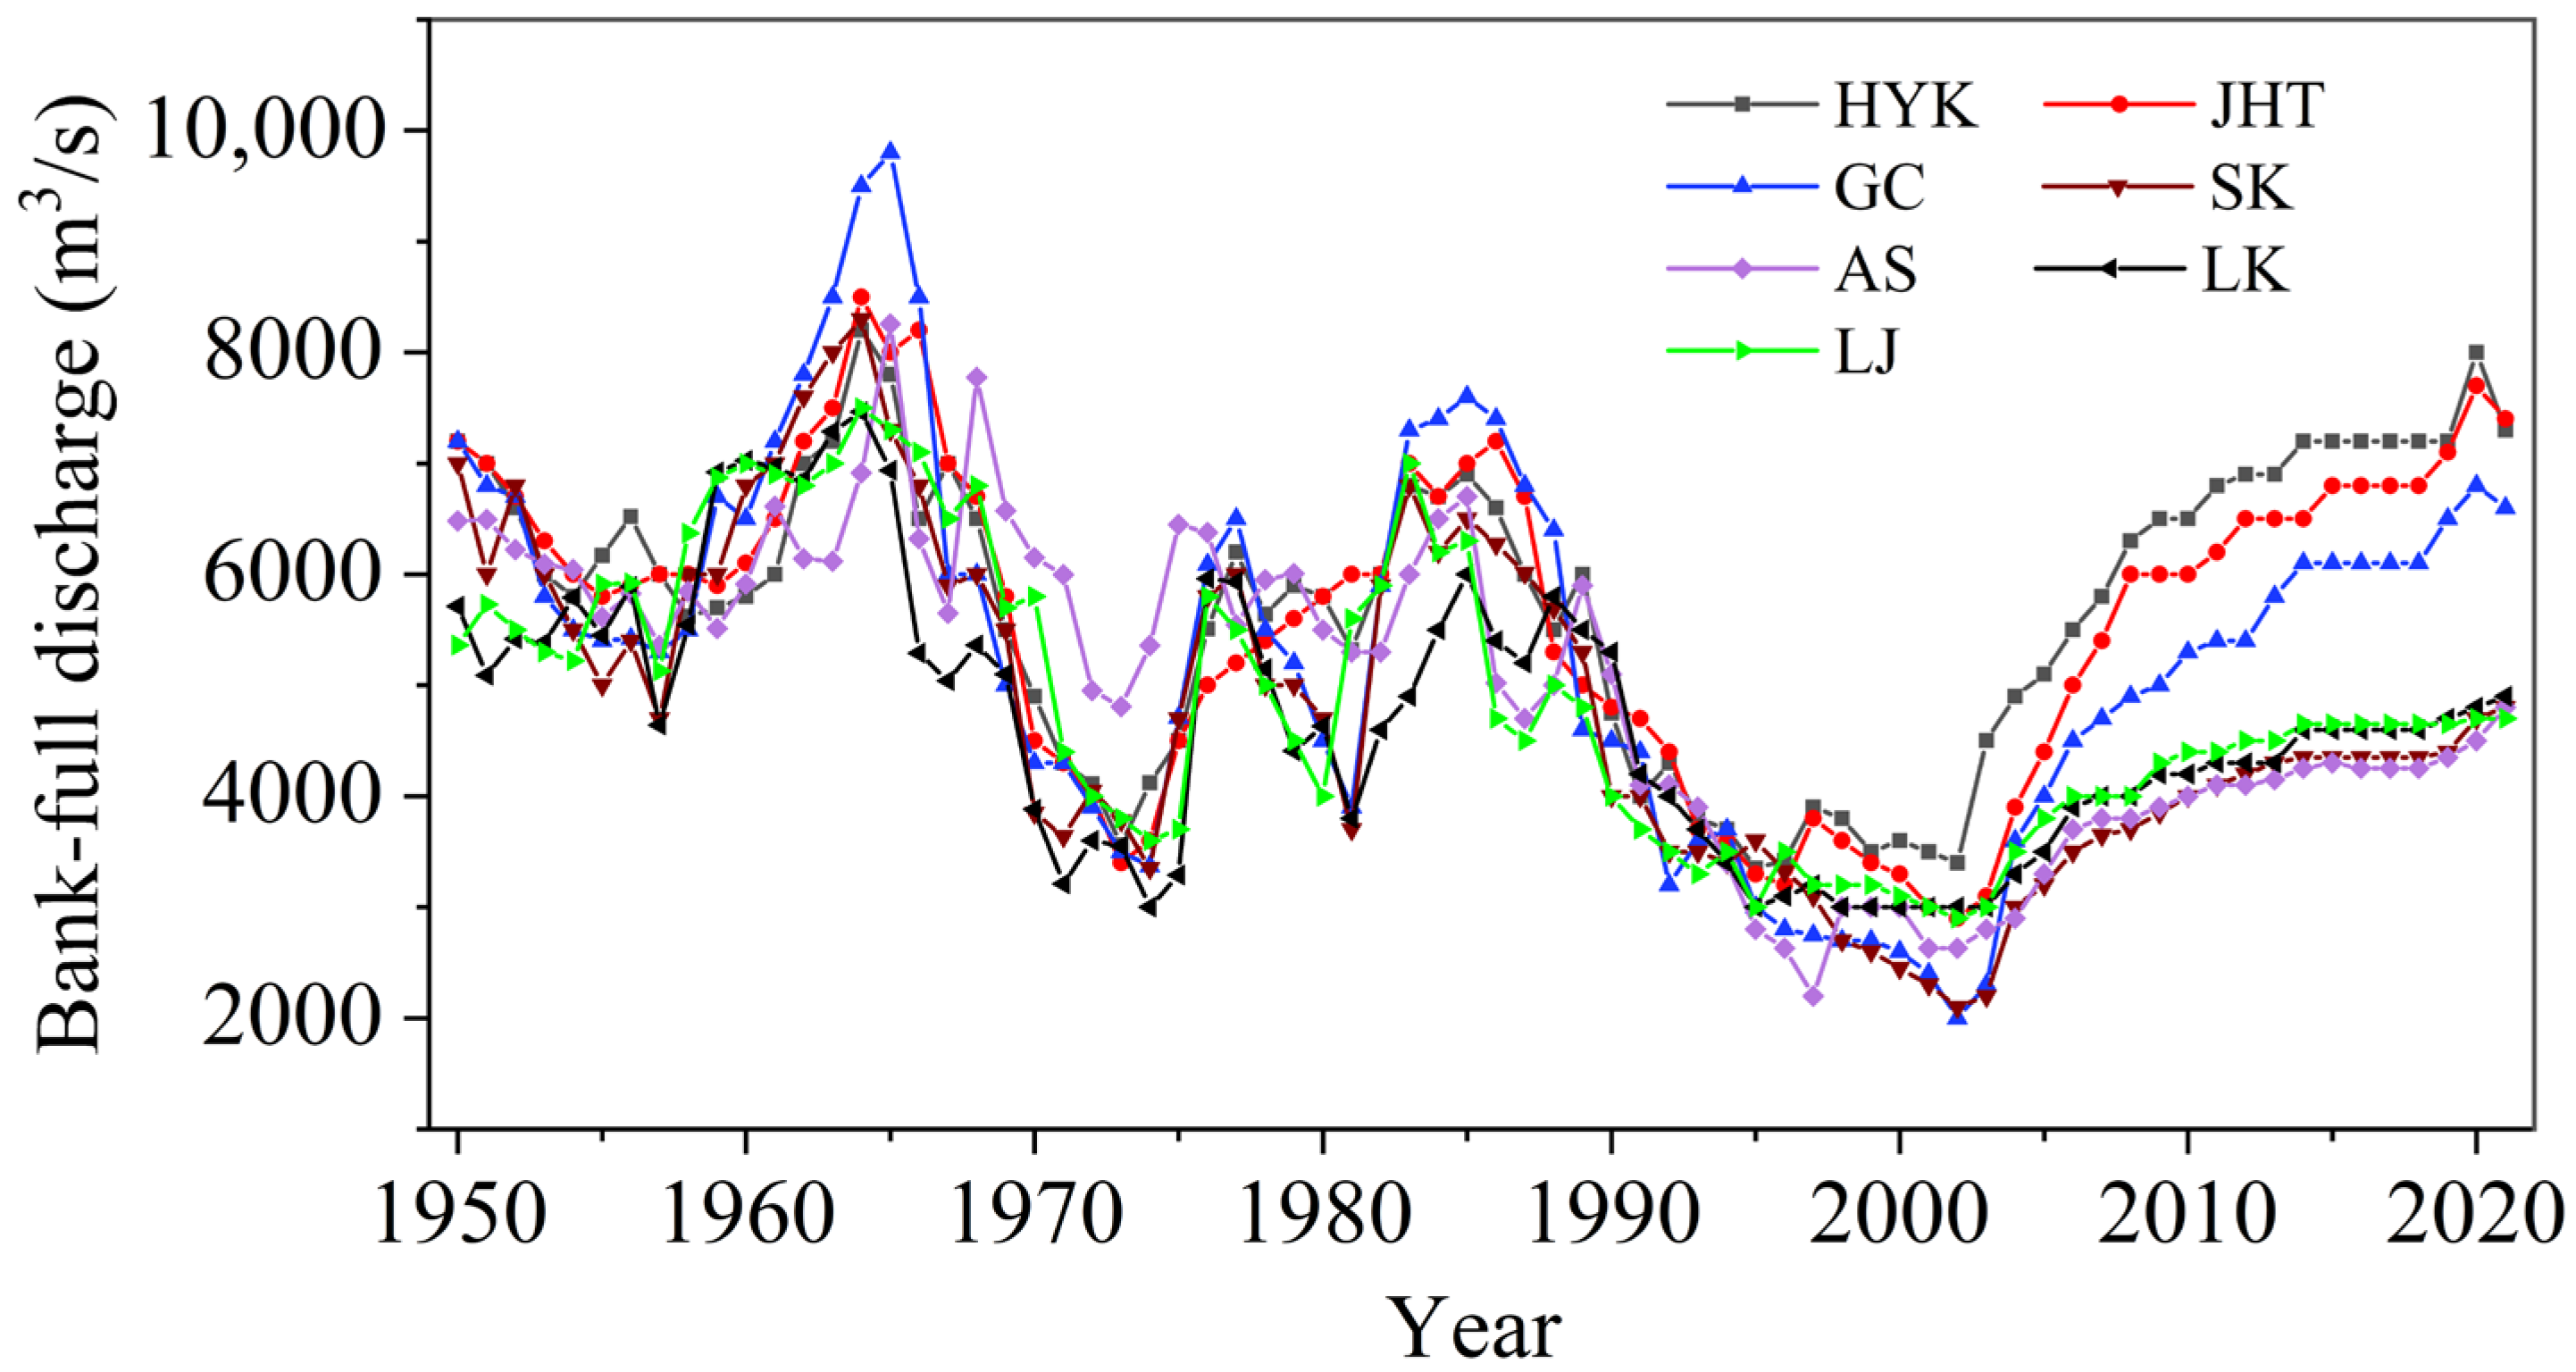
As shown in Table 2, several diffuse floods in 1975, 1976, 1981, and 1982 inundated the Lower Yellow River. Siltation should have been created in the beach of both river sections to increase the elevation difference. Still, the width of the beach in the Dongbatou-Gaocun section decreased, and the bank retreat caused the lip of the beach to drop in elevation, which concentrated some of the siltation uplift caused by the diffuse floods. The beach width in the Gaocun-Taochengpu section was unchanged from 1975 to 1990, and the increase in the elevation difference led to a rapid increase in the transverse slope of the beach and a sudden change in the transverse slope time series. After 1990, due to the siltation and shrinkage of the main channel in the early period, most of the flow of the Lower Yellow River flat beach in this period was reduced to less than 4000 m3/s (Figure 8), and the medium-regular floods like those in 1992, 1994, and 1996 could occur. The elevation difference of the Dongbatou-Gaocun section has increased greatly, and the increase is more significant than that after 1975, so the transverse slope time series of the Dongbatou-Gaocun section had undergone a sudden change in 1990 instead of 1975.

4. Discussion

The use of large reservoirs directly affects the inflow and sediment conditions downstream. Previous studies have divided the stage changes of secondary perched rivers according to the time nodes of the reservoir construction and operation methods. However, based on the results of the long-term time series analysis, this is not entirely the case. The reasons for the differences may include the following:
(1)
The different calculation methods used for the lateral gradient. When calculating the transverse slope, it is necessary to calculate the elevation near the embankment root and the main channel. The elevation at the embankment root is generally the average elevation of the 50–100 m beach or the average river bottom elevation of the embankment river; the elevation near the main channel is selected as the elevation of the high elevation beach lip or the average river bottom elevation of the main channel. Different calculation methods can lead to significant differences in the results and also reflect different information. When calculating the average river bottom elevation of the main channel, more consideration will be given to the changes in the elevation of the main channel. However, the focus of this study is on the actual changes in the beach, so selecting the beach lip elevation can better reflect the true transverse slope of the beach.
(2)
The hysteresis of riverbed evolution. The hysteresis response phenomenon is a typical feature of the non-equilibrium evolution process of rivers, which is commonly present in the riverbed evolution of impact rivers. The changes in the inflow and sediment conditions of natural rivers are relatively fast, while the corresponding riverbed erosion and sedimentation deformation are slower. When the construction or operation of a reservoir changes, the conditions for the incoming water and sediment change rapidly, while the changes in erosion and sedimentation in the lower reaches of the Yellow River are slower, and the evolution of the riverbed will lag behind the changes in incoming water and sediment to varying degrees.
(3)
Discontinuities in the beach erosion and sedimentation. The hysteresis of the riverbed evolution considers changes in water and sediment conditions. The original balance of sediment transport in the river channel is disrupted, and the river channel will slowly undergo erosion and sedimentation deformation until the equilibrium state. However, the floodplain only receives water during the flood season, and there is no continuous water flow erosion. The continuous effect of water and sediment changes cannot be fully exerted on the floodplain, and the erosion and sedimentation of the floodplain will not continue until the equilibrium stage of sediment transport, Therefore, the riverbed evolution of the tidal flat has the characteristic of discontinuity on the basis of hysteresis.
(4)
The changing characteristics of the different river types are different. The width of the wandering river reaches is large, and the main channel swings frequently, but the transverse slope is small. The width of the transitional river section is relatively small, and the main channel is stable. However, a stable main channel leads to a continuous cumulative elevation of the beach lip and a significant transverse slope.

5. Conclusions

(1)
After the 2022 flood season, the transverse slope fluctuation along the wandering section of the lower Yellow River is relatively small. The maximum difference in the transverse slope is 4.99‱ and the mean transverse slope is 5.81‱. In contrast, the transverse slope of the transitional section exhibits greater fluctuations along its course, with a maximum difference of 16.57‱ and a mean transverse slope of 8.89‱. The average transverse slope in the wandering section is 5.81‱, while in the transitional section it is 8.89‱, making the latter approximately 1.53 times steeper than the former.
(2)
During the period of 1960–1969, the transverse slope exhibited a small magnitude and a gradual trend of change. Subsequently, from 1969 until the Xiaolangdi reservoir run, the two river sections experienced a generally increasing transverse slope. Following the operation of the Xiaolangdi reservoir, the wandering section exhibited a decreasing trend in the transverse slope, while the transition section exhibited a gentle trend of change. The relationship between the change in the elevation difference and the change in the transverse slope demonstrated a stronger correlation (R2 = 0.71), whereas the correlation with the change in the shoal width was weaker (R2 = 0.02).
(3)
The time series data pertaining to the alterations in the transverse slope inside the transitional part and wandering section exhibited sudden shifts in 1975 and 1990, correspondingly. The sudden change can be attributed to several factors. Firstly, it has been observed that the frequency of floods in the beach area has increased significantly since 1975. This has led to a serious silting up of the beach lip, causing an increase in the transverse slope. Additionally, the transverse slope of the transitional section has experienced a sudden change during this period. Furthermore, after 1990, there has been a sharp decrease in the flow of the bank-full discharge. This has resulted in an increased likelihood of the downstream section of the Yellow River meandering across the beach. Consequently, the transverse slope of the wandering section has rapidly increased, leading to the occurrence of sudden changes.

Author Contributions

Conceptualization, J.Y., H.X. and L.X.; methodology, J.Y., H.X. and L.X.; software, H.X.; validation, L.X. and J.Y.; formal analysis, H.X. and L.X; investigation, H.X., X.G. and L.X.; data curation, H.X.; writing—original draft preparation, J.Y. and H.X.; writing—review and editing, J.Y., H.X., L.X. and F.G.; visualization, H.X.; supervision, L.X. and J.Y.; project administration, J.Y. and L.X.; funding acquisition, J.Y. and L.X. All authors have read and agreed to the published version of the manuscript.

Funding

This research was funded by [the National Natural Science Foundation of China] grant number [42041006, U2243220, 52009047], [the Major Science and Technology Project of Henan Province] grant number [231100320100], [the Excellent Youth Foundation of Henan Scientific Committee] grant number [222300420013], [the Significant Science and Technology Project of the Ministry of Water Resources] grant number [SKS-2022011], [the Excellent Young Talents Project of the Yellow River Conservancy Commission] grant number [HQK-202309], and [the Water Conservancy Cadres Education and Talent Cultivation] grant number [102126222015800019041]. The APC was funded by [HQK-202309, 102126222015800019041].

Data Availability Statement

The data presented in this study are available on request from the corresponding author.

Acknowledgments

We would like to express our gratitude to potential reviewers for their valuable feedback and suggestions. We appreciate the valuable feedback and suggestions from other colleagues, which have helped to improve the manuscript. We also thank the Yellow River Institute of Hydraulic Research for its financial support.

Conflicts of Interest

The authors declare no conflict of interest.

References

  1. Liao, Y. Causes and Control Measures of the “Secondary Suspended River” in the Lower Yellow River; The Yellow River Water Conservancy Press: Zhengzhou, China, 2003. [Google Scholar]
  2. Hu, Y.; Zhang, X. Brief discussion on the secondary perched river. J. Sediment Res. 2006, 5, 1–9. [Google Scholar] [CrossRef]
  3. Sun, D.; Liu, X.; Xue, H.; Wang, P.; Liao, X. Numerical simulation of fluvial process in the Lower Yellow River with “secondary perched river”. J. Hydroelectr. Eng. 2008, 27, 136–141. [Google Scholar]
  4. Jiang, E.; Cao, Y.; Zhang, Q. Development and Trend Prediction of Secondary Suspended Rivers; The Yellow River Water Conservancy Press: Zhengzhou, China, 2003; pp. 334–349. [Google Scholar]
  5. Gao, J.; Hu, C.; Chen, X. A preliminary study on alteration of watercourse and improvement of the “secondary perched river” in the lower Yellow River. J. China Inst. Water Resour. Hydropower Res. 2004, 2, 12–22. [Google Scholar] [CrossRef]
  6. Yan, Y.; Zhang, H.; Fu, B. Discussion on the Causes and Control Measures of the “Secondary Suspended River” in the Lower Yellow River. China Flood Drought Manag. Yellow River 2006, 2, 57–59. [Google Scholar]
  7. Yang, J.; Xu, J.; Liao, J. The Process of Secondary Suspended Channel in the Lower Yellow River under Different Conditions of Runoff and Sediment Load. Acta Geogr. Sin. 2006, 61, 66–76. [Google Scholar] [CrossRef]
  8. Jiang, E.; Cao, Y.; Zhang, L.; Zhao Zhang, Q. Study on the Evolution Law and Mechanism of River Regime in the Wandering Reach of the Lower Yellow River; China Water & Power Press: Beijing, China, 2006. [Google Scholar]
  9. Zhang, Y.; Hu, Y.; Shen, G. Floodplain Deposition and Main Channel Erosion for Overbank Floods in the Lower Yellow River. Yellow River 2016, 38, 65–68. [Google Scholar] [CrossRef]
  10. Li, G. “Keeping Healthy Life of the Yellow River”—An Ultimate Aim of Taming the Yellow River. Yellow River 2004, 26, 1–2+46. [Google Scholar]
  11. Zhang, J.; Lu, J.; Wei, S.; Luo, Q.; Wan, Z. Causes and Countermeasures of Insufficient Follow-Up Power for Water and Sediment Regulation in Xiaolangdi Reservoir. Yellow River 2021, 43, 5–9. [Google Scholar] [CrossRef]
  12. Wang, L.; Sun, X. Multi-timescale characteristics of runoff and sediment discharge along Lower Yellow River and their coupling analysis. Water Resour. Hydropower Eng. 2016, 47, 58–62. [Google Scholar] [CrossRef]
  13. Peng, Y.; Chen, S.; Shi, Y. Multiple time-scale set pair analysis on relationship between runoff and sediment in the Lower Yellow River. J. Sediment Res. 2021, 46, 35–41. [Google Scholar] [CrossRef]
  14. Zhang, Y.; Zhong, D.; Wu, B. Respinse model for the bankfull discharge in the Lower Yellow River. J. Tsinghua Univ. (Sci. Technol.) 2012, 52, 759–765. [Google Scholar] [CrossRef]
  15. Li, M.; Hu, C. Multiple time scale analysis of water & sediment load and bankfull discharge of the lower Yellow River. J. China Inst. Water Resour. Hydropower Res. 2012, 10, 166–173. [Google Scholar] [CrossRef]
  16. Hou, Z.; Li, Y.; Wang, W. Study on Silt—Discharge Exchange Mode of Floodplained Trough during Overbank Floods of the Yellow River. Yellow River 2010, 32, 63–64+67. [Google Scholar] [CrossRef]
  17. Shen, G.; Zhang, Y.; Zhang, M. Definition of channel and floodplain and spatio-temporal sedimentation characteristics for overbank hyperconcentrated flood in the lower Yellow River. Adv. Water Sci. 2017, 28, 641–651. [Google Scholar] [CrossRef]
  18. Hu, C.; Zhang, Z. The research of mechanism of constructing riverbed and index of flow and sediment of floodwater in the Lower Yellow River. Sci. Sin. Technol. 2015, 45, 1043–1051. [Google Scholar] [CrossRef]
  19. Wang, Y.; Wu, B.; Shen, G. Adjustment in the main-channel geometry of the lower Yellow River before and after the operation of the Xiaolangdi Reservoir from 1986 to 2015. Acta Geogr. Sin. 2019, 74, 2411–2427. [Google Scholar] [CrossRef]
  20. Zhang, J.; Liu, J.; Bai, Y.; Xu, H.; Li, Y. Spatiotemporal water-sediment variations and geomorphological evolution in wide-floodplain transitional reach of lower Yellow River. J. Hydroelectr. Eng. 2021, 40, 1–12. [Google Scholar] [CrossRef]
  21. Labat, D.; Ababou, R.; Mangin, A. Rainfall–runoff relations for karstic springs. Part I: Convolution and spectral analyses. J. Hydrol. 2000, 238, 123–148. [Google Scholar] [CrossRef]
  22. Labat, D.; Ababou, R.; Mangin, A. Rainfall–runoff relations for karstic springs. Part II: Continuouswavelet and discrete orthogonal multiresolution analyses. J. Hydrol. 2000, 238, 149–178. [Google Scholar] [CrossRef]
  23. Kong, D.; Miao, C.; Duan, Q.; Li, J.; Zheng, H.; Gou, J. Xiaolangdi Dam: A valve for streamflow extremes on the lower Yellow River. J. Hydrol. 2022, 606, 127426. [Google Scholar] [CrossRef]
  24. Kendall, M.G. Rank Correlation Methods. Br. J. Psychol. 1990, 25, 86–91. [Google Scholar] [CrossRef]
  25. Pettitt, A. A non-parametric approach to the change-point problem. Appl. Stat. 1979, 28, 126–135. [Google Scholar] [CrossRef]
  26. Fu, C.; Wang, Q. The Definition and Detection of the Abrubt Climatic Change. Chin. J. Atmos. Sci. 1992, 12, 482–493. [Google Scholar]
Figure 1. Typical cross-section of a secondary perched river: ① main channel; ② beach area; ③ beach lip; ④ production levee; ⑤ levee root; ⑥ secondary perched river; ⑦ primary perched river; ⑧ levee; ⑨ ground behind levee.
Water 15 03674 g001
Figure 2. Study area.
Water 15 03674 g002
Figure 3. Calculation of transverse slope of Gaocun section after flood season in 1996.
Water 15 03674 g003
Figure 4. Box plot of transverse slope in the Lower Yellow River beachland in 2022.
Water 15 03674 g004
Figure 5. Evolution of Secondary Perched Rivers from 1960 to 2022: (a) transverse slope, (b) beach width, (c) elevation difference.
Water 15 03674 g005
Figure 6. Linear relationship between transverse slope variation and changes in elevation difference and beach width.
Water 15 03674 g006
Figure 7. Mutation test for transverse slope time series: (a,b) M−K test, (c) Pettitt test, (d) double cumulative curve method.
Water 15 03674 g007aWater 15 03674 g007b
Figure 8. Lower Yellow River flatland flow.
Water 15 03674 g008
Table 1. Trend degree of transverse slope change.
Dongbatou-GaocunGaocun-Taochengpu
Time PeriodkTime Periodk
1960–1969−0.0151960–1969−0.001
1969–19820.3501969–19820.067
1982–19870.0561982–1990−0.030
1987–1999−0.1341990–19990.205
1999–20040.272----
2004–20220.0051999–2022−0.031
Table 2. Flood eigenvalues.
TimePeak Discharge (m3/s)Bank-Full Discharge (m3/s)Water Amount (108 m3)Sediment Amount (108 t)Average Sediment Concentration (kg/m3)Incoming Sediment Coefficient (kg·s/m6)Floodplain CoefficientChange in Elevation Difference(m)
DBT–GCGC–TCP
8 July/30 November 19757580450037.651.4839.350.00631.680.020.44
8 July/30 November 19769210551080.822.8635.440.00491.670.110.23
24 September/12 October 19818060532094.632.2023.300.00401.520.240.33
30 July/28 August 198215,300600061.091.9932.640.00512.550.340.13
27 July/24 October 19926430430024.874.54182.630.06341.500.200.04
6 August/19 August 19946300370030.474.64152.370.06051.700.110.05
17 July/26 August 19967860342058.925.2989.820.02772.300.410.08
Disclaimer/Publisher’s Note: The statements, opinions and data contained in all publications are solely those of the individual author(s) and contributor(s) and not of MDPI and/or the editor(s). MDPI and/or the editor(s) disclaim responsibility for any injury to people or property resulting from any ideas, methods, instructions or products referred to in the content.