Abstract
In this paper, a 1D process-based numerical model is established to study the sediment concentration via the turbine (TSC) and sedimentation of the lower reservoir and the upper reservoir of a certain pumped storage power station (PSPS), which is intended to be built on a sandy river. In addition, the sensitivity of TSC to some factors, such as suspended sediment gradation, the water level of the lower reservoir, and the coefficients of the sediment-carrying capacity formula, are analyzed in this paper. It is revealed that (1) the TSC will decrease by 30.8~34.5% when the incoming sediments of particle sizes less than 0.002 mm (which accounts for 3.95% of the totality) are replaced with incoming sediments of particle sizes between 0.002 mm and 0.004 mm. At the same time, the sedimentation thickness of the upper reservoir will decrease by 20.9%, and the siltation rate of the lower reservoir will increase by 2.4%. (2) The TSC will decrease by 12.6~13.1% as the water level of the lower reservoir rises by 17.55 m. This represents an increase of 8.4% in the average water depth and 26.4% in the storage capacity of the lower reservoir. At the same time, the sedimentation thickness of the upper reservoir will decrease by 32.2%, and the siltation rate of the lower reservoir will increase by 2.5%. (3) The TSC will decrease by 1.2~1.4% as the index of the sediment-carrying capacity formula m changes from 1.12 to 0.666, and the coefficient of the sediment-carrying capacity formula K changes from 0.2 to 0.6. At the same time, the sedimentation thickness of the upper reservoir will decrease by 7.2%, and the siltation rate of the lower reservoir will increase by 1.7%. Through the research on the sensitivity of the TSC, the direction and amplitude of the TSC changes with the boundary conditions are found, which provides a basis for the scheme comparison of specific projects and further supplements the prediction method system of the TSC. Meanwhile, the results remind researchers to pay more attention to the determination of boundary conditions and also provide the basis for the error analysis of the TSC. In summary, the results have certain guiding significance for the related research, and the sensitivity analysis results of the case could provide a reference for other specific projects.
1. Introduction
In September 2020, China’s “30·60” vision at the general debate of the 75th session of the United Nations General Assembly is put forward, that is, China aims to “have CO2 emissions peak before 2030 and achieve carbon neutrality before 2060”. Under this vision, the thermal power generation method originally used for peak load regulation has been limited, which results in an energy gap in the economic society. The urgent requirement for a new clean energy source that operates flexibly has been put forward by China’s economic society. Pumped storage power stations (PSPSs) with a rapid start and stop, flexible adjustment, and abundant reserves can alleviate the pressure of peak load regulation to a great extent, preventing major power accidents and ensuring the safe operation of the power grid [1,2,3]. At present, a number of PSPSs have been built and put into operation in China, such as Baoquan PSPS in Henan and Pushihe PSPS in Liaoning [4]. Since 2017, the scale of PSPSs under construction in China has ranked first in the world for many consecutive years [5].
Different from conventional hydropower stations, the water and sediment of the upper reservoir and the lower reservoir of PSPS are constantly exchanged during the pumping or power generation process. The water level of the upper reservoir and the lower reservoir fluctuates within a day or a week, which affects the sediment deposition and sediment concentration of reservoirs. In addition, there is a certain drop between the upper reservoir and the lower reservoir of most PSPSs, which aggravates the cavitation of pressure pipelines and turbine blades more or less. Hence, it is necessary to consider the upper reservoir and the lower reservoir together and pay special attention to sediment concentration and gradation via the turbine (TSC) in the research of PSPSs.
At present, the main research methods for PSPS issues include field data analysis [6], physical model experiments [7], numerical simulation [8], etc. By monitoring a PSPS in Switzerland, Müller et al. [9] summarized the variation law of the reservoirs’ sediment concentration in different seasons, that is, the reservoir sediment concentration is low in winter but increases as the snow is melting, then remains stable. Schleiss et al. [10] discussed the advanced technologies of reservoir silting prevention and mitigation measures, and divided them into upstream interventions, including planting forests; midstream interventions, including sand settling ponds; and in-reservoir interventions, including clearing and drainage. Wei et al. [11] established a numerical control model for the non-uniform sediment of PSPS, which combined the upper reservoir sedimentation, lower reservoir sedimentation, and TSC. The above-mentioned studies have all paid special attention to the problem of reservoir sedimentation in PSPSs but vary in emphases and methods. The need to consider the exchange of water and sediment in the upper reservoir and the lower reservoir causes difficulty in PSPS physical model building, and the relatively cumbersome boundary condition transformation also makes the physical model unsuitable for this paper, which requires the calculation of multiple scenarios and sensitivity analysis. Therefore, a numerical simulation is chosen as the research method in this paper in hopes of conducting a quantitative analysis for the TSC. Depending on the amount of empirical information required, models for the quantitative estimation of hydroscience can be broadly classed into “empirically-based” and “process-based” [12]. Considering that the development history of large-scale PSPSs in China is only 30 years, the measured data are relatively insufficient, and process-based models are selected for this paper.
In the numerical simulation calculation of PSPS, the calculation errors of sedimentation in reservoirs and TSC may exist, which may be caused by the error of field measured data, the error of empirical formula calculation coefficients, or the change of the lower reservoir scheduling mode. These errors will undoubtedly have impacts on TSC or sedimentation in reservoirs. If the laws of these effects could be ascertained, then some targeted engineering measures could be implemented accordingly, which would be helpful for the safe operation of PSPS. However, there are few studies on the influence factors of TSC via numerical simulation. Bonalumi et al. [13] established a budget model to simulate the temperature and suspended load distribution of two high mountain reservoirs in Switzerland, analyzing the impact of pumped storage operations on the total sediment deposition and its gradation. Based on fluid dynamics, reservoir sediment theory and numerical model, Chen et al. [14] established a two-dimensional sediment model of Tianchi PSPS, analyzing the sediment deposition and distribution in the past 50 years, but neither has conducted a thorough study of TSC. By establishing the relationship curve between the incoming sediment concentration and the TSC under different incoming flow and sediment conditions, and the relationship curve between TSC at pumping time and that at power generation time of Baoquan PSPS, a simple prediction method of TSC was established by Wu et al. [15]; Zhang et al. [16] established a physical model of a certain PSPS and estimated the general relationship between the TSC and incoming sediment concentration. They either carried out physical model tests or analyzed measured data, but neither carried out numerical simulation studies.
According to the characteristics of the PSPS, the mathematical model of the PSPS is established by taking the upper reservoir, lower reservoir, pressure pipeline, and power plant equipment as a whole, which is applied to a certain PSPS intended to be built on a sandy river, the sediment issues of the PSPS are studied. In addition, the sensitivity of TSC to several factors, such as suspended sediment gradation, the water level of the lower reservoir and the coefficient choice of the sediment-carrying capacity formula, are also analyzed. Research detects which direction TSC will change in with the boundary conditions and how much it will change, providing a basis for scheme comparison in specific projects and further supplementing the prediction method system of TSC. The basis for error analysis of TSC is also provided. Therefore, the results have certain guiding significance for related research, and the sensitivity analysis results of the case could provide a reference for other specific projects.
2. Methods
2.1. Model Establishment
The upper reservoir of the PSPS is in the shape of basin, and the lower one is in the shape of watercourse so that the static water settlement model and the 1D unsaturated sediment transport model widely used in reservoir sediment calculation could be adopted, respectively, in the calculation. By setting the confluence and diversion virtually in the section near the inlet/outlet in the lower reservoir, the complex reciprocating flow pattern near the inlet/outlet could be approximated.
- (1)
- Basic equation of 1D unsaturated sediment transport model
① Flow equation:
in which is the flow rate, refers to the lateral unit river length shunt or confluence flow, is the flow area, is the water level, is roughness factor, and refers to the hydraulic radius of the water crossing section.
② Convection diffusion equation of suspended mass and sediment transport equation of unbalance of bedload:
in which is the saturation coefficient of suspended load recovery; is the river width, , , and , respectively, are the suspended sediment concentration, sediment-carrying capacity, and settling velocity of group ; and and represent the actual and effective sediment transport rate of bed load in group , respectively. is the saturation coefficient of bed load recovery, is equal to the sediment transport rate of group suspended sediment per unit length of upper lateral inflow, and is equal to the actual sediment transport rate of group bedload per unit length of upper lateral inflow.
③ Bed deformation equation:
in which and represent the change rate of bed area produced by group suspended load and group bed load, respectively. is the dry density of sediment.
④ Bed material composition equation:
in which and represent the proportion of group sediment in the mixed layer and the original river bed, respectively; refers to thickness of the mixed layer; is the mark of erosion and deposition, if pure deposition is calculated, = 0, otherwise = 1; and is the original riverbed marker, = 1 when the boundary under the mixed layer reaches the original riverbed, otherwise = 0.
The above equations are discretized and solved using the finite difference method, and this process is specifically introduced by Yang et al. [17] and Han [18].
- (2)
- Sediment-carrying capacity formula
The sediment-carrying capacity formula (Formula (8)) brought up by Zhang Ruijin [19] is used in the model.
in which and are the average velocity and water depth of the section, respectively, and is the acceleration of gravity. represents particle size settling velocity. and are empirical coefficients, and there are generally two ways to evaluate them. One is calibrating the coefficients using the data of the two topographic data and the incoming flow and sediment in between. The other is to read the coefficient value from Figure 1 according to the value of .
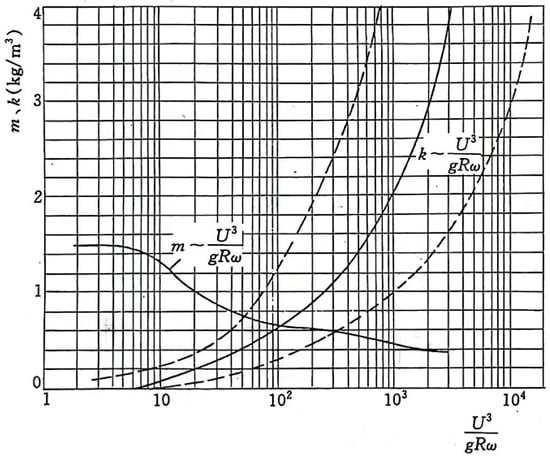
Figure 1.
The relationship between m, K and [19].
Due to the young monitoring age of river reach, the coefficient calibration lacks the measured data. Combining the estimated results of and Figure 1, the model considers K equal to 0.2 and m equal to 1.12.
- (3)
- Virtual diversion/confluence mode near water inlet/outlet
The pumping flow is often much larger than the incoming flow, resulting in a complex flow pattern near the inlet/outlet, which is commonly observed as reciprocating flow pattern. In the influence range of pumping flow, the above flow pattern is simulated by setting virtual nodes along the way, the diversion or confluence flow of each node can be determined according to the 2D or 3D flow calculation results of the detailed plane near the inlet/outlet water flow. The sketch of the mode used for simulation of flow near inlet/outlet is shown in Figure 2.
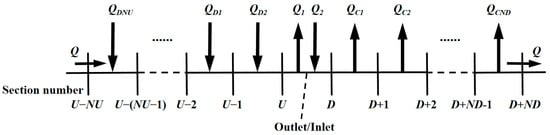
Figure 2.
Sketch of the mode used for simulation of flow near inlet/outlet.
- (4)
- TSC calculation
The TSC calculation includes the TSC at pumping/power generation time.
The average TSC at pumping time is , in which is the total amount of sediment pumped into the upper reservoir under one pumping condition. If the lower reservoir is in the shape of watercourse, it is shown in Figure 2 that . If the lower reservoir is in the shape of basin, then the is the total incoming sediment minus the siltation, that is, the amount of sediment suspended in the water. is the total water pumped into the upper reservoir, , where represents the total number of calculation periods under pumping conditions.
The average TSC at power generation time is , in which is the total amount of sediment flowing into the lower reservoir under one power generation condition, and its calculation method is the same as that of according to the different upper reservoir shape. , here represents the total number of calculation periods under power generation conditions.
The calculation mode of sediment concentration and the calculation method of sediment settlement of each group are shown in the work of Wei et al. [11]. The model has been verified in the physical model test of Baoquan PSPS.
2.2. Calculation Conditions
The PSPS is located on the GK River. The lower reservoir utilizes the MED reservoir that has been built on the Main River. The drainage map of the station is shown in Figure 3. No runoff enters the upper reservoir. Five years are selected as characteristic years from the measured incoming flow and sediment data of GK River for model calculation, and the specific data of these five years are shown in Table 1. The average annual discharge of GK River is 3.05 m3/s, the average annual suspended sediment transport is 105,000 t, and the average annual incoming sediment concentration is 1.092 kg/m3. The bed load transport is calculated as 30% of the suspended sediment.
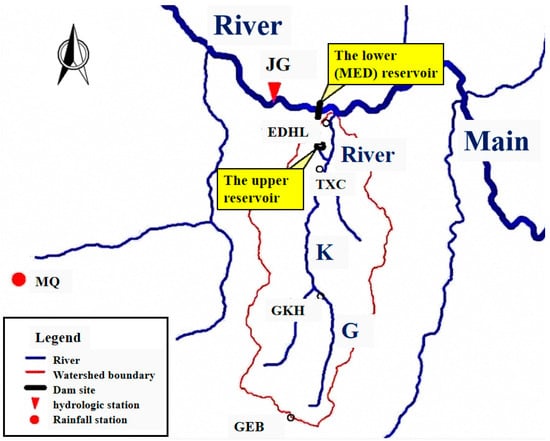
Figure 3.
Drainage map of the Pumped storage power station (PSPS).

Table 1.
Characteristic values of incoming flow and sediment into GK River.
The normal water level of the upper reservoir is 3780.00 m (Huanghai Sea elevation, the same as below), and the corresponding storage capacity is 11.695 million m3. The dead water level is 3747.00 m. The normal water level of the lower reservoir is 3275.00 m, with the corresponding storage capacity of 1.482 billion m3. The dead water level is 3240.00 m.
- (1)
- Calculation domain
The calculation domain includes the lower reservoir (a 88 km long section of the Main River and the 6.81 km long GK River), the upper reservoir, and the pressure pipeline. The terminal layout of the PSPS is shown in Figure 4.
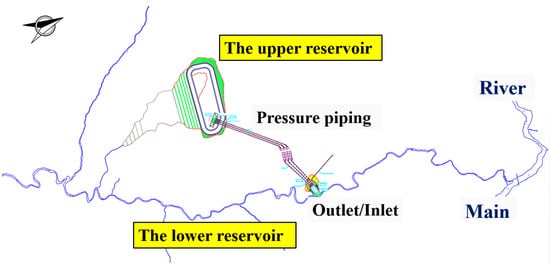
Figure 4.
Terminal layout of the PSPS.
- (2)
- Sediment gradation
Considering the large difference in sediment gradation between flood season (June to September) and dry season (October to May), two different sets of suspended sediment gradation are used, respectively, in calculation, that are representative of the six suspended load samples collected from April to September 2022 at the entrance to the GK River, taking into account the most unfavorable condition. The specific gradation results used in the calculation are shown in Figure 5.
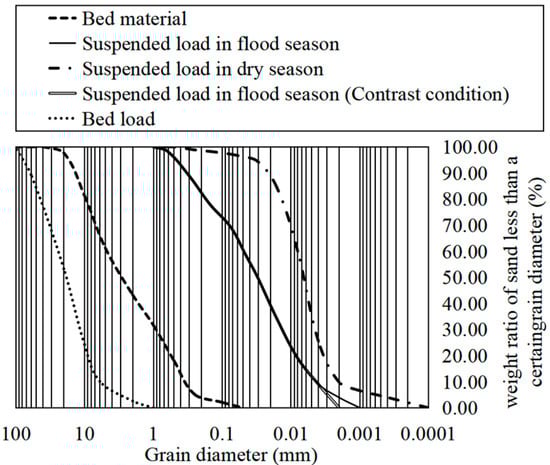
Figure 5.
All gradations used in the calculation.
Daily scheduling is used in the PSPS, and the dispatching process for 24 h is shown in Table 2. The negative number of the flow process in the table indicates pumping, and the positive number indicates power generation. The amount of water pumped in a day is 9,126,000 m3. The daily initial water level of the lower reservoir is determined using the dispatching mode of the MED hydropower station. According to the dispatching mode of the MED hydropower station, the water level of the lower reservoir is shown in Figure 6, varying between 3240.00 m and 3275.00 m within a year. The water level of the upper reservoir changes between 3751.25 and 3780.00 m only with the pumping/power generation process, the variation of water level of the upper reservoir along with the pumping/power generation process is shown in Figure 7.
Table 2.
Daily dispatching operation mode of the PSPS.
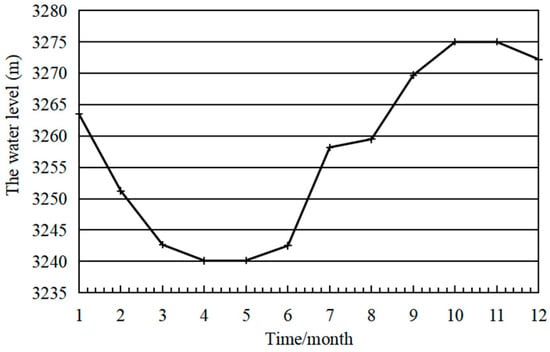
Figure 6.
Variation of water level in the lower reservoir.
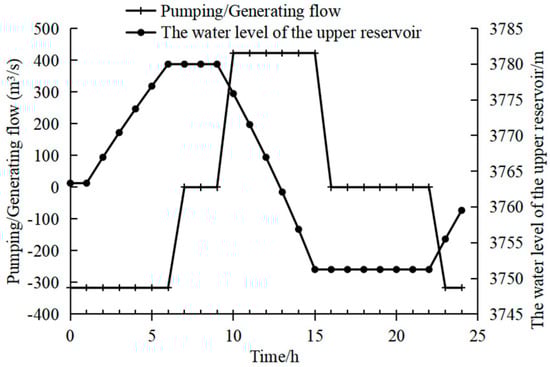
Figure 7.
Variation of water level in the upper reservoir.
2.3. Model Calibration
In order to complete the roughness factor calibration, the backwater calculation of the river channel should be carried out by the model and the obtained water surface line should be compared with the measured one. Then, the roughness factor should be adjusted constantly until calculated line agrees well with the measured line. The water surface line results in May 2022 are used to calibrate the roughness factor, the average daily flow rate was 5.70 m3/s, which is closest to the multi-year average in several measured data. The results of water surface line comparison are shown in Table 3. It can be seen from the table that the water surface line calculated via the model is in favorable agreement with the measured one, and the absolute error of water depth in most sections is less than 7 cm, which proves the reliability of the model principle and the method. The model could, therefore, be used for subsequent calculations. The final roughness factor taken is 0.045.
Table 3.
Comparison between measured water level and calculated water level in some sections.
3. Results
- (1)
- Sedimentation in reservoirs
The changes in the GK river thalweg during different operating years are shown in Figure 8. The changes in the bottom elevation of the upper reservoir are shown in Figure 9.
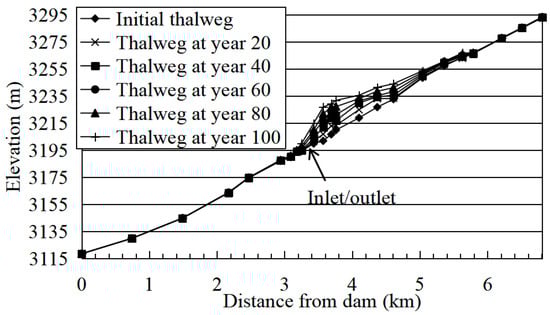
Figure 8.
Changes of GK River thalweg.
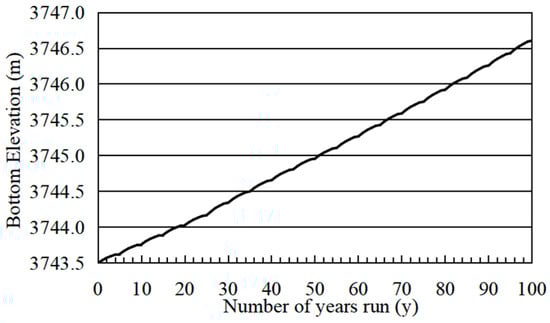
Figure 9.
Changes in the bottom elevation of the upper reservoir.
After 100 years of operation, the sedimentation thickness near the inlet/outlet is 14.92 m, the sedimentation elevation is 3214.92 m, and the siltation rate (equal to the ratio of the total sedimentation to the incoming sediment) of the GK River is 92.2%. It can be seen from Figure 8 that a majority of sediment deposits in the delta pattern in the river course within the range of 3.6~6.2 km from the confluence outlet, gradually advancing towards the front of the dam. The elevation of the delta top is 3231.93 m. Moreover, it is found that the coarser part of the incoming sediment is more likely to deposit by monitoring the silted riverbed, the sediment that moves near the inlet/outlet is therefore finer. By monitoring the sections near the inlet/outlet, it is found that no bedload moves near the inlet/outlet or passes through the turbine.
The upper reservoir bottom elevation did not exceed the dead water level (3747.00 m), which basically did not affect the normal operation of the station.
- (2)
- Sediment concentration via the turbine
After 100 years of operation, the changes in average TSC at pumping/power generation time per decade are shown in Figure 10. The changes in daily average TSC at pumping time for the first decade are shown in Figure 11. The gradation curves of pumping turbine sediment and incoming sediment in the 10th decade are shown in Figure 12.
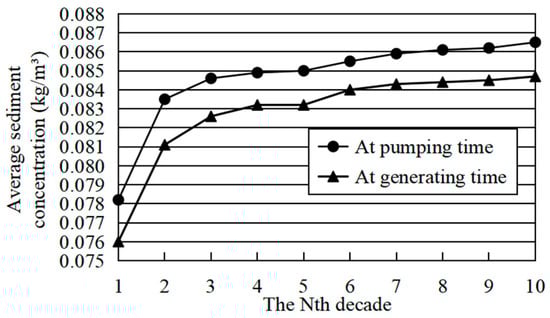
Figure 10.
Changes in sediment concentration via the turbine (TSC) at pumping/power generation time in 100 years.
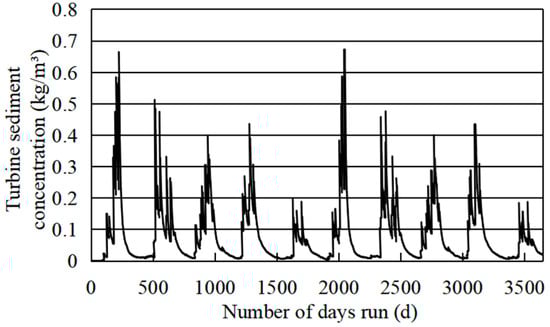
Figure 11.
Changes in daily average TSC at pumping time for the first decade.
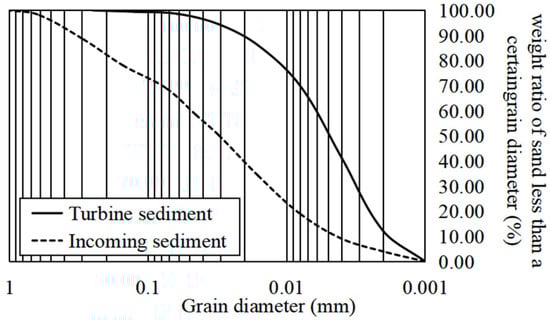
Figure 12.
The gradation curves of pumping turbine sediment and incoming sediment in the 10th decade.
In combination with Figure 8, it can be seen that with the operation of the station, the lower reservoir thalweg will become higher year by year, and the total storage capacity and the water depth of the overall section will gradually decrease correspondingly. Further, the flow velocity and sediment-carrying capacity of each section will increase, which leads to the gradual increase in TSC. In addition, since the coarser sediment is deposited upstream of the inlet/outlet in large quantities, it can be seen in conjunction with Figure 12 that the sediment passing through the turbine is finer than the incoming sediment.
In pumping/power generation conditions, the average TSC is less than 0.09 kg/m3 during 100 years of operation, the average TSC at pumping time per decade is 0.078~0.087 kg/m3, and the median particle size D50 is less than 0.006 mm.
4. Discussion
4.1. Sensitivity Analysis of Suspended Sediment Gradation
In the classical theory of river dynamics, the coarse sediment in the suspended load that constantly exchanges with the sediment on the riverbed and most of the bed load is known as “bed-material load”, while the finer sediment that basically maintains a suspended state and does not exchange with the sediment on the riverbed is known as “wash load” [20]. Among them, the wash load concentration is mainly determined using the sediment coming from the upper reaches. Han [21] and Qian [22] detected that the relationship between wash load and river hydraulic factors is disorganized by sorting out the suspended sediment concentration data of the Gaocun hydrology station in the Yellow River and the Grand Canyon station in the United States. It is difficult to determine the transport amount of wash load in suspended load, which results in poor representativeness of single sampling of suspended sediment gradation. In addition, the wash load is suspended in water, and it is easier to move downstream. If the water flow strength is sufficient, it will be bold and flowing. Therefore, a considerable proportion of the suspended sediment in the river near the inlet/outlet belongs to the wash load from the upper reaches, so the wash load may have a certain impact on the TSC. In this section, the sensitivity of suspended sediment gradation is analyzed.
Suspension index (sediment fall velocity divided by Karman’s constant and frictional velocity) characterized the uniform distribution of sediment on the vertical line. Some scholars advocated using the suspension index to find the dividing line between wash load and bed material load [23,24]. Sediments of finer particle sizes have smaller sediment fall velocity and suspension index and are more likely to enter the category of wash load under the same flow intensity. After a large flood upstream, finer sediment may be carried into the reservoir, so we consider replacing the finest incoming sediments of particle sizes smaller than 0.002 mm (which accounts for 3.95% of the totality) with incoming sediments of particle sizes between 0.002 mm and 0.004 mm when designing sensitivity analysis. The suspended sediment gradation curves in flood season under the natural and contrast conditions are shown in Figure 3. In addition, considering that in 5 characteristic years, there is still a large flow in October in wet years and median water year, the use of flood season gradation time of these two years is extended by one month in the design of contrast condition 1.
- (1)
- Sedimentation in reservoirs
The changes in the GK River thalweg during different operating years under contrast condition 1 are shown in Figure 13. The changes in the upper reservoir bottom elevation under natural condition and contrast condition 1 are shown in Figure 14.
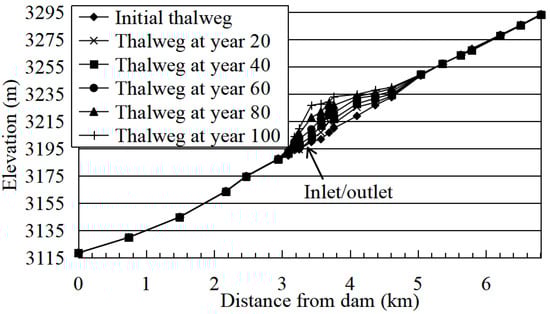
Figure 13.
Changes in GK River thalweg under contrast condition 1.
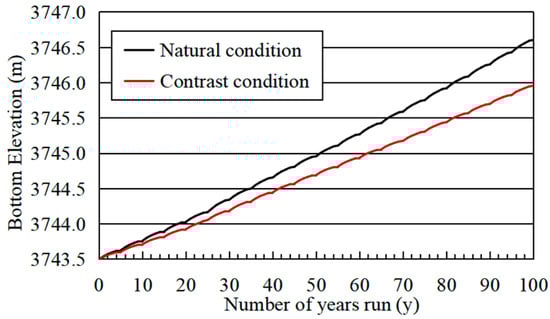
Figure 14.
Changes in the upper reservoir bottom elevation under natural condition and contrast condition 1.
When the incoming sediment becomes coarser as a whole, the siltation volume of the lower reservoir increases, which is reflected in the siltation elevation and siltation rate. As a result of increased siltation, it is obvious that less sediment moves to the inlet/outlet and is pumped to the upper reservoir, resulting in a decrease in the siltation volume in the upper reservoir and the upper reservoir bottom elevation.
After 100 years of operation, the sedimentation thickness near the inlet/outlet section is 16.89 m, which is 13.2% higher than that of the natural condition, and the sedimentation elevation is 3216.89 m. The siltation rate of the lower reservoir is 94.6%, which is 2.4% higher than that of the natural condition. It can be seen from Figure 13 that the sediment of the GK river is still deposited in the delta pattern, gradually advancing towards the front of the dam, but the elevation of the delta top is 3233.17 m, which is 1.24 m higher than that of the natural condition.
Compared with the natural condition, the sedimentation thickness of the upper reservoir decreases by 20.9%.
- (2)
- Sediment concentration through turbine
After 100 years of operation, the changes in the average TSC at pumping time per decade under natural condition and contrast condition 1 are shown in Figure 15. The sediment gradation curves of the pumping turbine under natural condition and contrast condition 1 in the 10th decade are shown in Figure 16.
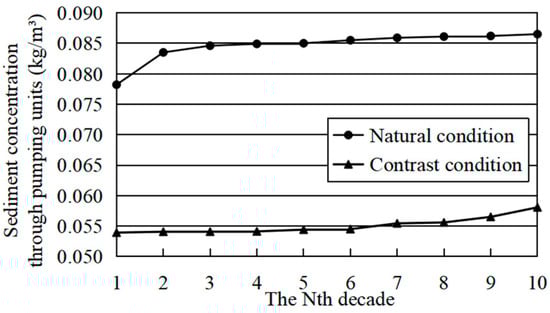
Figure 15.
Changes in TSC at pumping time in 100 years under natural condition and contrast condition 1.
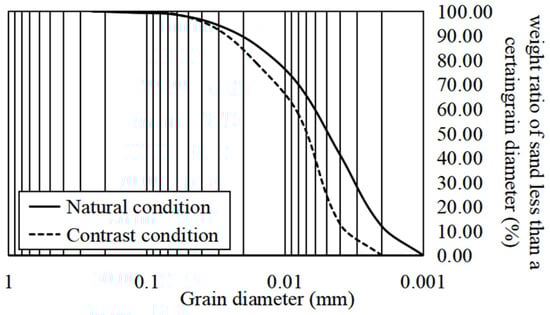
Figure 16.
Sediment gradation curves of pumping turbine under natural condition and contrast condition 1 in the 10th decade.
Compared with the natural condition, due to the reduction in the fine sediment, the sediment that can move to the inlet/outlet and be pumped to the upper reservoir is reduced, which leads to a reduction in the TSC. Moreover, it can be found that sediment passing through the turbine becomes slightly coarser when combined with Figure 16.
Under the contrast condition 1, the average TSC at pumping time per decade will be reduced from 0.078~0.087 kg/m3 to 0.054~0.057 kg/m3, which has a 30.8~34.5% reduction. Compared with the natural condition, the median particle size D50 of the sediment concentration through pumping units will increase somewhat, but it is still less than 0.008 mm.
4.2. Sensitivity Analysis of the Water Level of the Lower Reservoir
The upstream cascade NMT hydropower station reservoir will be put into operation after 10 years of operation of the MED hydropower station, and from then on the MED hydropower station reservoir only needs to be adjusted daily. Before and after the operation of the NMT hydropower station reservoir, the operation mode of the MED hydropower station reservoir will change, which results in a great change in water level during the year. Considering this factor, this section makes a sensitivity analysis of the water level of the MED hydropower station reservoir.
Under natural condition, the MED hydropower station reservoir is an annual regulation reservoir. According to the reservoir dispatching operation mode of MED hydropower station, the water level of the lower reservoir varies between 3240.00 m and 3275.00 m during the year, the annual average water level of the lower reservoir is about 3257.45 m, and the upper reservoir water level varies between 3747.00 m and 3780.00 m. After the NMT hydropower station reservoir is put into operation, the water level of the lower reservoir only changes daily, the annual average water level of the lower reservoir is maintained at 3275.00 m, which is 17.55 m higher than that of the previous decade. With the change in the dispatching mode, the storage capacity of the lower reservoir will increase by 26.4%, and the average water depth will increase by 9.63 m. When designing the contrast condition 2, the NMT hydropower station is put into operation after 10 years of operation of the MED hydropower station.
- (1)
- Sedimentation in reservoirs
The changes in the GK River thalweg during different operating years under contrast condition 2 are shown in Figure 17. The changes in the upper reservoir bottom elevation under natural condition and contrast condition 2 are shown in Figure 18.
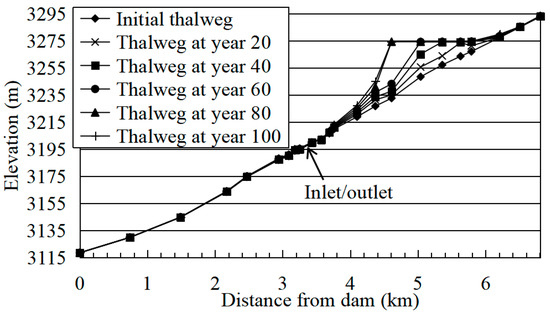
Figure 17.
Changes in GK River thalweg under contrast condition 2.
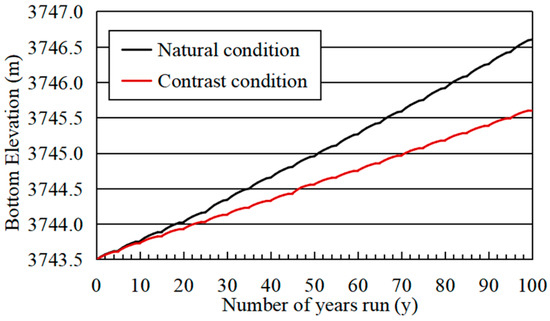
Figure 18.
Changes in the upper reservoir bottom elevation under natural condition and contrast condition 2.
As the water level in front of the dam rises, the total storage capacity and water depth in front of the dam will increase. If the inflow does not change, the velocity and sediment-carrying capacity of the flow will decrease, which will increase the siltation volume in the lower reservoir and decrease the siltation volume in the upper reservoir.
After 100 years of operation, the sedimentation thickness of the inlet/outlet section is 2.52 m, which is 83.1% lower than that of the natural condition, and the sedimentation elevation is 3202.52 m. The siltation rate of the lower reservoir is 94.7%, which is 2.5% higher than that of the natural condition. It can be seen from Figure 17 that the sediment of the GK river is still deposited in the delta pattern, gradually advancing towards the front of the dam, but the elevation of the delta top is 3274.50 m, which is 1.24 m higher than that of the natural condition. Compared with the natural condition, the main siltation site is obviously closer to the end of the reservoir, and the distance between the delta top and the dam site increases by 0.92 km. The sedimentation thickness of the upper reservoir decreases by 32.2%.
- (2)
- Sediment concentration through turbine
After 100 years of operation, the changes in average TSC at pumping time per decade under natural condition and contrast condition 2 are shown in Figure 19. The changes in daily average TSC at pumping time for the first decade under contrast condition 2 are shown in Figure 20.
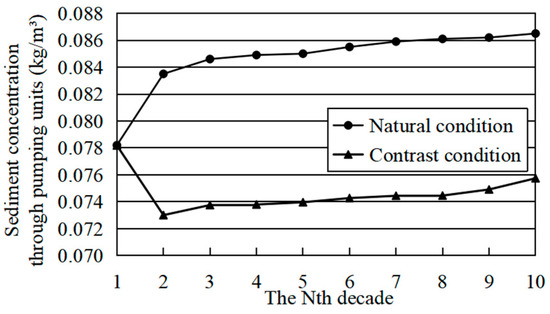
Figure 19.
Changes in TSC at pumping time in 100 years under natural condition and contrast condition 2.
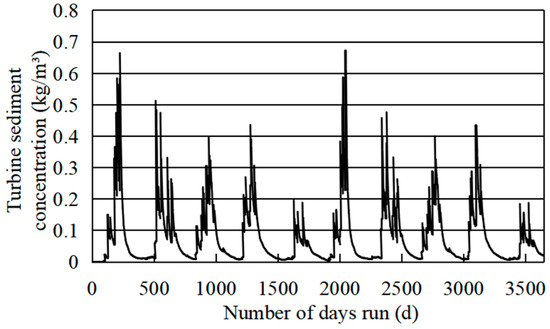
Figure 20.
Changes in daily average TSC at pumping time for the first decade under contrast condition 2.
Under the contrast condition 2, since the water level of the first 10 years of operation is consistent with the natural condition, the average TSC at pumping/power generation time per decade is the same as that of the natural condition. However, after 10 years of operation, the average water depth increases, but the inflow remains the same, which leads to a reduction in the velocity and sediment-carrying capacity, and the amount of sediment moving near the inlet/outlet decreases. Therefore, from the second decade, the average TSC at pumping time per decade will be reduced to 0.073~0.076 kg/m3, which is 12.6~13.1% lower than that of the natural condition, and the median particle size D50 of sediment through pumping units is still less than 0.006 mm.
4.3. Sensitivity Analysis of Coefficients of Sediment-Carrying Capacity Formula
Combined with the actual situation of the PSPS and Figure 6, it can be found that the variation of annual flow may result in a variation of the values of coefficients m and K. Considering the large flow rate near the inlet/outlet, a larger value of is used to obtain the values of K and m in the sensitivity analysis. After an estimate, m = 0.666 and K = 0.6 are adopted in the contrast condition 3.
- (1)
- Sedimentation in reservoirs
The changes in the GK River thalweg during different operating years under contrast condition 3 are shown in Figure 21. The changes in the upper reservoir bottom elevation under natural condition and contrast condition 3 are shown in Figure 22.
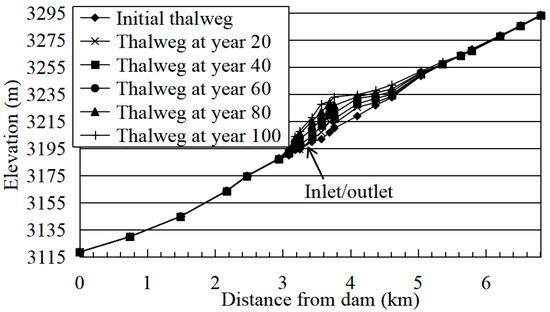
Figure 21.
Changes in GK River thalweg under contrast condition 3.
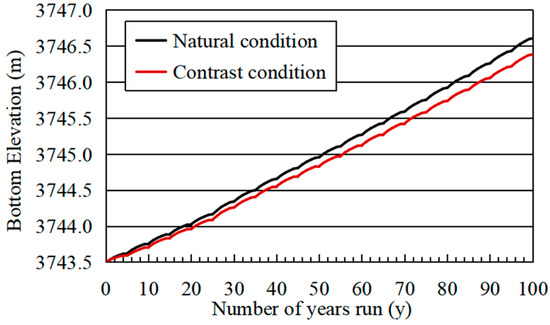
Figure 22.
Changes in the upper reservoir bottom elevation under natural condition and contrast condition 3.
After 100 years of operation, the sedimentation thickness of the inlet/outlet section is 16.18 m, which is 8.4% higher than that of the natural condition, and the sedimentation elevation is 3216.18 m. The siltation rate of the lower reservoir is 93.9%, which is 1.7% higher than that of the natural condition. It can be seen from Figure 21 that the sediment of the GK river is still deposited in the delta pattern, gradually advancing towards the front of the dam, but the elevation of the delta top is 3234.68 m, which is 2.75 m higher than that of the natural condition. Compared with the natural condition, the sedimentation thickness of the upper reservoir decreases by 7.2%.
- (2)
- Sediment concentration through turbine
After 100 years of operation, the changes in average TSC at pumping time per decade under natural condition and contrast condition 3 are shown in Figure 23. The changes in daily average TSC at pumping time for the first decade under contrast condition 3 are shown in Figure 24.
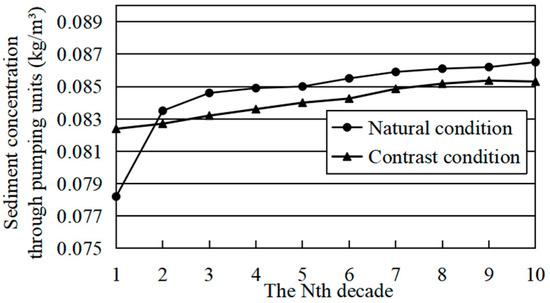
Figure 23.
Changes in TSC at pumping time in 100 years under natural condition and contrast condition 3.
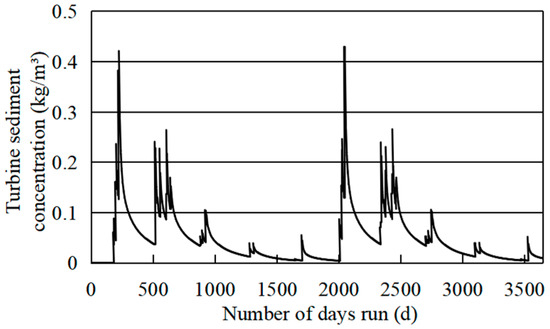
Figure 24.
Changes in daily average TSC at pumping time for the first decade under contrast condition 3.
Under the contrast condition 3, from the second decade, the average TSC at pumping time per decade will be reduced from 0.084~0.087 kg/m3 to 0.083~0.085 kg/m3, which has a 1.2~1.4% reduction, and the median particle size D50 of sediment through pumping units is still less than 0.006 mm.
Comparing the conditions, it can be found that in a certain reasonable range, the sediment-carrying capacity formula coefficients m and K have an effect on the TSC and the sedimentation forms of reservoirs but not in a significant way.
5. Conclusions
A 1D process-based mathematical model is used to study the sediment issues of a certain PSPS in this paper, and sensitivity analysis of TSC to three factors are completed, including suspended sediment gradation, the water level of the lower reservoir and the coefficient of the sediment-carrying capacity formula. The result shows the following:
- (1)
- After 100 years of operation, the sedimentation elevation near the inlet/outlet is 3214.92 m, and the siltation rate of the GK River is 92.2%. The average TSC at pumping time per decade is 0.078~0.087 kg/m3, and the median particle size D50 is less than 0.006 mm.
- (2)
- The TSC is sensitive to the use of suspended sediment gradation, it will decrease by 30.8~34.5% when the incoming sediments of particle sizes less than 0.002 mm (which accounts for 3.95% of the totality) are replaced with incoming sediments of particle sizes between 0.002 mm and 0.004 mm. At the same time, the sedimentation thickness of the upper reservoir will decrease by 20.9%, and the siltation rate of the lower reservoir will increase by 2.4%.
- (3)
- The TSC is sensitive to the water level of the lower reservoir, and it will decrease by 12.6~13.1% as the water level of the lower reservoir rises by 17.55 m. This represents an increase of 8.4% in average water depth and 26.4% in storage capacity. At the same time, the sedimentation thickness of the upper reservoir will decrease by 32.2%, and the siltation rate of the lower reservoir will increase by 2.5%.
- (4)
- In the case of reasonable coefficient values, the TSC is insensitive to the coefficients of the sediment-carrying capacity formula. It will increase by 1.2~1.4%, as the coefficient of the sediment-carrying capacity formula m changes from 1.12 to 0.666 or the index of the sediment-carrying capacity formula K changes from 0.2 to 0.6. At the same time, the sedimentation thickness of the upper reservoir will decrease by 7.2%, and the siltation rate of the lower reservoir will increase by 1.7%.
Through the research on the sensitivity of the TSC, the prediction method system of the TSC is supplemented. Meanwhile, the results remind researchers to pay more attention to the determination of boundary conditions and also provide a basis for an error analysis of the TSC. In summary, the results have certain guiding significance for related research work, and the sensitivity analysis results of the case could provide a reference for other specific projects.
Author Contributions
Writing—original draft, C.L.; visualization, C.L.; data curation, C.L.; formal analysis, C.L. and M.Y.; validation, M.Y. and X.H.; investigation, C.L. and M.Y.; conceptualization, M.Y.; funding acquisition M.Y.; supervision, M.Y., K.W. and Y.S.; project administration, M.Y.; resources, X.H., K.W. and Y.S.; software, X.H.; methodology, X.H.; writing—review & editing, K.W. and Y.S. All authors have read and agreed to the published version of the manuscript.
Funding
This research was funded by National Natural Science Foundation of China (Grant No. 11972265, 12372385).
Acknowledgments
The authors are grateful for Power China HuaDong Engineering Corporation for the data support.
Conflicts of Interest
The authors declare no conflict of interest.
References
- Lu, Y.M.; Pan, J.Z. Pumped Storage Power Station; Water Conservancy and Electric Power Press: Beijing, China, 1992; Volume 4. [Google Scholar]
- Zhao, J.-F.; Oh, U.-J.; Park, J.-C.; Park, E.S.; Im, H.-B.; Lee, K.Y.; Choi, J.-S. A Review of World-wide Advanced Pumped Storage Hydropower Technologies. IFAC-Pap. OnLine 2022, 55, 170–174. [Google Scholar] [CrossRef]
- Zeng, M.; Feng, J.J.; Xue, S.; Wang, Z.J.; Zhu, X.L.; Wang, Y.J. Development of China’s pumped storage plant and related policy analysis. Energy Policy 2013, 61, 104–113. [Google Scholar]
- Chen, C.J.; Zhang, Z.; Yi, Y. Analysis of Pu Shihe pumped storage power station sediment issues. Hydrol. Sci. Technol. Inf. 1997, 14, 11–16. [Google Scholar]
- Li, Q.H. A preliminary study on the effect of sediment on turbine wear in Dateng Gorge. Water Resour. Hydropower Northeast. China 1998, 1, 5–8. [Google Scholar]
- Zhang, F.; Ni, J.B.; Liu, R. Unit stability analysis for Jixi pumped-storage hydropower station. J. Hydroelectr. Eng. 2021, 40, 112–123. [Google Scholar]
- Zhang, C.L.; Zhu, H.H.; Zhong, W.Q.; Huang, Z.M. Experimental research on inlet/outlet hydraulics of pump storage power plants. J. Hydroelectr. Eng. 2005, 24, 60–63. [Google Scholar]
- Xi, W.Y.; Liu, X.; Zhao, H.J.; Zhang, Y.H. Study on the Prediction of Sediment Passing Through Turbine of Weifang Pumped-storage Power Station. Water Power 2021, 47, 14–17. [Google Scholar]
- Müller, M.; De Cesare, G.; Schleiss, A.J. Continuous Long-Term Observation of Suspended Sediment Transport between Two Pumped-Storage Reservoirs. J. Hydraul. Eng. 2014, 140, 5. [Google Scholar] [CrossRef]
- Schleiss, A.J.; Franca, M.J.; Juez, C.; De Cesare, G. Reservoir sedimentation. J. Hydraul. Res. 2016, 54, 595–614. [Google Scholar] [CrossRef]
- Wei, H.Y.; Xu, Q.M.; Yu, M.H. Numerical simulation of sediment management for pumped storage power station. J. Hydroelectr. Eng. 2015, 34, 91–97, 117. [Google Scholar]
- Pourzangbar, A.; Brocchini, M. A new process-based, wave-resolving, 2DH circulation model for the evolution of natural sand bars: The role of nearbed dynamics and suspended sediment transport. Coast. Eng. 2022, 177, 104192. [Google Scholar] [CrossRef]
- Bonalumi, M.; Anselmetti, F.S.; Kaegi, R.; Wüest, A. Particle dynamics in high-Alpine proglacial reservoirs modified by pumped-storage operation. Water Resour. Res. 2011, 47, W09523. [Google Scholar] [CrossRef]
- Chen, J.; Liu, Q.; Li, X.; Fu, X. Application of mathematical model on deposition study of pumped-storage power reservoir. Proc. Inst. Civ. Eng. Water Manag. 2022, 175, 311–323. [Google Scholar] [CrossRef]
- Wu, T.; Wei, Z.L.; Zhan, Y.Z. Prediction method of overflow sediment in pumped storage power station. Hongshui River 2004, 23, 78–81. [Google Scholar]
- Zhang, Y.; Wang, Y.H.; Zhang, S.L.; Zhang, Q.J. Influence of Imported Water and Sediment on the Sediment Concentration in a Pumped Storage Power Station. Pearl River 2018, 39, 45–49. [Google Scholar]
- Yang, G.L.; Wu, W.M.; Chen, Z.H.; Yang, P.Y.; Ling, W.P. SUSBED-1 movable bed modeling of graded sediments. J. Hydraul. Eng. 1994, 4, 1–10. [Google Scholar]
- Han, Q.W. A study of the non-equilibrium transportation of non-uniform suspended load. Chin. Sci. Bull. 1979, 17, 804–808. [Google Scholar]
- Zhang, R.J. River Dynamics; China Water Power Press: Beijing, China, 1998; pp. 182–186. [Google Scholar]
- Chen, H.; Zhu, L.J.; Wang, J.Z.; Fan, H.X. A review of classification methods of bedding sand and catharsis. J. Sediment Res. 2016, 4, 74–80. [Google Scholar] [CrossRef]
- Han, Q.W. Reservoir Sedimentation; Science Press: Beijing, China, 2003; pp. 70–81. [Google Scholar]
- Qian, N. A description of the concepts of bedding sand and catharsis. J. Hydraul. Eng. 1957, 1, 38–40. [Google Scholar]
- Li, Y.T. Study on two-dimensional sediment mathematical model of river plane. J. Hydraul. Eng. 1989, 2, 26–35. [Google Scholar]
- Wang, Z.; Dittrich, A. A study on problems in suspended sediment transportation. In Proceedings of the Second International Conference on Hydraulics and Environmental Modelling of Coastal, Estuarine and River Waters, Ashgate, UK, 22–24 September 1992. [Google Scholar]
Disclaimer/Publisher’s Note: The statements, opinions and data contained in all publications are solely those of the individual author(s) and contributor(s) and not of MDPI and/or the editor(s). MDPI and/or the editor(s) disclaim responsibility for any injury to people or property resulting from any ideas, methods, instructions or products referred to in the content. |
© 2023 by the authors. Licensee MDPI, Basel, Switzerland. This article is an open access article distributed under the terms and conditions of the Creative Commons Attribution (CC BY) license (https://creativecommons.org/licenses/by/4.0/).