


Assessing the Water–Energy–Food Nexus and Resource Sustainability in the Ardabil Plain: A System Dynamics and HWA Approach

 ,
,  ,
, 
 and
and
Abstract
:1. Introduction
2. Methods and Data
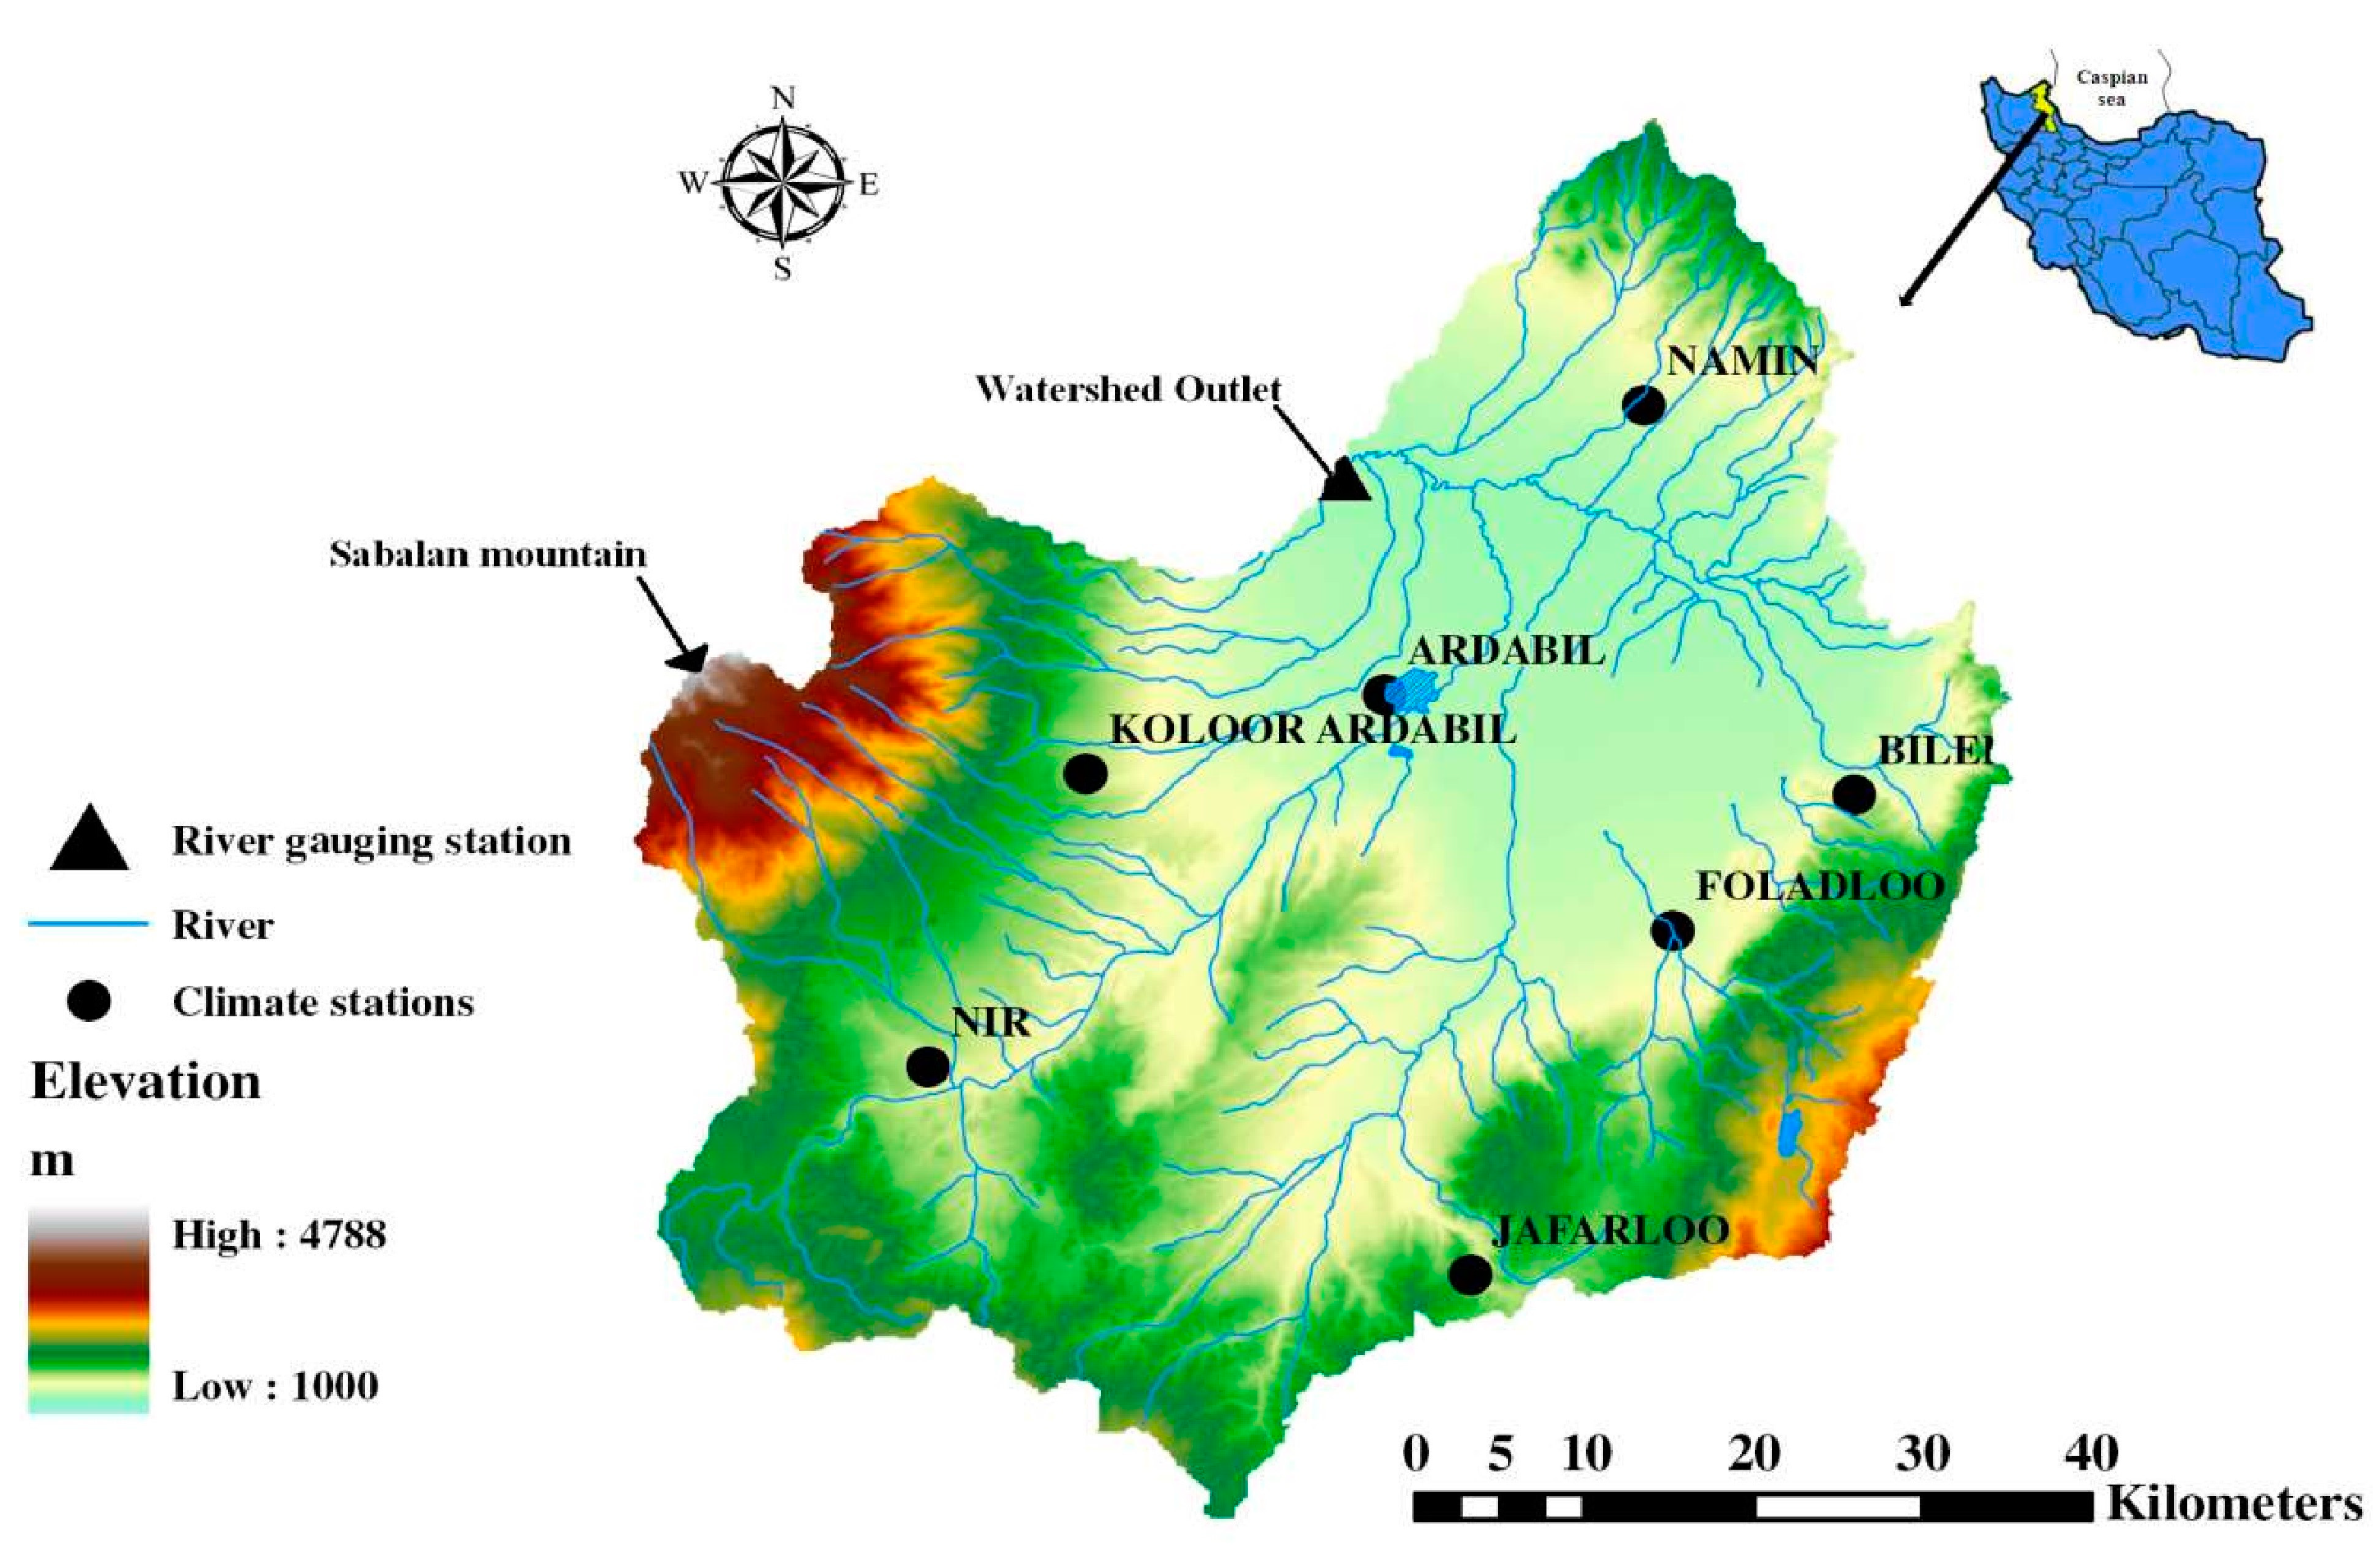
2.1. Case Study
2.2. Methods
2.2.1. Causal Loop Diagrams (CLD)
2.2.2. System Dynamic Model (SDM)
2.2.3. HWA Method
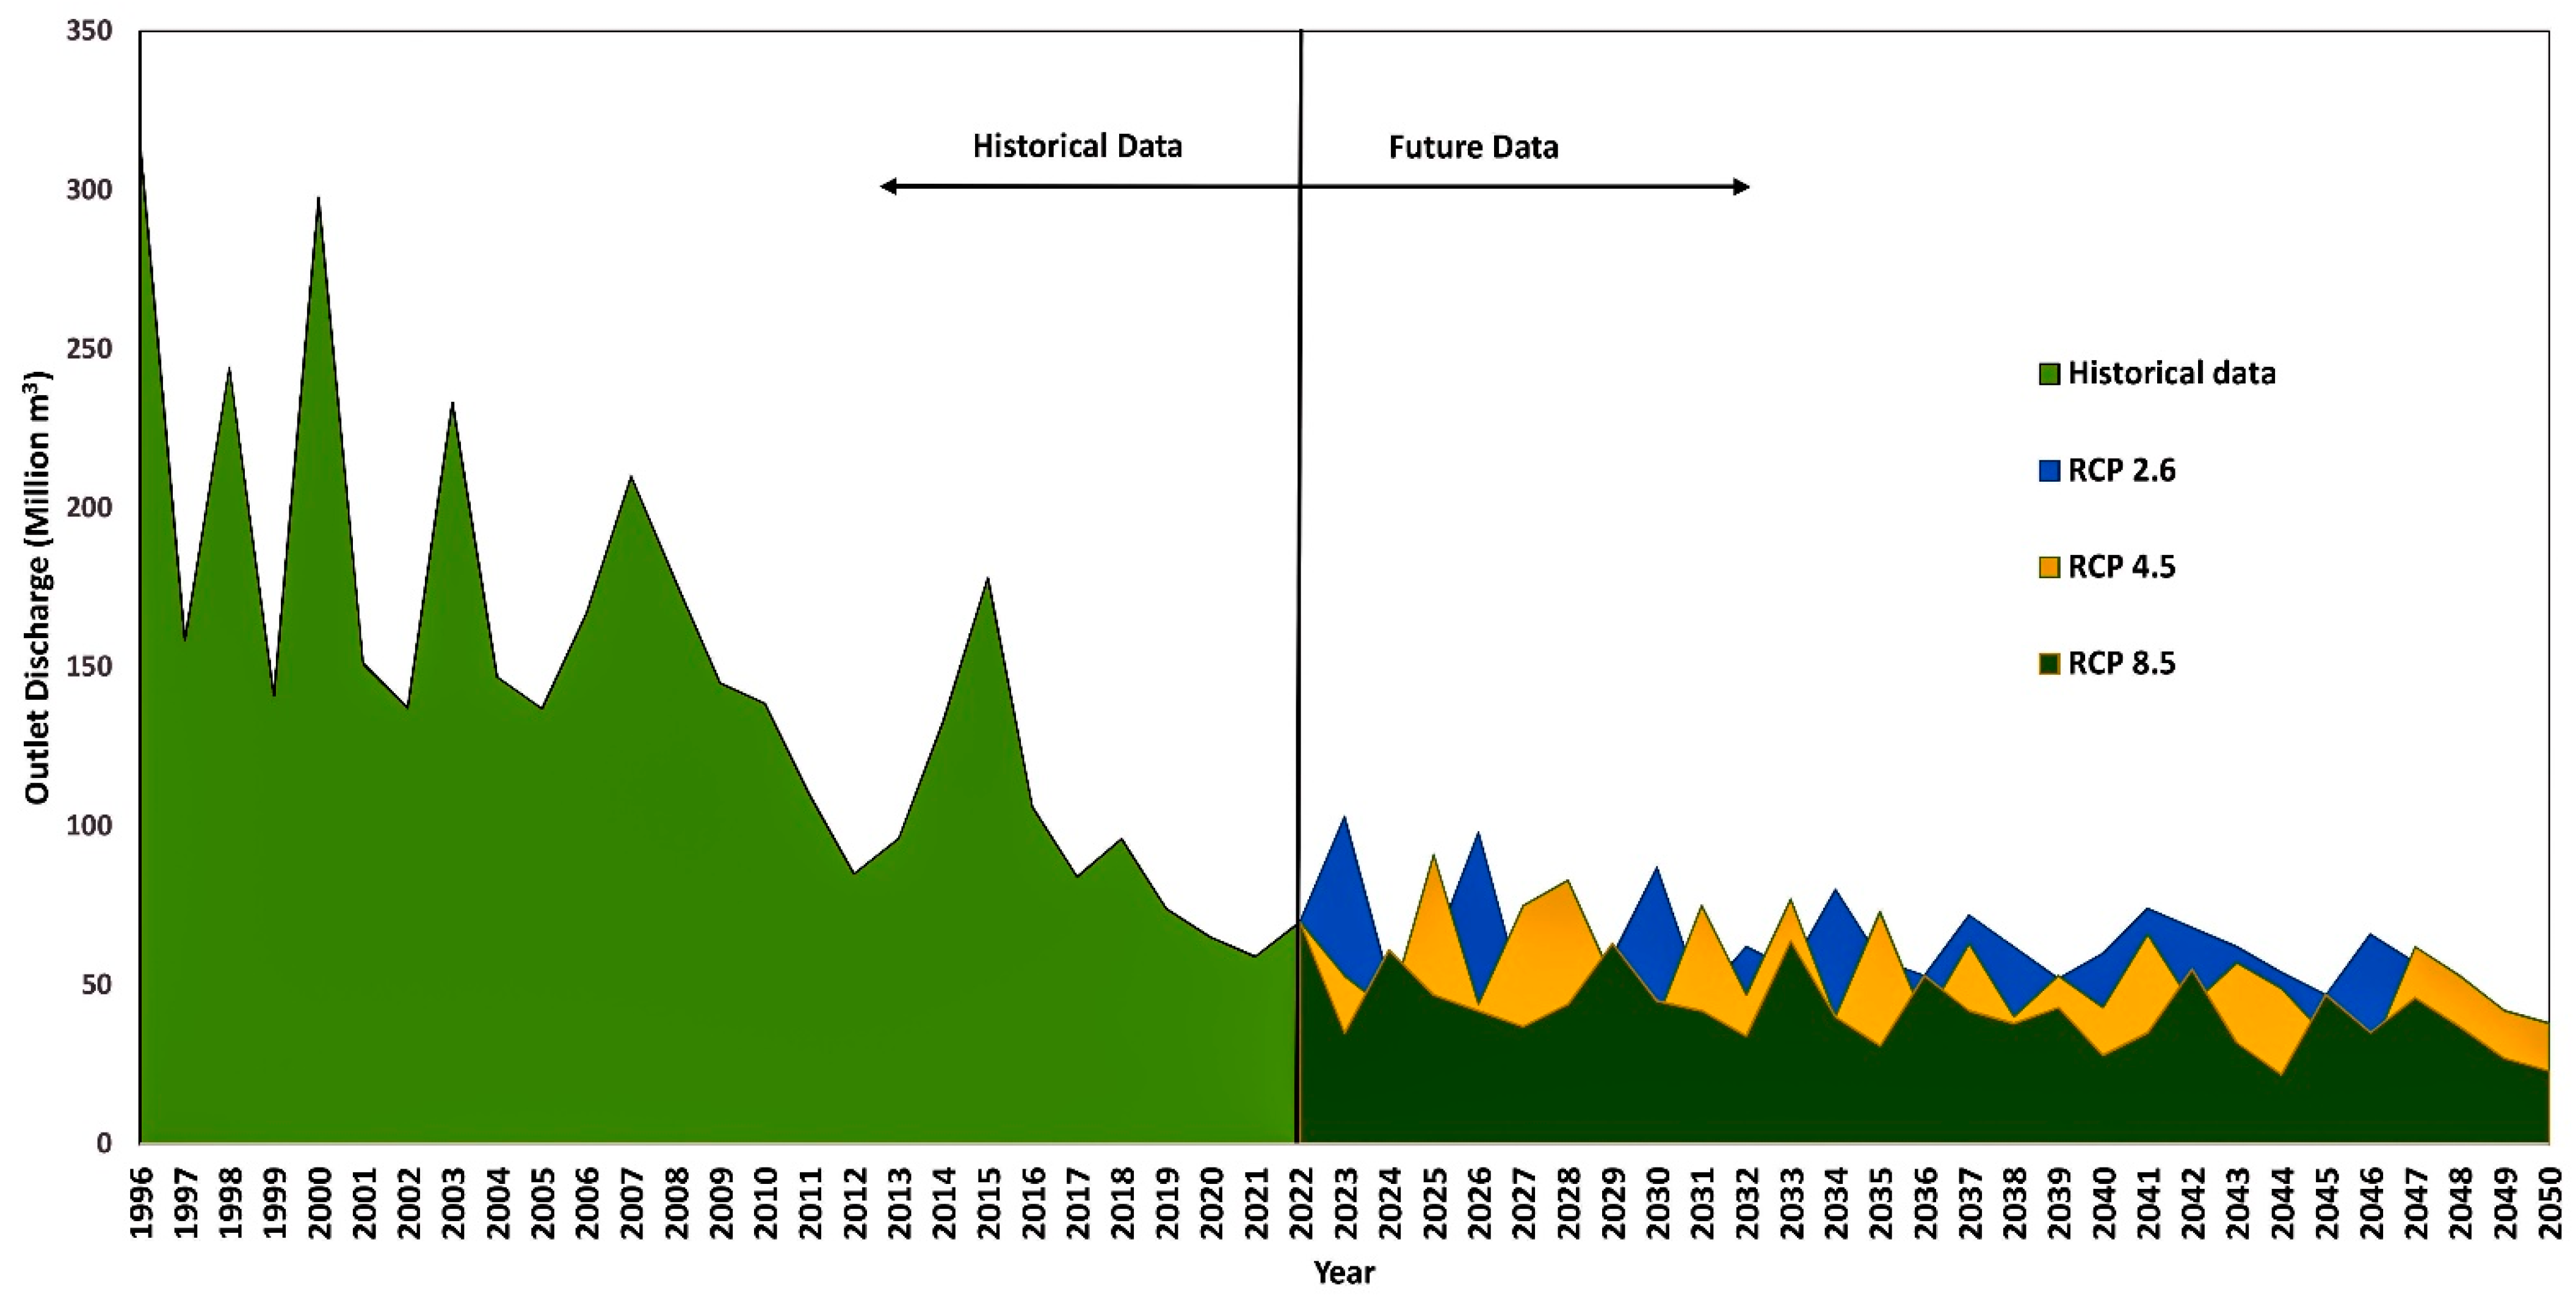
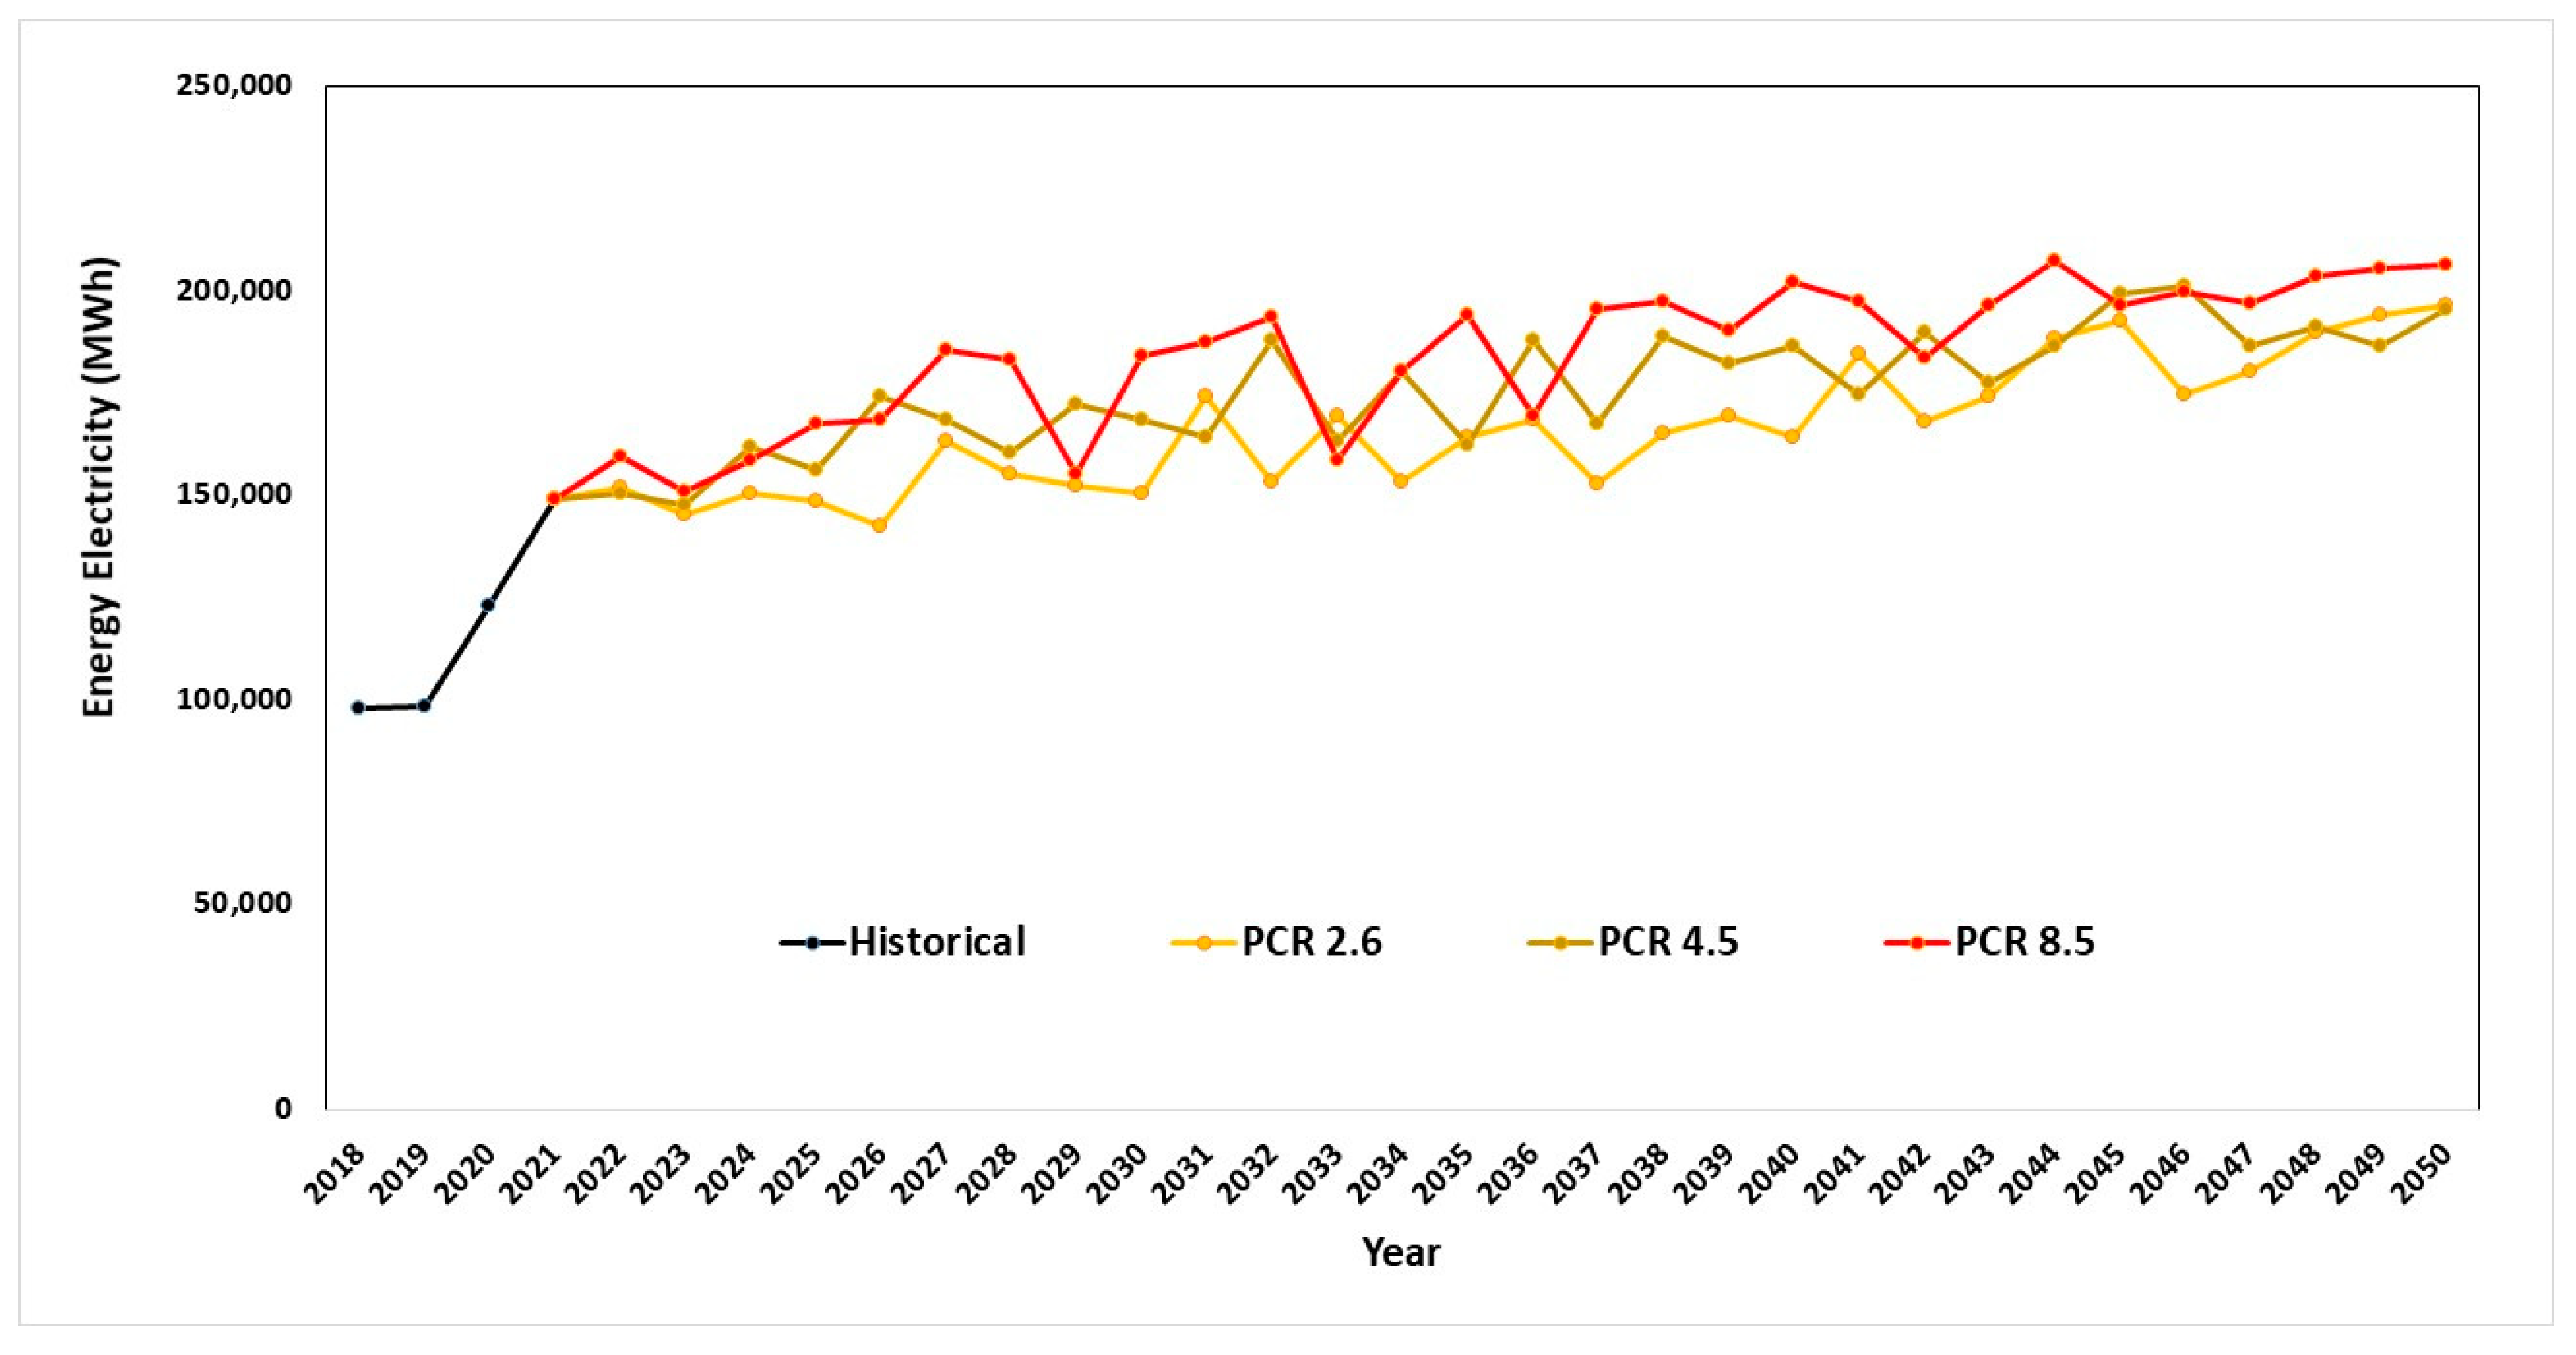
2.2.4. Climate Change Scenarios
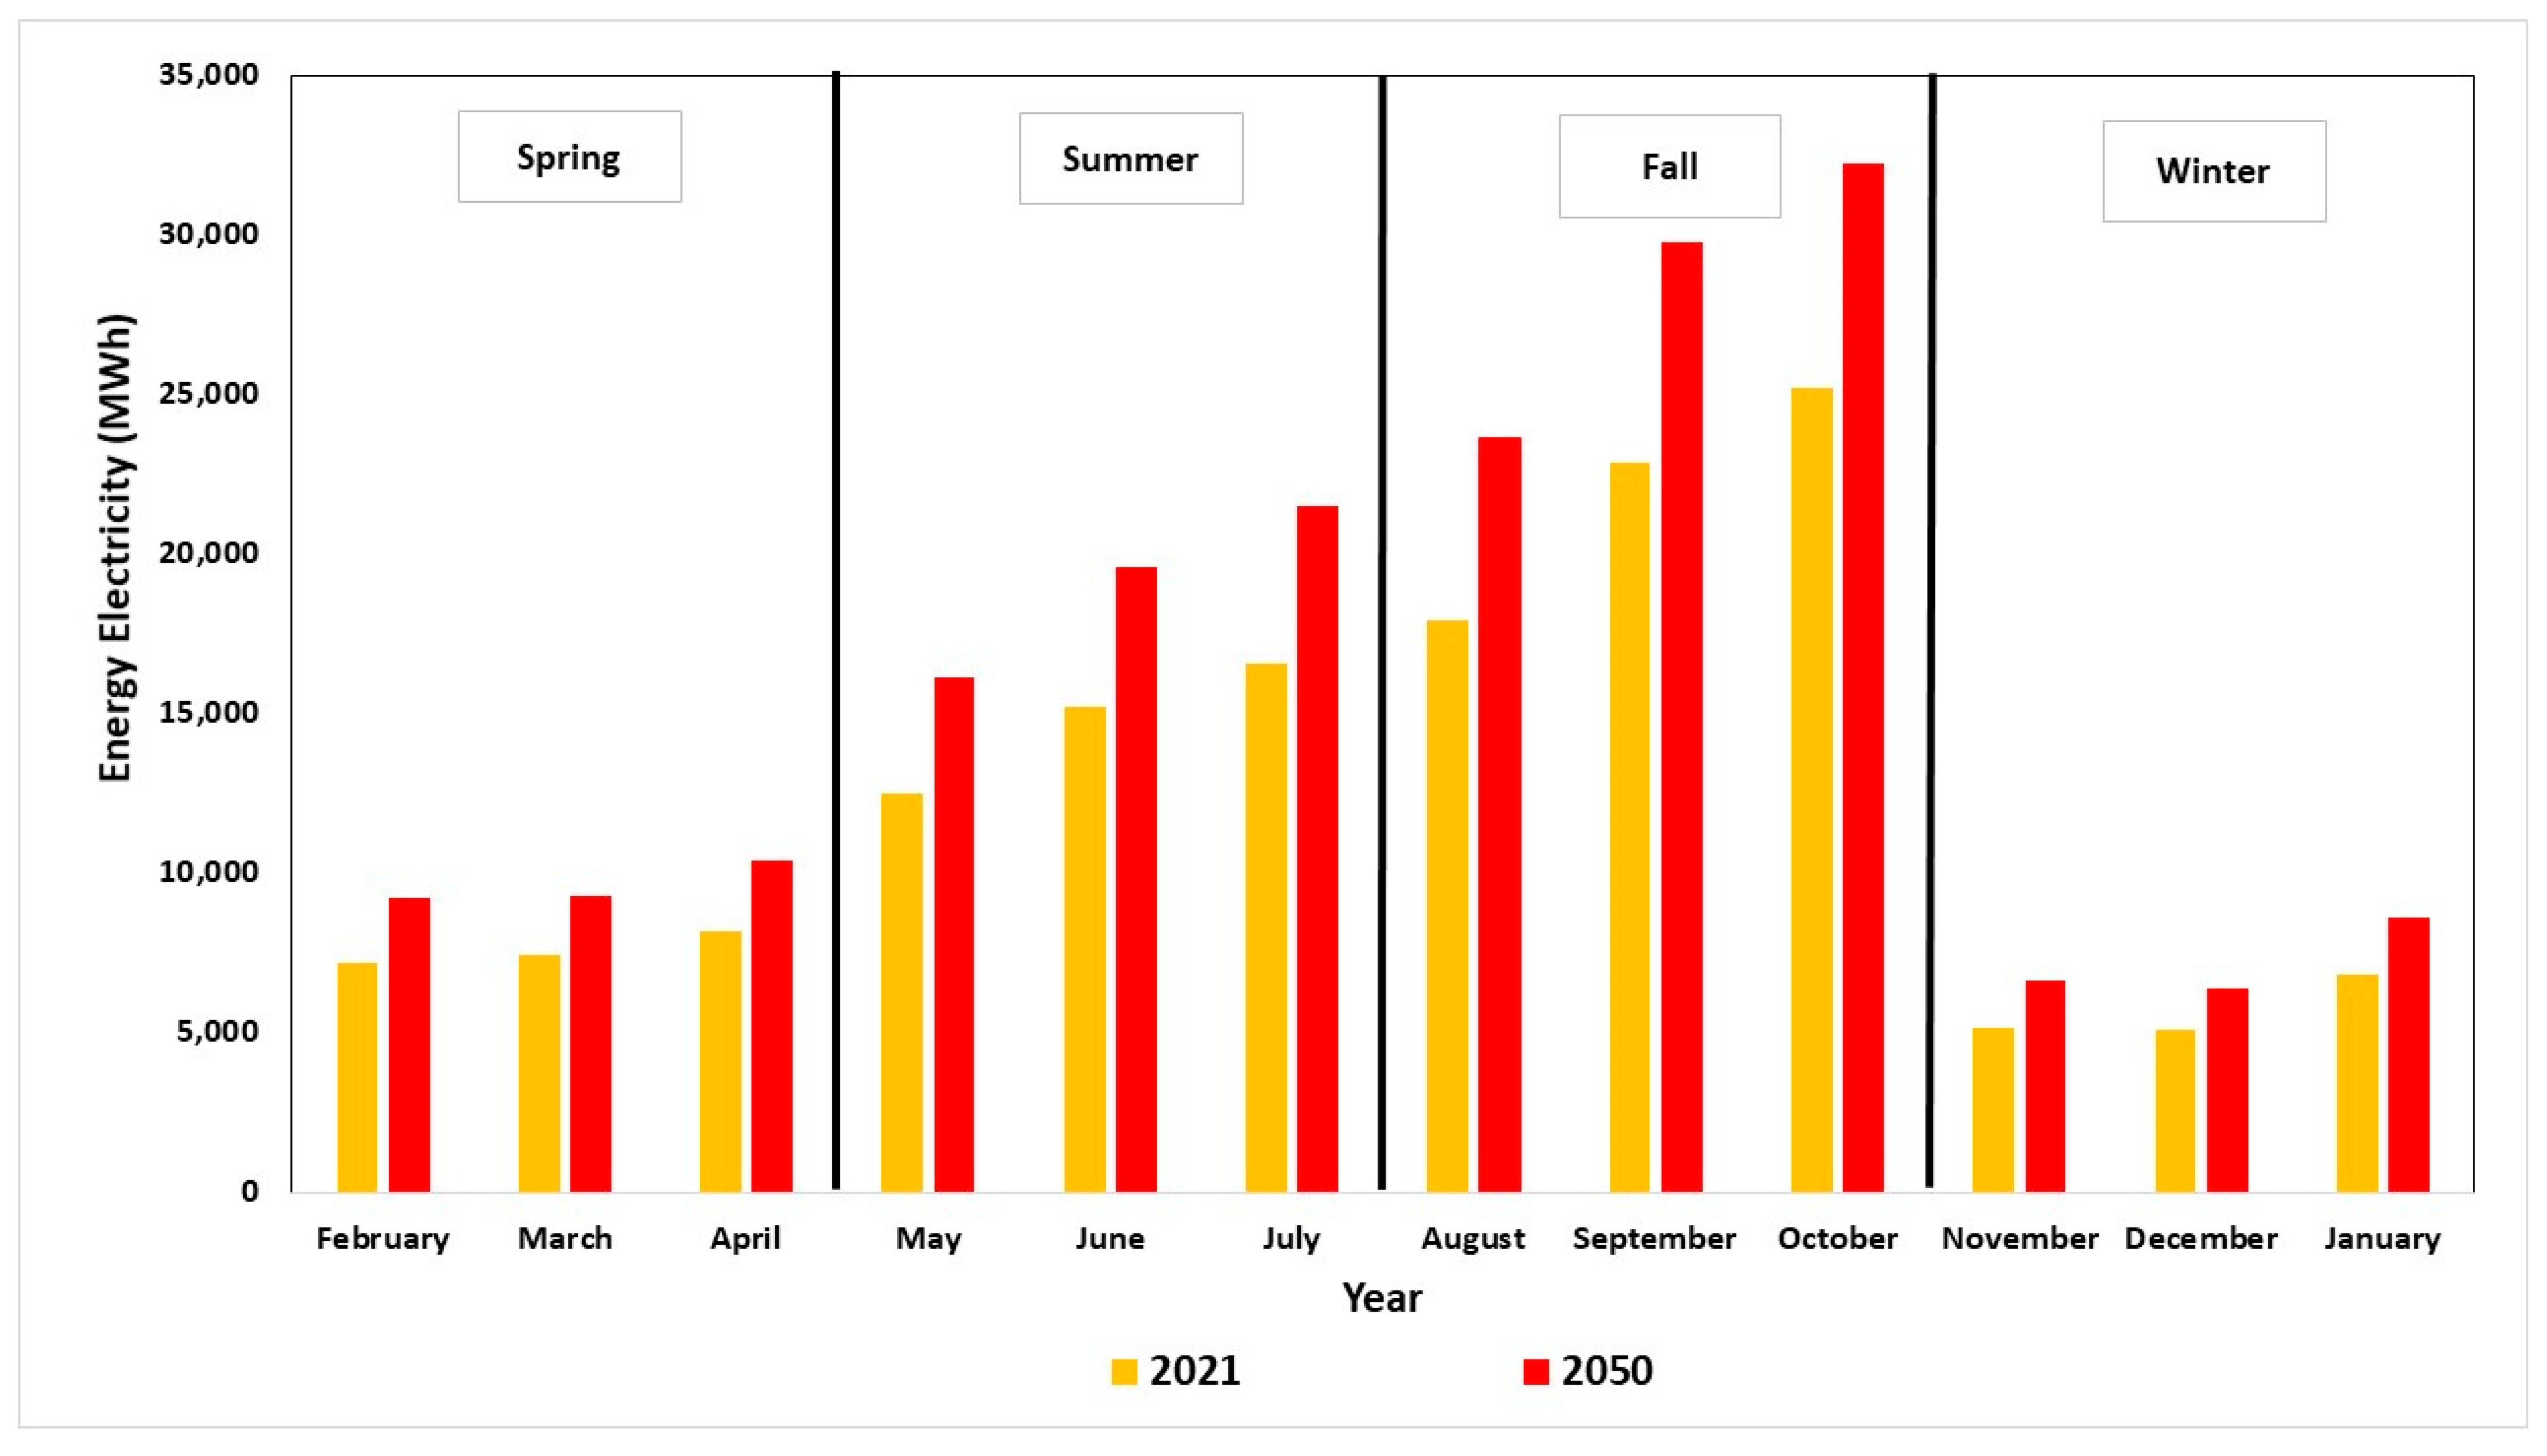
2.2.5. Data
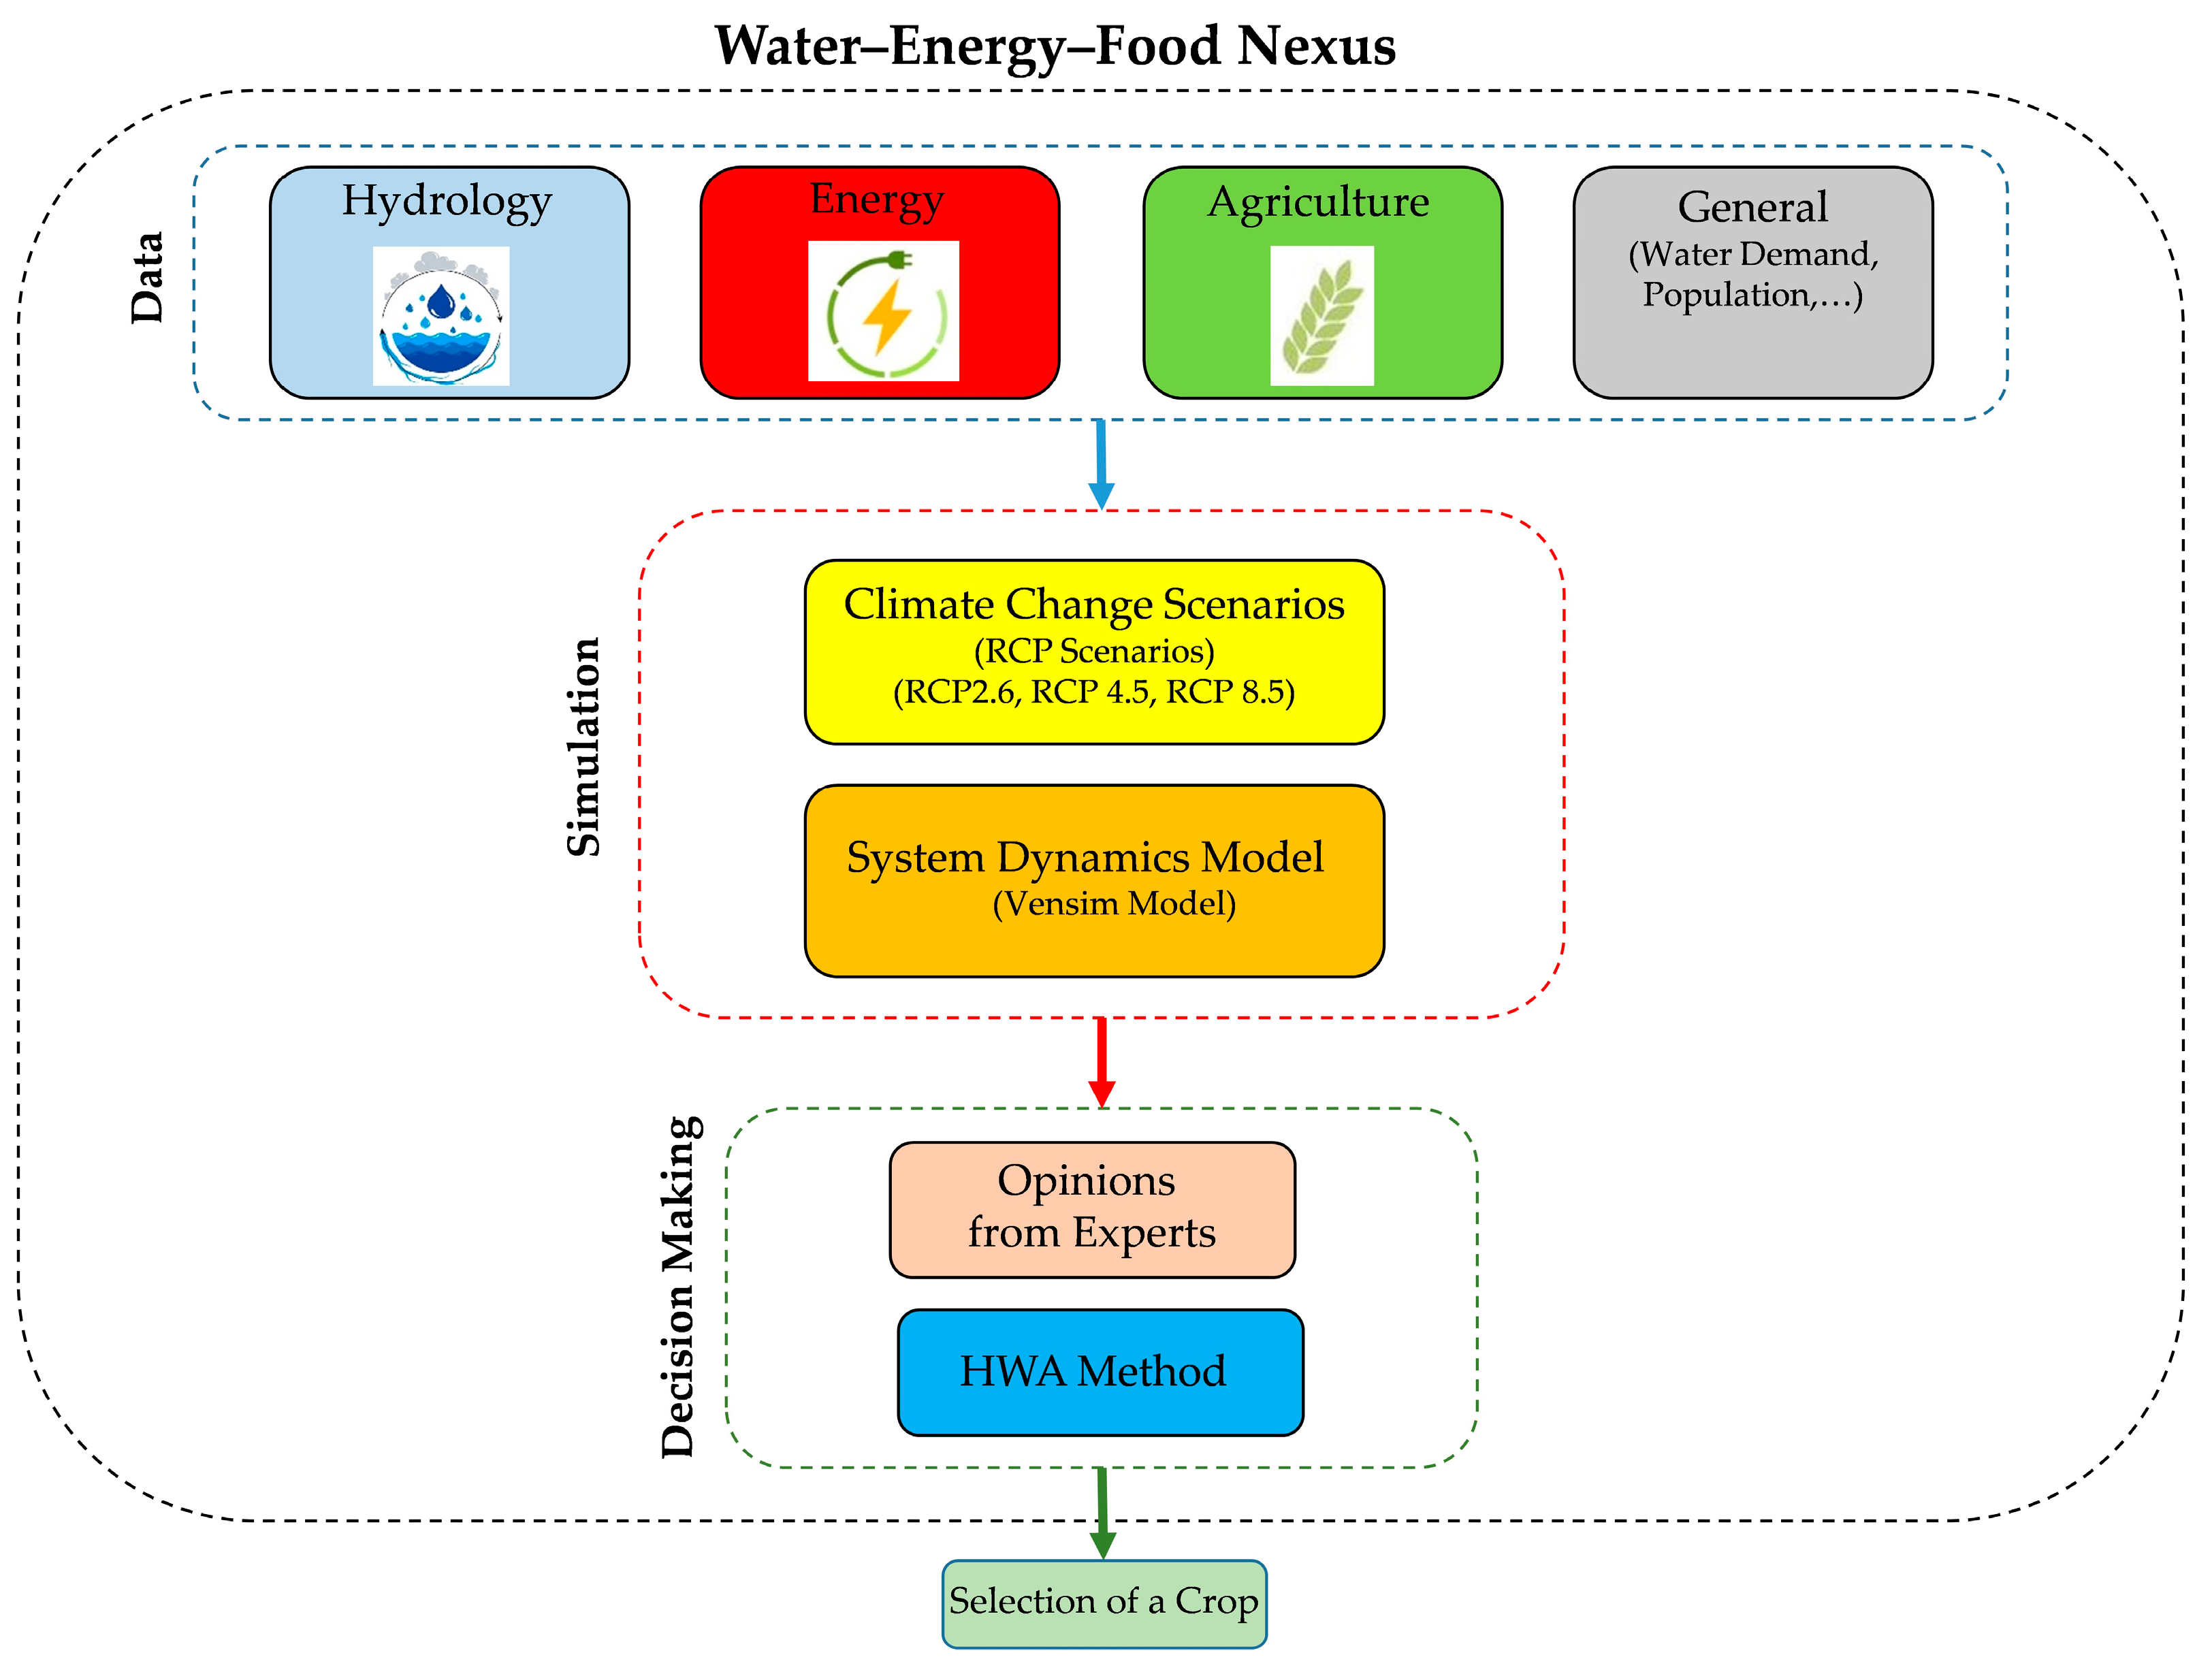
2.3. Research Framework
3. Results and Discussion
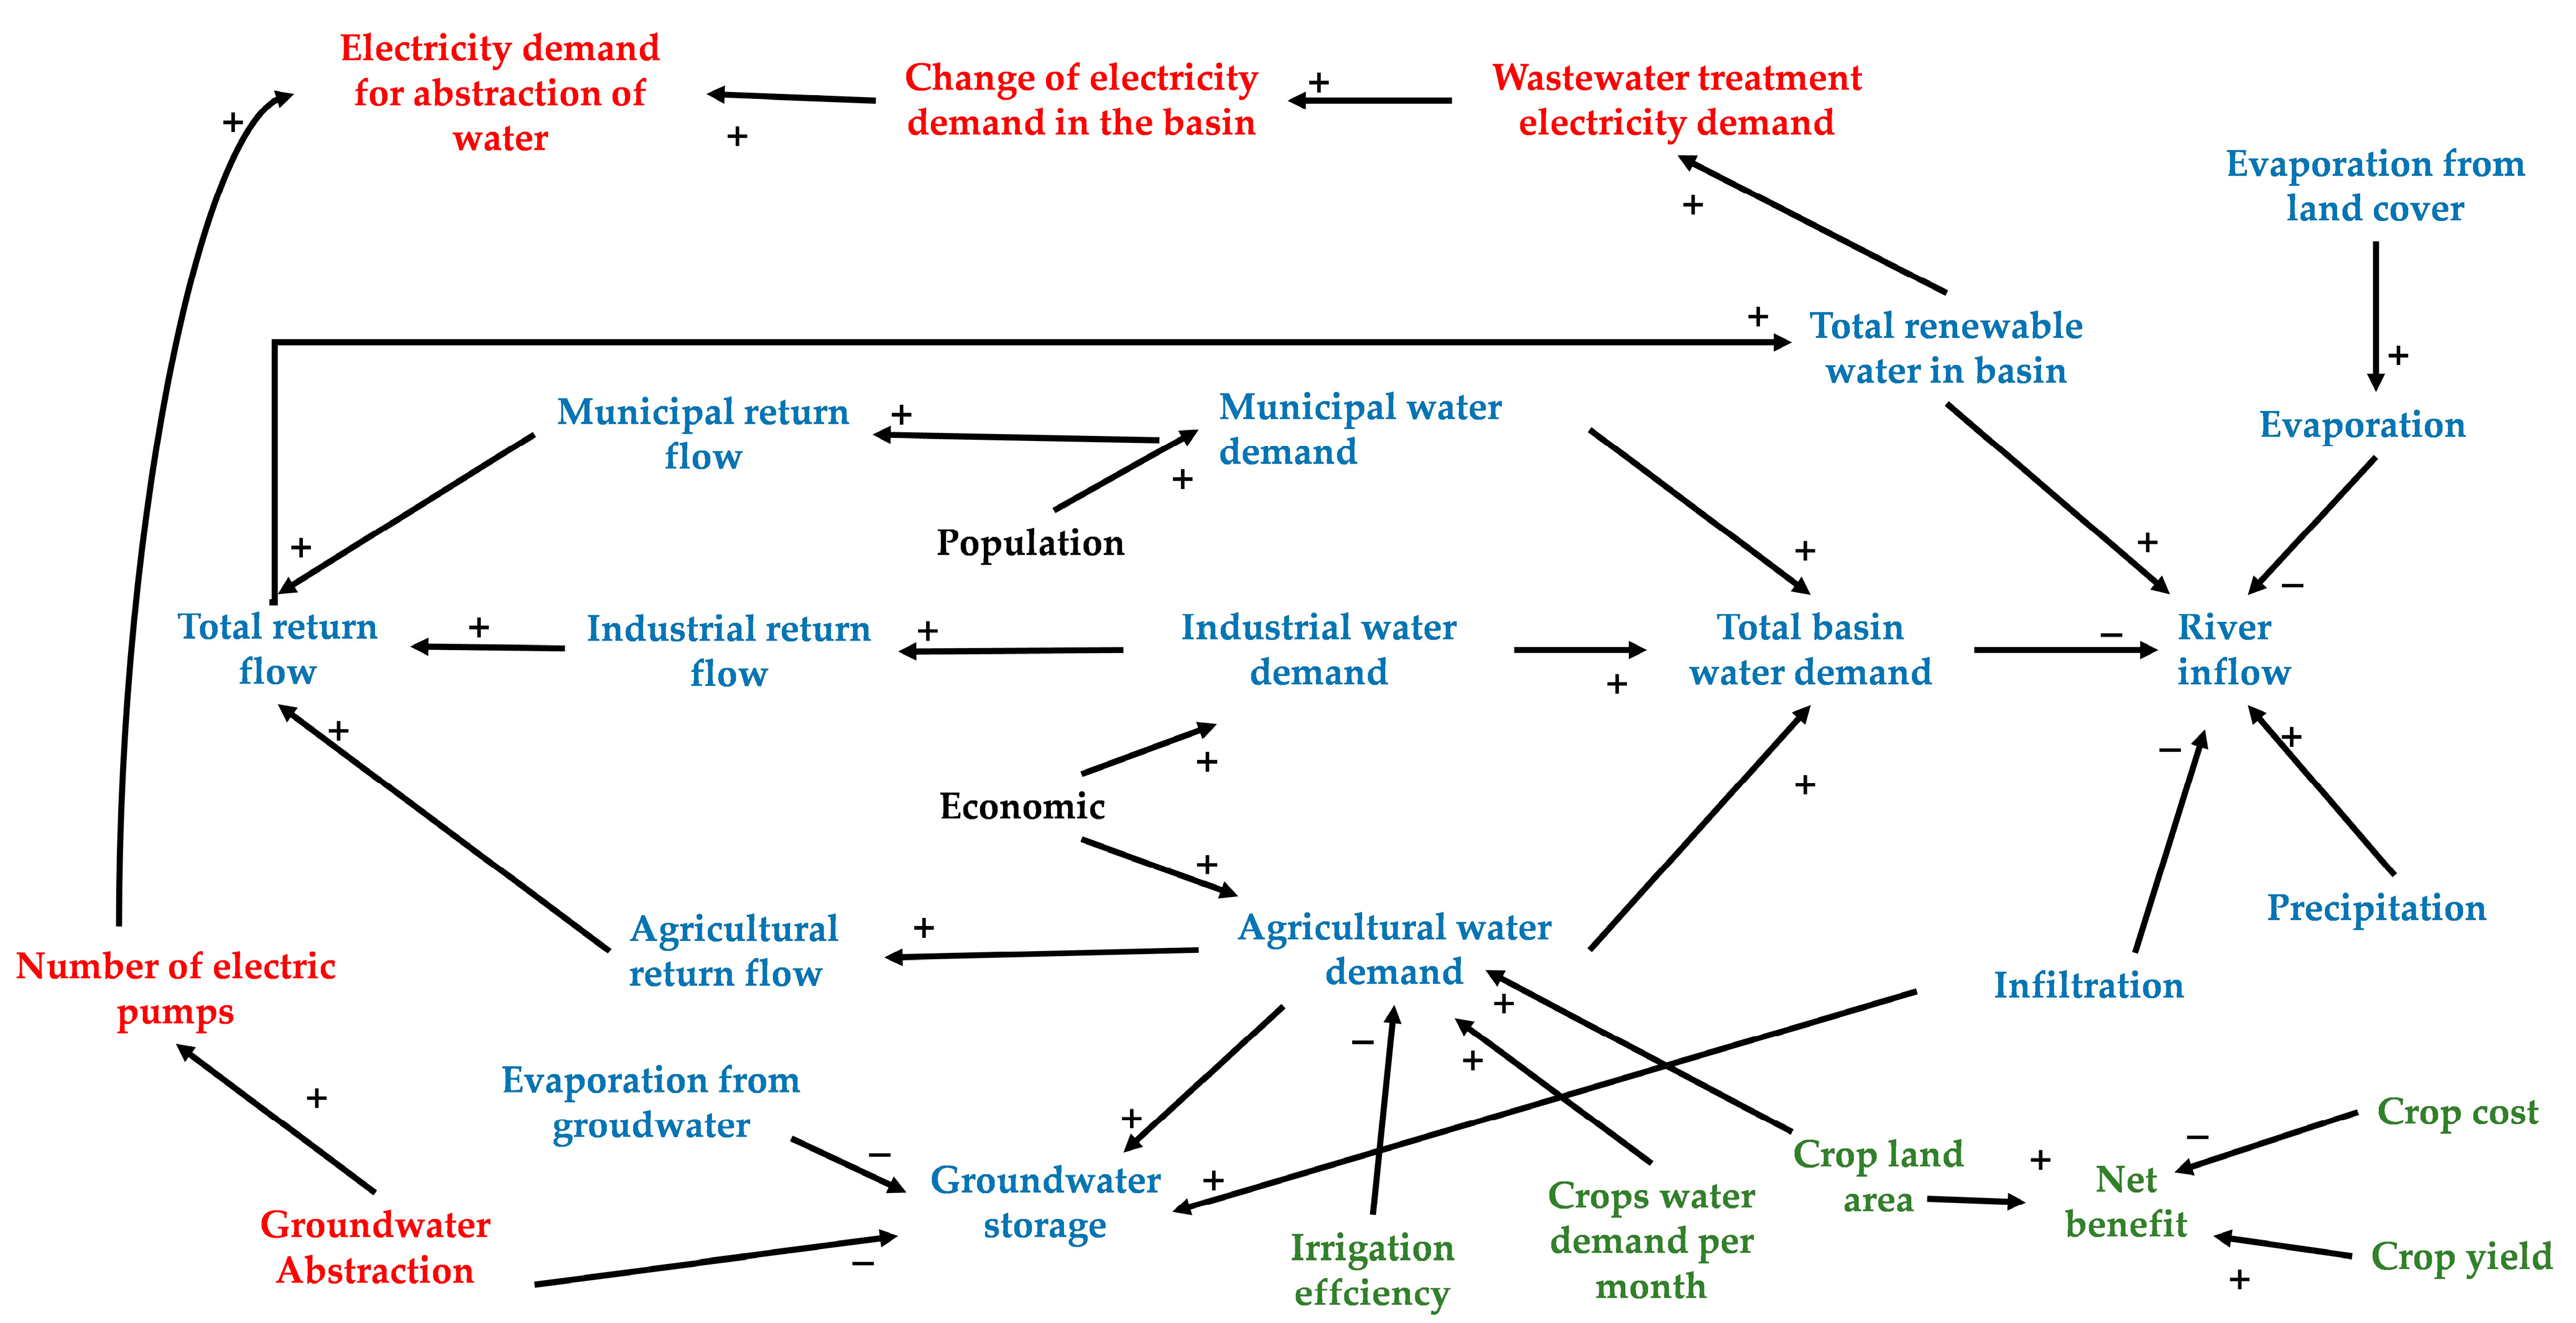
3.1. Developed Conceptual and CLD Models
3.2. Developed SFD Model
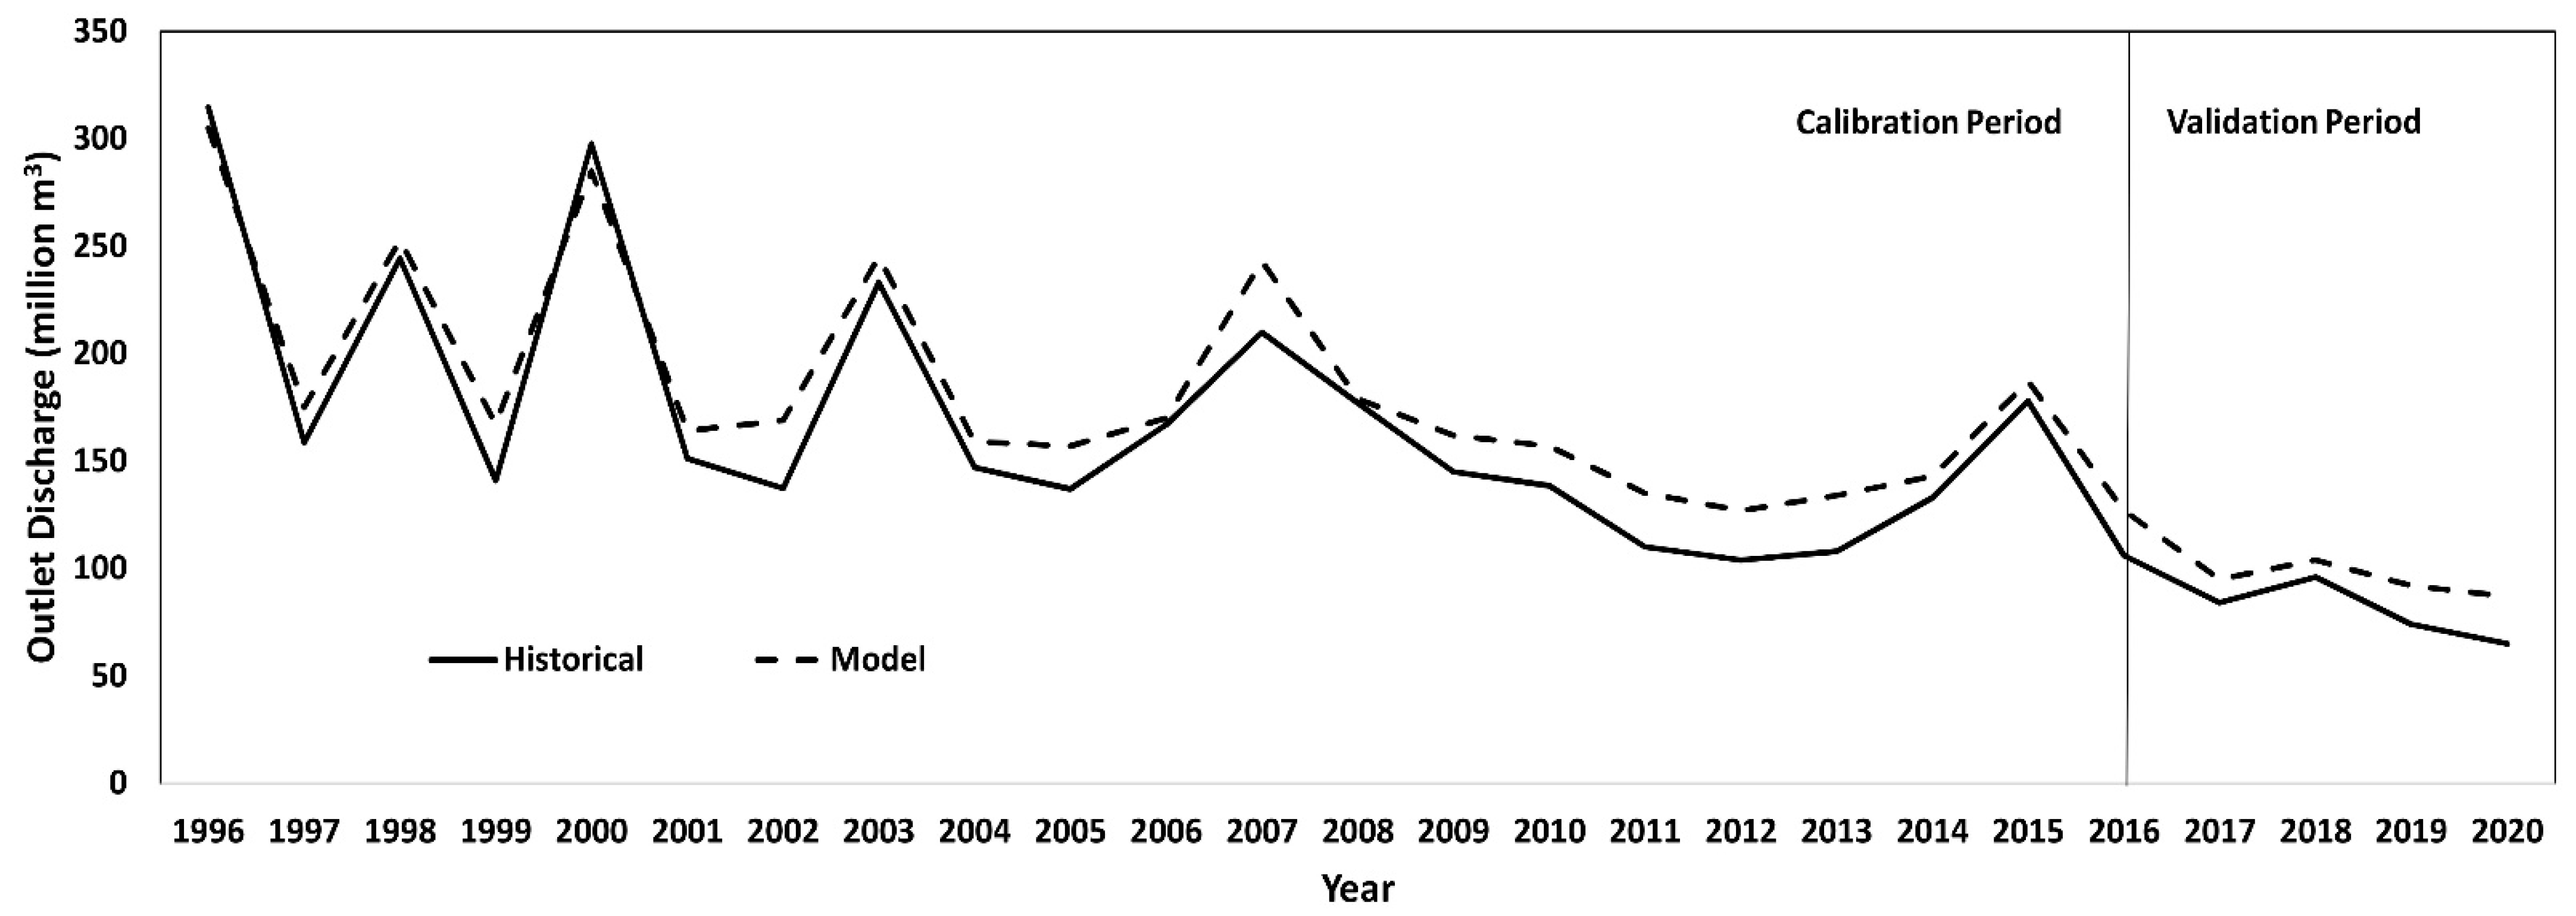
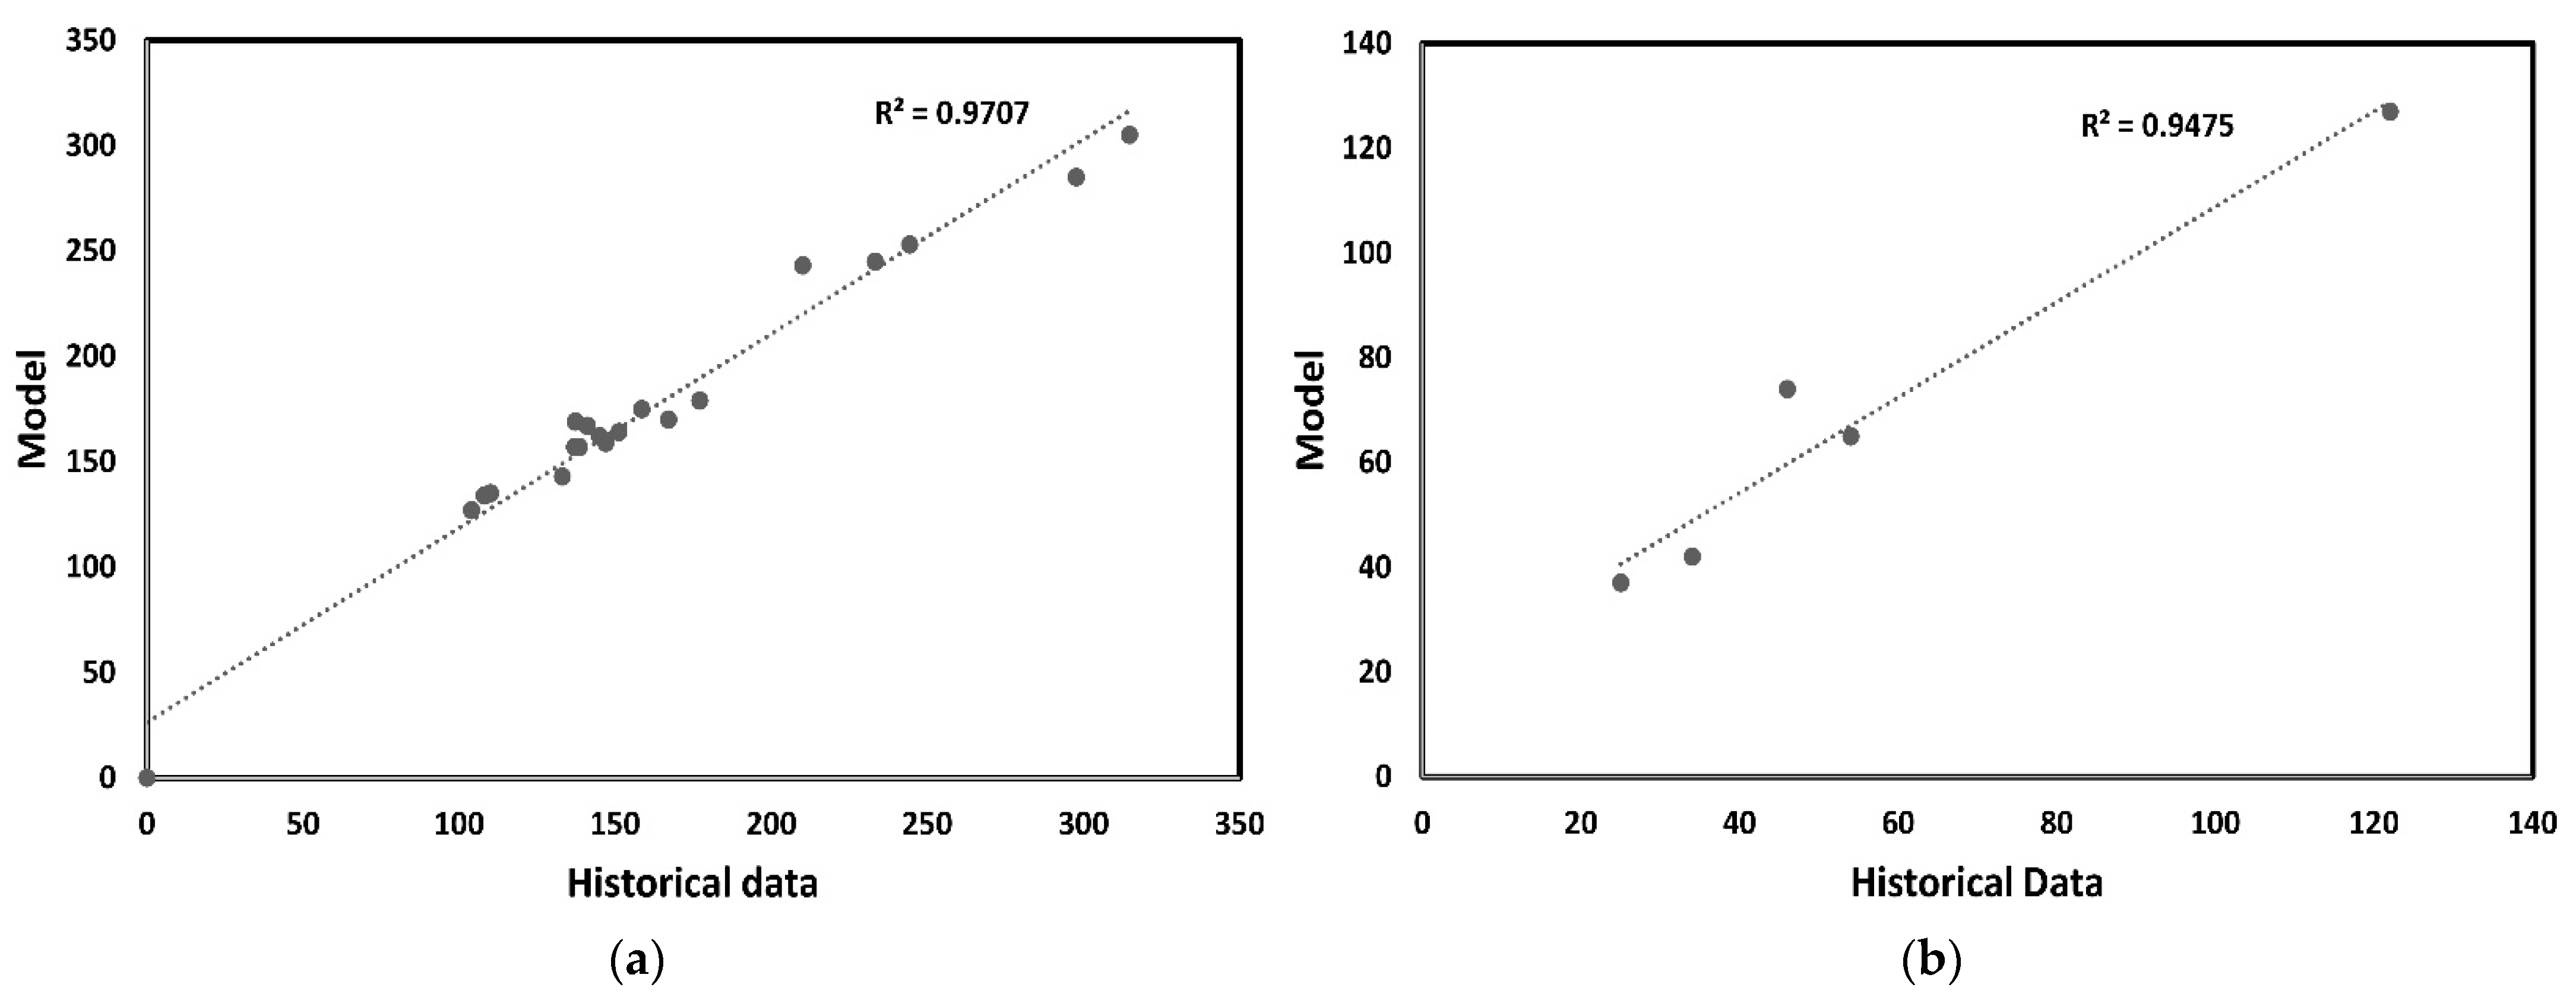
3.3. Calibration and Validation SDM
3.4. Decision Making for Selection of a Crop Production in the Future
4. Conclusions
Author Contributions
Funding
Data Availability Statement
Conflicts of Interest
References
- FAO. The Water-Energy-Food Nexus: A New Approach in Support of Food Security and Sustainable Agriculture; The Food and Agricultural Organisation of the United Nations: Rome, Italy, 2014. [Google Scholar]
- Zhang, X.; Li, H.-Y.; Deng, Z.D.; Ringler, C.; Gao, Y.; Hejazi, M.I.; Leung, L.R. Impacts of climate change, policy and Water-Energy-Food nexus on hydropower development. Renew. Energy 2018, 116, 827–834. [Google Scholar] [CrossRef]
- Pardoe, J.; Conway, D.; Namaganda, E.; Vincent, K.; Dougill, A.J.; Kashaigili, J.J. Climate change and the water–energy–food nexus: Insights from policy and practice in Tanzania. Clim. Policy 2018, 18, 863–877. [Google Scholar] [CrossRef]
- Al-Saidi, M.; Hussein, H. The water-energy-food nexus and COVID-19: Towards a systematization of impacts and responses. Sci. Total Environ. 2021, 779, 146529. [Google Scholar] [CrossRef]
- Lawford, R.G. A design for a data and information service to address the knowledge needs of the Water-Energy-Food (WEF) Nexus and strategies to facilitate its implementation. Front. Environ. Sci. 2019, 7, 56. [Google Scholar] [CrossRef]
- Hamidov, A.; Daedlow, K.; Webber, H.; Hussein, H.; Abdurahmanov, I.; Dolidudko, A.; Seerat, A.Y.; Solieva, U.; Woldeyohanes, T.; Helming, K. Operationalizing water-energy-food nexus research for sustainable development in social-ecological systems: An interdisciplinary learning case in Central Asia. Ecol. Soc. 2022, 27, 1. [Google Scholar] [CrossRef]
- Liu, J.; Yang, H.; Cudennec, C.; Gain, A.K.; Hoff, H.; Lawford, R.; Qi, J.; Strasser, L.D.; Yillia, P.; Zheng, C. Challenges in operationalizing the water–energy–food nexus. Hydrol. Sci. J. 2017, 62, 1714–1720. [Google Scholar] [CrossRef]
- McCarl, B.A.; Yang, Y.; Schwabe, K.; Engel, B.A.; Mondal, A.H.; Ringler, C.; Pistikopoulos, E.N. Model use in WEF nexus analysis: A review of issues. Curr. Sustain. Renew. Energy Rep. 2017, 4, 144–152. [Google Scholar] [CrossRef]
- Bazilian, M.; Rogner, H.; Howells, M.; Hermann, S.; Arent, D.; Gielen, D.; Steduto, P.; Mueller, A.; Komor, P.; Tol, R.S. Considering the energy, water and food nexus: Towards an integrated modelling approach. Energy Policy 2011, 39, 7896–7906. [Google Scholar] [CrossRef]
- Grigg, N.; Foran, T.; Darbas, T.; Kirby, M.; Colloff, M.J.; Ahmad, M.-U.-D.; Podger, G. The water–food–energy nexus in Pakistan: A biophysical and socio-economic challenge. Proc. Int. Assoc. Hydrol. Sci. 2018, 376, 9–13. [Google Scholar] [CrossRef]
- Hjorth, P.; Bagheri, A. Navigating towards sustainable development: A system dynamics approach. Futures 2006, 38, 74–92. [Google Scholar] [CrossRef]
- Linderhof, V.; Dekkers, K.; Polman, N. The role of mitigation options for achieving a low-carbon economy in the netherlands in 2050 using a system dynamics modelling approach. Climate 2020, 8, 132. [Google Scholar] [CrossRef]
- Feng, M.; Liu, P.; Li, Z.; Zhang, J.; Liu, D.; Xiong, L. Modeling the nexus across water supply, power generation and environment systems using the system dynamics approach: Hehuang Region, China. J. Hydrol. 2016, 543, 344–359. [Google Scholar] [CrossRef]
- Ravar, Z.; Zahraie, B.; Sharifinejad, A.; Gozini, H.; Jafari, S. System dynamics modeling for assessment of water–food–energy resources security and nexus in Gavkhuni basin in Iran. Ecol. Indic. 2020, 108, 105682. [Google Scholar] [CrossRef]
- González-Rosell, A.; Blanco, M.; Arfa, I. Integrating stakeholder views and system dynamics to assess the water–energy–food nexus in Andalusia. Water 2020, 12, 3172. [Google Scholar] [CrossRef]
- Francisco, É.C.; de Arruda Ignácio, P.S.; Piolli, A.L.; Dal Poz, M.E.S. Food-energy-water (FEW) nexus: Sustainable food production governance through system dynamics modeling. J. Clean. Prod. 2023, 386, 135825. [Google Scholar] [CrossRef]
- Wang, X.; Dong, Z.; Susnik, J. System dynamics modelling to simulate regional water-energy-food nexus combined with the society-economy-environment system in Hunan Province, China. Sci. Total Environ. 2023, 863, 160993. [Google Scholar] [CrossRef]
- Diaz-Balteiro, L.; González-Pachón, J.; Romero, C. Measuring systems sustainability with multi-criteria methods: A critical review. Eur. J. Oper. Res. 2017, 258, 607–616. [Google Scholar] [CrossRef]
- Bell, M.L.; Hobbs, B.F.; Ellis, H. The use of multi-criteria decision-making methods in the integrated assessment of climate change: Implications for IA practitioners. Socio Econ. Plan. Sci. 2003, 37, 289–316. [Google Scholar] [CrossRef]
- Wang, C.-N.; Nguyen, V.T.; Kao, J.-C.; Chen, C.-C.; Nguyen, V.T. Multi-criteria decision-making methods in fuzzy decision problems: A case study in the frozen shrimp industry. Symmetry 2021, 13, 370. [Google Scholar] [CrossRef]
- Xu, Z.; Da, Q.-L. An overview of operators for aggregating information. Int. J. Intell. Syst. 2003, 18, 953–969. [Google Scholar] [CrossRef]
- Mirabi, M.; Mianabadi, H.; Zarghami, M.; Sharifi, M.B.; Mostert, E. Risk-based evaluation of wastewater treatment projects: A case study in Niasar city, Iran. Resour. Conserv. Recycl. 2014, 93, 168–177. [Google Scholar] [CrossRef]
- Reddy, V.R.; Cunha, D.G.F.; Kurian, M. A water–energy–food nexus perspective on the challenge of eutrophication. Water 2018, 10, 101. [Google Scholar] [CrossRef]
- Borgomeo, E.; Jagerskog, A.; Talbi, A.; Wijnen, M.; Hejazi, M.; Miralles-Wilhelm, F. The Water-Energy-Food Nexus in the Middle East and North Africa; World Bank: Washington, DC, USA, 2018. [Google Scholar]
- Nabavi, E. Failed Policies, Falling Aquifers: Unpacking Groundwater Overabstraction in Iran. Water Alternative. 2018, 11, 699–724. [Google Scholar]
- Central Bank of Iran. 2021. Available online: https://www.amar.org.ir/english (accessed on 25 September 2021).
- Azadi, Y.; Yazdanpanah, M.; Mahmoudi, H. Understanding smallholder farmers’ adaptation behaviors through climate change beliefs, risk perception, trust, and psychological distance: Evidence from wheat growers in Iran. J. Environ. Manag. 2019, 250, 109456. [Google Scholar] [CrossRef]
- Savari, M.; Abdeshahi, A.; Gharechaee, H.; Nasrollahian, O. Explaining farmers’ response to water crisis through theory of the norm activation model: Evidence from Iran. Int. J. Disaster Risk Reduct. 2021, 60, 102284. [Google Scholar] [CrossRef]
- Tan, Q.; Liu, Y.; Ye, Q. The impact of clean development mechanism on energy-water-carbon nexus optimization in Hebei, China: A hierarchical model based discussion. J. Environ. Manag. 2020, 264, 110441. [Google Scholar] [CrossRef]
- Sadeghi, S.H.; Moghadam, E.S.; Delavar, M.; Zarghami, M. Application of water-energy-food nexus approach for designating optimal agricultural management pattern at a watershed scale. Agric. Water Manag. 2020, 233, 106071. [Google Scholar] [CrossRef]
- Radmehr, R.; Ghorbani, M.; Ziaei, A.N. Quantifying and managing the water-energy-food nexus in dry regions food insecurity: New methods and evidence. Agric. Water Manag. 2021, 245, 106588. [Google Scholar] [CrossRef]
- Naderi, M.M.; Mirchi, A.; Bavani, A.R.M.; Goharian, E.; Madani, K. System dynamics simulation of regional water supply and demand using a food-energy-water nexus approach: Application to Qazvin Plain, Iran. J. Environ. Manag. 2021, 280, 111843. [Google Scholar] [CrossRef]
- Bakhshianlamouki, E.; Masia, S.; Karimi, P.; van der Zaag, P.; Susnik, J. A system dynamics model to quantify the impacts of restoration measures on the water-energy-food nexus in the Urmia lake Basin, Iran. Sci. Total Environ. 2020, 708, 134874. [Google Scholar] [CrossRef]
- Abou Zaki, N. The Role of Agriculture Expansion in Water Resources Depletion in Central Iran; University of Oulu: Oulu, Finland, 2020. [Google Scholar]
- Veisi, H.; Deihimfard, R.; Shahmohammadi, A.; Hydarzadeh, Y. Application of the analytic hierarchy process (AHP) in a multi-criteria selection of agricultural irrigation systems. Agric. Water Manag. 2022, 267, 107619. [Google Scholar] [CrossRef]
- Ashofteh, P.-S.; Golfam, P.; Loáiciga, H.A. Evaluation of river water transfer alternatives with the TODIM multi-criteria decision making method. Water Resour. Manag. 2020, 34, 4847–4863. [Google Scholar] [CrossRef]
- Daneshparvar, B.; Rasi Nezami, S.; Feizi, A.; Aghlmand, R. Comparison of results of flood hazard zoning using AHP and ANP methods in GIS environment: A case study in Ardabil province, Iran. J. Appl. Res. Water Wastewater 2022, 9, 1–7. [Google Scholar]
- Kord, M.; Moghaddam, A.A. Spatial analysis of Ardabil plain aquifer potable groundwater using fuzzy logic. J. King Saud Univ. Sci. 2014, 26, 129–140. [Google Scholar] [CrossRef]
- MAJ (Ministry of the Agriculture Jihad Iran). The Annual Report of Production Cost of Agricultural Crops; Physical copy only; MAJ: Iran, 2018. (In Persian)
- WBW. The World Bank Water in Agriculture. 2022. Available online: https://www.worldbank.org/en/topic/water-in-agriculture (accessed on 9 July 2022).
- Javan, K.; Lialestani, M.R.F.H.; Ashouri, H.; Moosavian, N. Assessment of the impacts of nonstationarity on watershed runoff using artificial neural networks: A case study in Ardebil, Iran. Model. Earth Syst. Environ. 2015, 1, 22. [Google Scholar] [CrossRef]
- Farajian, L.; Moghaddasi, R.; Hosseini, S. Agricultural energy demand modeling in Iran: Approaching to a more sustainable situation. Energy Rep. 2018, 4, 260–265. [Google Scholar] [CrossRef]
- MOE (Ministry of Energy). The Annual Report of Energy Balance in Iran; Physical copy only; MOE: Iran, 2018. (In Persian)
- Shahin, S.; Jafari, A.; Mobli, H.; Rafiee, S.; Karimi, M. Effect of farm size on energy ratio for wheat production: A case study from Ardabil province of Iran. Am. Eurasian J. Agric. Environ. Sci. 2008, 3, 604–608. [Google Scholar]
- Mohammadi, A.; Tabatabaeefar, A.; Shahin, S.; Rafiee, S.; Keyhani, A. Energy use and economical analysis of potato production in Iran a case study: Ardabil province. Energy Convers. Manag. 2008, 49, 3566–3570. [Google Scholar] [CrossRef]
- Sterman, J. Instructor’s Manual to Accompany Business Dyanmics: Systems Thinking and Modeling for a Complex World; McGraw-Hill: New York, NY, USA, 2000. [Google Scholar]
- Cavana, R.Y.; Boyd, D.M.; Taylor, R.J. A systems thinking study of retention and recruitment issues for the New Zealand army electronic technician trade group. Syst. Res. Behav. Sci. Off. J. Int. Fed. Syst. Res. 2007, 24, 201–216. [Google Scholar] [CrossRef]
- Hornberger, G.M.; Wiberg, P.L.; Raffensperger, J.P.; D’Odorico, P. Elements of Physical Hydrology; The Johns Hopkins University: Baltimore, MD, USA, 2014. [Google Scholar]
- Hull, A., Jr. Rainfall and snowfall interception of big sagebrush. ABS Papers Proc. Utah Acad. Sci. 1972, 49, 64–65. [Google Scholar]
- IME (Iran-Ministry-of-Energy). The National Water Master Plan Study in the Aras, Sefidrood, between Sefidrood and Haraz, Atrac and Urmia: Agricultural Water Use Study in Urmia Lake Basin in the Refrence Year (2005); IME: Iran, 2014.
- IME (Iran Ministry of Energy). The National Water Master Plan Study in the Aras, Sefidrood, between Sefidrood and Haraz, Atrac and Urmia: Final Urmia Lake Basin Water Balance; Physical Copy Only; IME: Iran, 2014. (In Persian)
- Farajzadeh, J.; Fard, A.F.; Lotfi, S. Modeling of monthly rainfall and runoff of Urmia lake basin using “feed-forward neural network” and “time series analysis” model. Water Resour. Ind. 2014, 7, 38–48. [Google Scholar] [CrossRef]
- Moazedi, A.; Taravat, M.; Jahromi, H.N.; Madani, K.; Rashedi, A.; Rahimian, S. Energy-water meter: A novel solution for groundwater monitoring and management. In Proceedings of the World Environmental and Water Resources Congress 2011: Bearing Knowledge for Sustainability, Palm Springs, CA, USA, 22–26 May 2011; pp. 962–969. [Google Scholar]
- Karimi, P.; Qureshi, A.S.; Bahramloo, R.; Molden, D. Reducing carbon emissions through improved irrigation and groundwater management: A case study from Iran. Agric. Water Manag. 2012, 108, 52–60. [Google Scholar] [CrossRef]
- Van Vuuren, D.P.; Stehfest, E.; den Elzen, M.G.; Kram, T.; van Vliet, J.; Deetman, S.; Isaac, M.; Klein Goldewijk, K.; Hof, A.; Mendoza Beltran, A. RCP2.6: Exploring the possibility to keep global mean temperature increase below 2 C. Clim. Chang. 2011, 109, 95–116. [Google Scholar] [CrossRef]
- Clarke, L.; Edmonds, J.; Jacoby, H.; Pitcher, H.; Reilly, J.; Richels, R. CCSP Synthesis and Assessment Product 2.1, Part A: Scenarios of Greenhouse Gas Emissions and Atmospheric Concentrations; US Government Printing Office: Washington, DC, USA, 2007. [Google Scholar]
- Thomson, A.M.; Calvin, K.V.; Smith, S.J.; Kyle, G.P.; Volke, A.; Patel, P.; Delgado-Arias, S.; Bond-Lamberty, B.; Wise, M.A.; Clarke, L.E. RCP4.5: A pathway for stabilization of radiative forcing by 2100. Clim. Chang. 2011, 109, 77–94. [Google Scholar] [CrossRef]
- Riahi, K.; Grübler, A.; Nakicenovic, N. Scenarios of long-term socio-economic and environmental development under climate stabilization. Technol. Forecast. Soc. Chang. 2007, 74, 887–935. [Google Scholar] [CrossRef]
- SCI (Statistical Centre of Iran). The Annual Report of Cost and Original Price of Agricultural Products in Rural Areas of Iran; Physical copy only; SCI: Iran, 2018. (In Persian) [Google Scholar]
- Giampietro, M.; Aspinall, R.J.; Ramos-Martin, J. Addressing the Complexity of Integrated Resource Assessment. In Resource Accounting for Sustainability Assessment; Routledge: London, UK, 2014; pp. 23–30. [Google Scholar]


| Month | Number of Wells | Electricity Consumption (MWh) |
|---|---|---|
| March | 1528 | 6253 |
| May | 1545 | 19,560 |
| July | 1553 | 20,115 |
| October | 1587 | 13,317 |
| December | 1596 | 4649 |
| February | 1610 | 9064 |
| Risk Prone | Risk Neutral | Risk Aversion | |||
|---|---|---|---|---|---|
| Optimistic | Fairly Optimistic | Neutral | Fairly Pessimistic | Pessimistic | |
| Barley | 4 | 5 | 5 | 5 | 4 |
| Wheat | 5 | 4 | 4 | 4 | 5 |
| Soybeans | 2 | 2 | 3 | 3 | 3 |
| Potatoes | 3 | 3 | 2 | 2 | 2 |
| Pears | 1 | 1 | 1 | 1 | 1 |
| Attributes | Indicator Weight | Water Consumption | Power Consumption | Economic Value | Climate Change |
|---|---|---|---|---|---|
| 6 | 4 | 7 | 5 | ||
| Barley | 4 | 5 | 3 | 8 | |
| Wheat | 5 | 4 | 5 | 7 | |
| Soybeans | 6 | 6 | 8 | 4 | |
| Potatoes | 7 | 7 | 7 | 5 | |
| Pears | 9 | 8 | 9 | 6 |
Disclaimer/Publisher’s Note: The statements, opinions and data contained in all publications are solely those of the individual author(s) and contributor(s) and not of MDPI and/or the editor(s). MDPI and/or the editor(s) disclaim responsibility for any injury to people or property resulting from any ideas, methods, instructions or products referred to in the content. |
© 2023 by the authors. Licensee MDPI, Basel, Switzerland. This article is an open access article distributed under the terms and conditions of the Creative Commons Attribution (CC BY) license (https://creativecommons.org/licenses/by/4.0/).
Share and Cite
Javan, K.; Altaee, A.; Darestani, M.; Mirabi, M.; Azadmanesh, F.; Zhou, J.L.; Hosseini, H. Assessing the Water–Energy–Food Nexus and Resource Sustainability in the Ardabil Plain: A System Dynamics and HWA Approach. Water 2023, 15, 3673. https://doi.org/10.3390/w15203673
Javan K, Altaee A, Darestani M, Mirabi M, Azadmanesh F, Zhou JL, Hosseini H. Assessing the Water–Energy–Food Nexus and Resource Sustainability in the Ardabil Plain: A System Dynamics and HWA Approach. Water. 2023; 15(20):3673. https://doi.org/10.3390/w15203673
Chicago/Turabian StyleJavan, Kazem, Ali Altaee, Mariam Darestani, Mehrdad Mirabi, Farshad Azadmanesh, John L. Zhou, and Hanieh Hosseini. 2023. "Assessing the Water–Energy–Food Nexus and Resource Sustainability in the Ardabil Plain: A System Dynamics and HWA Approach" Water 15, no. 20: 3673. https://doi.org/10.3390/w15203673
APA StyleJavan, K., Altaee, A., Darestani, M., Mirabi, M., Azadmanesh, F., Zhou, J. L., & Hosseini, H. (2023). Assessing the Water–Energy–Food Nexus and Resource Sustainability in the Ardabil Plain: A System Dynamics and HWA Approach. Water, 15(20), 3673. https://doi.org/10.3390/w15203673