


Delineating the Potential Areas of Rainwater Harvesting in Arid Regions Using Remote Sensing and GIS Techniques


Abstract
:1. Introduction
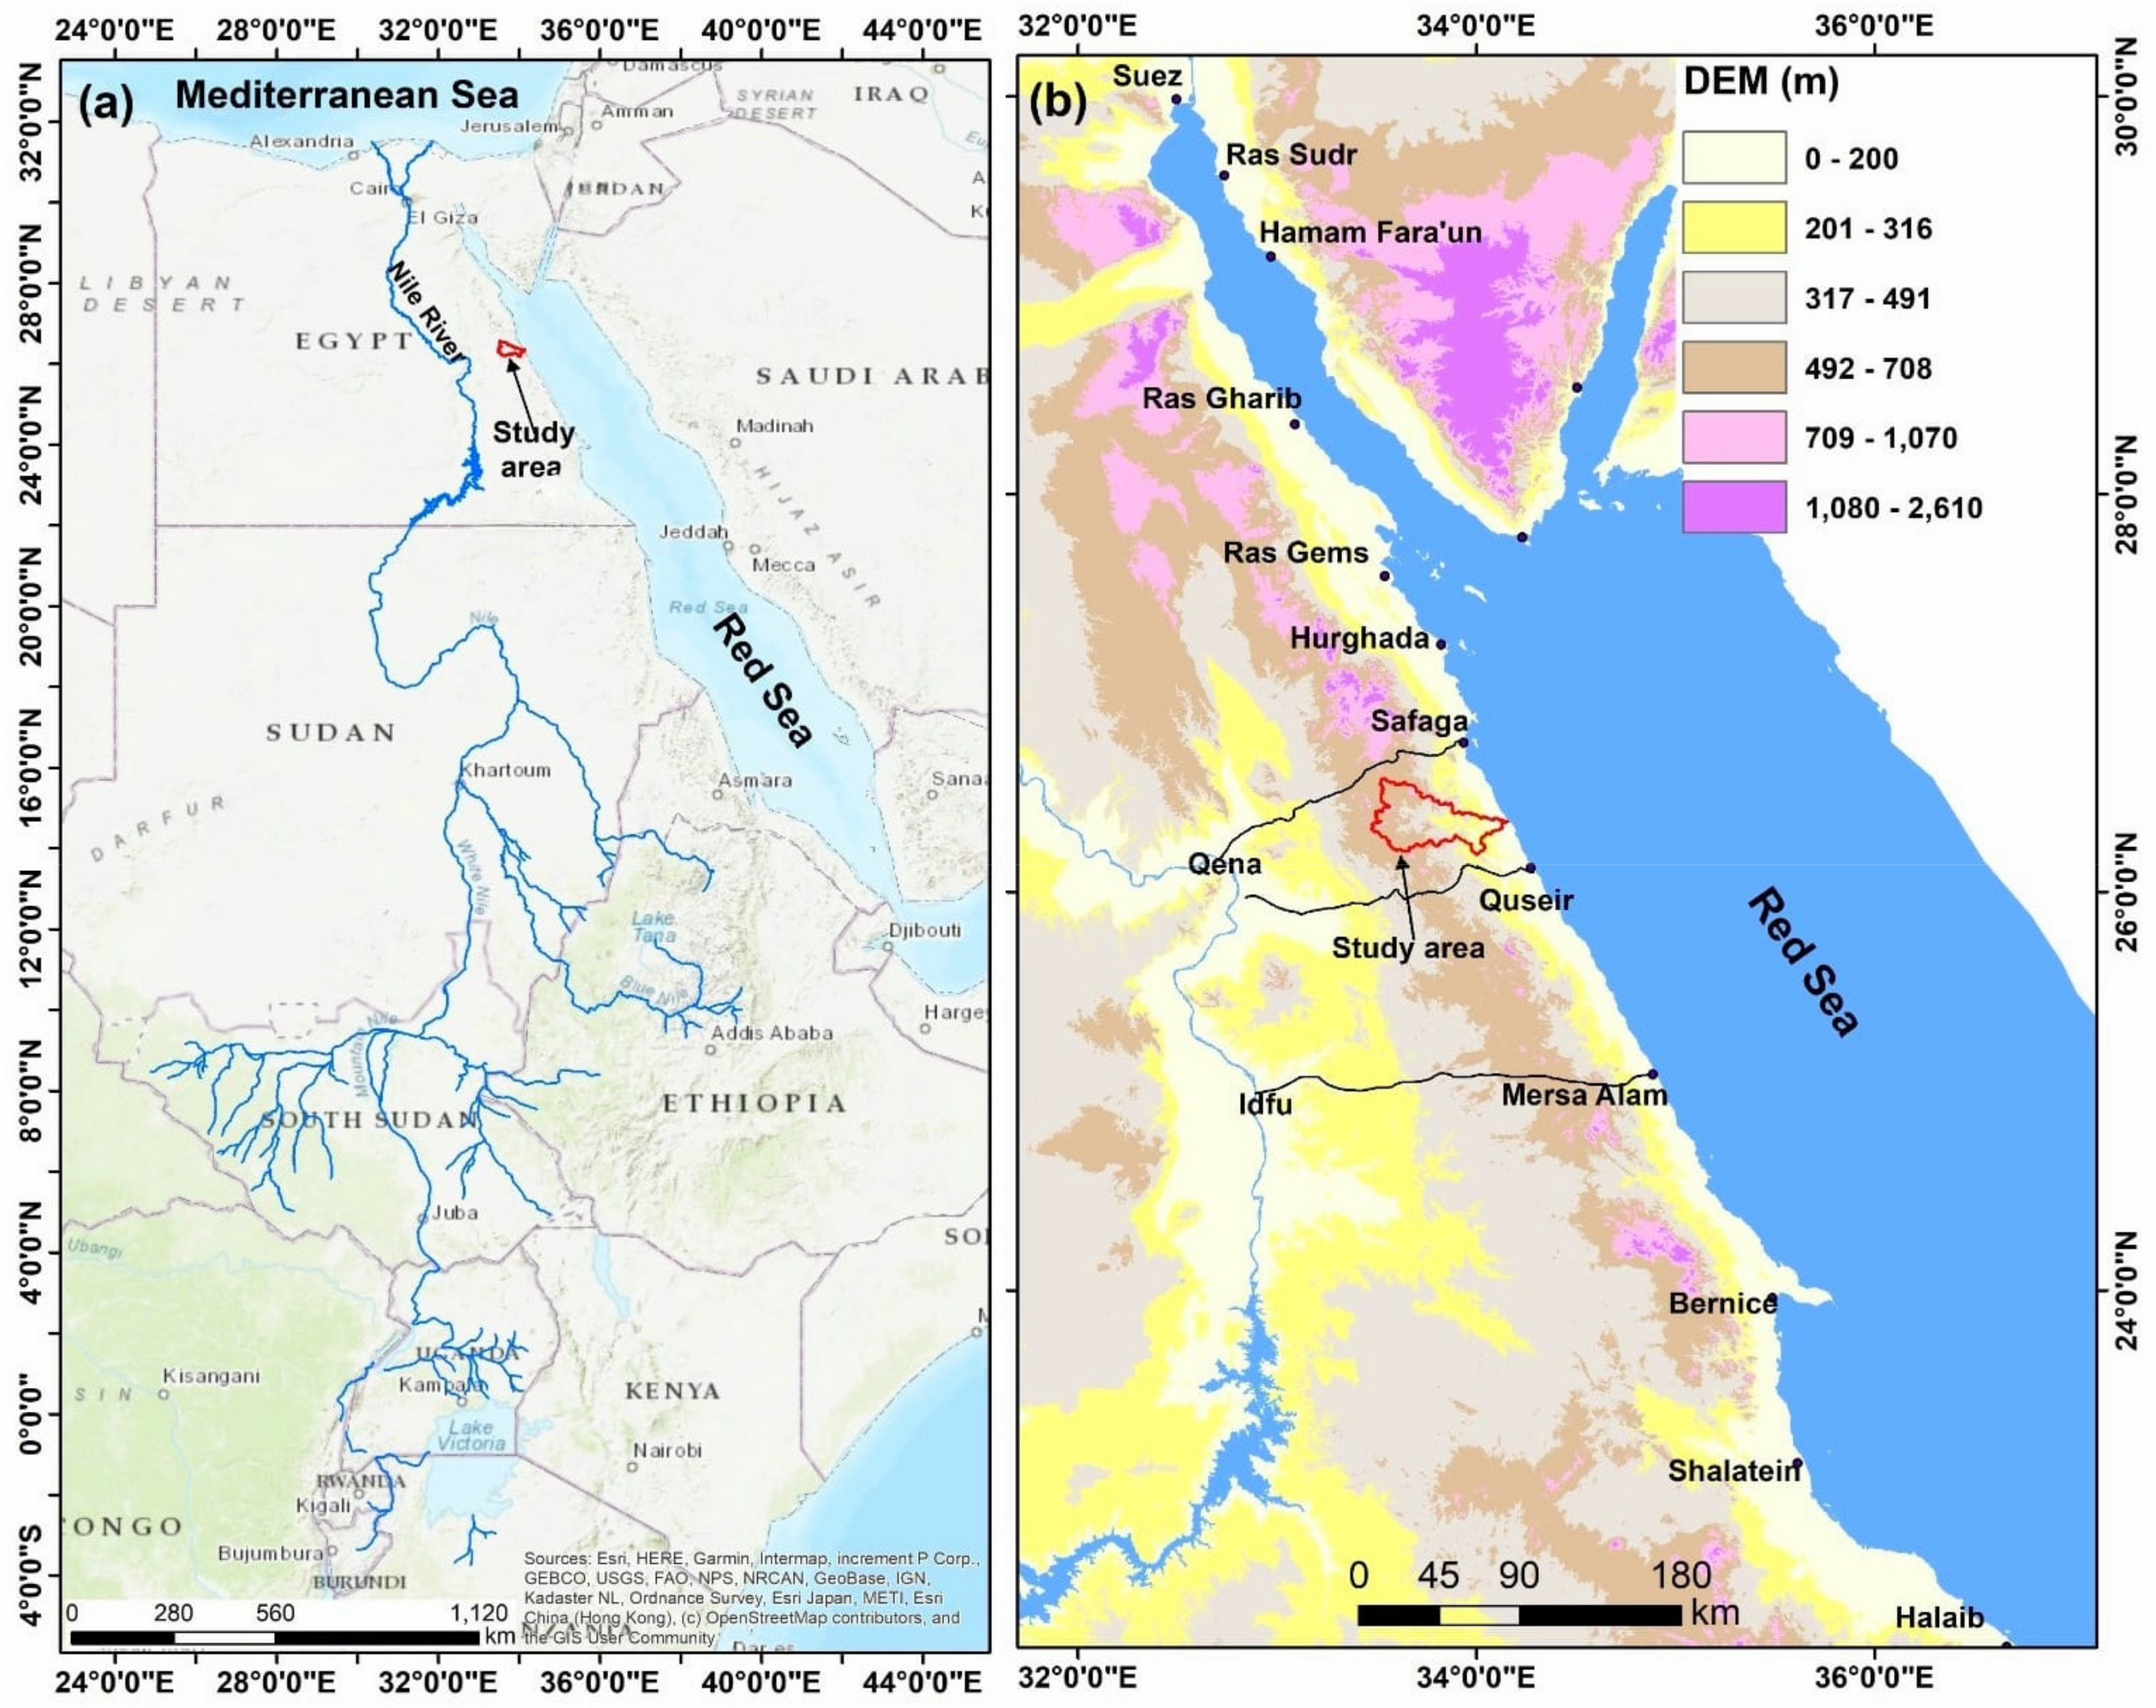
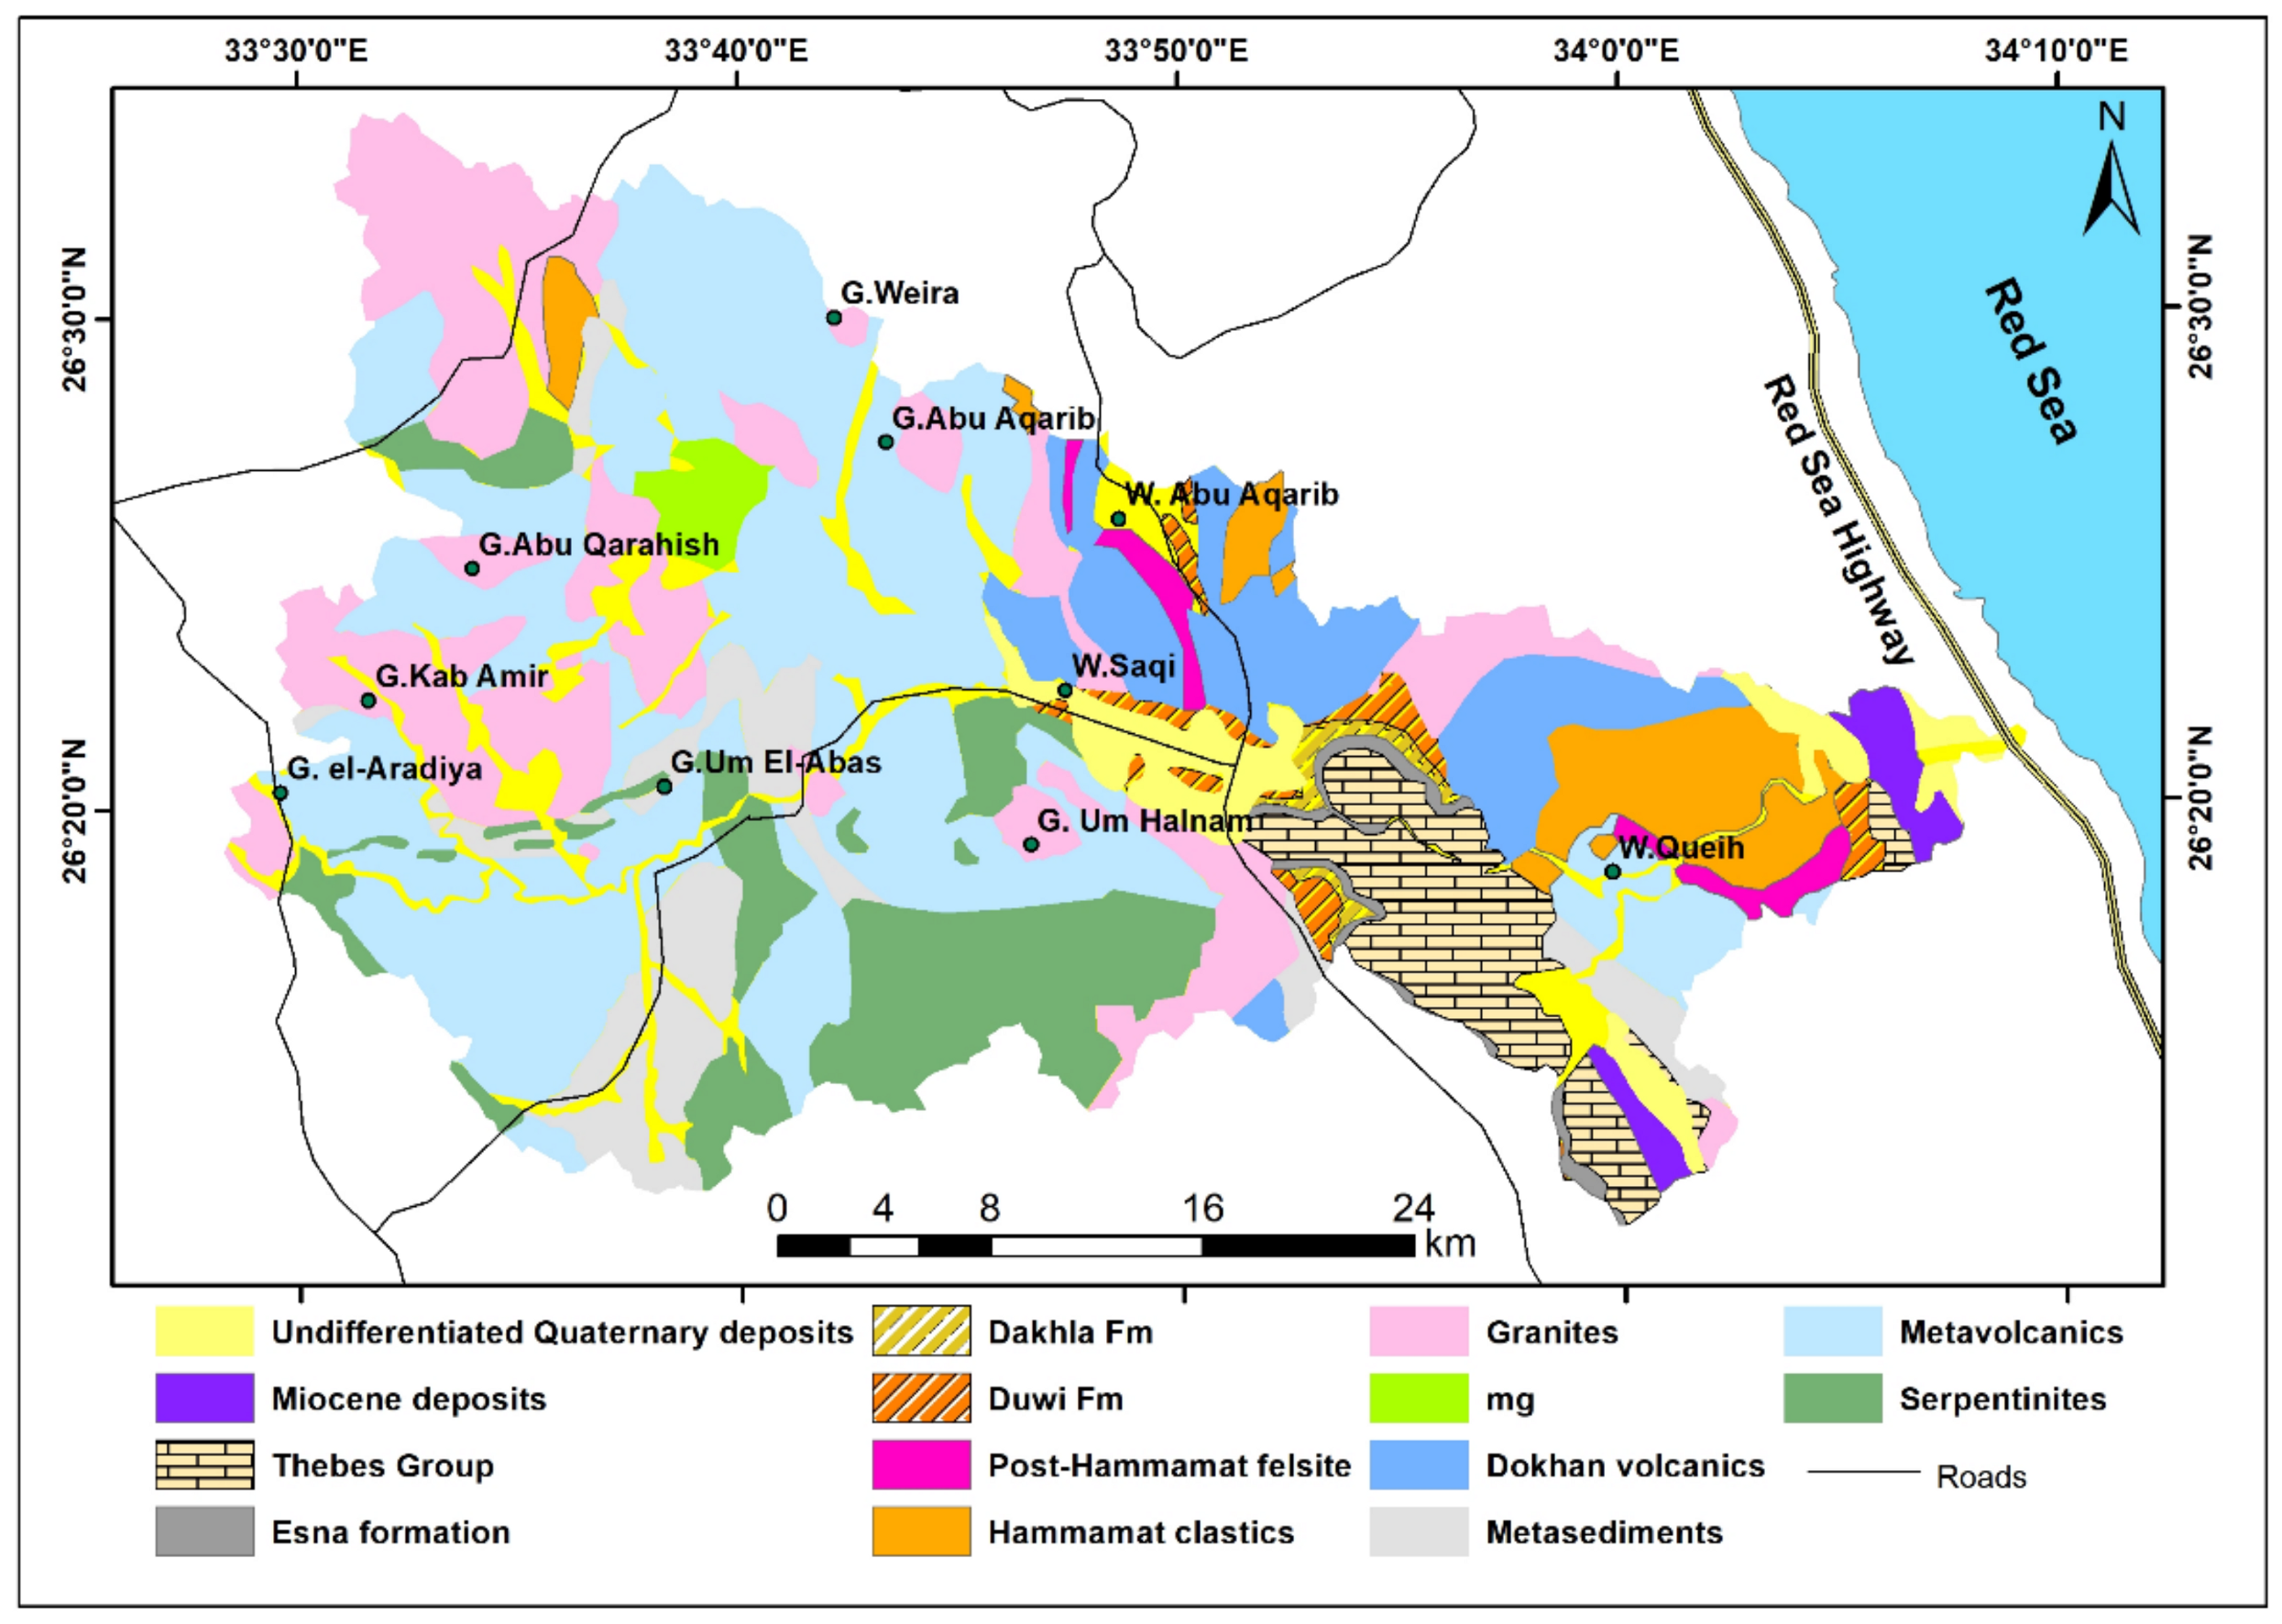
2. Study Area
3. Data and Methods
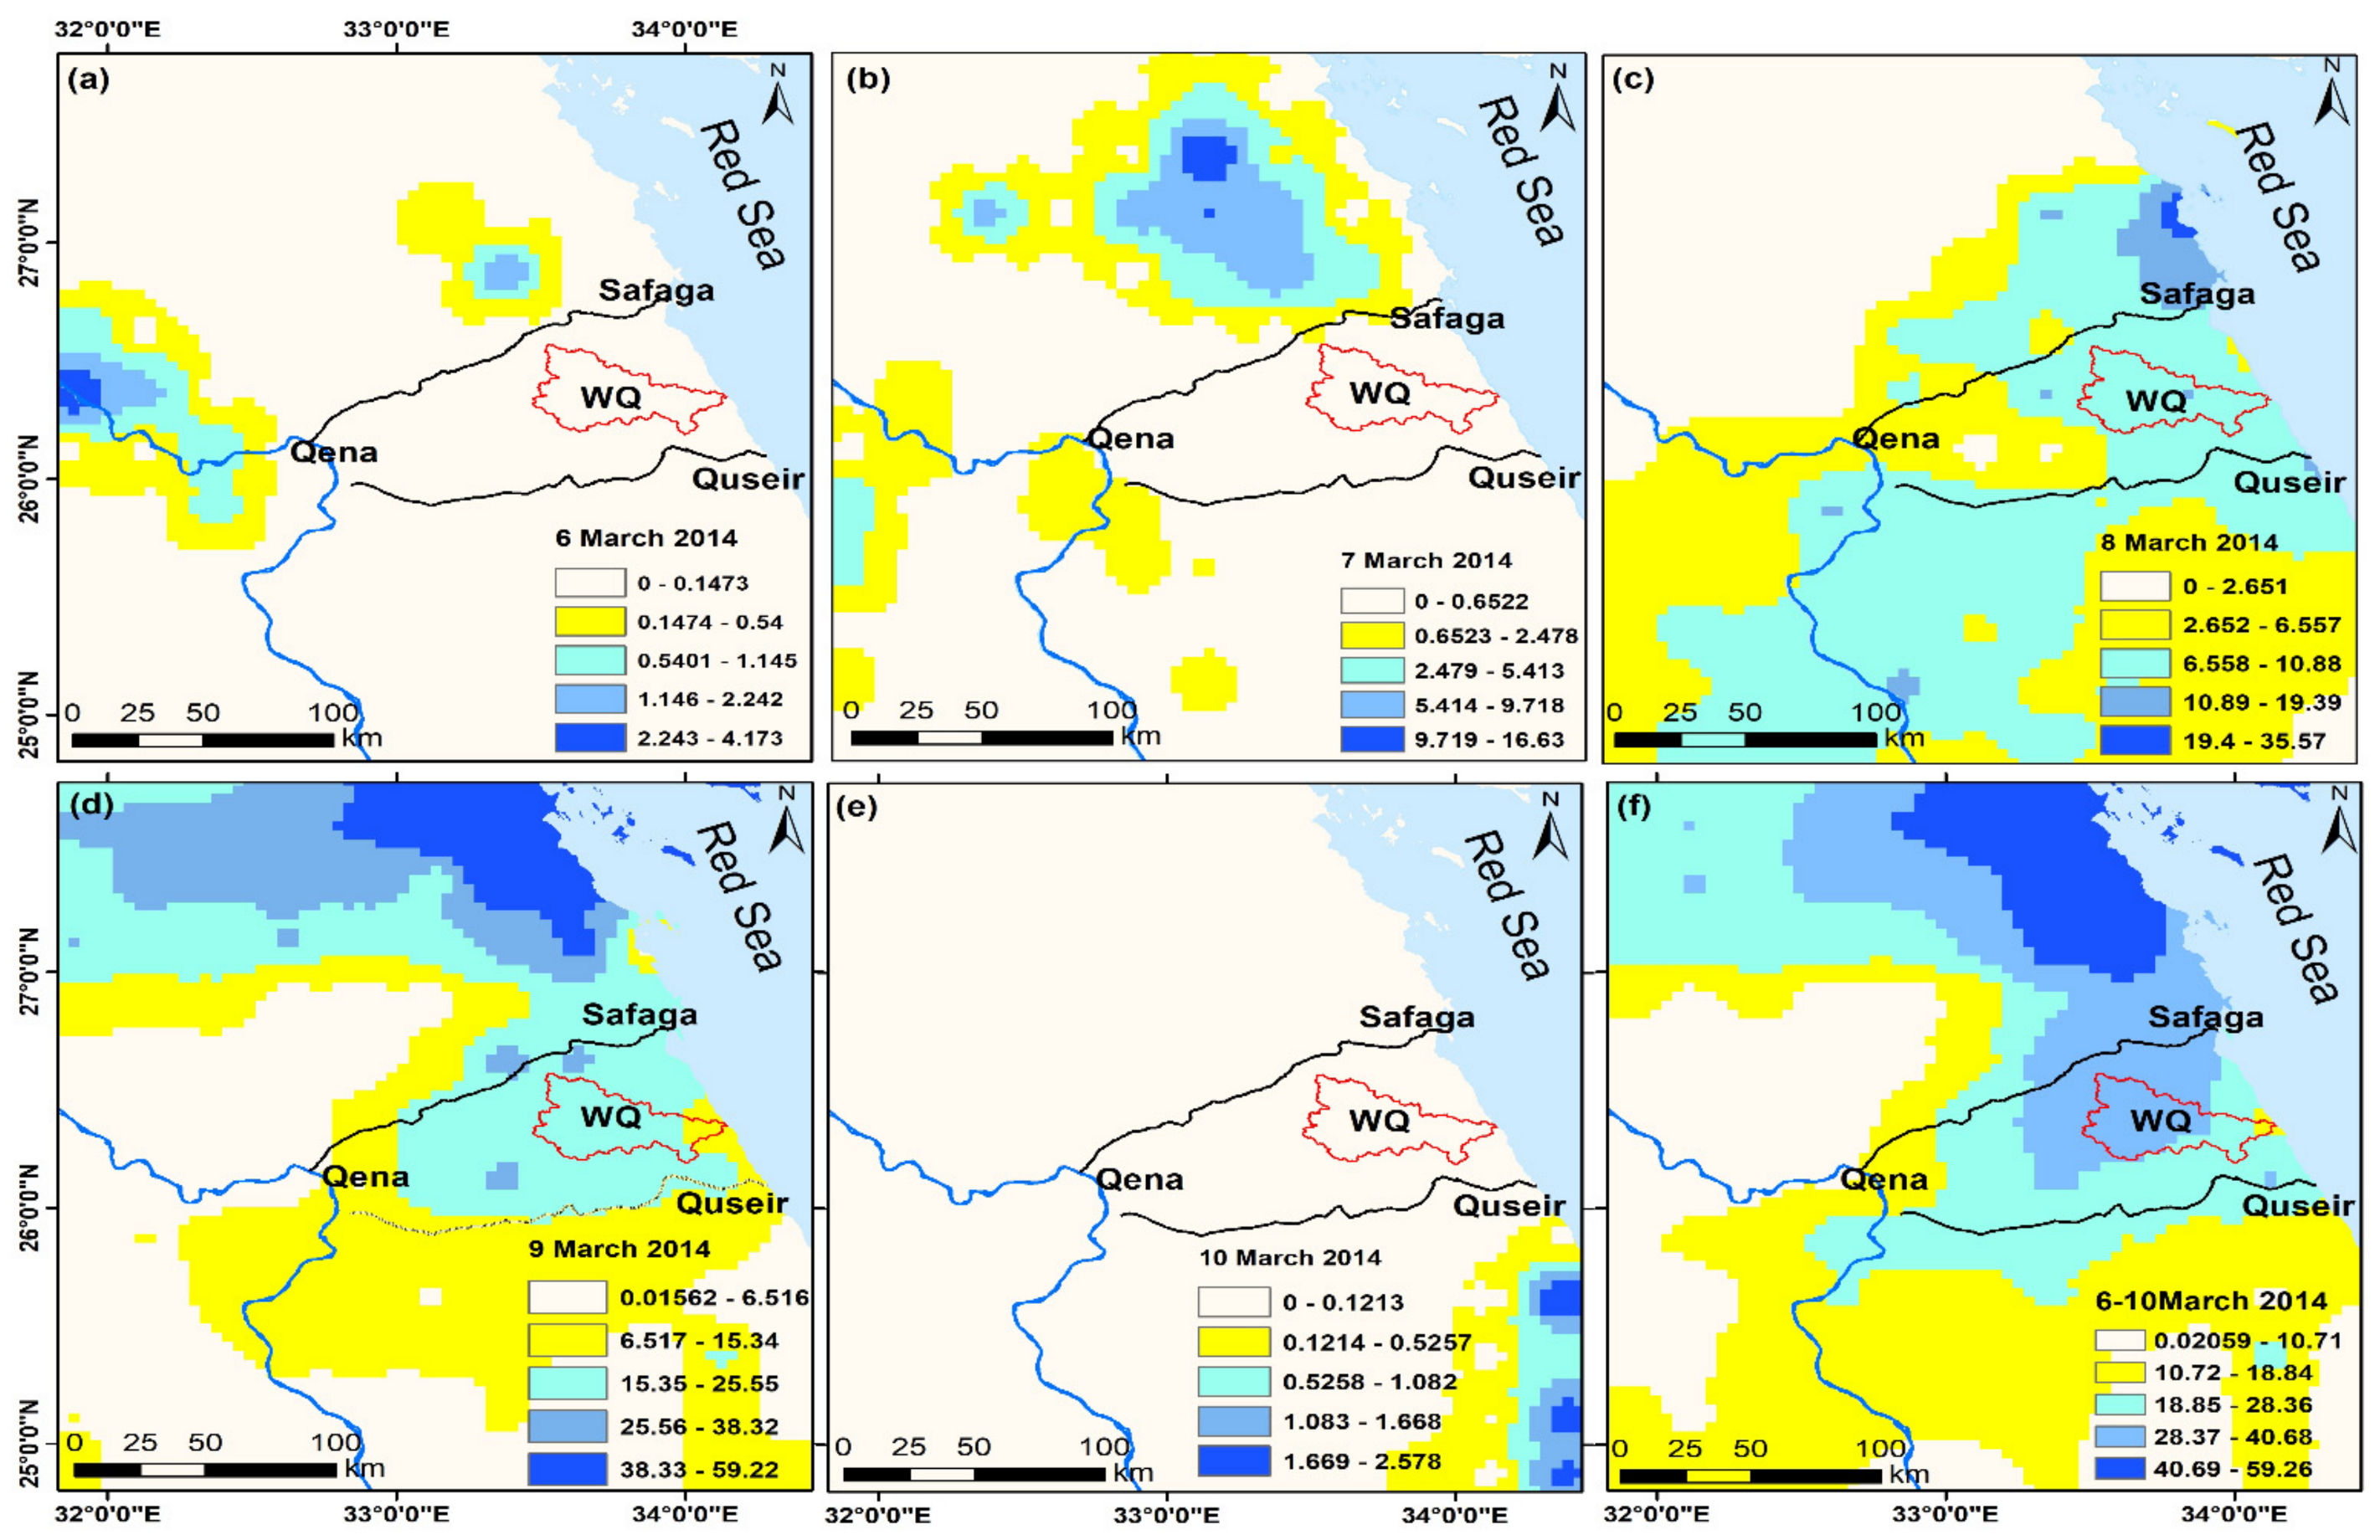
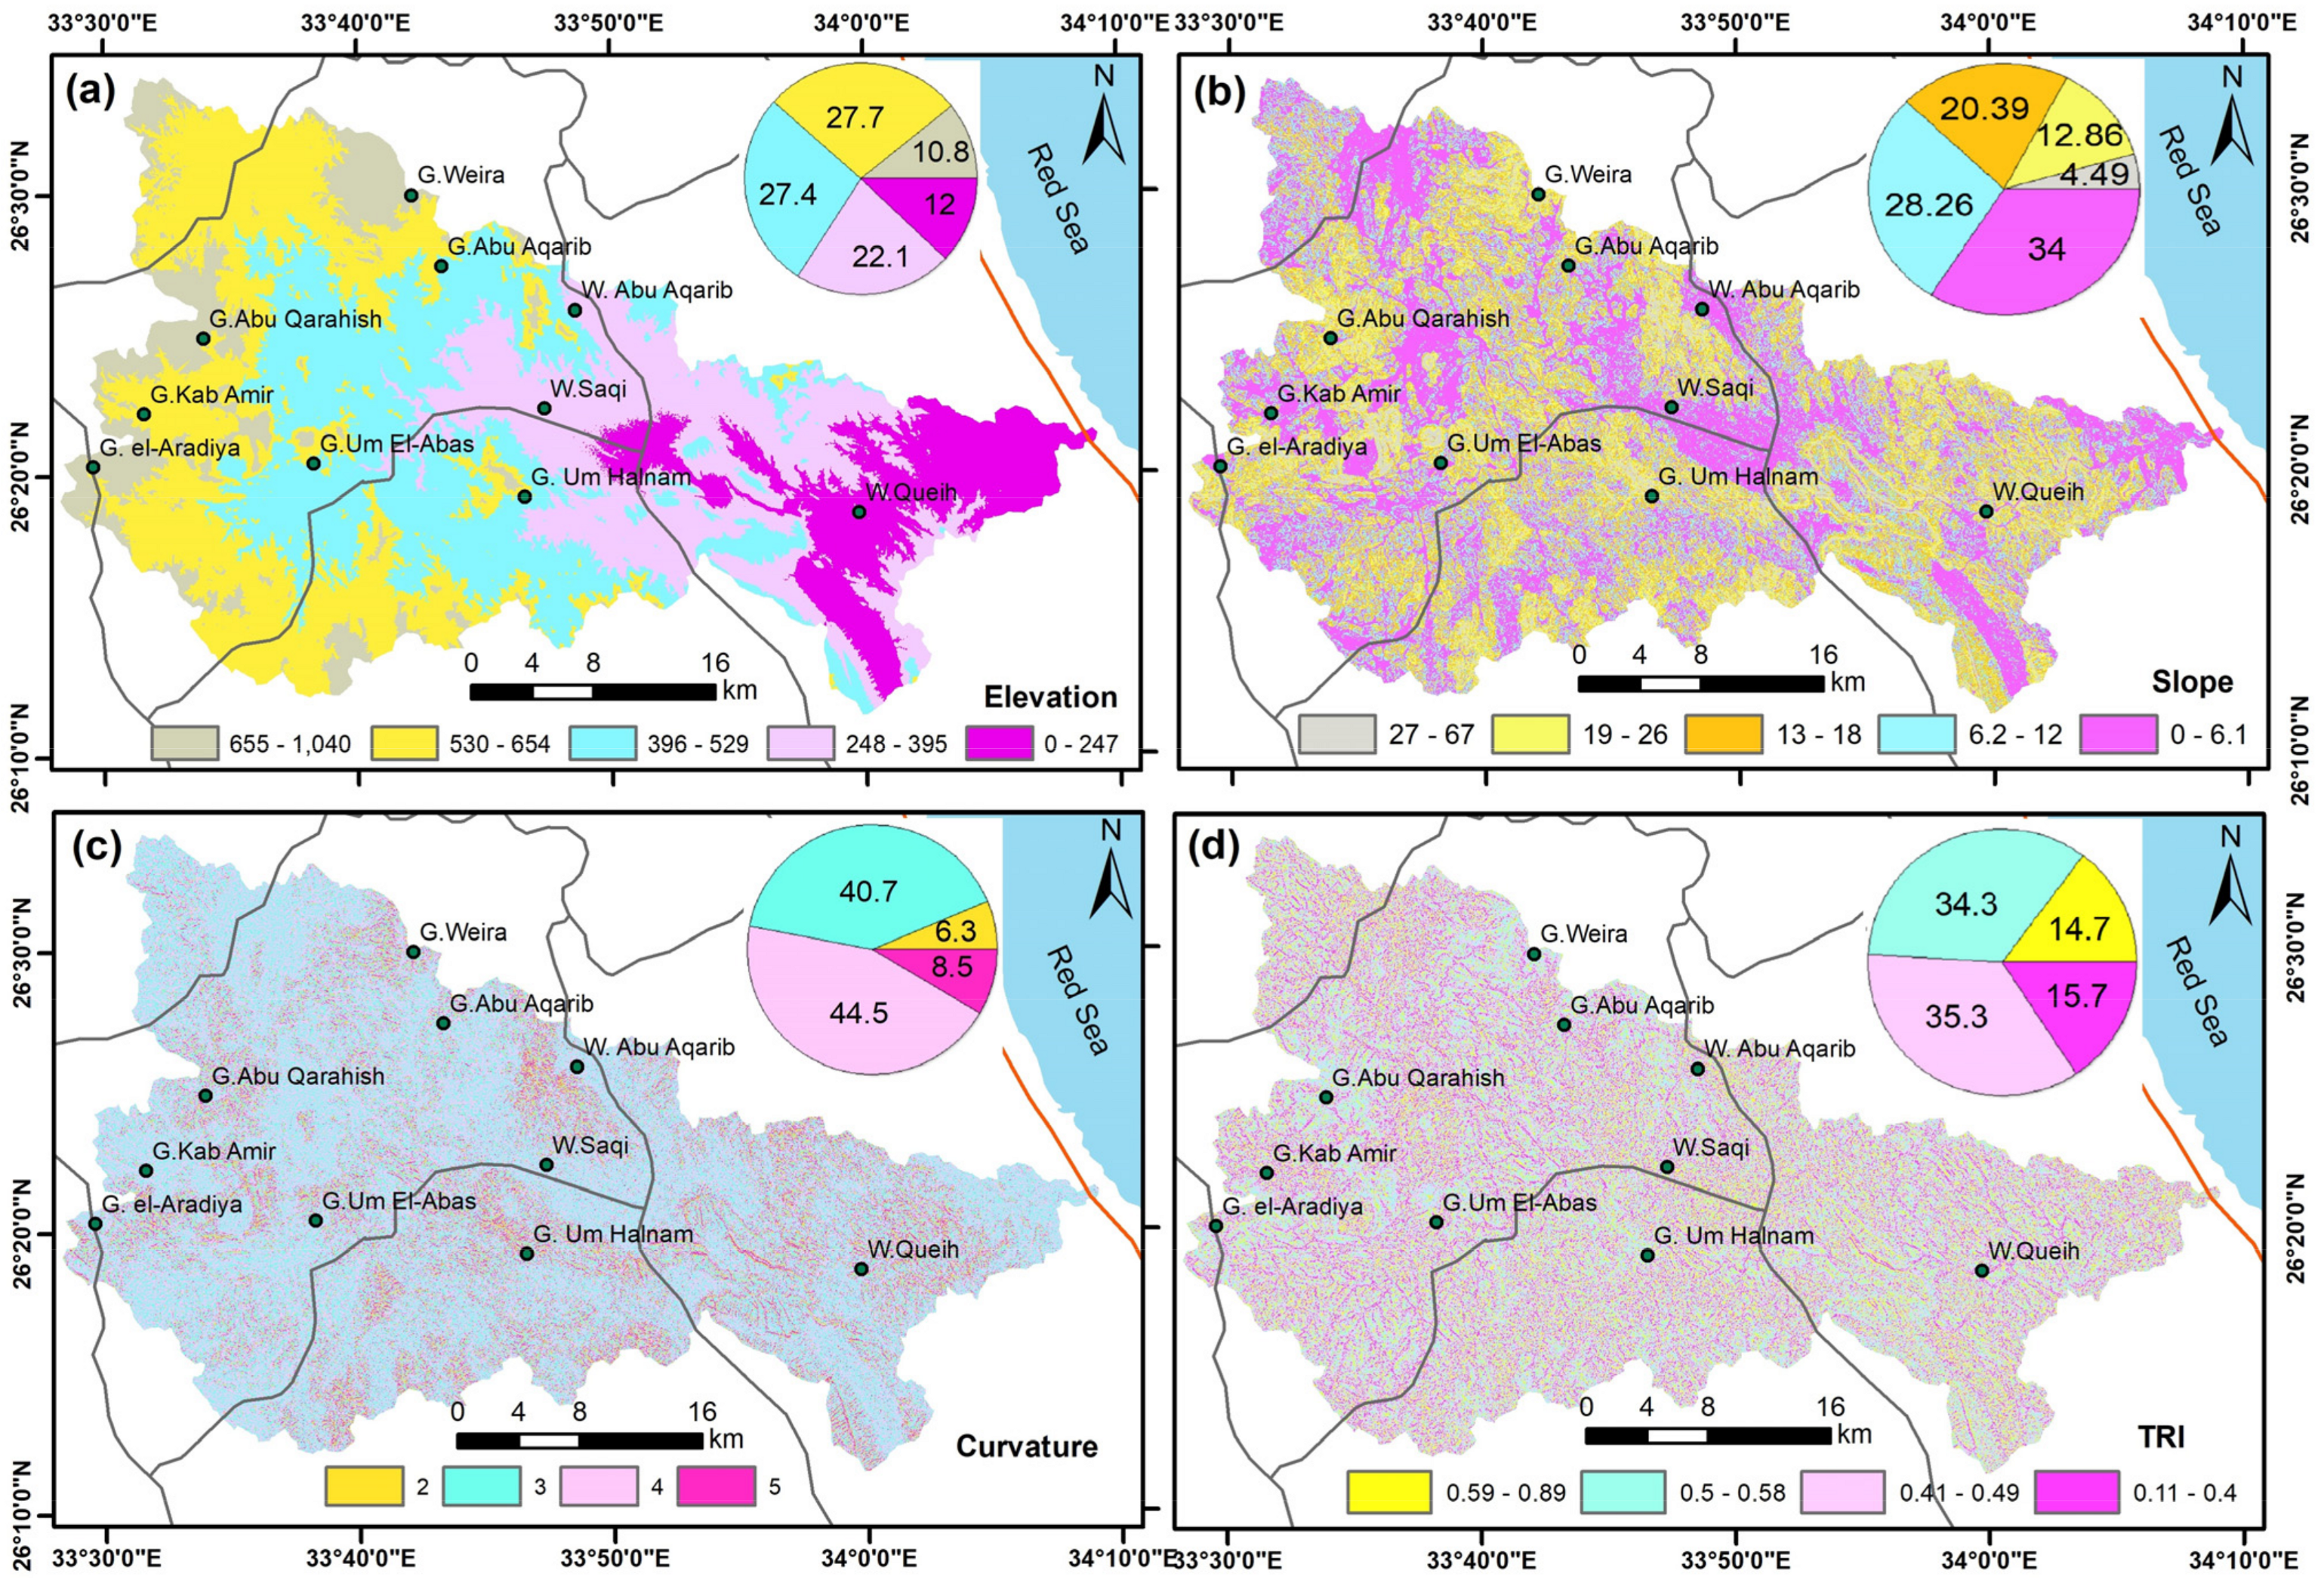
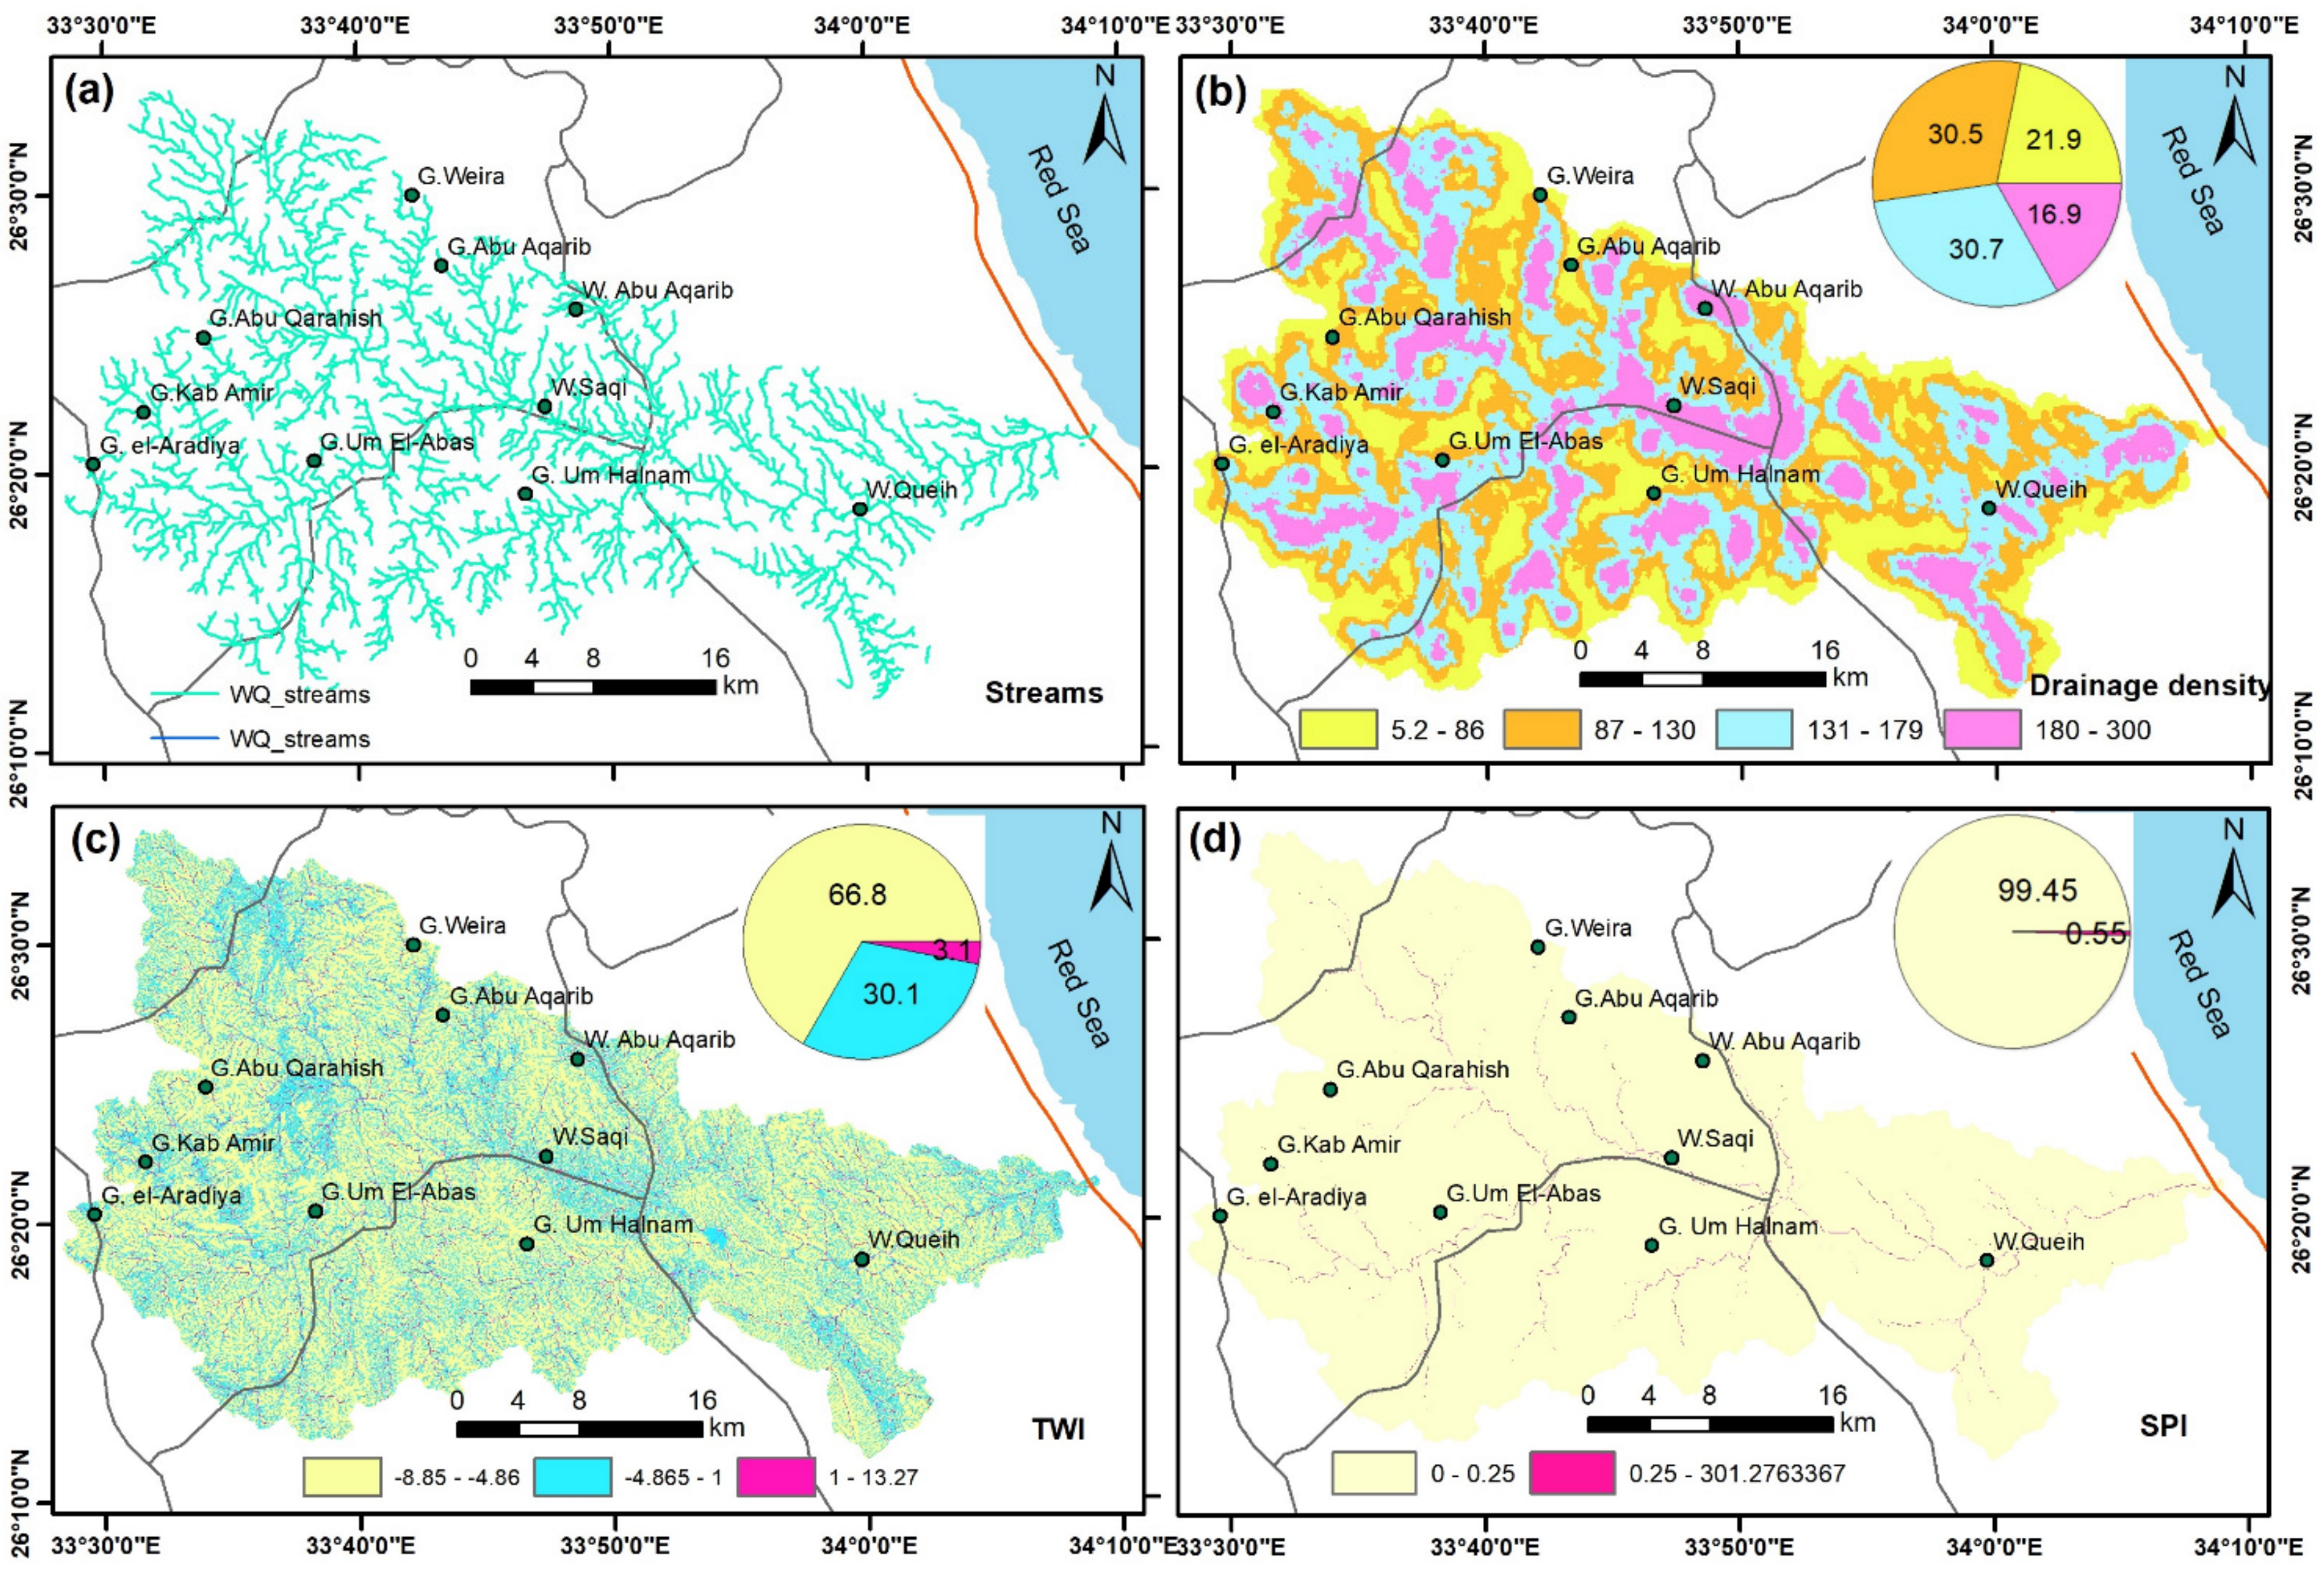
4. Results
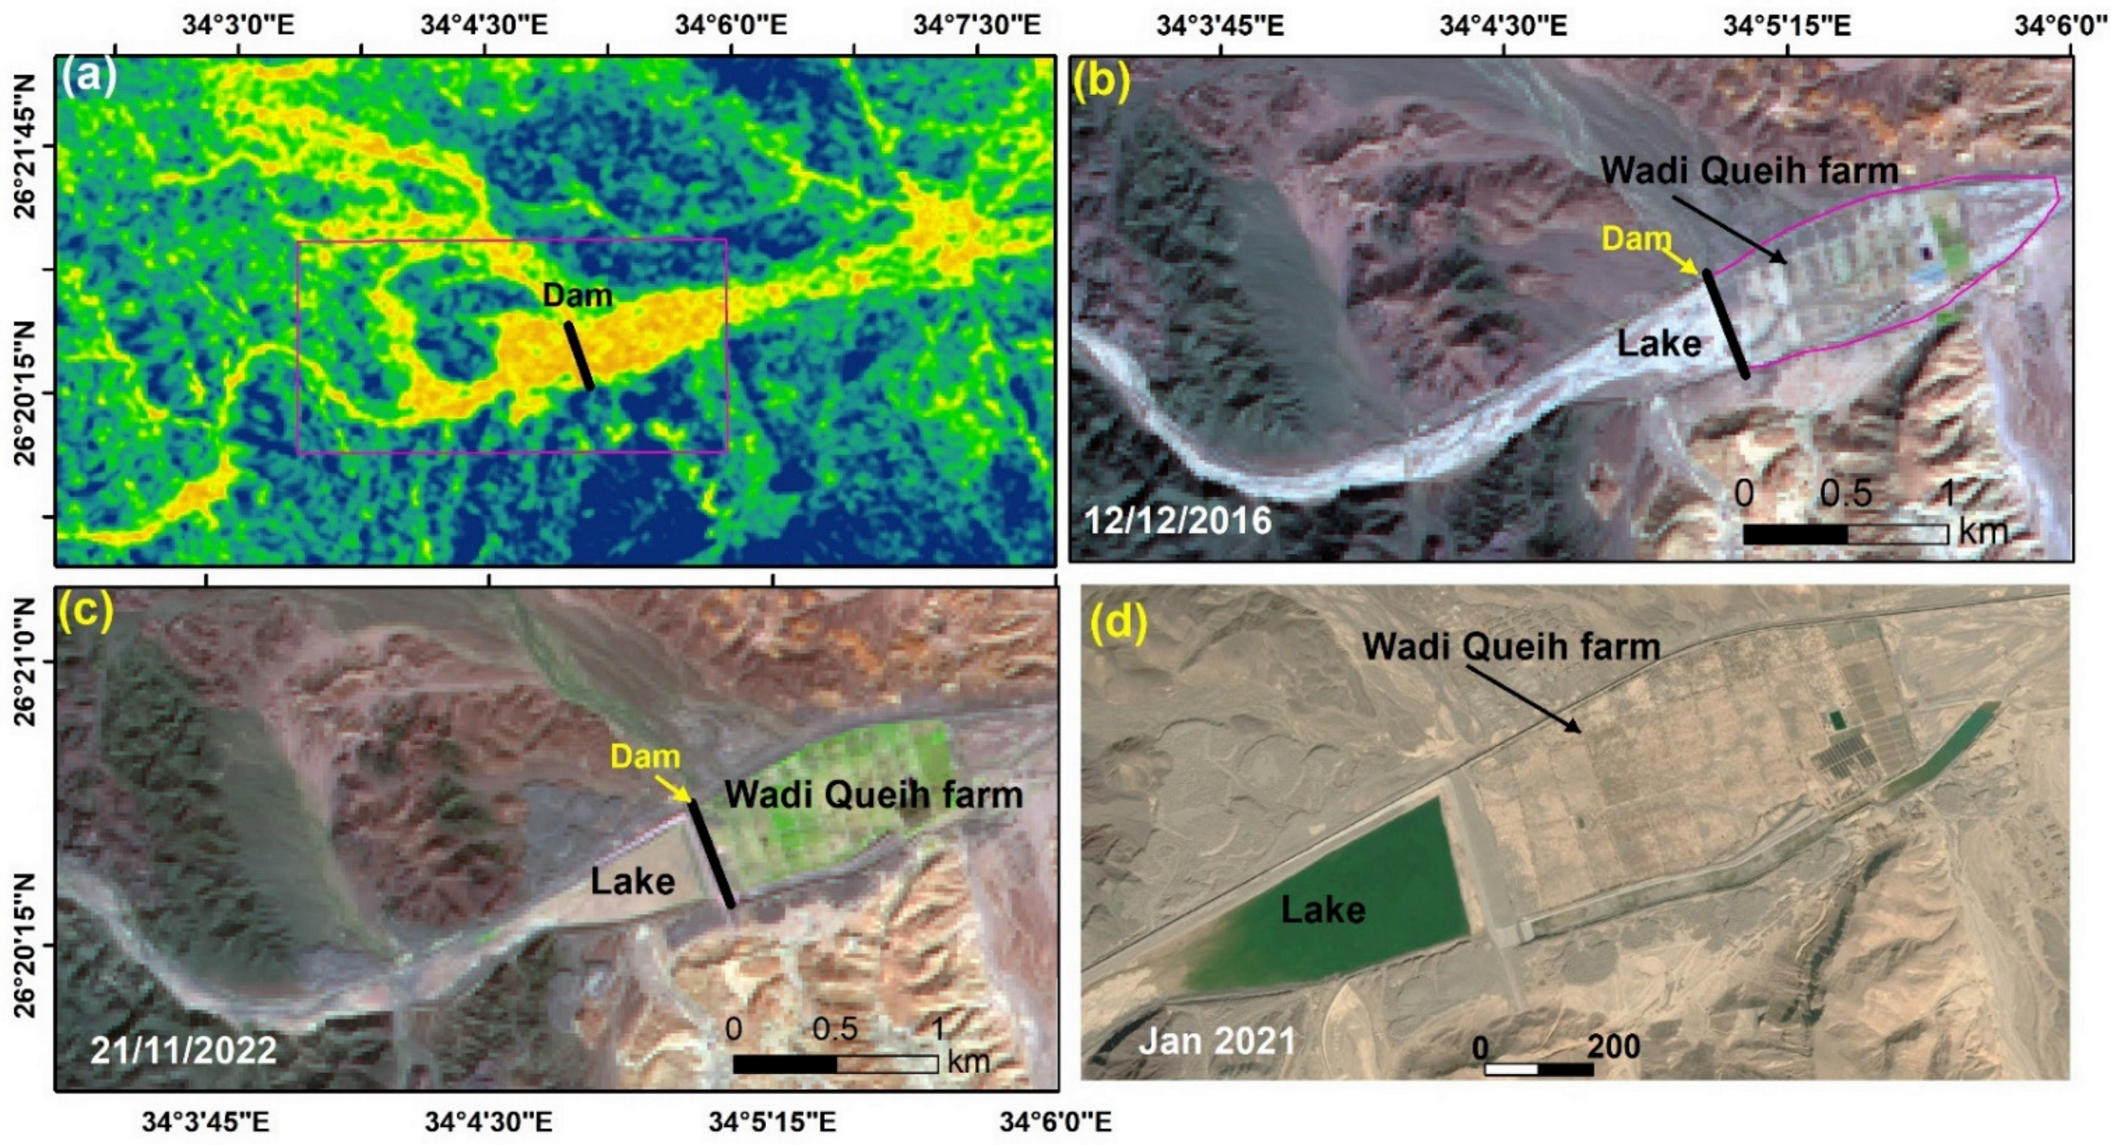
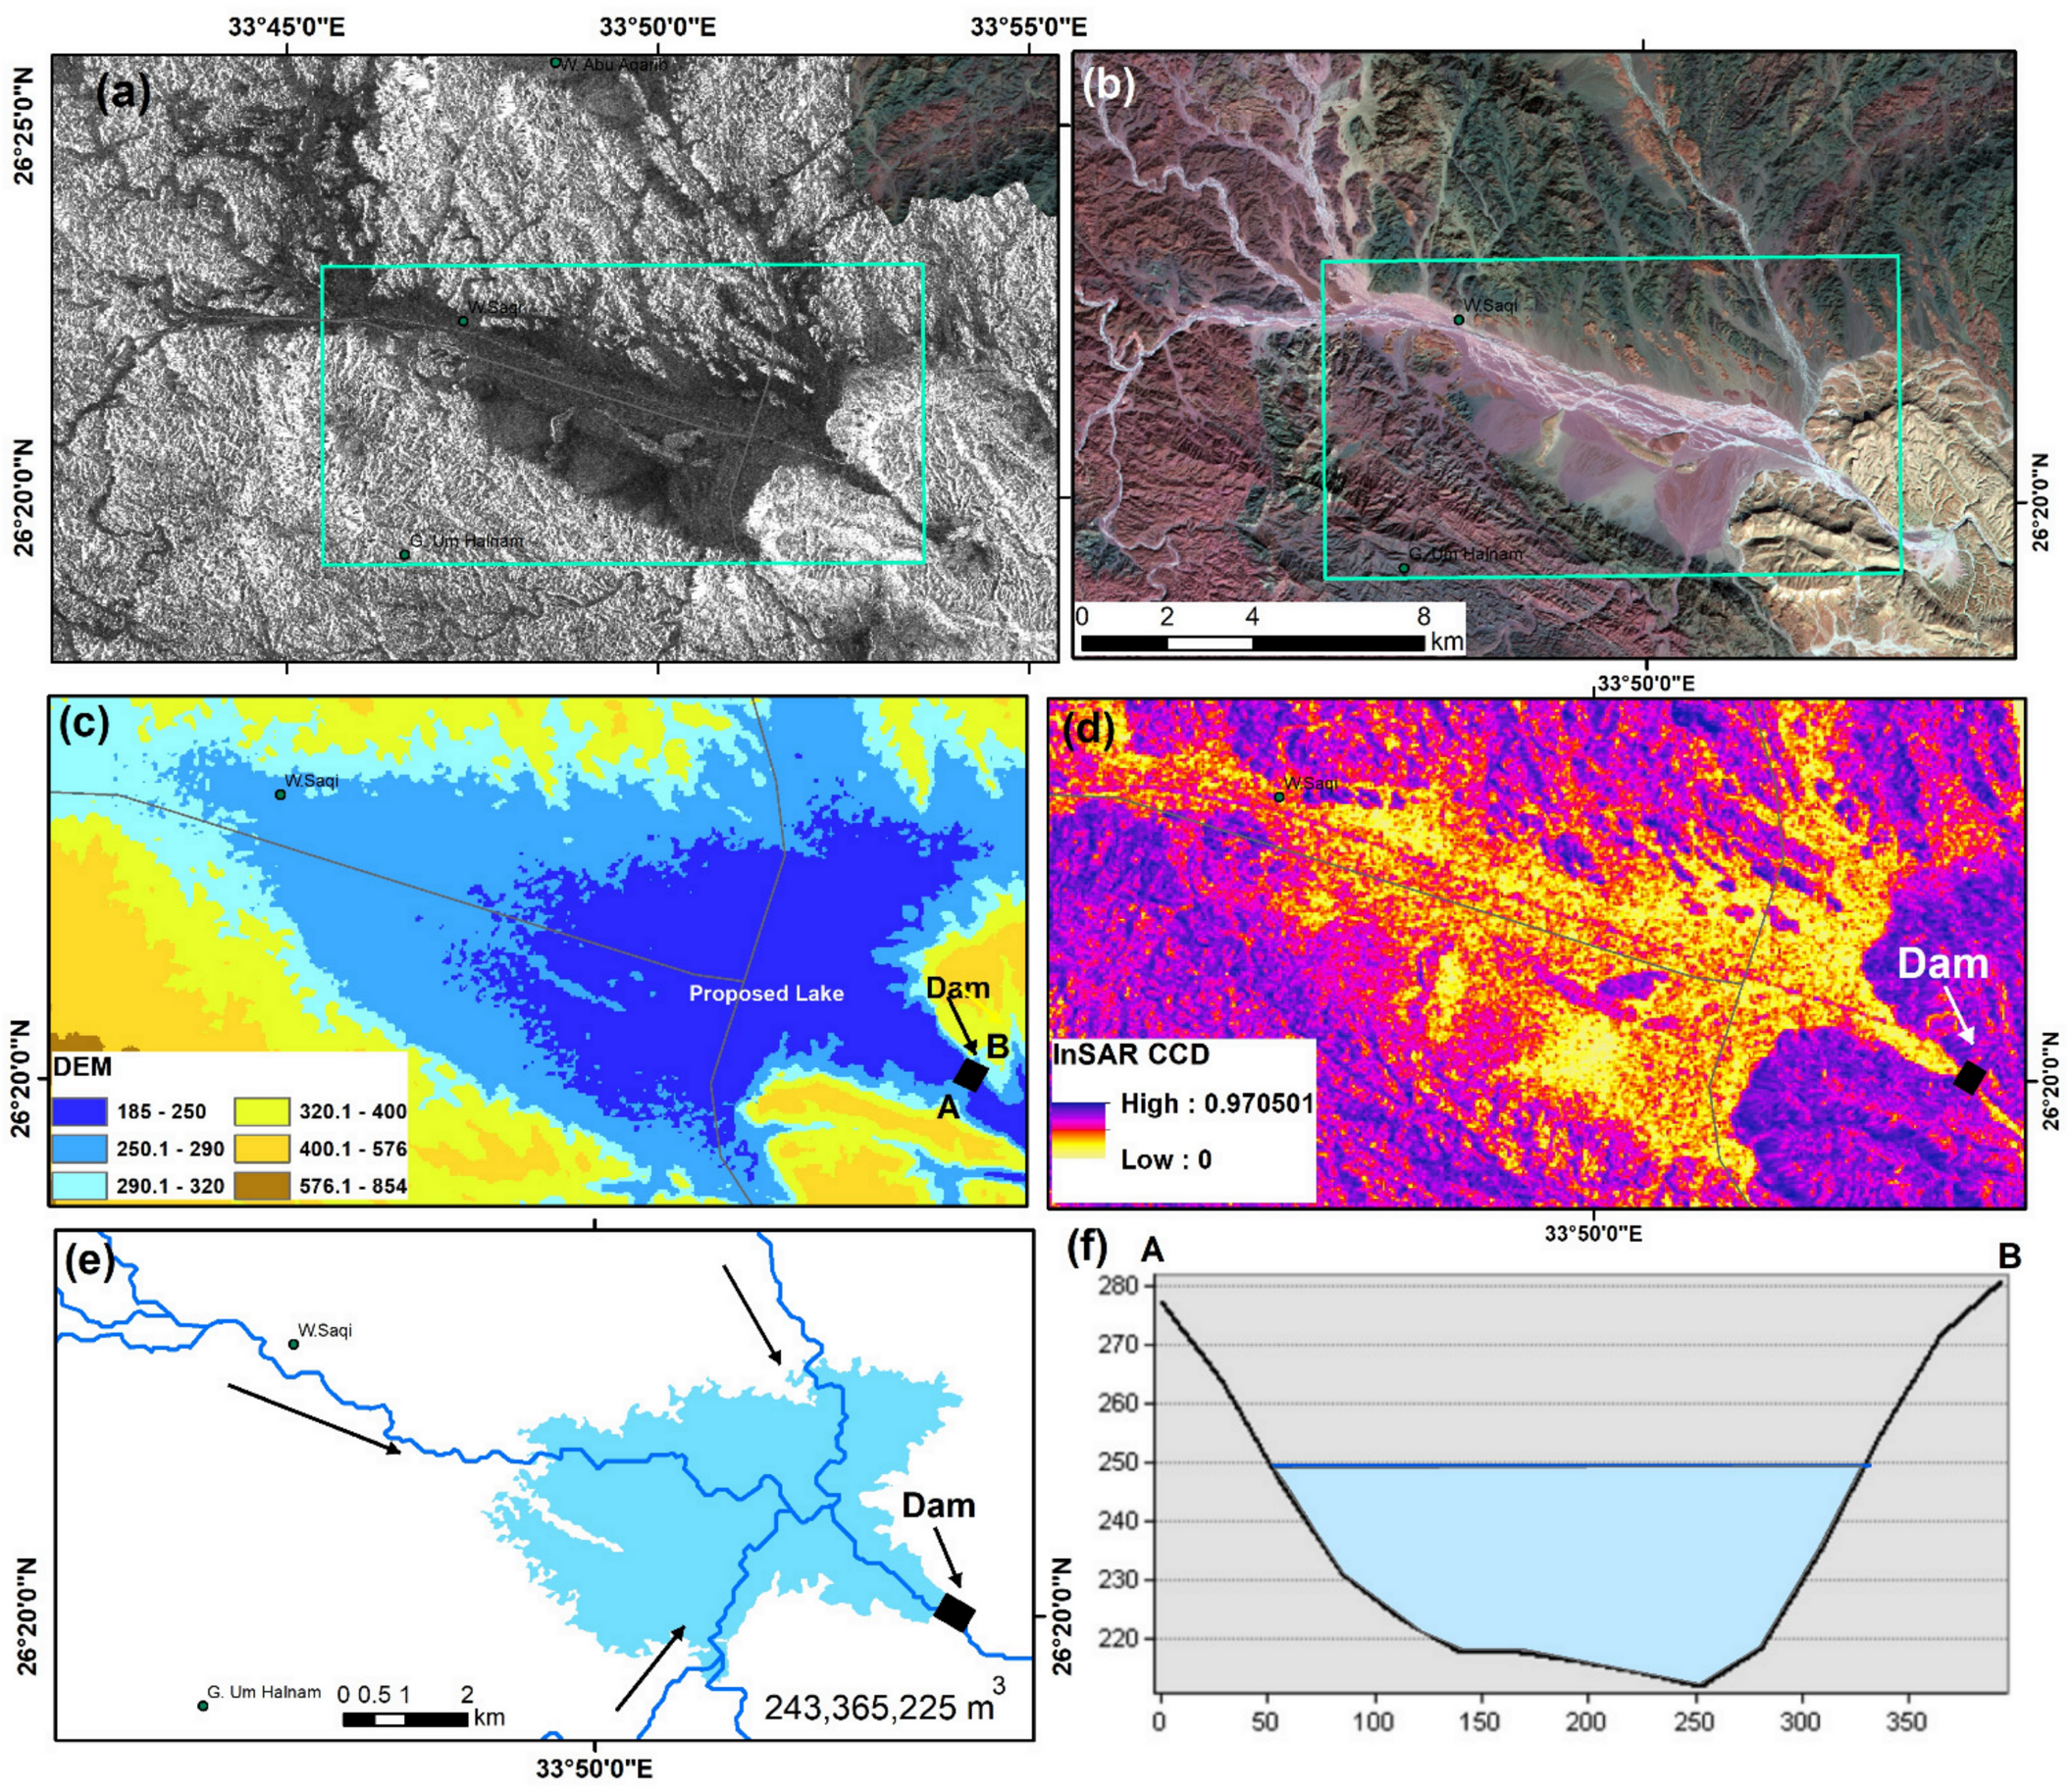
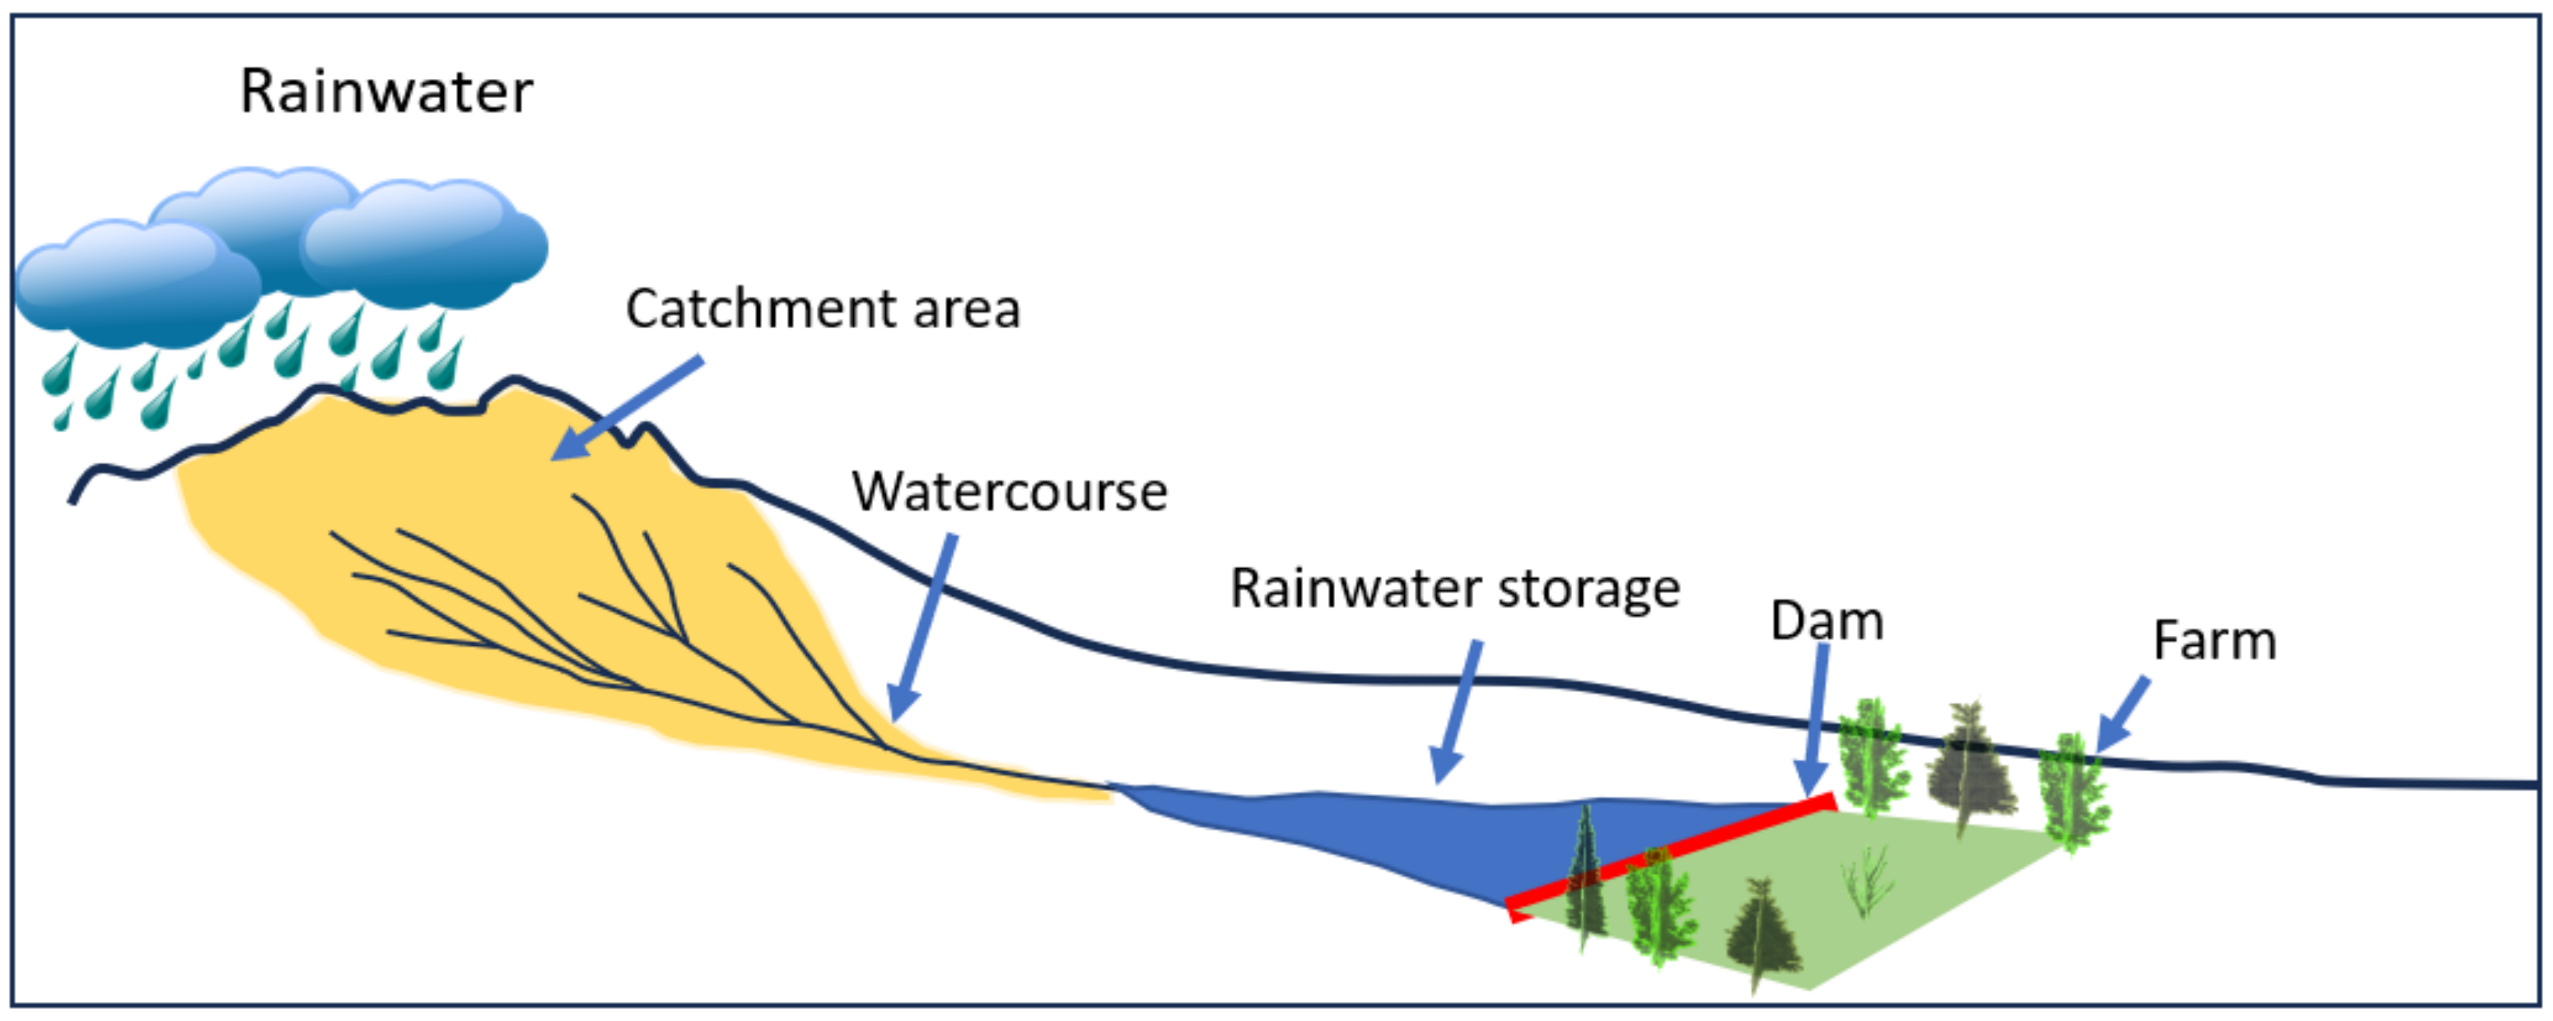
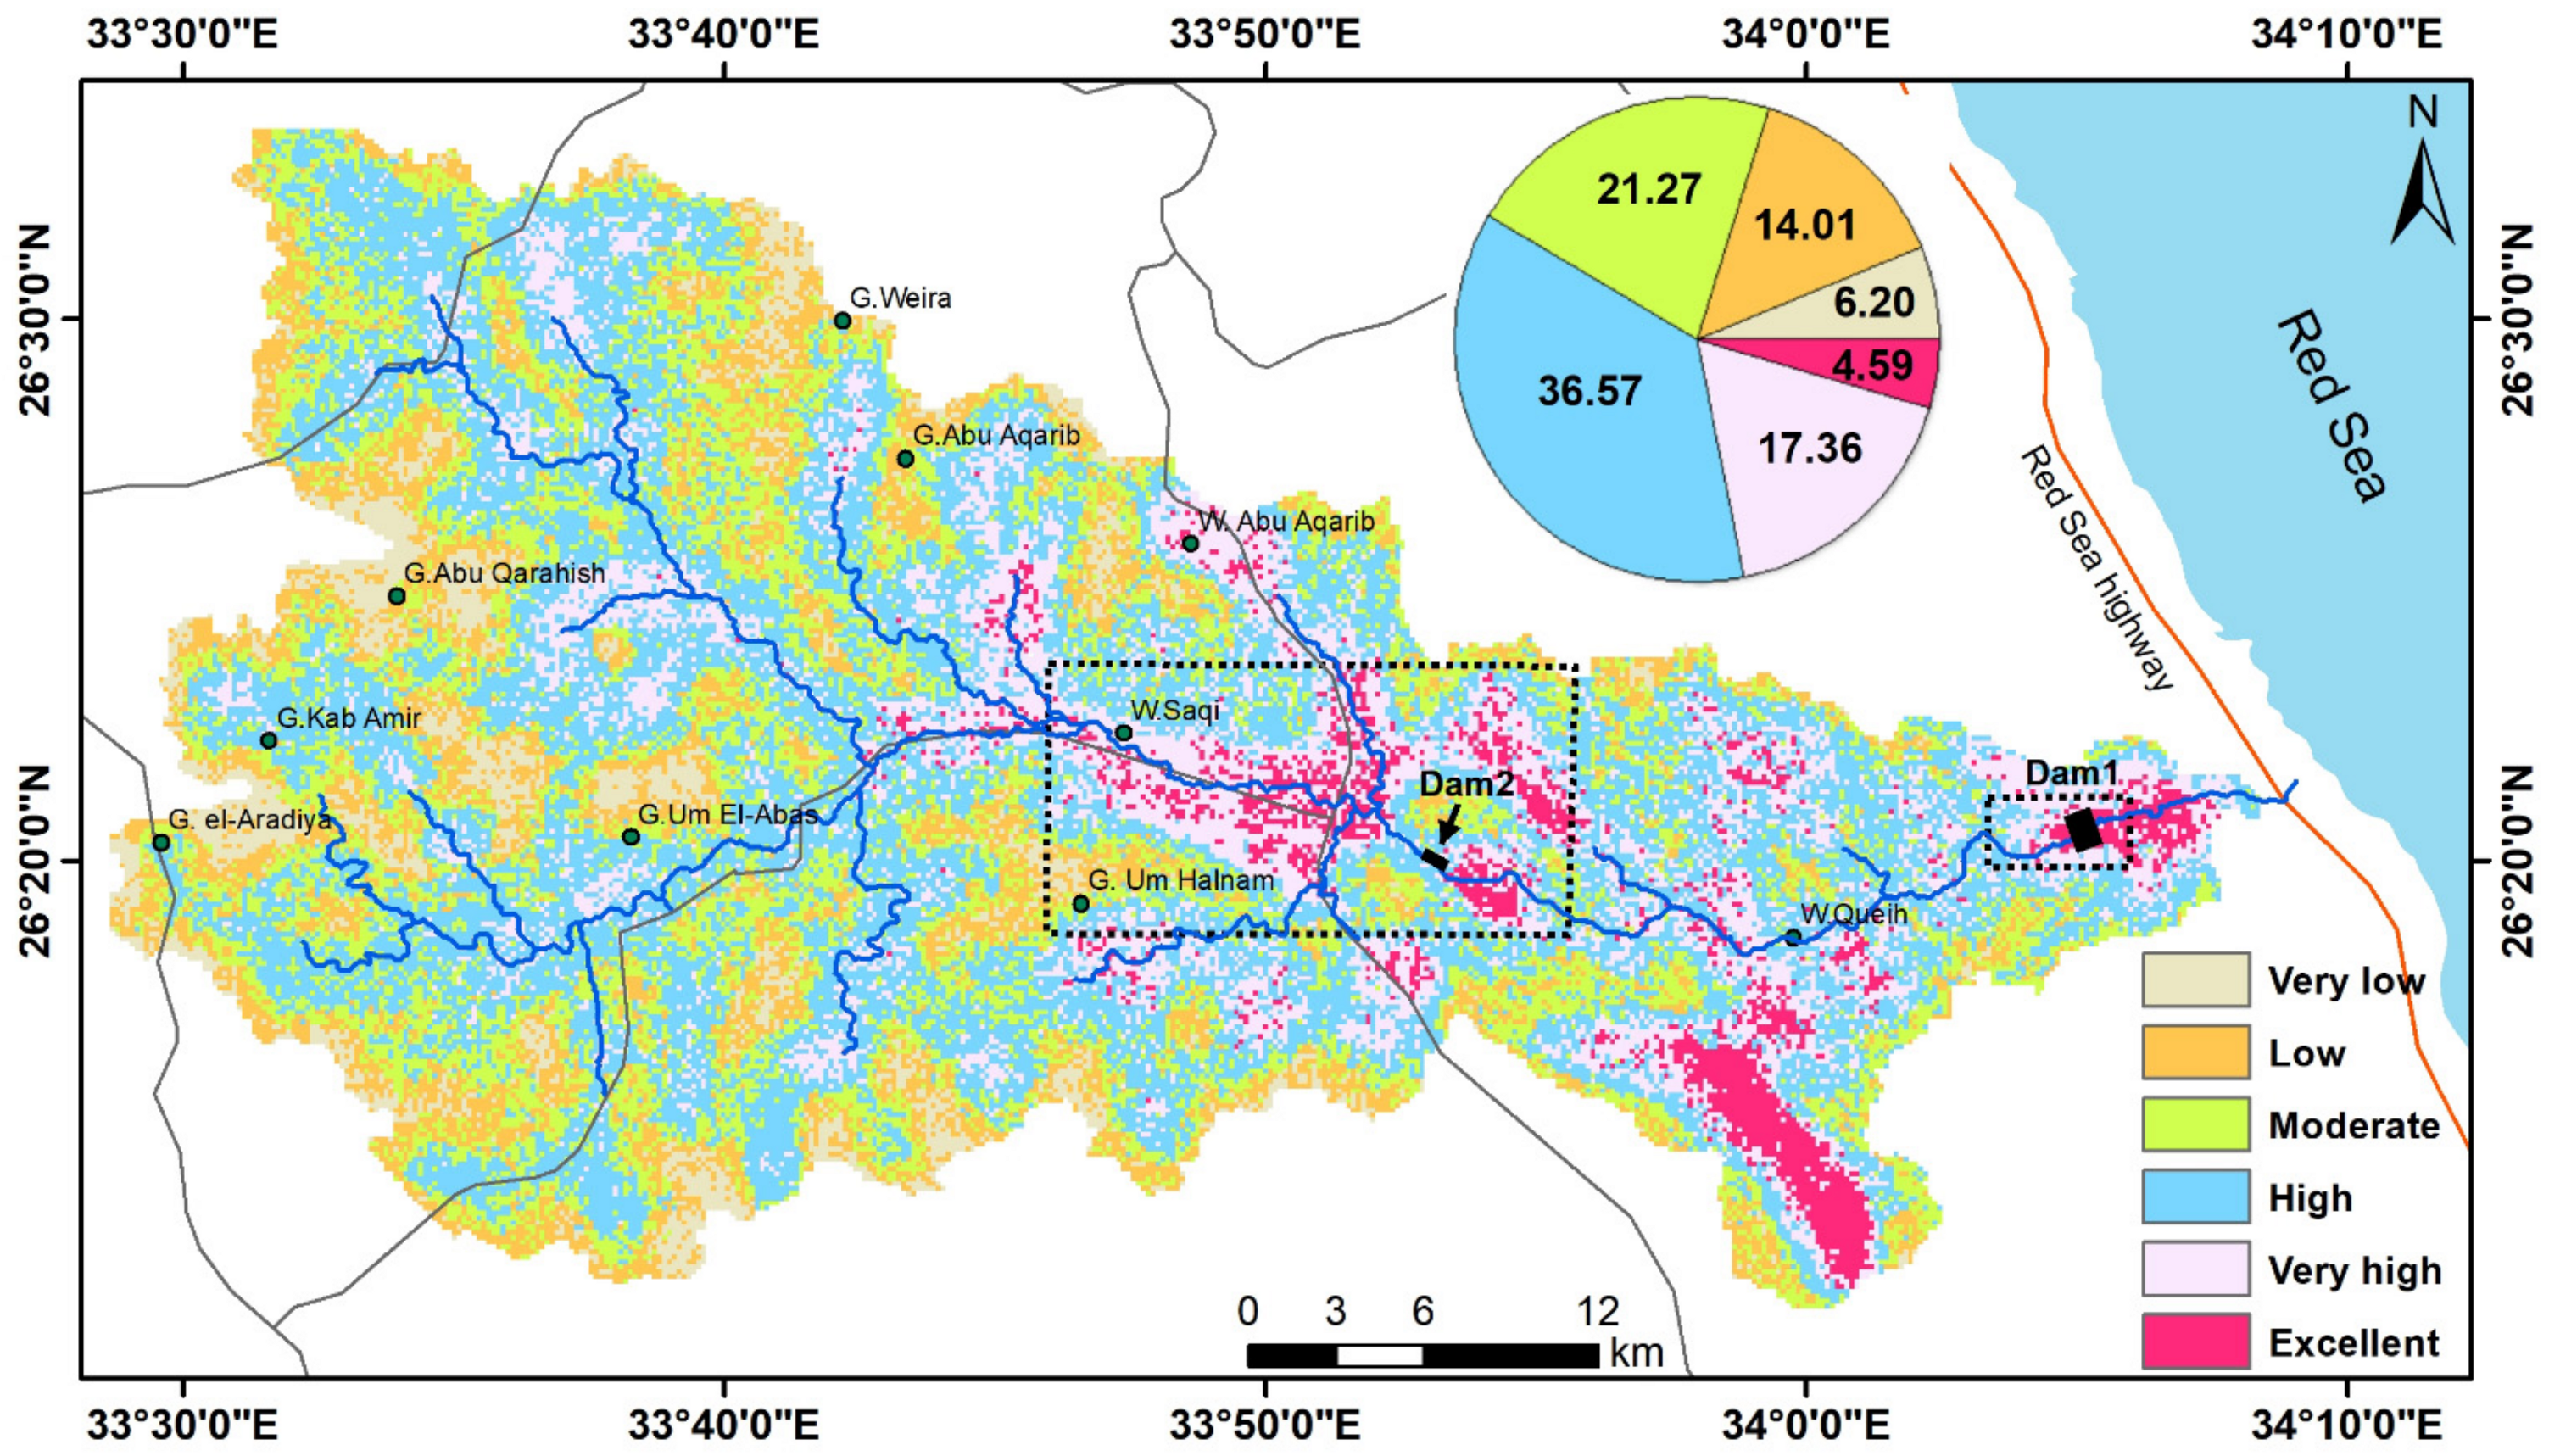
5. Potential Areas of Rainwater Harvesting and Water Accumulation
6. Discussion
7. Conclusions
Author Contributions
Funding
Data Availability Statement
Conflicts of Interest
Abbreviations
| SRTM | Shuttle Radar Topography Mission | DEM | Digital Elevation Model |
| TRMM | Tropical Rainfall Measuring Mission | OLI | Operational Land Imager |
| ALOS | Advanced Land Observing Satellite | RS | Remote Sensing |
| PALSAR | Phased-Array-Type L-band Synthetic Aperture Radar | AHP | Analytical Hierarchy Process |
| GIS | Geographic Information System | LU/LC | Land Use/Land Cover |
| TWI | Topographic Wetness Index | NIR | Near Infrared |
| PZWA | Prospective Zones of Water Accumulation | SNAP | The Sentinel Application Platform |
| InSAR | Interferometry Synthetic Aperture Radar | CCD | Coherence Change Detection |
| NDVI | Normalized Difference Vegetation Index | MHz | Megahertz |
| 8D | Deterministic Eight-Neighbors | CR | Consistency Ratio |
| USGS | United States Geological Survey | CI | Consistency Index |
| TRI | Terrain Roughness Index | SLC | Single Look Complex |
| ENVI | Environment for Visualizing Images | R | Red Band |
| WGS 84 | World Geodetic System 1984 | DR | Distance to River |
| Dd | Drainage Density | Lin | Lineaments |
| Lith | Lithology | Rad | Radar Intensity |
| Curv | Curvature | GW | Groundwater |
| NE | Northeast | SW | Southwest |
References
- FAO. Coping with Water Scarcity: An Action Framework for Agriculture and Food Security; Food and Agriculture Organization of the United Nations: Rome, Italy, 2012; p. 100. [Google Scholar]
- FAO. Climate Change and Food Security: Risks and Responses; Food and Agriculture Organization of the United Nations: Rome, Italy, 2015; p. 122. [Google Scholar]
- FAO. Towards a Water and Food Secure Future: Critical Perspectives for Policy-Makers; Food and Agriculture Organization of the United Nations: Rome, Italy, 2015; p. 61. Available online: http://www.fao.org/nr/water/docs/FAO_WWC_white_paper_web.pdf (accessed on 12 March 2023).
- IPCC. Climate Change: Synthesis Report. Contribution of Working Groups I, II, and III to the Fifth Assessment Report of the Intergovernmental Panel on Climate Change; Core Writing Team, Pachauri, R.K., Meyer, L.A., Eds.; IPCC: Geneva, Switzerland, 2014; p. 151. [Google Scholar]
- IPCC. Sections. In Climate Change 2023: Synthesis Report. Contribution of Working Groups I, II and III to the Sixth Assessment Report of the Intergovernmental Panel on Climate Change; Core Writing Team, Lee, H., Romero, J., Eds.; IPCC: Geneva, Switzerland, 2023; pp. 35–115. [Google Scholar] [CrossRef]
- Furumai, H. Rainwater and reclaimed wastewater for sustainable urban water use. Phys. Chem. Earth Parts A/B/C 2008, 33, 340–346. [Google Scholar] [CrossRef]
- Guo, Z.; Torra, O.; Hürlimann, M.; Abancó, C.; Medina, V. FSLAM: A QGIS plugin for fast regional susceptibility assessment of rainfall-induced landslides. Environ. Model. Softw. 2022, 150, 105354. [Google Scholar] [CrossRef]
- Ffolliott, P.F.; Brooks, K.N.; Neary, D.G. Water harvesting in arid and semi-arid regions. Hydrol. Water Resour. Ariz. Southwest J. 2014, 43, 41–44. Available online: http://hdl.handle.net/10150/627369 (accessed on 10 May 2023).
- Zheng, H.; Gao, J.; Xie, G.; Jin, Y.; Zhang, B. Identifying important ecological areas for potential rainwater harvesting in the semi-arid area of Chifeng, China. PLoS ONE 2018, 13, e0201132. [Google Scholar] [CrossRef]
- UNEP. Rainwater Harvesting and Utilization: An Environmentally Sound Approach for Sustainable Urban Water Management: An Introductory Guide for Decision-Makers; UNEP: Osaka, Japan, 2002; Available online: https://www.ircwash.org/sites/default/files/213.1-01RA-17421.pdf (accessed on 10 May 2023).
- UN-HABITAT. Rainwater Harvesting and Utilization; UN-HABITAT: Nairobi, Kenya, 2005; Available online: https://sswm.info/sites/default/files/reference_attachments/UN-HABITAT%202005%20Rainwater%20Harvesting%20and%20Utilisation%20Book%202.pdf (accessed on 8 July 2023).
- Razandi, Y.; Pourghasemi, H.R.; Neisani, N.S.; Rahmati, O. Application of analytical hierarchy process, frequency ratio, and certainty factor models for groundwater potential mapping using GIS. Earth Sci. Inform. 2015, 8, 867–883. [Google Scholar] [CrossRef]
- Alarifi, S.S.; Abdelkareem, M.; Abdalla, F.; Alotaibi, M. Flash Flood Hazard Mapping Using Remote Sensing and GIS Techniques in Southwestern Saudi Arabia. Sustainability 2022, 14, 14145. [Google Scholar] [CrossRef]
- Abdel-Shafy, H.I.; El-Sahary, A.A.; Regelsberger, M.; Platzer, C. Rainwater in Egypt: Quantity, distribution, and harvesting. Mediterr. Mar. Sci. 2010, 11, 245–257. [Google Scholar] [CrossRef]
- Manap, M.A.; Sulaiman, W.N.A.; Ramli, M.F.; Pradhan, B.; Surip, N. A knowledge-driven GIS modeling technique for groundwater potential mapping at the Upper Langat Basin, Malaysia. Arab. J. Geosci. 2011, 6, 1621–1637. [Google Scholar] [CrossRef]
- Avand, M.; Janizadeh, S.; Tien Bui, D.; Pham, V.H.; Ngo, P.T.T.; Nhu, V.-H. A tree-based intelligence ensemble approach for spatial prediction of potential groundwater. Int. J. Digit. Earth 2020, 13, 1408–1429. [Google Scholar] [CrossRef]
- Abdelkareem, M.; Abdalla, F. Revealing potential areas of water resources using integrated remote-sensing data and GIS-based analytical hierarchy process. Geocarto Int. 2022, 37, 8672–8696. [Google Scholar] [CrossRef]
- Zhu, Q.; Abdelkareem, M. Mapping groundwater potential zones using a knowledge-driven approach and GIS analysis. Water 2021, 13, 579. [Google Scholar] [CrossRef]
- Wheater, H.S.; Mathias, S.A.; Li, X. Groundwater Modelling in Arid and Semi-Arid Areas; Cambridge University Press: Cambridge, UK, 2010; pp. 119–130. [Google Scholar]
- Rahman, A. A GIS-based DRASTIC model for assessing groundwater vulnerability in shallow aquifer in Aligarh, India. Appl. Geogr. 2008, 28, 32–53. [Google Scholar] [CrossRef]
- Mondal, N.C.; Adike, S.; Singh, V.S.; Ahmed, S.; Jayakumar, K.V. Determining shallow aquifer vulnerability by the DRASTIC model and hydrochemistry in granitic terrain, southern India. J. Earth Syst. Sci. 2017, 126, 89. [Google Scholar] [CrossRef]
- Mondal, N.C.; Adike, S.; Ahmed, S. Development of entropy-based model for pollution risk assessment of hydrogeological system. Arab. J. Geosci. 2018, 11, 375. [Google Scholar] [CrossRef]
- Yeh, H.-F.; Cheng, Y.-S.; Lin, H.-I.; Lee, C.-H. Mapping groundwater recharge potential zone using a GIS approach in Hualian River, Taiwan. Sustain. Environ. Res. 2016, 26, 33–34. [Google Scholar] [CrossRef]
- De Winnaar, G.; Jewitt, G.P.W.; Horan, M. A GIS-based approach for identifying potential runoff harvesting sites in the Thukela River basin, South Africa. Phys. Chem. Earth 2007, 32, 1058–1067. [Google Scholar] [CrossRef]
- Mahmoud, S.H.; Alazba, A.A. The potential of in situ rainwater harvesting in arid regions: Developing a methodology to identify suitable areas using GIS-based decision support system. Arab. J. Geosci. 2014, 8, 5167–5179. [Google Scholar] [CrossRef]
- Rejani, R.; Rao, K.V.; Srinivasa Rao, C.H.; Osmano, M.; Sammi Reddy, K.; George, B.; Pratyusha Kranthi, G.S.; Chary, G.R.; Swamy, M.V.; Rao, P.J. Identification of potential rainwater-harvesting sites for the sustainable management of a semi-arid watershed. Irrig. Drain. 2017, 66, 227–237. [Google Scholar] [CrossRef]
- Li, Y.; Abdelkareem, M.; Al-Arifi, N. Mapping Potential Water Resource Areas Using GIS-Based Frequency Ratio and Evidential Belief Function. Water 2023, 15, 480. [Google Scholar] [CrossRef]
- Machiwal, D.; Rangi, N.; Sharma, A. Integrated knowledge- and data-driven approaches for groundwater potential zoning using GIS and multi-criteria decision-making techniques on hard-rock terrain of Ahar catchment, Rajasthan, India. Environ. Earth Sci. 2014, 73, 1871–1892. [Google Scholar] [CrossRef]
- Rahmati, O.; Samani, A.N.; Mahdavi, M.; Pourghasemi, H.R.; Zeinivand, H. Groundwater potential mapping at Kurdistan region of Iran using analytic hierarchy process and GIS. Arab. J. Geosci. 2014, 8, 7059–7071. [Google Scholar] [CrossRef]
- Kumar, V.A.; Mondal, N.C.; Ahmed, S. Identification of Groundwater Potential Zones Using RS, GIS and AHP Techniques: A Case Study in a Part of Deccan Volcanic Province (DVP), Maharashtra, India. J. Indian Soc. Remote Sens. 2020, 48, 497–511. [Google Scholar] [CrossRef]
- Riad, P.; Billib, M.; Hassan, A.; Salam, M.A.; El Din, M.N. Application of the overlay weighted model and boolean logic to determine the best locations for artificial recharge of groundwater. J. Urban Environ. Eng. 2011, 5, 57–66. [Google Scholar] [CrossRef]
- Mallick, J.; Khan, R.A.; Ahmed, M.; Alqadhi, S.D.; Alsubih, M.; Falqi, I.; Hasan, M.A. Modeling Groundwater Potential Zone in a Semi-Arid Region of Aseer Using Fuzzy-AHP and Geoinformation Techniques. Water 2019, 11, 2656. [Google Scholar] [CrossRef]
- Sun, T.; Cheng, W.; Abdelkareem, M.; Al-Arifi, N. Mapping Prospective Areas of Water Resources and Monitoring Land Use/Land Cover Changes in an Arid Region Using Remote Sensing and GIS Techniques. Water 2022, 14, 2435. [Google Scholar] [CrossRef]
- Abdekareem, M.; Al-Arifi, N.; Abdalla, F.; Mansour, A.; El-Baz, F. Fusion of Remote Sensing Data Using GIS-Based AHP-Weighted Overlay Techniques for Groundwater Sustainability in Arid Regions. Sustainability 2022, 14, 7871. [Google Scholar] [CrossRef]
- Adham, A.; Riksen, M.; Ouessar, M.; Ritsema, C. Identification of suitable sites for rainwater harvesting structures in arid and semi-arid regions: A review. Int. Soil Water Conserv. Res. 2016, 4, 108–120. [Google Scholar]
- Ajaykumar, K.K.; Sanjay, S.K.; Nagesh, N.P.; Pawar, N.J.; Sankhua, R.N. Identifying Potential Rainwater Harvesting Sites of a Semi-arid, Basaltic Region of Western India, Using SCS-CN Method. Water Resour Manag. 2012, 26, 2537–2554. [Google Scholar]
- Hürlimann, M.; Guo, Z.; Puig-Polo, C.; Medina, V. Impacts of future climate and land cover changes on landslide susceptibility: Regional scale modeling in the Val d’Aran region (Pyrenees, Spain). Landslides 2022, 19, 99–118. [Google Scholar] [CrossRef]
- Hong, Y.; Abdelkareem, M. Integration of remote sensing and a GIS-based method for revealing prone areas to flood hazards and predicting optimum areas of groundwater resources. Arab. J. Geosci. 2022, 15, 114. [Google Scholar] [CrossRef]
- Chenini, I.; Ben Mammou, A. Groundwater recharge study in arid region: An approach using GIS techniques and numerical modeling. Comput. Geosci. 2010, 36, 801–817. [Google Scholar] [CrossRef]
- Deepa, S.; Venkateswaran, S.; Ayyandurai, R.; Kannan, R.; Vijay Prabhu, M. Groundwater recharge potential zones mapping in upper Manimuktha Sub-basin Vellar river Tamil Nadu India using GIS and remote sensing techniques. Model. Earth Syst. Environ. 2016, 2, 137. [Google Scholar] [CrossRef]
- Abdelkareem, M.; El-Baz, F. Analyses of optical images and radar data reveal structural features and predict groundwater accumulations in the central Eastern Desert of Egypt. Arab. J. Geosci. 2015, 8, 2653–2666. [Google Scholar] [CrossRef]
- Chowdhury, A.; Jha, M.K.; Chowdhury, V.M.; Mal, B.C. Integrated remote sensing and GIS-based approach for assessing groundwater potential in West Mednapur district, West Bengal, India. Int. J. Remote Sens. 2009, 30, 231–250. [Google Scholar] [CrossRef]
- Abdelkareem, M.; El-Baz, F.; Askalany, M.; Akawy, A.; Ghoneim, E. Groundwater prospect map of Egypt’s Qena Valley using data fusion. Int. J. Image Data Fusion 2012, 3, 169–189. [Google Scholar] [CrossRef]
- Satapathy, I.; Syed, T.H. Characterization of groundwater potential and artificial recharge sites in Bokaro District, Jharkhand (India), using remote sensing and GIS-based techniques. Environ. Earth Sci. 2015, 74, 4215–4232. [Google Scholar] [CrossRef]
- Sonbol, M.A. Sustainable Systems of Water Harvesting in Arid Regions, A Case Study: Sinai Peninsula–Egypt. In Proceedings of the 2nd International Conference on Water Resources & Arid Environment, Riyadh, Saudi Arabia, 26–29 November 2006; pp. 1–13. [Google Scholar]
- Abdelkareem, M. Targeting flash flood potential areas using remotely sensed data and GIS techniques. Nat. Hazards J. 2017, 85, 19–37. [Google Scholar] [CrossRef]
- Abdelkareem, M.; Mansour, A. Risk assessment and management of vulnerable areas to flash flood hazards in arid regions using remote sensing and GIS-based knowledge-driven techniques. Nat. Hazards 2023, 117, 2269–2295. [Google Scholar] [CrossRef]
- Machiwal, D.; Jha, M.K. Identifying Sources of Groundwater Contamination in a Hard-Rock Aquifer System Using Multivariate Statistical Analyses and GIS-Based Geostatistical Modeling Techniques. J. Hydrol. Reg. Stud. 2015, 4, 80–110. [Google Scholar] [CrossRef]
- Rashash, A.; El-Nahry, A. Rain Water Harvesting Using GIS and RS for Agriculture Development in Northern Western Coast, Egypt. Geogr. Nat. Disast 2015, 5, 2. [Google Scholar] [CrossRef]
- Abdelkareem, M.; Al-Arifi, N. The use of remotely sensed data to reveal geologic, structural, and hydrologic features and predict potential areas of water resources in arid regions. Arab. J. Geosci. 2021, 14, 704. [Google Scholar] [CrossRef]
- Yariyan, P.; Avand, M.; Omidvar, E.; Pham, Q.B.; Linh, N.T.T.; Tiefenbacher, J.P. Optimization of statistical and machine learning hybrid models for groundwater potential mapping. Geocarto Int. 2020, 11, 2282–2314. [Google Scholar] [CrossRef]
- Fewkes, A. The use of rainwater for WC flushing: The field testing of a collection system. Build. Environ. 1999, 34, 765–772. [Google Scholar] [CrossRef]
- Lee, S.; Kim, R. Rainwater Harvesting. In Encyclopedia of Sustainability Science and Technology; Springer: New York, NY, USA, 2012; pp. 8688–8702. [Google Scholar]
- Kim, R.H.; Lee, S.; Kim, Y.M. Development of rainwater utilization system in Korea. In Proceedings of the 11th IRCSA, Mexico City, Mexico, 25–29 August 2003. [Google Scholar]
- Conoco. Geological Map of Egypt, Scale 1:500,000; The Egyptian General Petroleum Corporation: Cairo, Egypt, 1987. [Google Scholar]
- Mosalem, A.; Redwan, M.; Abdel Moneim, A.A.; Rezk, S. Hydrogeochemical Characteristics of Groundwater from Wadi Asal and Wadi Queih, Quseir, Red Sea, Egypt. Sohag J. Sci. 2023, 8, 113–117. [Google Scholar] [CrossRef]
- Nasr, A.; Abdelkareem, M.; Moubark, K. Integration of remote sensing and GIS for mapping flash flood hazards, Wadi Queih, Egypt. SVU-Int. J. Agric. Sci. 2023, 4, 197–206. [Google Scholar] [CrossRef]
- Dabash, M.H.A. Evaluation of water resources in the area between Quseir–Safaga, Northern Red Sea Coast, Egypt. MSc Thesis, Faculty of Science, Assuit University, Assiut, Egypt, 2004; 180p. [Google Scholar]
- Saaty, T.A. scaling method for priorities in hierarchical structures. J. Math. Psychol. 1977, 15, 234–281. [Google Scholar] [CrossRef]
- Obi Reddy, G.P. Evaluation of groundwater potential zones using remote sensing data—A case study of Gaimukh watershed, Bhanadra District, Maharastra. J. Indian Soc. Remote Sens. 2000, 28, 19–32. [Google Scholar] [CrossRef]
- Eastman, J.R. Multi-criteria evaluation and GIS. In Geographical Information Systems, 2nd ed.; Longley, P.A., Ed.; John Wiley and Sons: New York, NY, USA, 1996; Volume 1, pp. 493–502. [Google Scholar]
- Abdalla, F.; El Shamy, I.; Bamousa, A.O.; Mansour, A.; Mohamed, A.; Tahoon, M. Flash Floods and GroundwaterRecharge Potentials in Arid Land Alluvial Basins, Southern RedSea Coast, Egypt. Int. J. Geosci. 2014, 5, 971–982. [Google Scholar] [CrossRef]
- Abdelkareem, M.; Mansour, A.; Akawy, A. Mapping Groundwater Recharge Potential in the Nile Basin Using Remotely Sensed Data and GIS Techniques. In Sustainability of Groundwater in the Nile Valley, Egypt; Springer International Publishing: Cham, Switzerland, 2022; pp. 293–318. [Google Scholar]
- Abdekareem, M.; Abdalla, F.; Al-Arifi, N.; Bamousa, A.; El-Baz, F. Using Remote Sensing and GIS-Based Frequency Ratio Technique for Revealing Groundwater Prospective Areas at Wadi Al Hamdh Watershed, Saudi Arabia. Water 2023, 15, 1154. [Google Scholar] [CrossRef]
- Aly, M.M.; Sakr, S.A.; Zayed, M.S.M. Selection of the optimum locations for rainwater harvesting in arid regions using WMS and remote sensing. Case Study: Wadi Hodein Basin, Red Sea, Egypt. Alex. Eng. J. 2022, 61, 9795–9810. [Google Scholar] [CrossRef]
- Kinzelbach, W.; Brunner, P.; Von Boetticher, A.; Kgotlhang, L.; Milzow, C. Sustainable water management in arid and semi-arid regions. In International Hydrology Series Groundwater Modelling in Arid and Semi-Arid Areas; Wheater, H.S., Mathias, S.A., Li, X., Eds.; Cambridge University Press: Cambridge, UK, 2010; pp. 119–130. [Google Scholar] [CrossRef]
- Schmid, T.; Koch, M.; Gumuzzio, J. Application of hyperspectral imagery to map soil salinity. In Remote Sensing of Soil Salinization: Impact and Land Management; Metternicht, G., Zinck, A., Eds.; CRC Press: Boca Raton, FL, USA; Taylor and Francis Publisher: Boca Raton, FL, USA, 2009; Chapter 7; pp. 113–139. [Google Scholar]


| No. | Type of Data | Source | Date | Resolution |
|---|---|---|---|---|
| 1 | Landsat-8 OLI | USGS/NASA | 2014 to 2023 | bands 2, 3, 4, 5, 6, and 7 (30 m) |
| 2 | Sentinel-1 | ESA/Copernicus | 2014 to 2023 | C-band SLC (12.5 m) |
| 3 | Sentinel-2 | ESA/Copernicus | 2014 to 2023 | bands 2, 3, 4, 8 (“10” m), 11, and 12 (“20” m) |
| 4 | PALSAR-2 JAXA | JAXA | 2017 | 25 m |
| 5 | SRTM DEM | USGS | 11–22 February 2000 | C-band (30 m) |
| 6 | TRMM data | NASA | January 1998 to November 2015 | 0.25 degrees in latitude and longitude |
| Elev | Slope | Curvature | TWI | SPI | Rainfall | Lin | Dd | Radar | Litho | NDVI | Coh | TRI | Criteria Weight | λmax | |
|---|---|---|---|---|---|---|---|---|---|---|---|---|---|---|---|
| Elev | 1.00 | 0.67 | 0.67 | 0.75 | 1.00 | 1.20 | 1.50 | 0.75 | 0.86 | 0.86 | 0.75 | 0.86 | 0.67 | 0.84 | 13 |
| Slope | 1.50 | 1.00 | 1.00 | 1.13 | 1.50 | 1.80 | 2.25 | 1.13 | 1.29 | 1.29 | 1.13 | 1.29 | 1.00 | 1.26 | 13 |
| Curvature | 1.50 | 1.00 | 1.00 | 1.13 | 1.50 | 1.80 | 2.25 | 1.13 | 1.29 | 1.29 | 1.13 | 1.29 | 1.00 | 1.26 | 13 |
| TWI | 1.33 | 0.89 | 0.89 | 1.00 | 1.33 | 1.60 | 2.00 | 1.00 | 1.14 | 1.14 | 1.00 | 1.14 | 0.89 | 1.12 | 13 |
| SPI | 1.00 | 0.67 | 0.67 | 0.75 | 1.00 | 1.20 | 1.50 | 0.75 | 0.86 | 0.86 | 0.75 | 0.86 | 0.67 | 0.84 | 13 |
| Rainfall | 0.83 | 0.56 | 0.56 | 0.63 | 0.83 | 1.00 | 1.25 | 0.63 | 0.71 | 0.71 | 0.63 | 0.71 | 0.56 | 0.70 | 13 |
| Lin | 0.67 | 0.44 | 0.44 | 0.50 | 0.67 | 0.80 | 1.00 | 0.50 | 0.57 | 0.57 | 0.50 | 0.57 | 0.44 | 0.56 | 13 |
| Dd | 1.33 | 0.89 | 0.89 | 1.00 | 1.33 | 1.60 | 2.00 | 1.00 | 1.14 | 1.14 | 1.00 | 1.14 | 0.89 | 1.12 | 13 |
| Radar | 1.17 | 0.78 | 0.78 | 0.88 | 1.17 | 1.40 | 1.75 | 0.88 | 1.00 | 1.00 | 0.88 | 1.00 | 0.78 | 0.98 | 13 |
| Litho | 1.17 | 0.78 | 0.78 | 0.88 | 1.17 | 1.40 | 1.75 | 0.88 | 1.00 | 1.00 | 0.88 | 1.00 | 0.78 | 0.98 | 13 |
| NDVI | 1.33 | 0.89 | 0.89 | 1.00 | 1.33 | 1.60 | 2.00 | 1.00 | 1.14 | 1.14 | 1.00 | 1.14 | 0.89 | 1.12 | 13 |
| Coh | 1.17 | 0.78 | 0.78 | 0.88 | 1.17 | 1.40 | 1.75 | 0.88 | 1.00 | 1.00 | 0.88 | 1.00 | 0.78 | 0.98 | 13 |
| TRI | 1.50 | 1.00 | 1.00 | 1.13 | 1.50 | 1.80 | 2.25 | 1.13 | 1.29 | 1.29 | 1.13 | 1.29 | 1.00 | 1.26 | 13 |
| Elevation | Rank | Normalized Weight % | Area % |
|---|---|---|---|
| 0–247 | 6 | 0.32 | 12 |
| 248–395 | 5 | 0.26 | 22.1 |
| 396–529 | 4 | 0.21 | 27.4 |
| 530–654 | 3 | 0.16 | 27.7 |
| 655–1039 | 1 | 0.05 | 10.8 |
| Slope | |||
| 0–6.1 | 8 | 0.286 | 34.01 |
| 6.2–12 | 7 | 0.250 | 28.26 |
| 13–18 | 6 | 0.214 | 20.39 |
| 19–26 | 5 | 0.179 | 12.86 |
| 27–67 | 2 | 0.071 | 4.49 |
| Curvature | |||
| −35 to −10 | 2 | 0.143 | 8.5 |
| −10.1 to 0 | 3 | 0.214 | 44.5 |
| 0 to 11 | 4 | 0.286 | 40.7 |
| 11 to 26 | 5 | 0.357 | 6.3 |
| TRI | |||
| 0.11–0.4 | 5 | 0.385 | 15.7 |
| 0.41–0.49 | 4 | 0.308 | 35.3 |
| 0.50–0.58 | 3 | 0.231 | 34.3 |
| 0.59–0.89 | 1 | 0.077 | 14.7 |
| Dd | |||
| 5.2–86 | 2 | 0.091 | 21.9 |
| 87–130 | 5 | 0.227 | 30.5 |
| 131–179 | 7 | 0.318 | 30.7 |
| 180–300 | 8 | 0.364 | 16.9 |
| TWI | |||
| −8.85 to −4.86 | 1 | 0.167 | 66.8 |
| −4.86–1 | 2 | 0.333 | 30.10 |
| 1–13.27 | 3 | 0.500 | 3.10 |
| SPI | |||
| 0–0.25 | 2 | 0.20 | 99.45 |
| 0.25–301.27 | 8 | 0.80 | 0.55 |
| Rainfall | |||
| 0.0109–0.0143 | 2 | 0.1 | 19.7 |
| 0.0144–0.0167 | 4 | 0.2 | 29.9 |
| 0.0168–0.0189 | 6 | 0.3 | 22.8 |
| 0.019–0.0213 | 8 | 0.4 | 27.6 |
| NDVI | |||
| 487–949 | 1 | 0.056 | 48.8 |
| 949–1367 | 3 | 0.167 | 40.9 |
| 1368–1700 | 6 | 0.333 | 8.2 |
| 1700–9494 | 8 | 0.444 | 2.1 |
| Radar | |||
| 0–116 | 5 | 0.556 | 42.5 |
| 116–193 | 3 | 0.333 | 33.7 |
| 193–225 | 1 | 0.111 | 23.8 |
| Lineaments | |||
| 0–17.55 | 2 | 0.0952 | 28.20 |
| 17.56–42.70 | 5 | 0.2381 | 30.33 |
| 42.71–69.61 | 6 | 0.2857 | 27.41 |
| 69.62–149.20 | 8 | 0.3810 | 14.06 |
| InSAR CCD | |||
| 0.08–0.44 | 7 | 0.389 | 8.55 |
| 0.44–0.62 | 6 | 0.333 | 20.12 |
| 0.62–0.75 | 3 | 0.167 | 35.93 |
| 0.75–0.97 | 2 | 0.111 | 35.40 |
| Lithology | |||
| Precambrian | 2 | 0.083 | 3.69 |
| K/T | 3 | 0.125 | 80.68 |
| Thebes | 5 | 0.208 | 5.67 |
| Miocene | 6 | 0.250 | 1.28 |
| Quaternary deposits | 8 | 0.333 | 8.68 |
Disclaimer/Publisher’s Note: The statements, opinions and data contained in all publications are solely those of the individual author(s) and contributor(s) and not of MDPI and/or the editor(s). MDPI and/or the editor(s) disclaim responsibility for any injury to people or property resulting from any ideas, methods, instructions or products referred to in the content. |
© 2023 by the authors. Licensee MDPI, Basel, Switzerland. This article is an open access article distributed under the terms and conditions of the Creative Commons Attribution (CC BY) license (https://creativecommons.org/licenses/by/4.0/).
Share and Cite
Abdelkareem, M.; Mansour, A.M.; Akawy, A. Delineating the Potential Areas of Rainwater Harvesting in Arid Regions Using Remote Sensing and GIS Techniques. Water 2023, 15, 3592. https://doi.org/10.3390/w15203592
Abdelkareem M, Mansour AM, Akawy A. Delineating the Potential Areas of Rainwater Harvesting in Arid Regions Using Remote Sensing and GIS Techniques. Water. 2023; 15(20):3592. https://doi.org/10.3390/w15203592
Chicago/Turabian StyleAbdelkareem, Mohamed, Abbas M. Mansour, and Ahmed Akawy. 2023. "Delineating the Potential Areas of Rainwater Harvesting in Arid Regions Using Remote Sensing and GIS Techniques" Water 15, no. 20: 3592. https://doi.org/10.3390/w15203592
APA StyleAbdelkareem, M., Mansour, A. M., & Akawy, A. (2023). Delineating the Potential Areas of Rainwater Harvesting in Arid Regions Using Remote Sensing and GIS Techniques. Water, 15(20), 3592. https://doi.org/10.3390/w15203592