
Catchment-Scale Land Use and Land Cover Change Analysis in Two Coastal Ramsar Sites in Ghana, Using Remote Sensing


Abstract
:1. Introduction
2. Materials and Methods
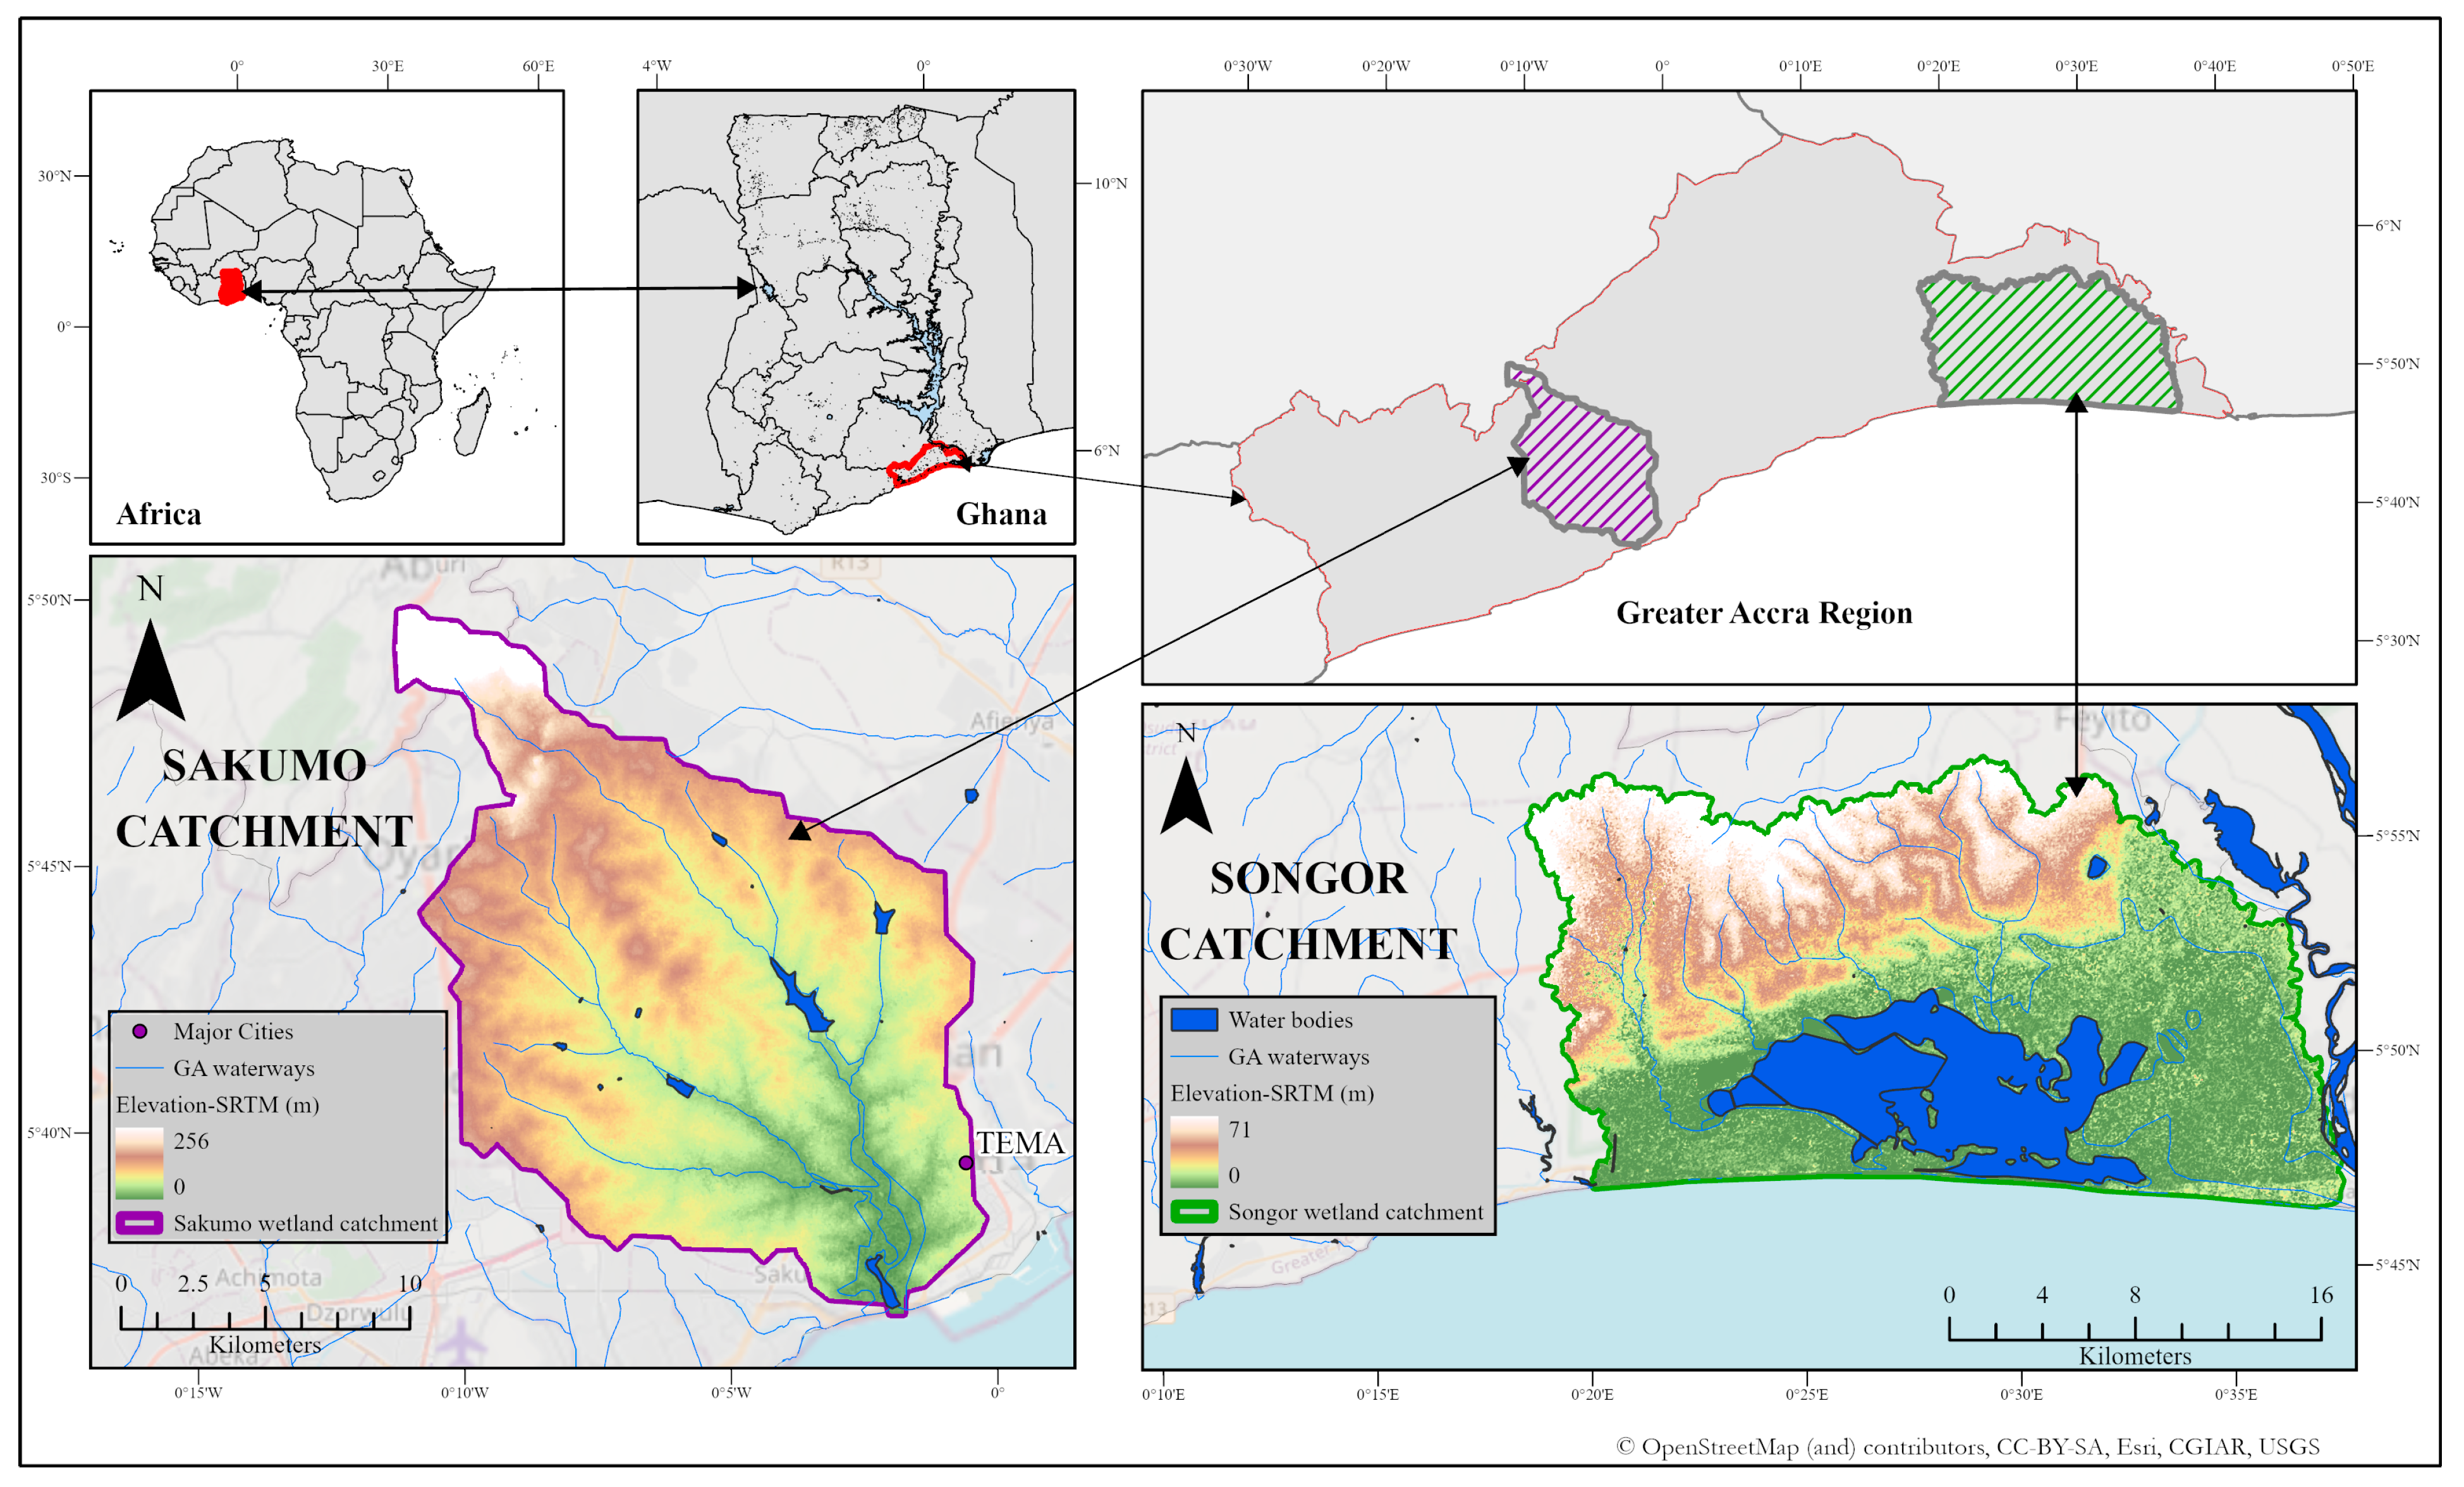
2.1. Study Area
2.2. Data Sources
Imagery Data Sources
2.3. LULC Classification and Validation
2.4. LULC Change Analysis
2.4.1. LULC Change
2.4.2. Intensity Analysis
2.5. Analysis of Change Indicators
2.5.1. Trends in Population
2.5.2. Trend of Meteorological Variables and Water Balance
3. Results
3.1. Accuracy Assessment of Landcover Classification from Satellite Observations
3.2. LULC Change Analysis
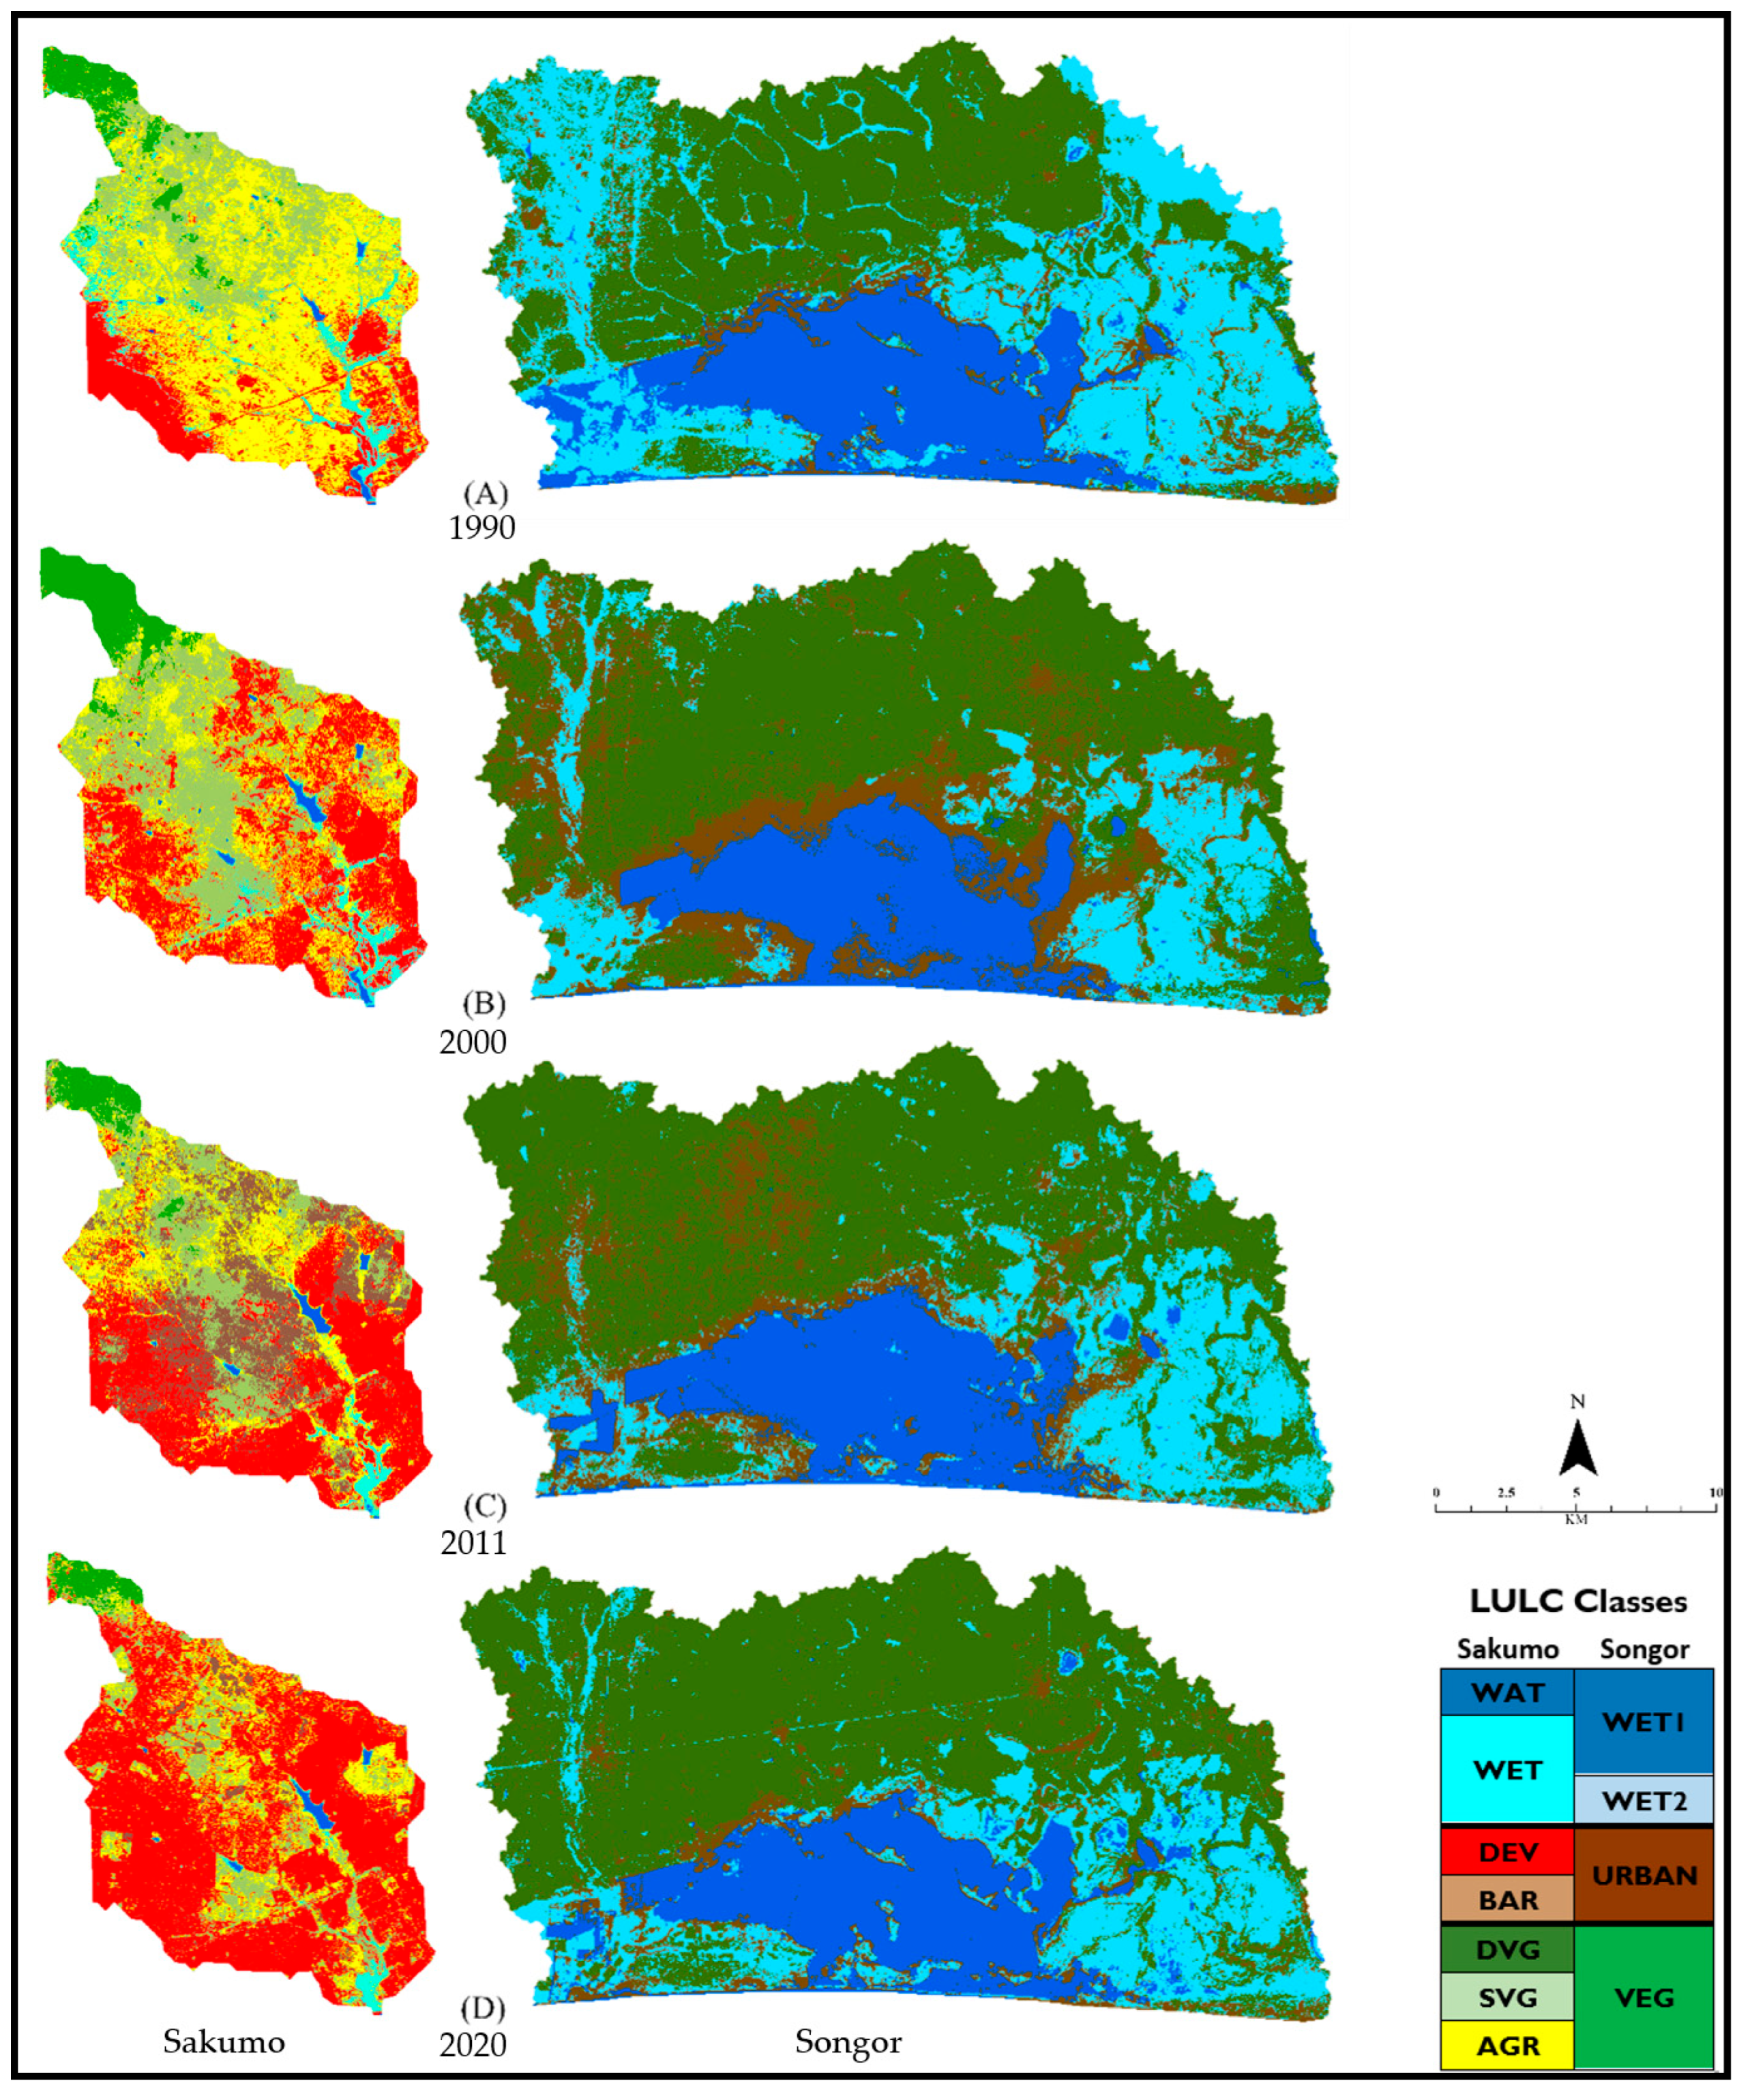
3.2.1. LULC Change
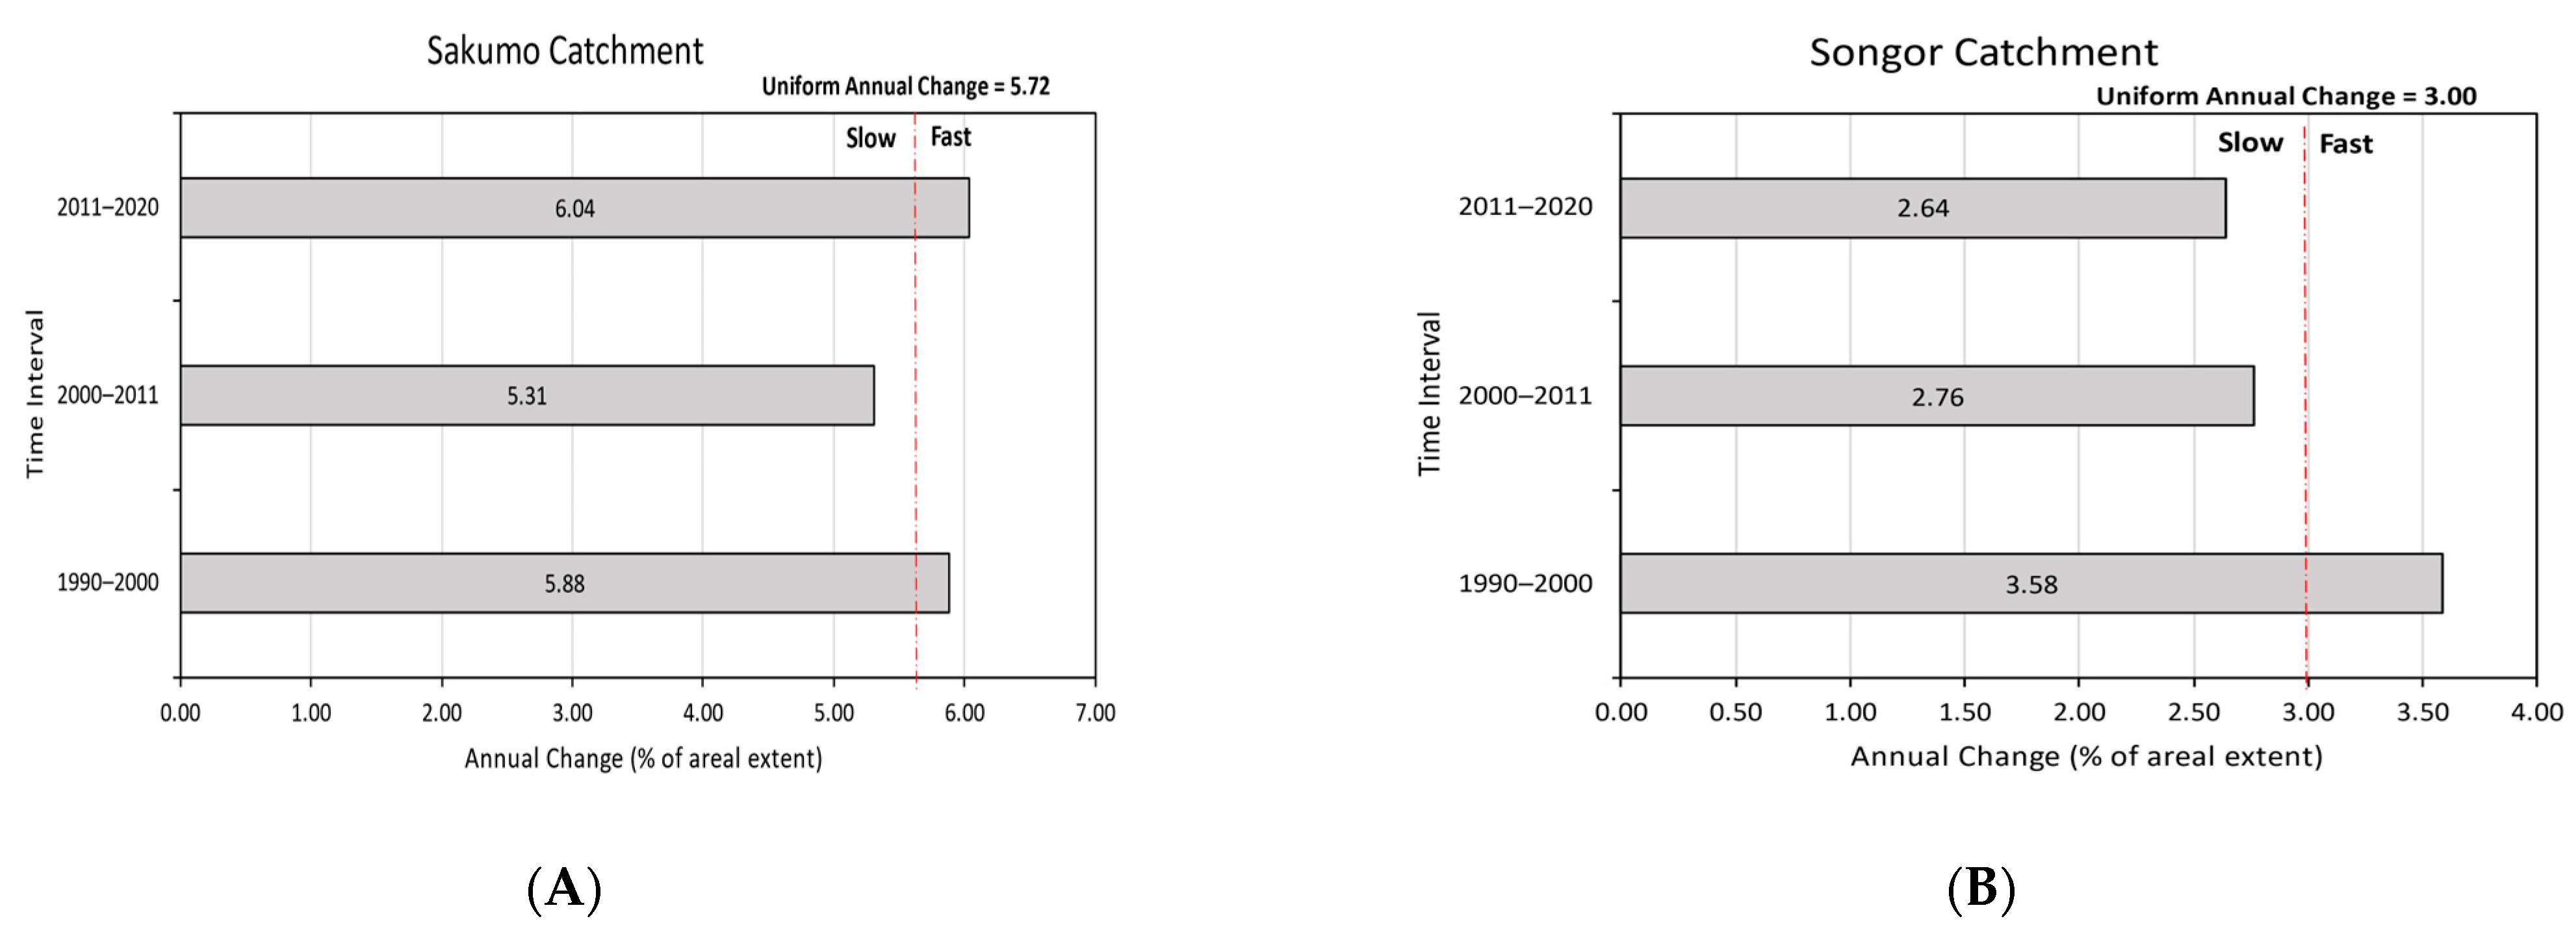
3.2.2. Intensity Analysis
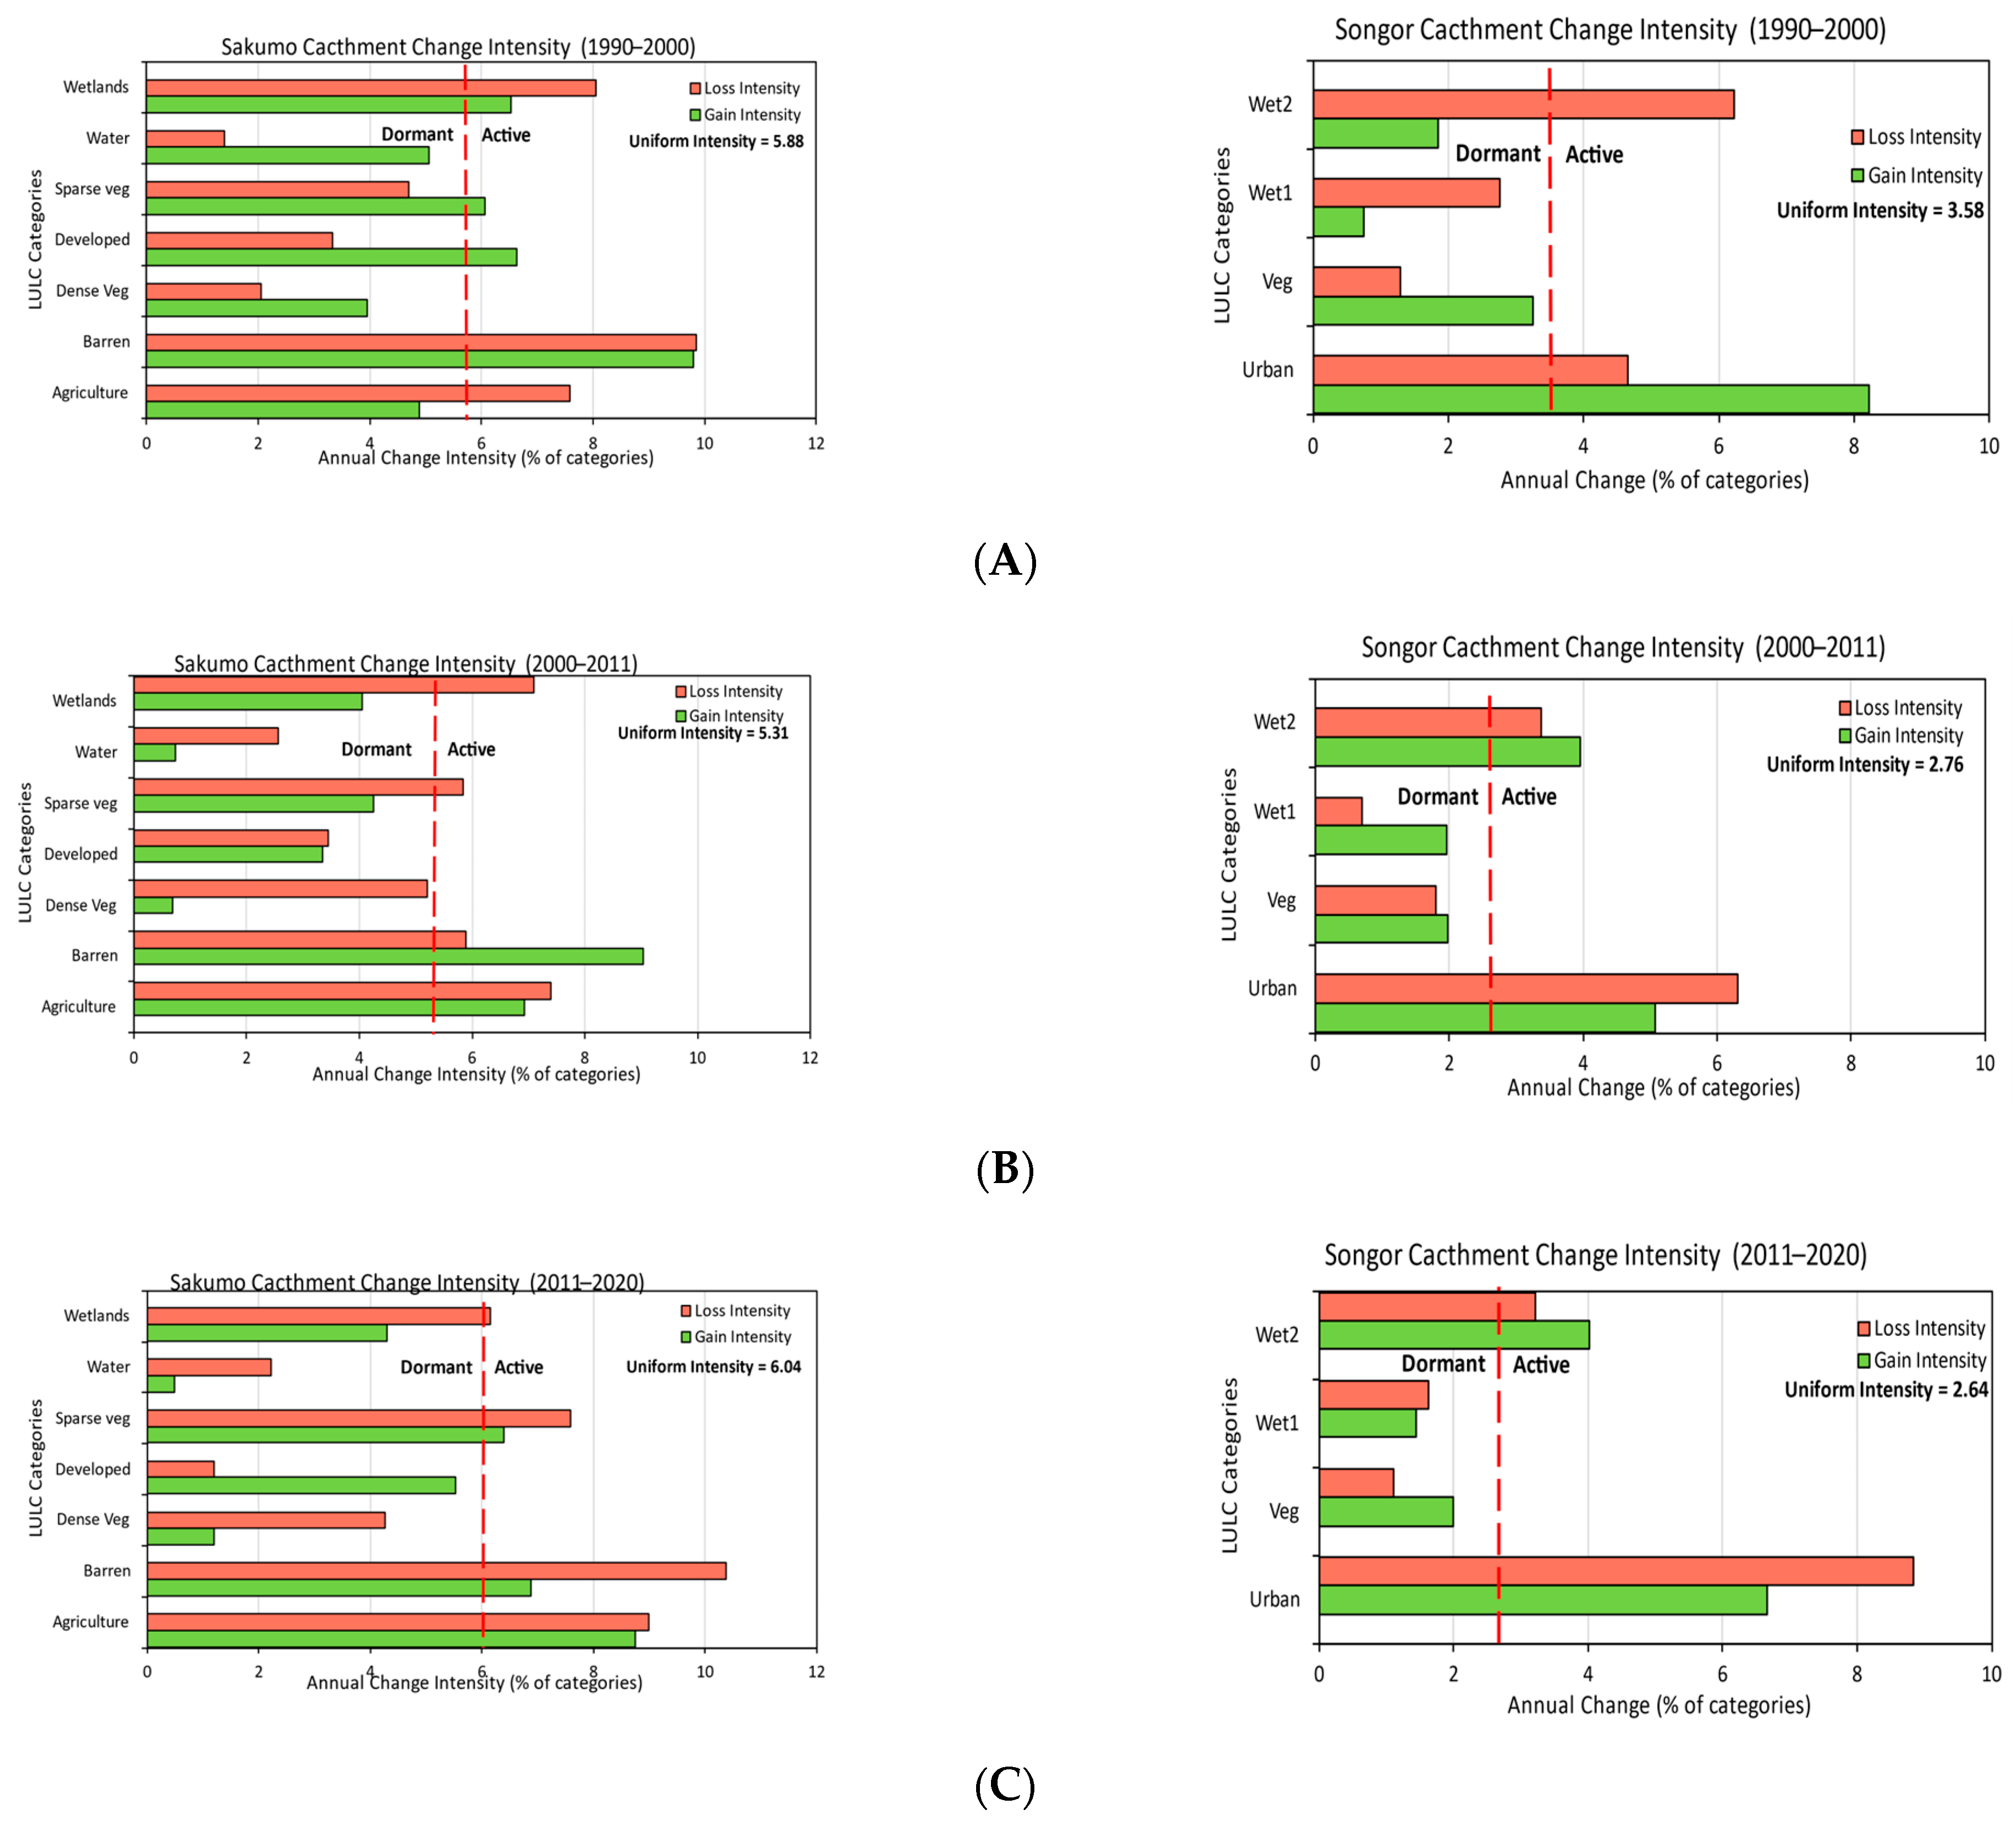
Interval Level
Category Level
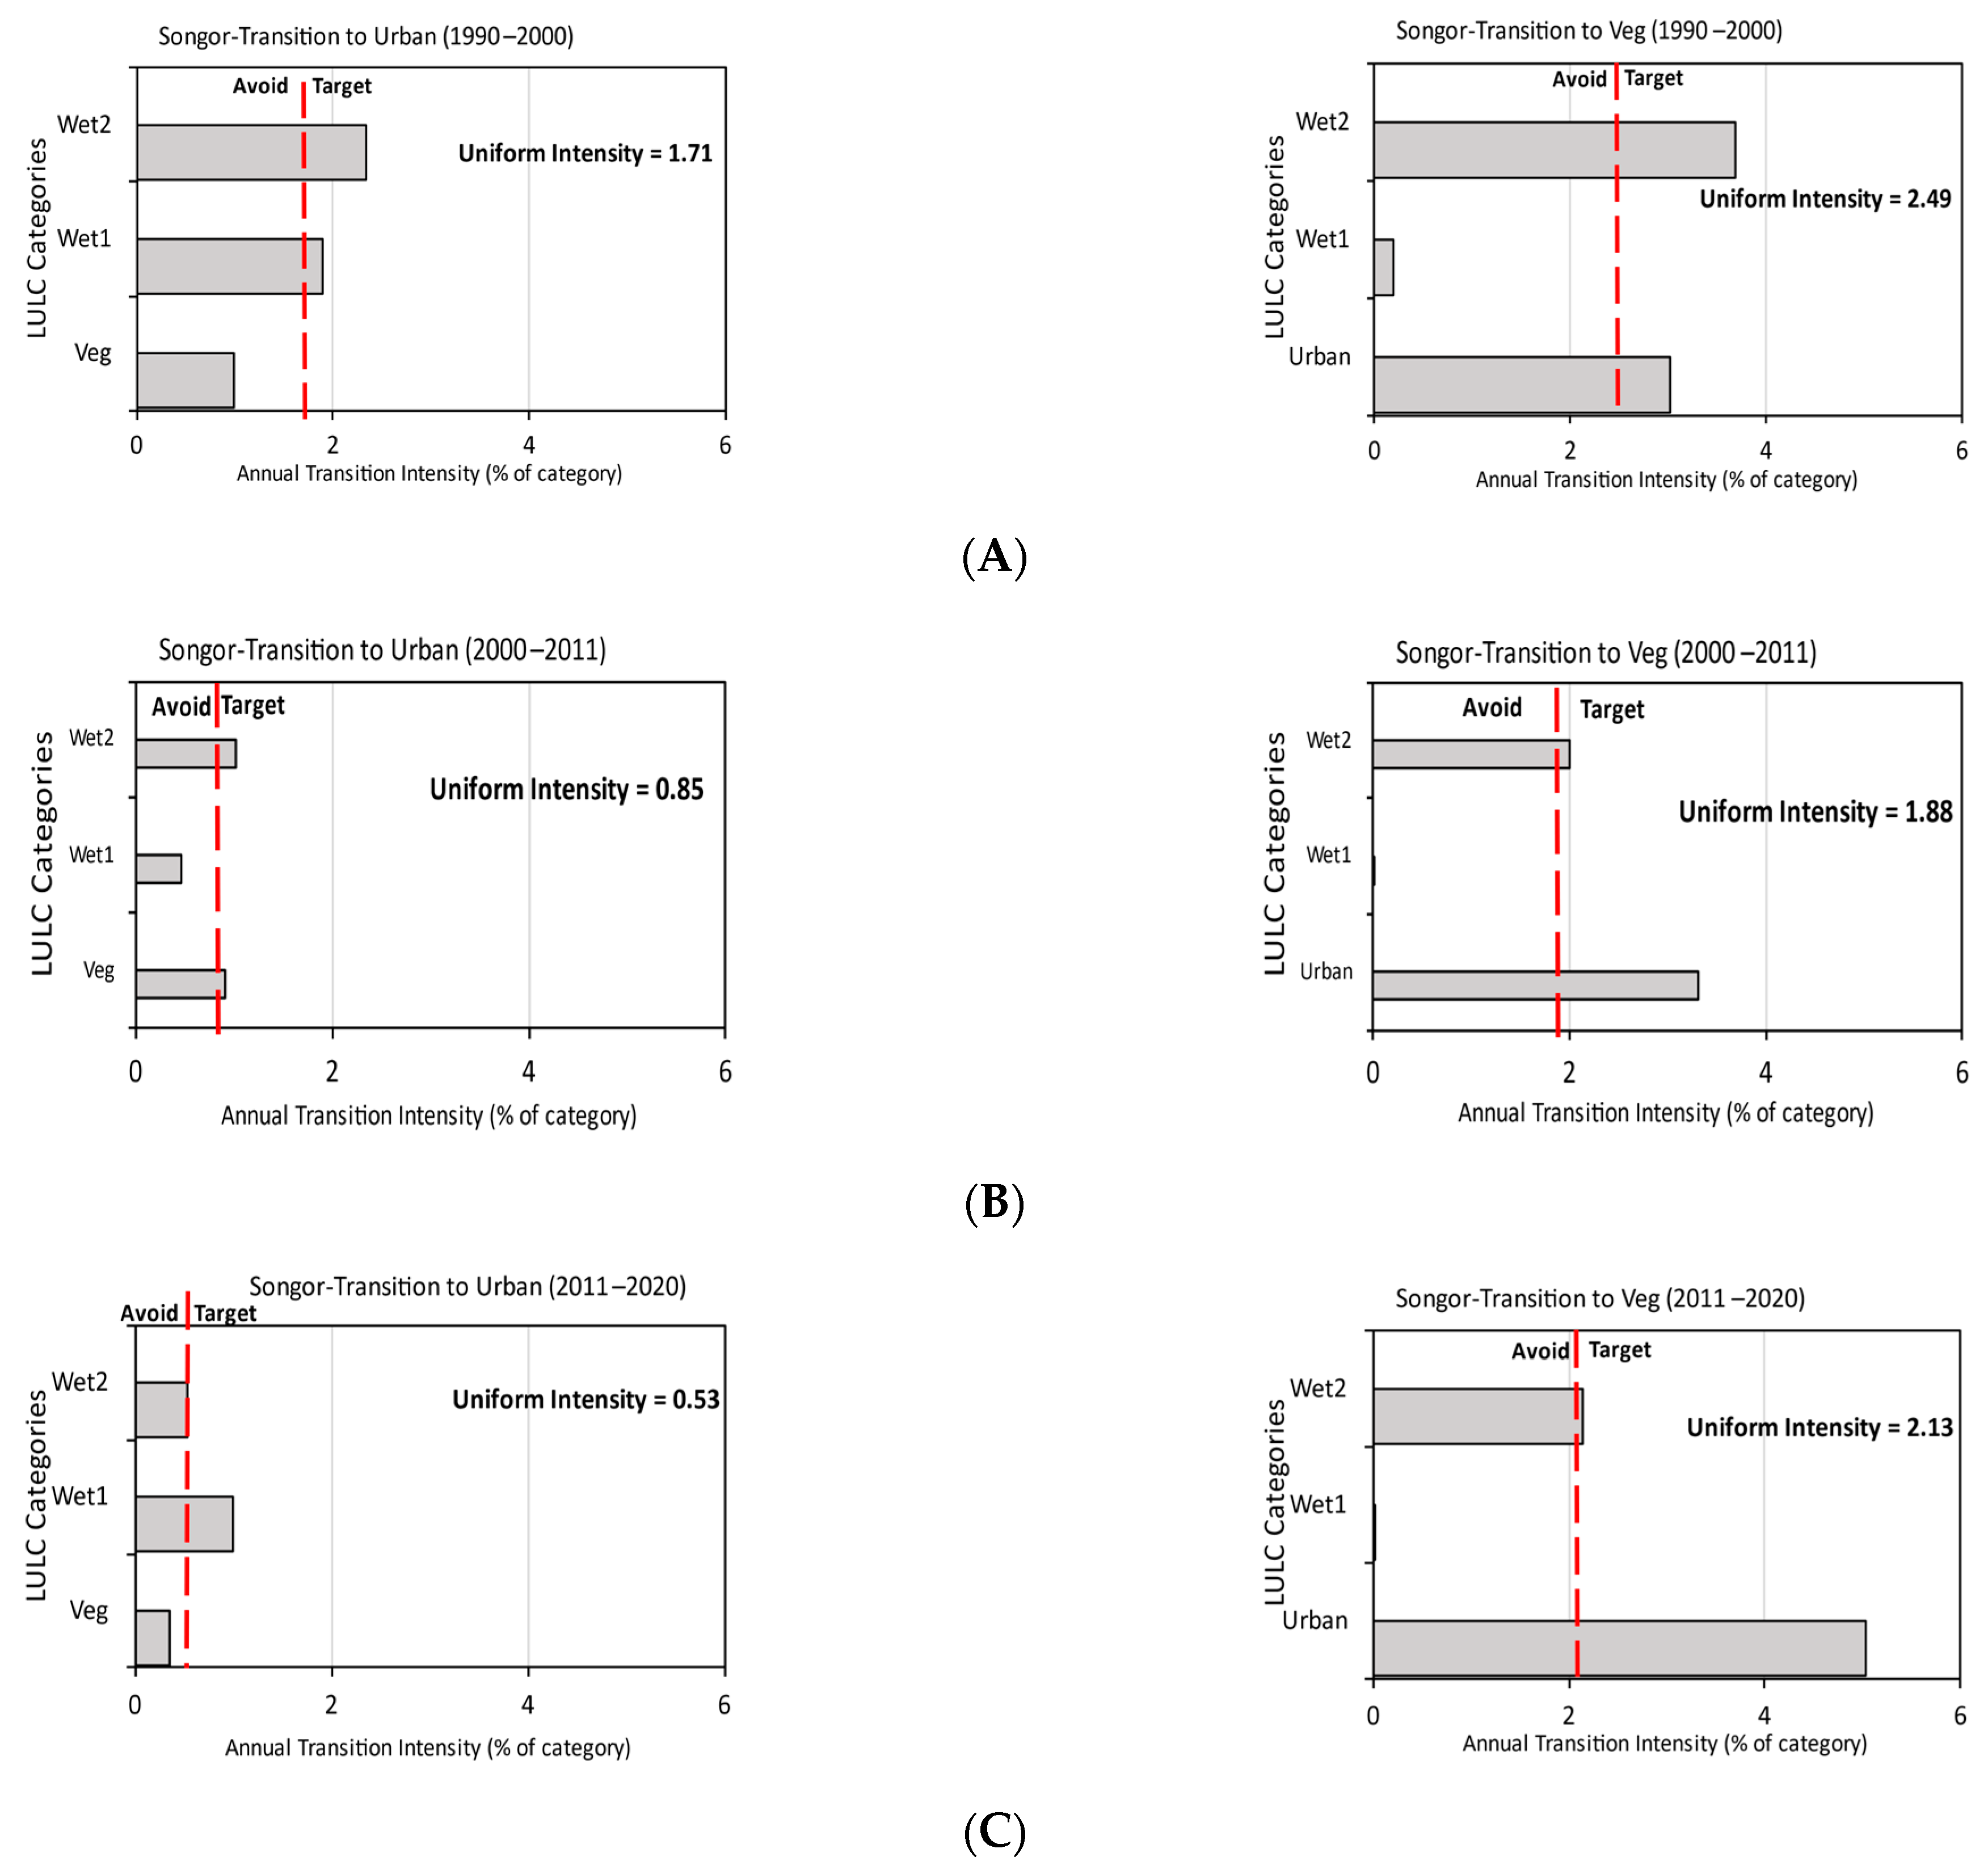
Transition Level
3.3. Analysis of Change Indicators
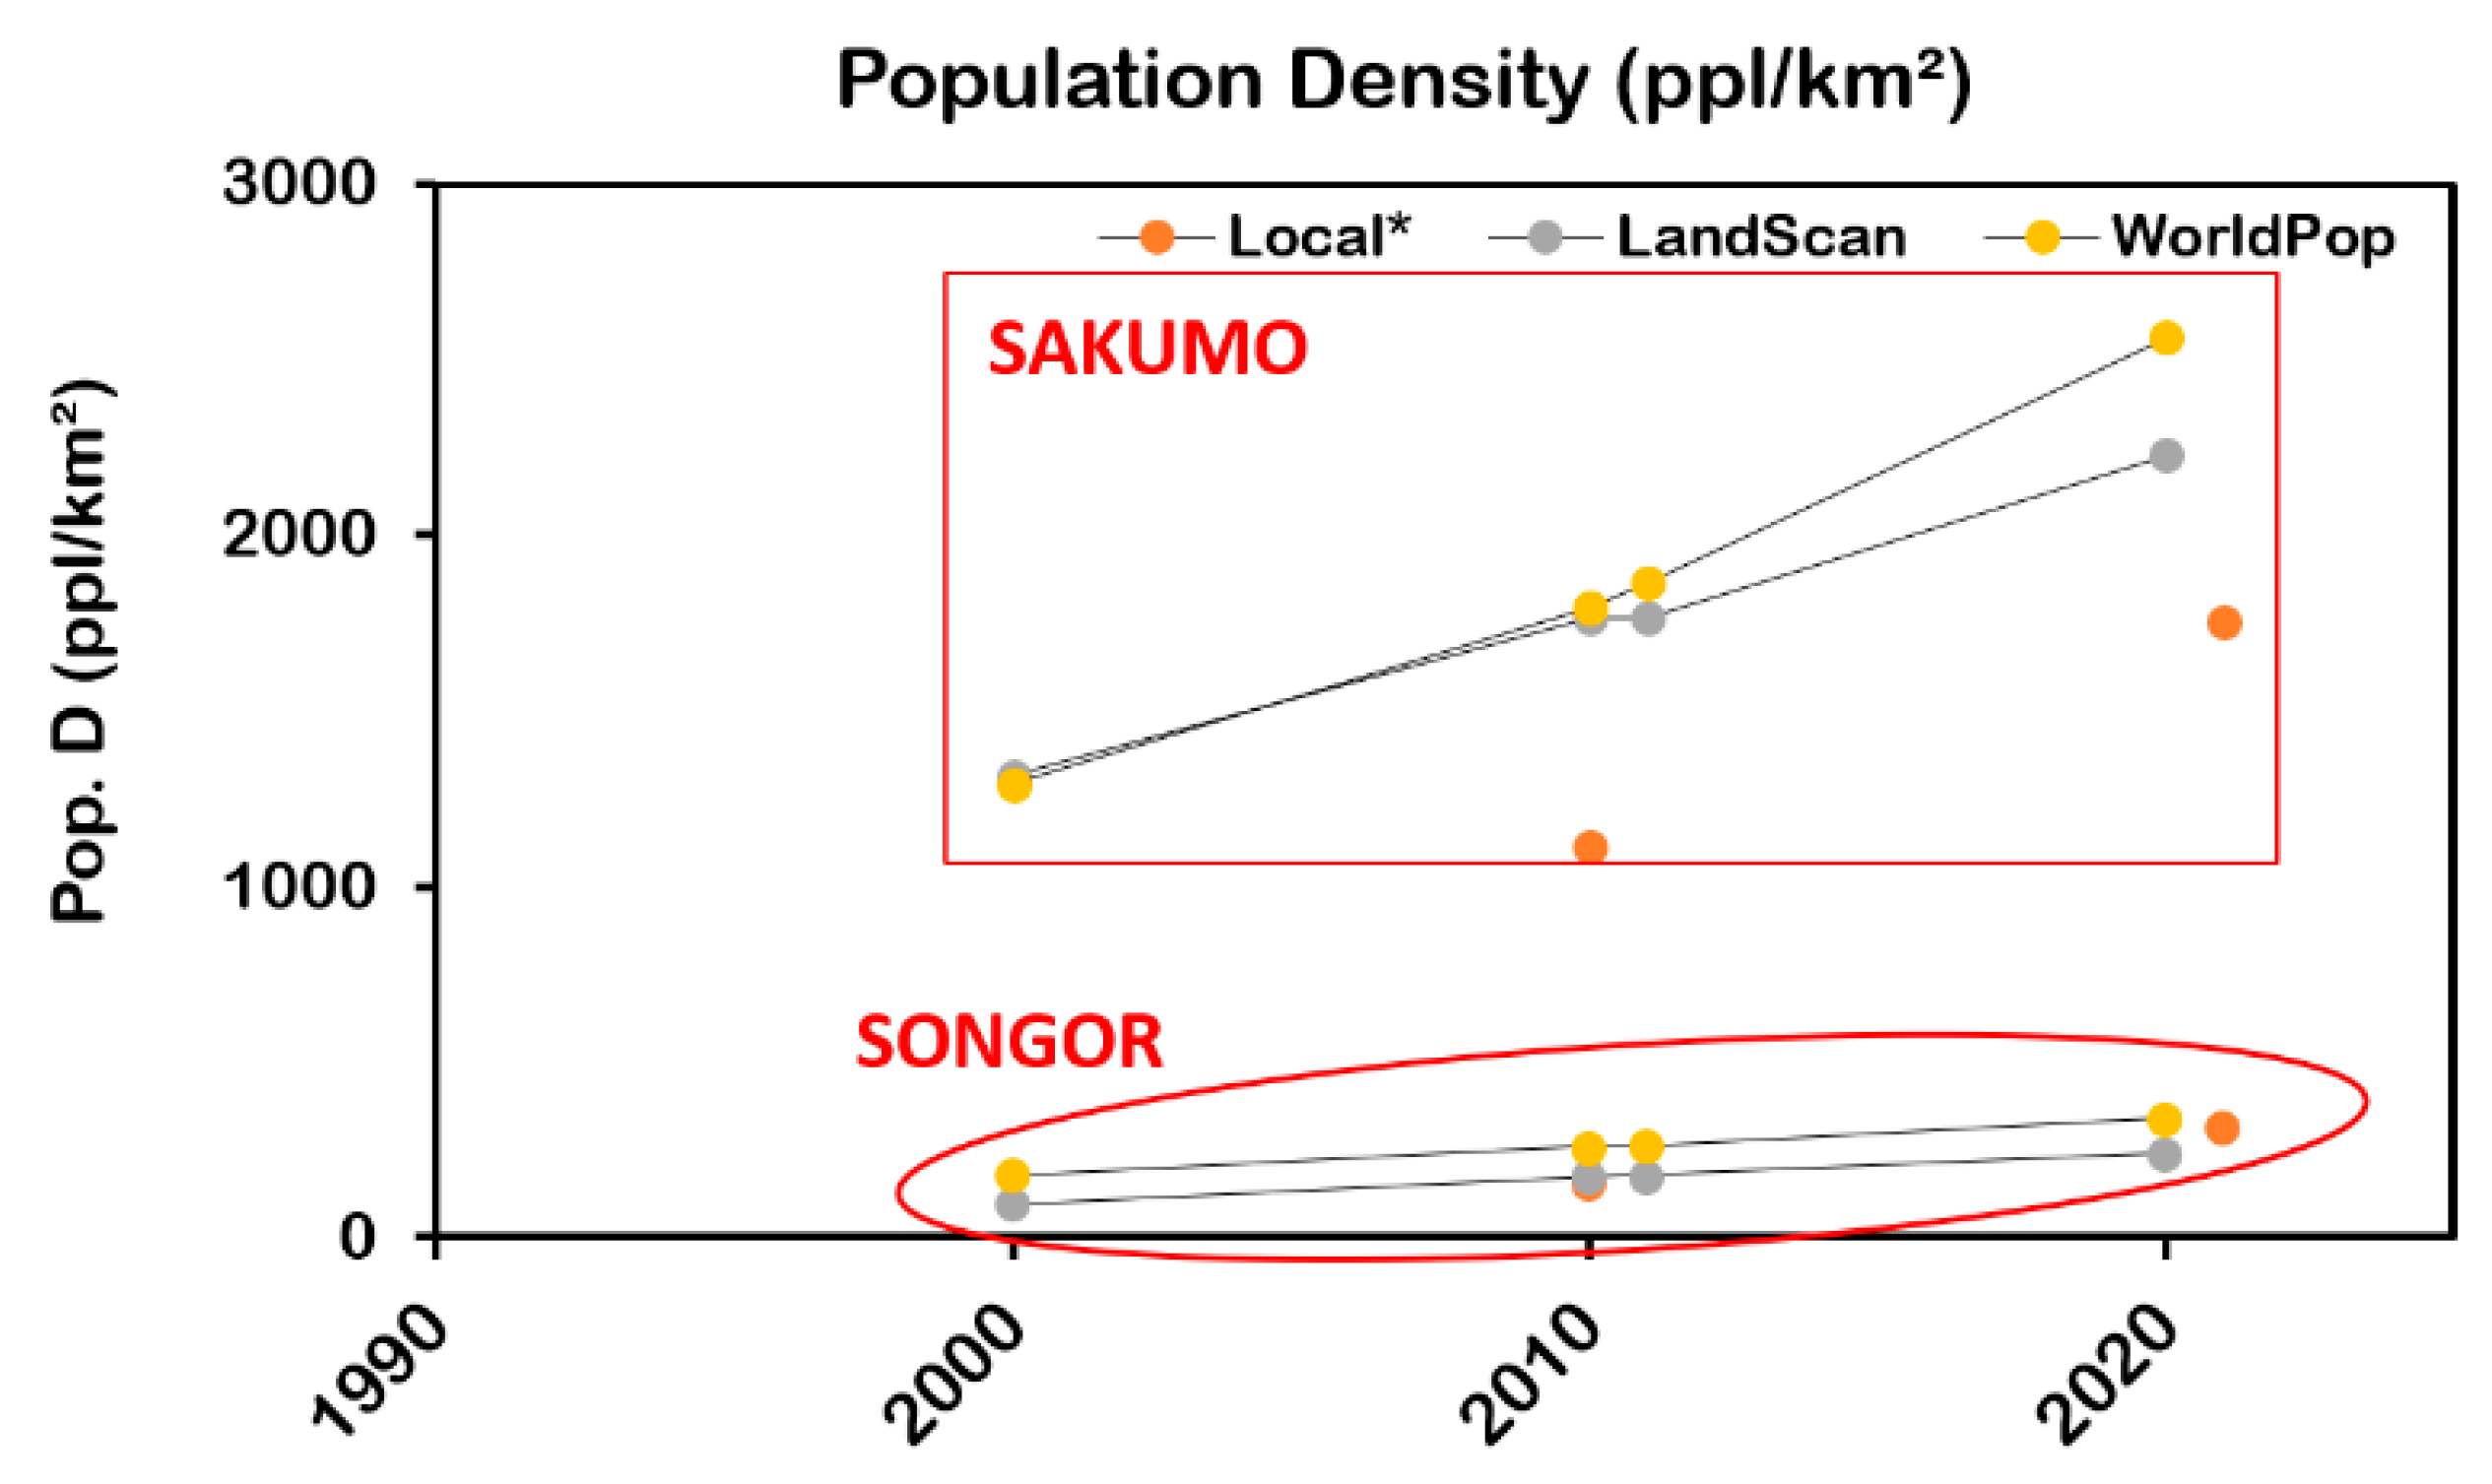
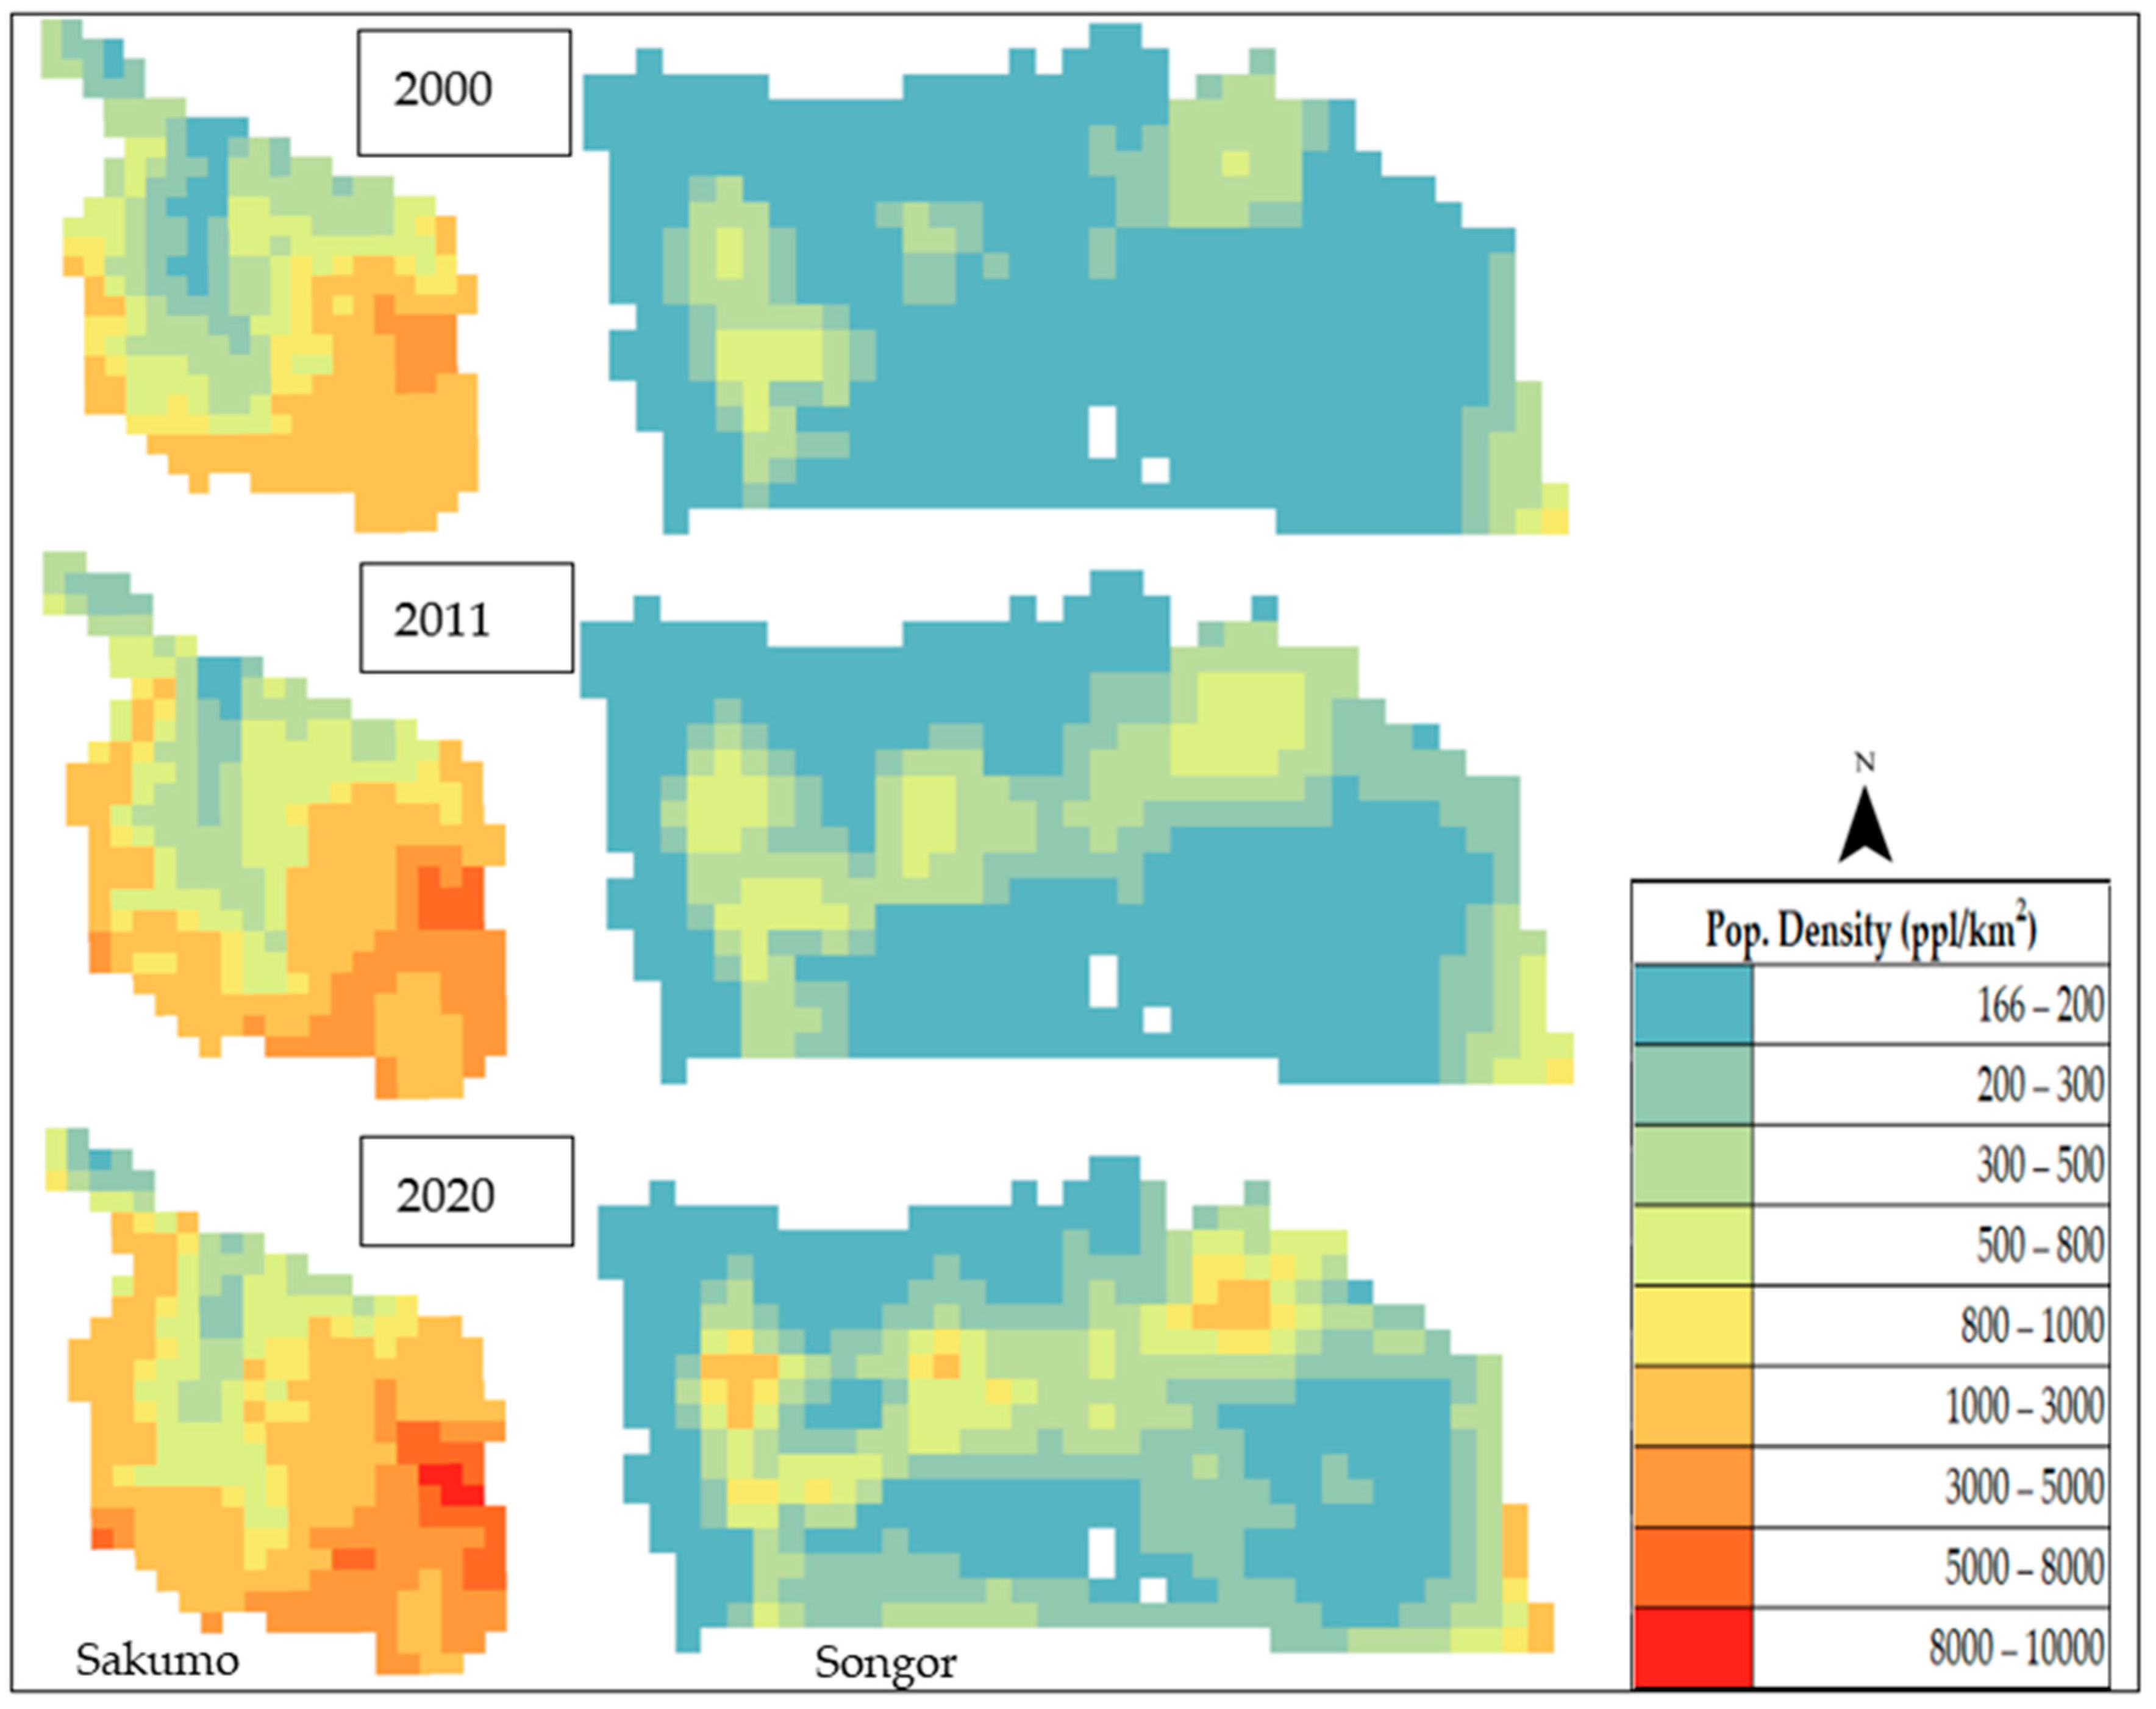
3.3.1. Trends in Population
3.3.2. Trends in Meteorological Variables and Water Balance
4. Discussions
4.1. Interpretation of Change Analysis
4.2. Impact of Change Indicators
4.3. Implications on Water Resource Management
4.4. Limitations
5. Conclusions
Author Contributions
Funding
Data Availability Statement
Acknowledgments
Conflicts of Interest
References
- Finlayson, M.; Gill, P.A.; Davidson, N.C. The Wetland Book: I: Structure and Function, Management, and Methods; Springer: Berlin/Heidelberg, Germany, 2018. [Google Scholar]
- Ramsar Convention Secretariat. The Ramsar Convention Manual: A Guide to the Convention on Wetlands (Ramsar, Iran, 1971), 6th ed.; Ramsar: Gland, Switzerland, 2013; p. 109. [Google Scholar]
- Kingsford, R.T.; Bino, G.; Finlayson, C.M.; Falster, D.; Fitzsimons, J.; Gawlik, D.E.; Murray, N.J.; Grillas, P.; Gardner, R.C.; Regan, T.J.; et al. Ramsar Wetlands of International Importance–Improving Conservation Outcomes. Front. Environ. Sci. 2021, 9, 53. [Google Scholar] [CrossRef]
- Jayson-Quashigah, P.-N.; Langenborg, V. “Report of the Volta Delta Status and Trends,” No. October. 2020. Available online: https://www.researchgate.net/publication/344565307_Report_of_the_Volta_Delta_Status_and_trends (accessed on 10 September 2023).
- Finlayson, C.M.; Milton, G.R.; Davidson, N.C.; Prentice, R.C. (Eds.) The Wetland Book II: Distribution, Description, and Conservation; Springer: Berlin/Heidelberg, Germany, 2018; Volume 3. [Google Scholar]
- Herrmann, S.M.; Brandt, M.; Rasmussen, K.; Fensholt, R. Accelerating land cover change in West Africa over four decades as population pressure increased. Commun. Earth Environ. 2020, 1, 53. [Google Scholar] [CrossRef]
- Ministry of Lands and Forestry. Managing Ghana’s Wetlands: A National Wetlands Conservation Strategy; Ministry of Lands and Forestry: Ministries-Accra, Ghana, 1999. [Google Scholar]
- Ntiamoa-Baidu, Y.; Gordon, C. Coastal Wetlands Management Plans: Ghana; The World Bank: Washington, DC, USA, 1991. [Google Scholar]
- Future Proofing Cities Metropolitan Cities in Ghana. 2016. Available online: https://www.arup.com/perspectives/publications/research/section/future-cities-africa (accessed on 10 September 2023).
- Ly, C.K. The role of the Akosombo Dam on the Volta river in causing coastal erosion in central and eastern Ghana (West Africa). Mar. Geol. 1980, 37, 323–332. [Google Scholar] [CrossRef]
- Brempong, E.K.; Almar, R.; Angnuureng, D.B.; Mattah, P.A.D.; Avornyo, S.Y.; Jayson-Quashigah, P.N.; Addo, K.A.; Minderhoud, P.; Teatini, P. Future flooding of the Volta Delta caused by sea level rise and land subsidence. J. Coast. Conserv. 2023, 27, 24. [Google Scholar] [CrossRef]
- Asomani-Boateng, R. Urban Wetland Planning and Management in Ghana: A Disappointing Implementation. Wetlands 2019, 39, 251–261. [Google Scholar] [CrossRef]
- Yeboah, F.; Awotwi, A.; Forkuo, E.K.; Kumi, M. Assessing the land use and land cover changes due to urban growth in Accra, Ghana. J. Basic Appl. Res. Int. 2017, 22, 43–50. [Google Scholar]
- Ofori-Danson, P.K. Coastal Wetlands Management (CWMP) Songor Ramsar Site; Ramsar: Gland, Switzerland, 1999. [Google Scholar]
- Mosciaro, M.J.; Seghezzo, L.; Texeira, M.; Paruelo, J.; Volante, J. Where did the forest go? Post-deforestation land use dynamics in the Dry Chaco region in Northwestern Argentina. Land Use Policy 2023, 129, 106650. [Google Scholar] [CrossRef]
- Pontius, R.G.; Krithivasan, R.; Sauls, L.; Yan, Y.; Zhang, Y. Methods to summarize change among land categories across time intervals. J. Land Use Sci. 2017, 12, 218–230. [Google Scholar] [CrossRef]
- Adade, R.; Nyarko, B.K.; Aheto, D.W.; Osei, K.N. Fragmentation of wetlands in the south eastern coastal savanna of Ghana. Reg. Stud. Mar. Sci. 2017, 12, 40–48. [Google Scholar] [CrossRef]
- Ekumah, B.; Armah, F.A.; Afrifa, E.K.A.; Aheto, D.W.; Odoi, J.O.; Afitiri, A.-R. Assessing land use and land cover change in coastal urban wetlands of international importance in Ghana using Intensity Analysis. Wetl. Ecol. Manag. 2020, 28, 271–284. [Google Scholar] [CrossRef]
- Ghana Statistical Service. 2021 Population and Housing Census: General Report Volume 3A; Ghana Statistical Service: Accra, Ghana, 2021. [Google Scholar]
- Nartey, V.K.; Edor, K.A.; Doamekpor, L.K.; Bobobee, L.H. Nutrient load of the Sakumo Lagoon at the Sakumo Ramsar Site in Tema, Ghana. West Afr. J. Appl. Ecol. 2012, 19, 93–105. [Google Scholar]
- Emmanuel, K.; Samuel, A.; Gifty, A.L. Assessment of hydrological pathway and water quality of the Songor wetland, Ghana. Afr. J. Environ. Sci. Technol. 2019, 13, 511–523. [Google Scholar]
- Finlayson, C.M.; Gordon, C.; Ntiamoa-Baidu, Y.; Tumbulto, J.; Storrs, M. The Hydrobiology of Keta and Songor Lagoons: Implications for Coastal Wetland Management in Ghana; Supervising Scientist Report Australia: Darwin, NT, Australia, 2000. [Google Scholar]
- Takyi, R.; El Mahrad, B.; Nunoo, F.K.E.; Adade, R.; ElHadary, M.; Essandoh, J. Adaptive management of environmental challenges in West African coastal lagoons. Sci. Total Environ. 2022, 838, 156234. [Google Scholar] [CrossRef] [PubMed]
- Shahzad, M.I.; Meraj, M.; Nazeer, M.; Zia, I.; Inam, A.; Mehmood, K.; Zafar, H. Empirical estimation of suspended solids concentration in the Indus Delta Region using Landsat-7 ETM+ imagery. J. Environ. Manag. 2018, 209, 254–261. [Google Scholar] [CrossRef] [PubMed]
- Arunachalam, M.; Joshua, R.M.; Kochuparampil, A.J.; Saravanavel, J. ArcOLITIRS: A Toolbox for Radiometric Calibration and Surface Temperature Estimation from Landsat 8 Products in ArcGIS Environment. J. Indian Soc. Remote Sens. 2023, 51, 453–468. [Google Scholar] [CrossRef]
- Duku, E.; Mattah, P.A.D.; Angnuureng, D.B. Assessment of Land Use/Land Cover Change and Morphometric Parameters in the Keta Lagoon Complex Ramsar Site, Ghana. Water 2021, 13, 2537. [Google Scholar] [CrossRef]
- Adade, R.; Aheto, D.W.; Agyeman, D.Y. Integrated Assessment of Changes in Wetland Types in the Songor Biosphere Reserve, Ghana. Biosph. Reserv. 2019, 3, 51. [Google Scholar] [CrossRef]
- Olofsson, P.; Foody, G.M.; Stehman, S.V.; Woodcock, C.E. Making better use of accuracy data in land change studies: Estimating accuracy and area and quantifying uncertainty using stratified estimation. Remote Sens. Environ. 2013, 129, 122–131. [Google Scholar] [CrossRef]
- Aldwaik, S.Z.; Pontius, R.G., Jr. Intensity analysis to unify measurements of size and stationarity of land changes by interval, category, and transition. Landsc. Urban Plan. 2012, 106, 103–114. [Google Scholar] [CrossRef]
- Quan, B.; Pontius, R.G., Jr.; Song, H. Intensity Analysis to communicate land change during three time intervals in two regions of Quanzhou City, China. GIScience Remote Sens. 2020, 57, 21–36. [Google Scholar] [CrossRef]
- Kouakou, C.; Paturel, J.-E.; Satgé, F.; Tramblay, Y.; Defrance, D.; Rouché, N. Comparison of gridded precipitation estimates for regional hydrological modeling in West and Central Africa. J. Hydrol. Reg. Stud. 2023, 47, 101409. [Google Scholar] [CrossRef]
- Boluwade, A. Remote sensed-based rainfall estimations over the East and West Africa regions for disaster risk management. ISPRS J. Photogramm. Remote Sens. 2020, 167, 305–320. [Google Scholar] [CrossRef]
- Leta, O.T.; El-Kadi, A.I.; Dulai, H.; Ghazal, K.A. Assessment of climate change impacts on water balance components of Heeia watershed in Hawaii. J. Hydrol. Reg. Stud. 2016, 8, 182–197. [Google Scholar] [CrossRef]
- Dlamini, S.; Nhapi, I.; Gumindoga, W.; Nhiwatiwa, T.; Dube, T. Assessing the feasibility of integrating remote sensing and in-situ measurements in monitoring water quality status of Lake Chivero, Zimbabwe. Phys. Chem. Earth Parts A/B/C 2016, 93, 2–11. [Google Scholar] [CrossRef]
- Abatzoglou, J.T.; Dobrowski, S.; Parks, S.A.; Hegewisch, K.C. TerraClimate, a high-resolution global dataset of monthly climate and climatic water balance from 1958–2015. Sci. Data 2018, 5, 170191. [Google Scholar] [CrossRef]
- Larbi, I.; Nyamekye, C.; Dotse, S.-Q.; Danso, D.K.; Annor, T.; Bessah, E.; Limantol, A.M.; Attah-Darkwa, T.; Kwawuvi, D.; Yomo, M. Rainfall and temperature projections and the implications on streamflow and evapotranspiration in the near future at the Tano River Basin of Ghana. Sci. Afr. 2021, 15, e01071. [Google Scholar] [CrossRef]
- Ampofo, S.; Annor, T.; Aryee, J.N.; Atiah, W.A.; Amekudzi, L.K. Long-term spatio-temporal variability and change in rainfall over Ghana (1960–2015). Sci. Afr. 2023, 19, e01588. [Google Scholar] [CrossRef]
- Abbam, T.; Johnson, F.A.; Dash, J.; Padmadas, S.S. Spatiotemporal Variations in Rainfall and Temperature in Ghana Over the Twentieth Century, 1900–2014. Earth Space Sci. 2018, 5, 120–132. [Google Scholar] [CrossRef]
- Agbeti, J.A.; Mantey, S.; Zaman, Q.M. Detecting Encroachment within Wetlands using UAV Techniques—The Case of Sakumo Ramsar Site, Ghana. J. Environ. Earth Sci. 2022, 12, 23–31. [Google Scholar] [CrossRef]
- Addae, B.; Oppelt, N. Land-Use/Land-Cover Change Analysis and Urban Growth Modelling in the Greater Accra Metropolitan Area (GAMA), Ghana. Urban Sci. 2019, 3, 26. [Google Scholar] [CrossRef]
- Ryan, J.M.; Ntiamoa-Baidu, Y. Biodiversity and ecology of coastal wetlands in Ghana. Biodivers. Conserv. 2000, 9, 445–446. [Google Scholar] [CrossRef]
- Kondra, M. The Status of the Wetlands in the Greater Accra Region; Trier University: Trier, Germany, 2018; No. 9, p. 18. [Google Scholar]
- Ekumah, B.; Armah, F.A.; Afrifa, E.K.; Aheto, D.W.; Odoi, J.O.; Afitiri, A.-R. Geospatial assessment of ecosystem health of coastal urban wetlands in Ghana. Ocean Coast. Manag. 2020, 193, 105226. [Google Scholar] [CrossRef]
- Atta-Quayson, A. “Position Paper on Salt Sector in Ghana,” No. August, p. 22. 2018. Available online: https://www.star-ghana.org/learning-2/publications-and-resources/political-economy-analysis/140-third-world-network-twn-position-paper-on-salt-sector-in-ghana-1/file (accessed on 10 September 2023).
- Nonterah, C.; Xu, Y.; Osae, S.; Akiti, T.T.; Dampare, S.B. A review of the ecohydrology of the Sakumo wetland in Ghana. Environ. Monit. Assess. 2015, 187, 671. [Google Scholar] [CrossRef] [PubMed]
- Ghana Statistical Service. Ghana 2021 Population & Housing Census Thematic Report: Migration; Ghana Statistical Service: Accra, Ghana, 2023. [Google Scholar]
- Turolla, M.; Hoffmann, L. ‘THE CAKE IS IN ACCRA’: A Case Study of Internal Migration in Ghana. Can. J. Afr. Stud. 2022, 2022, 30. [Google Scholar] [CrossRef]
- Abalo, M.; Badabate, D.; Fousseni, F.; Kpérkouma, W.; Koffi, A. Landscape-based analysis of wetlands patterns in the Ogou River basin in Togo (West Africa). Environ. Chall. 2021, 2, 100013. [Google Scholar] [CrossRef]
- Desa, U.N. World Population Prospects 2022: Summary of Results; United Nations: New York, NY, USA, 2022. [Google Scholar]
- Desa, U.N. World Population Prospects 2019. United Nations. Department of Economic and Social Affairs. 2019. Available online: http://www.ncbi.nlm.nih.gov/pubmed/12283219 (accessed on 10 September 2023).
- Ankrah, J.; Monteiro, A.; Madureira, H. Extreme Temperature and Rainfall Events and Future Climate Change Projections in the Coastal Savannah Agroecological Zone of Ghana. Atmosphere 2023, 14, 386. [Google Scholar] [CrossRef]
- Ciais, P.; Sabine, P.; Bala, G.; Bopp, L.; Brovkin, V.; Canadell, J.; Chhabra, A.; DeFries, R.; Galloway, J.; Heimann, M.; et al. The physical science basis. Contribution of working group I to the fifth assessment report of the intergovernmental panel on climate change. In Intergovernmental Panel on Climate Change (IPCC); Cambridge University Press: Cambridge, UK, 2013; pp. 465–570. [Google Scholar] [CrossRef]
- Gbogbo, F.; Attuquayefio, D.K. Issues Arising From Changes in Waterbird Population Estimates in Coastal Ghana. Bird Popul. 2010, 10, 79–87. [Google Scholar]
- Devendran, A.A.; Banon, F. Spatio-Temporal Land Cover Analysis and the Impact of Land Cover Variability Indices on Land Surface Temperature in Greater Accra, Ghana Using Multi-Temporal Landsat Data. J. Geogr. Inf. Syst. 2022, 14, 240–258. [Google Scholar] [CrossRef]
- Twumasi, Y.A.; Merem, E.C.; Namwamba, J.B.; Mwakimi, O.S.; Ayala-silva, T.; Frimpong, D.B.; Ning, Z.H.; Asare-Ansah, A.B.; Annan, J.B.; Oppong, J.; et al. Estimation of Land Surface Temperature from Landsat-8 OLI Thermal Infrared Satellite Data. A Comparative Analysis of Two Cities in Ghana. Adv. Remote Sens. 2021, 10, 131–149. [Google Scholar] [CrossRef]
- Asmah, R.; Dankwa, H.; Biney, C.A.; Amankwah, C.C. Trends analysis relating to pollution in Sakumo Lagoon, Ghana. Afr. J. Aquat. Sci. 2008, 33, 87–93. [Google Scholar] [CrossRef]
- Appiah, D.O.; Yankson, D. Anthropogenic Drivers of the Pressures on the Ramsar Site of Sakumo Lagoon in Ghana. Int. J. Technol. Manag. Res. 2012, 1, 48–56. [Google Scholar] [CrossRef]
- Newton, A.; Icely, J.; Cristina, S.; Perillo, G.M.E.; Turner, R.E.; Ashan, D.; Cragg, S.; Luo, Y.; Tu, C.; Li, Y.; et al. Anthropogenic, Direct Pressures on Coastal Wetlands. Front. Ecol. Evol. 2020, 8, 144. [Google Scholar] [CrossRef]
- Wiegleb, V. A Literature Review on Wetlands in Accra; Trier University: Trier, Germany, 2016. [Google Scholar]
- Ashiagbor, G.; Amoako, C.; Asabere, S.B.; Quaye-Ballard, J.A. Landscape Transformations in Rapidly Developing Peri-urban Areas of Accra, Ghana: Results of 30 years. Open Geosci. 2019, 11, 172–182. [Google Scholar] [CrossRef]


| Satellite (Sensor) | Acquisition Dates (dd-mm-yyyy) | Path, Row |
|---|---|---|
| Landsat 8 (OLI/TIRS) | 02-01-2020 | 193, 056 |
| Landsat 7 (ETM) | 17-02-2011 | |
| 04-02-2000 | ||
| Landsat 4 (TM) | 25-12-1990 |
| OA_SK | kappa_SK | OA_SG | kappa_SG | |
|---|---|---|---|---|
| KNN | 66% | 0.55 | 65% | 0.56 |
| RT | 60% | 0.45 | 62% | 0.52 |
| ML | 72% | 0.63 | 77% | 0.70 |
| SVM | 67% | 0.55 | 59% | 0.48 |
| LULC 2000 | 1990–2000 | |||||||||
| Category | Agriculture | Barren | Dense Veg | Developed | Sparse Veg | Water | Wetlands | TOTAL | Gross Loss | |
| LULC 1990 | Agriculture | 31.478 | 0.616 | 2.526 | 53.235 | 38.789 | 0.614 | 2.681 | 129.938 | 98.461 |
| Barren | 0.269 | 0.019 | 0.016 | 0.768 | 0.148 | 0.007 | 0.018 | 1.245 | 1.226 | |
| Dense Veg | 1.934 | 0.000 | 12.618 | 0.018 | 1.301 | 0.000 | 0.006 | 15.878 | 3.260 | |
| Developed | 7.486 | 0.243 | 0.091 | 33.962 | 5.244 | 0.178 | 3.746 | 50.951 | 16.988 | |
| Sparse Veg | 15.177 | 0.022 | 4.877 | 7.911 | 33.462 | 0.191 | 1.436 | 63.075 | 29.613 | |
| Water | 0.040 | 0.000 | 0.000 | 0.016 | 0.040 | 1.383 | 0.129 | 1.607 | 0.224 | |
| Wetlands | 5.279 | 0.008 | 0.721 | 5.156 | 5.998 | 0.428 | 4.258 | 21.847 | 17.589 | |
| TOTAL | 61.662 | 0.907 | 20.849 | 101.066 | 84.982 | 2.801 | 12.273 | 284.540 | ||
| 1990–2000 | Gross Gain | 30.184 | 0.888 | 8.231 | 67.104 | 51.520 | 1.418 | 8.015 | 167.360 | |
| LULC 2011 | 2000–2011 | |||||||||
| Category | Agriculture | Barren | Dense Veg | Developed | Sparse Veg | Water | Wetlands | TOTAL | Gross Loss | |
| LULC 2000 | Agriculture | 11.447 | 16.254 | 0.691 | 19.241 | 13.393 | 0.026 | 0.609 | 61.662 | 50.215 |
| Barren | 0.046 | 0.320 | 0.000 | 0.527 | 0.015 | 0.000 | 0.000 | 0.907 | 0.588 | |
| Dense Veg | 4.024 | 1.449 | 8.911 | 0.513 | 5.952 | 0.000 | 0.001 | 20.849 | 11.939 | |
| Developed | 9.232 | 22.635 | 0.001 | 62.745 | 5.757 | 0.005 | 0.690 | 101.066 | 38.321 | |
| Sparse Veg | 20.012 | 22.529 | 0.037 | 11.790 | 30.334 | 0.005 | 0.276 | 84.982 | 54.648 | |
| Water | 0.097 | 0.080 | 0.002 | 0.002 | 0.020 | 2.012 | 0.589 | 2.801 | 0.789 | |
| Wetlands | 3.188 | 0.311 | 0.000 | 4.375 | 1.555 | 0.143 | 2.702 | 12.273 | 9.572 | |
| TOTAL | 48.046 | 63.577 | 9.642 | 99.193 | 57.026 | 2.191 | 4.867 | 284.540 | ||
| 2000–2011 | Gross Gain | 36.599 | 63.257 | 0.731 | 36.447 | 26.692 | 0.179 | 2.165 | 166.071 | |
| LULC 2020 | 2011–2020 | |||||||||
| Category | Agriculture | Barren | Dense Veg | Developed | Sparse Veg | Water | Wetlands | TOTAL | Gross Loss | |
| LULC 2011 | Agriculture | 9.149 | 1.228 | 0.119 | 27.014 | 9.798 | 0.044 | 0.695 | 48.046 | 38.897 |
| Barren | 13.751 | 4.191 | 0.016 | 39.083 | 6.526 | 0.000 | 0.009 | 63.577 | 59.386 | |
| Dense Veg | 1.075 | 0.124 | 5.945 | 0.589 | 1.887 | 0.000 | 0.022 | 9.642 | 3.696 | |
| Developed | 3.993 | 2.170 | 0.000 | 88.547 | 4.388 | 0.000 | 0.095 | 99.193 | 10.645 | |
| Sparse Veg | 14.564 | 3.219 | 0.581 | 20.304 | 18.122 | 0.000 | 0.236 | 57.026 | 38.903 | |
| Water | 0.004 | 0.004 | 0.000 | 0.057 | 0.059 | 1.754 | 0.313 | 2.191 | 0.437 | |
| Wetlands | 0.408 | 0.040 | 0.000 | 0.357 | 1.857 | 0.035 | 2.171 | 4.867 | 2.696 | |
| TOTAL | 42.943 | 10.976 | 6.661 | 175.951 | 42.638 | 1.833 | 3.540 | 284.540 | ||
| 2011–2020 | Gross Gain | 33.794 | 6.784 | 0.716 | 87.404 | 24.515 | 0.079 | 1.369 | 154.661 | |
| LULC 2000 | 1990–2000 | ||||||
| Category | Urban | Veg | Wet1 | Wet2 | TOTAL | Gross Loss | |
| LULC 1990 | Urban | 17.22 | 9.74 | 2.33 | 2.97 | 32.27 | 15.05 |
| Veg | 18.49 | 162.60 | 0.24 | 5.50 | 186.83 | 24.23 | |
| Wet1 | 19.28 | 1.92 | 73.76 | 6.97 | 101.93 | 28.16 | |
| Wet2 | 42.33 | 66.65 | 3.37 | 68.25 | 180.59 | 112.35 | |
| TOTAL | 97.31 | 240.91 | 79.71 | 83.69 | 501.62 | ||
| 1990–2000 | Gross Gain | 80.10 | 78.31 | 5.94 | 15.44 | 179.79 | |
| LULC 2011 | 2000–2011 | ||||||
| Category | Urban | Veg | Wet1 | Wet2 | TOTAL | Gross Loss | |
| LULC 2000 | Urban | 29.80 | 35.46 | 16.08 | 15.97 | 97.31 | 67.51 |
| Veg | 24.23 | 193.07 | 0.86 | 22.74 | 240.91 | 47.84 | |
| Wet1 | 4.09 | 0.04 | 73.66 | 1.92 | 79.71 | 6.05 | |
| Wet2 | 9.43 | 18.37 | 3.30 | 52.59 | 83.69 | 31.10 | |
| TOTAL | 67.55 | 246.94 | 93.90 | 93.22 | 501.62 | ||
| 2000–2011 | Gross Gain | 37.75 | 53.87 | 20.24 | 40.64 | 152.49 | |
| LULC 2020 | 2011–2020 | ||||||
| Category | Urban | Veg | Wet1 | Wet2 | TOTAL | Gross Loss | |
| LULC 2011 | Urban | 13.81 | 30.61 | 6.89 | 16.24 | 67.55 | 53.74 |
| Veg | 7.84 | 222.25 | 0.53 | 16.33 | 246.94 | 24.70 | |
| Wet1 | 8.39 | 0.21 | 80.23 | 5.08 | 93.90 | 13.68 | |
| Wet2 | 4.41 | 17.96 | 4.56 | 66.29 | 93.22 | 26.93 | |
| TOTAL | 34.45 | 271.02 | 92.20 | 103.94 | 501.62 | ||
| 2011–2020 | Gross Gain | 20.64 | 48.78 | 11.98 | 37.64 | 119.04 | |
| Annual Total Precipitation | |||||
|---|---|---|---|---|---|
| Catchment | Mann–Kendall Statistic (S) | Tau (τ) | Sen’s Slope Estimator (Q) | Zs | p-value (Two-Tailed Test) |
| Sakumo | 15 | 0.03 | 1.15 | 0.24 | 8.12 × 10⁻¹ |
| Songor | 43 | 0.09 | 2.53 | 0.71 | 4.75 × 10⁻¹ |
| Annual Average Temperature | |||||
| Catchment | Mann–Kendall Statistic (S) | Tau (τ) | Sen’s slope Estimator (Q) | Zs | p-value (Two-tailed test) |
| Sakumo | 249 | 0.54 | 0.03 | 4.22 | 2.50 × 10⁻⁵ * |
| Songor | 241 | 0.52 | 0.03 | 4.08 | 4.52 × 10⁻⁵ * |
| Annual Total Evapotranspiration | |||||
| Catchment | Mann–Kendall Statistic (S) | Tau (τ) | Sen’s slope Estimator (Q) | Zs | p-value (Two-tailed test) |
| Sakumo | 45 | 0.10 | 2.55 | 0.75 | 4.50 × 10⁻¹ |
| Songor | 55 | 0.12 | 2.53 | 0.92 | 3.60 × 10⁻¹ |
| Annual Water Balance | |||||
| Catchment | Mann–Kendall Statistic (S) | Tau (τ) | Sen’s slope Estimator (Q) | Zs | p-value (Two-tailed test) |
| Sakumo | −51 | −0.11 | −0.83 | −0.85 | 4.00 × 10⁻¹ |
| Songor | 23 | 0.05 | 0.61 | 0.37 | 7.10 × 10⁻¹ |
Disclaimer/Publisher’s Note: The statements, opinions and data contained in all publications are solely those of the individual author(s) and contributor(s) and not of MDPI and/or the editor(s). MDPI and/or the editor(s) disclaim responsibility for any injury to people or property resulting from any ideas, methods, instructions or products referred to in the content. |
© 2023 by the authors. Licensee MDPI, Basel, Switzerland. This article is an open access article distributed under the terms and conditions of the Creative Commons Attribution (CC BY) license (https://creativecommons.org/licenses/by/4.0/).
Share and Cite
Commey, N.A.; Magome, J.; Ishidaira, H.; Souma, K. Catchment-Scale Land Use and Land Cover Change Analysis in Two Coastal Ramsar Sites in Ghana, Using Remote Sensing. Water 2023, 15, 3568. https://doi.org/10.3390/w15203568
Commey NA, Magome J, Ishidaira H, Souma K. Catchment-Scale Land Use and Land Cover Change Analysis in Two Coastal Ramsar Sites in Ghana, Using Remote Sensing. Water. 2023; 15(20):3568. https://doi.org/10.3390/w15203568
Chicago/Turabian StyleCommey, Nii Amarquaye, Jun Magome, Hiroshi Ishidaira, and Kazuyoshi Souma. 2023. "Catchment-Scale Land Use and Land Cover Change Analysis in Two Coastal Ramsar Sites in Ghana, Using Remote Sensing" Water 15, no. 20: 3568. https://doi.org/10.3390/w15203568
APA StyleCommey, N. A., Magome, J., Ishidaira, H., & Souma, K. (2023). Catchment-Scale Land Use and Land Cover Change Analysis in Two Coastal Ramsar Sites in Ghana, Using Remote Sensing. Water, 15(20), 3568. https://doi.org/10.3390/w15203568