Article

Chemical Characterization and Genesis of Thermal Reservoir Water in the Southern Part of the Jizhong Depression

1
Institute of Hydrogeology and Environmental Geology, Chinese Academy of Geological Sciences, Shijiazhuang 050061, China
2
Innovation Center of Geothermal and Dry Hot Rock Exploration and Development Technology, Ministry of Nature Resources, Shijiazhuang 050061, China
*
Author to whom correspondence should be addressed.
Water 2023, 15(20), 3532; https://doi.org/10.3390/w15203532
Submission received: 5 September 2023 / Revised: 25 September 2023 / Accepted: 8 October 2023 / Published: 10 October 2023

Abstract

:
The Jizhong Depression is a typical Mesozoic and Cenozoic fault basin located in the northwestern part of the Bohai Bay Basin that has abundant hydrothermal and geothermal resources and enormous development potential. In this study, hydrochemical and isotopic analyses were conducted on water samples from the southern region of the Jizhong Depression. The formation and evolution processes of the deep geothermal water were analyzed, the circulation process of the deep geothermal water was determined, and the genetic mechanism of the geothermal systems was elucidated. The hydrochemical types of the geothermal fluids in the sandstone reservoirs in the research area are mainly Cl·HCO3Na type, while the geothermal fluids in the carbonate reservoirs are mainly Cl-Na type and Cl·HCO3Na type. The ion components in the geothermal water are mainly controlled by the dissolution of the carbonate rocks and the alternate adsorption of cations. The elevation of the geothermal water supply area is 763–1063 m, and the main source is precipitation from the mountainous areas in the western Taihang Mountains. The Na-K-Ca temperature scale and multi-mineral equilibrium method have relatively small errors and are suitable for the southern region of the Jizhong Depression, with average errors of 21.44 °C and 32.64 °C, respectively. The depth of the Jxw thermal storage cycle in the research area is 3033–5187 m, and the depth of the Ng thermal storage cycle is 1360–2862 m. The content of the main ions (Na+, K+, and Cl) in the water samples of the study area is greater in the Jxw thermal storage than in the Ng thermal storage; the Jxw thermal storage water samples have lower γNa+/γCl values than the Ng thermal storage; and the γSO42−/γCl and γCl/(γHCO3 + CO32−) values are greater than those of the Ng thermal storage, indicating that the Jxw thermal storage is located in a geological environment with better sealing, longer flow, slower water circulation, more complete leaching, and higher salinity than the Ng thermal storage. Part of the deep thermal storage is transmitted upwards through the rocks via thermal conduction, and part is transmitted upwards along fault channels via thermal convection, forming a convection–conduction-type geothermal system.

1. Introduction

Geothermal resources refer to geothermal energy, geothermal fluids, and their useful components within the Earth that can be economically utilized by humans. They are a renewable energy source with characteristics such as large reserves, a wide distribution, and clean environmental protection [1,2,3,4,5]. The scientific and reasonable development and utilization of geothermal resources can not only alleviate the pressure on energy resources in China, but also offer an important and practical way to achieve carbon neutrality [6]. The North China Plain, where the Jizhong Depression is located, is a typical sedimentary basin-type geothermal resource distribution area in China. It is rich in medium-low temperature (25 °C < T < 150 °C) geothermal resources. Analysis of the genetic mechanism of the geothermal system is crucial to the scientific development of geothermal resources in this region [7].
Characterizing the reservoir temperature and groundwater circulation process in geothermal systems is a prerequisite for the sustainable development of geothermal resources. Water chemistry and isotope research are important tools for the effective exploration of geothermal systems. Stable isotopes (δ18O and δ2H values) and hydrochemistry have been widely applied to trace groundwater sources and to describe the water–rock–gas interaction processes that occur in groundwater systems [8,9,10,11,12,13]. Reservoir temperature is an important parameter for delineating the genesis type of geothermal system and evaluating the resource potential of geothermal resources, which is determined mainly by ground temperature measurement and calculation methods [14]. The exploration of geothermal resources and the study of the genetic mechanism of geothermal systems in the Jizhong Depression area have been ongoing for decades. Previous researchers have also conducted relevant research on the hydrochemical characteristics and genetic mechanism of the geothermal systems in the Jizhong Depression area using hydrochemical methods, mainly focusing on the Niutuo Town geothermal field in the central part of the Jizhong Depression. Pang et al. [15] studied the source and composition of the geothermal fluids in the Niutuo Town geothermal field based on the geochemical and isotope compositions of geothermal fluids and evaluated the crust–mantle heat flow ratio in the area, providing important information for the crust–mantle thermal structure composition of the Niutuo Town geothermal field. Zhao et al. [16] calculated the thermal storage temperature and thermal cycle depth of the Rongcheng geothermal field and studied the deep cycle mechanism of the geothermal water stored in the Wumishan Formation carbonate rock. Xing et al. [17] conducted geochemical sampling and testing of the geothermal water in five major tectonic units in northern China and found that the geochemical field in this area is mainly influenced by factors such as water–rock interactions, fractures, and reservoir sealing. Zhang et al. [18] analyzed the geothermal genesis model of the Rongcheng Uplift using a combination of hydrochemical methods and rock thermophysical properties and found that the geothermal water came from the supply in the Taihang Mountains and atmospheric precipitation. Regarding the northern region of the Jizhong Depression, Deng et al. [19] analyzed the hydrochemical and isotopic characteristics of the geothermal fluids and found that the geothermal water in the northern region of the Jizhong Depression mainly comes from the atmospheric precipitation in the western Taihang Mountains, which supplies geothermal water from the northwest to southeast through faults, and evaluated the applicability of various temperature scales in the northern part of the Jizhong Depression and concluded that the Na-K and K-Mg scales are suitable for the application in the Jizhong Depression region. Zhao et al. [20] analyzed the geothermal fluid characteristics of the Gaoyang geothermal field in the southern part of the Jizhong Depression using a sampling hydrochemical method and revealed its genetic mechanism. They concluded that the source of the geothermal water supply is the precipitation in the Taihang Mountains and Yanshan Mountains.
Previous research on the Jizhong Depression region has mostly been concentrated in the central and northern regions. In recent years, multiple high-temperature geothermal wells have been drilled in the Gaoyang geothermal field in the central and southern parts of the Jizhong Depression, gradually attracting people’s attention. However, research on the hydrochemical characteristics, geothermal water sources, and genetic mechanisms of the geothermal system in the southern region of the Jizhong Depression is still not sufficiently systematic. Therefore, based on research on the geothermal geological conditions in the study area, in this article we analyze the hydrochemical characteristics of geothermal water samples by conducting hydrochemical composition and isotope analyses on the geothermal water samples from thermal reservoirs in the study area. Based on data on the geothermal water characteristic coefficients, recharge elevations, thermal storage temperatures, and thermal cycle depths, we investigate the formation and evolution of the water resources and reveal the genetic patterns of the hydrothermal resources in the study area. The results of this study provide a scientific basis for the rational development and utilization of these geothermal resources.

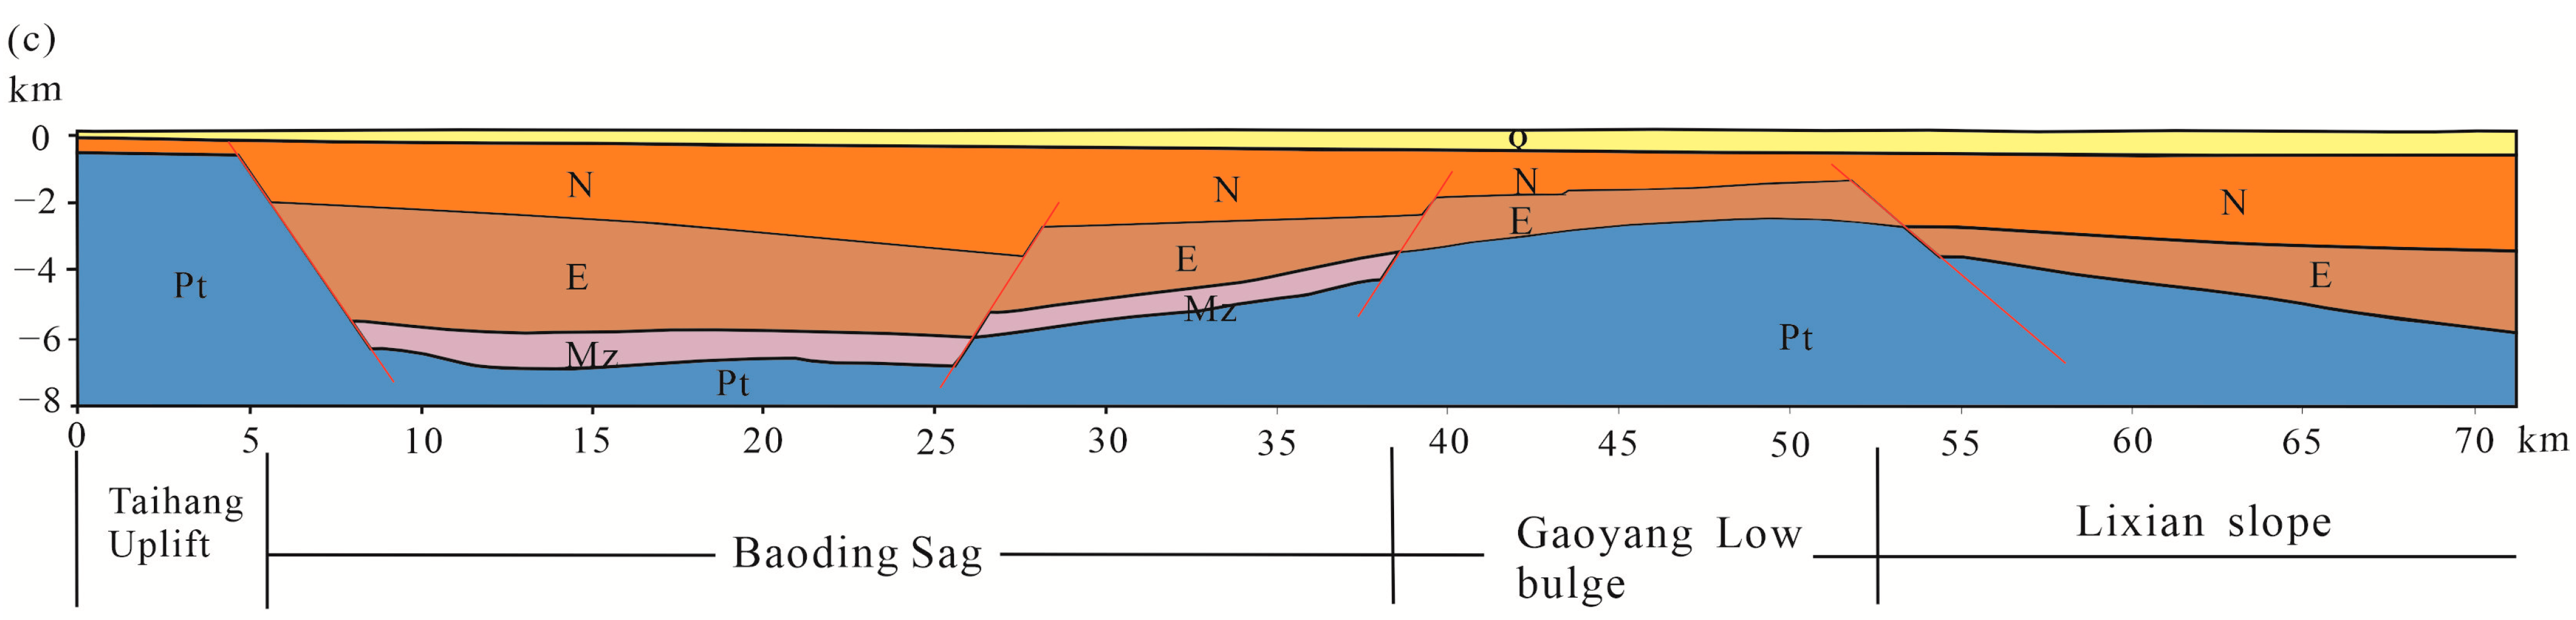
2. Regional Geological Setting

The Jizhong Depression is a typical Meso-Cenozoic fault basin (Figure 1) located in the northwestern part of the Bohai Bay Basin, which consists of 12 small- to medium-sized half grabens developed on the basement of the Yanshan movement, with the Paleocene as the main sedimentary body, and seven bumps and low bumps jointly [21]. The area is divided into a western depression zone and an eastern depression zone bounded by the Gaoyang-Wuji low relief in the central part of the area, as well as the Niouma Town relief and the Hexiwu tectonic belt, and these tectonic units constitute a “two sag and one uplift” pattern of NNE-NE-oriented spreading [22]. This study includes four tectonic units, which are the Baoding sag, the Gaoyang low bulge, the Lixian slope, and the Rao Yang sag, in order from northwest to southeast. The Jizhong Depression, where the study area is located, has experienced many phases of tectonic activities since the Paleozoic, from the stable depositional stage from the Middle Neoproterozoic to the Paleozoic, to the uplift and folding stage in the Mesozoic, to the rupture stage in the Paleocene, and finally to the stage of depression in the Neocene to the present day, and has developed the metamorphism of the Paleozoic, the marine carbonate rocks from the Middle Neoproterozoic to the Middle Ordovician, the marine and terrestrial interbedded clastics with carbonate rocks in the Permian, and the sandstone and mudstone sediments of the lacustrine and riverine phases in the Paleocene to the Quaternary. The general stratigraphy of the area is characterized by the deposition of metamorphic rocks of the Paleoproterozoic and Palaeoproterozoic (Great Wall and Jixian), Paleoproterozoic (Cambrian and Ordovician), Mesoproterozoic (Jurassic and Cretaceous) and Cenozoic (Paleocene, Neoproterozoic and Quaternary) on top of the crystalline basement of the Palaeoproterozoic-Palaeoproterozoic metamorphic rocks, among which the Paleoproterozoic and Jixian formations are in an angularly unconformable contact. This tectonic pattern of the basin basement and the development of sandstone and carbonate thermal reservoirs provide good geological conditions for the transport and storage of deep heat sources [23,24].

3. Materials and Methods

3.1. Hydrochemical Sample

There were 36 groups of water samples in this study, and the sampling points were distributed in four tectonic units: Baoding depression, Gaoyang low relief, Lixian slope and Raoyang depression (Figure 1). Among these, 19 groups of sandstone thermal storage geothermal fluids were taken from the Guantao Formation (Ng), and the water samples numbered JN01-19 (sampling depth 1403–2206 m); 14 groups of carbonate thermal storage geothermal fluids were taken from the Wumishan Formation (Jxw), water samples No. JJ01-14 (sampling depth 3200–4000 m). The geothermal water was collected at the corresponding location in the thermal reservoir and obtained by pumping tests. The fluid was relatively clear and not turbid. These samples included 2 groups of shallow groundwater samples, water samples No. JQ01-02; 1 group of surface water samples, water sample No. JS01; and 1 group of atmospheric precipitation, sample No. SP01.
The indoor tests included water quality analysis and hydroxide isotope analysis, and the water quality analysis was based on the national standards of the People’s Republic of China, “National food safety standard Methods for examination of drinking natural mineral water” (GB 8538-2016) [27], “Standard examination methods for drinking water-General principles” (GB/T 5750-2006) [28], and the People’s Republic of China’s Geological and Mining industry standard “Analysis Method of Groundwater uality” (DZ/T 0064-1993) [29]. The water samples were tested using an inductively coupled plasma emission spectrometer (iCAP6300) to detect cations and trace elements, ion chromatography to detect anions, and the anion and cation equilibrium error was controlled to be less than 3%. δD and δ18O were detected using a water isotope analyzer (L2130i) with Wavelength Scanning-Optical Cavity Decay Spectrometry, and the testing accuracies of δD and δ18O were ±1‰ and ±0.1‰, respectively. The sample test results are shown in Table 1.

3.2. Geothermometer

Geothermal temperature scale is a means of estimating the temperature of deep thermal storage by using the concentration of hot water chemical components related to the temperature of underground thermal storage or the relationship between its ratio and the temperature, and the commonly used geothermal temperature scales include the cationic geothermal temperature scale, SiO2 temperature scale, and so on [30].

3.2.1. Cationic Geothermal Temperature Scale

Cation temperature scale is a method of calculating thermal storage using the relationship between the ratio between Na, K, Ca, Mg and other cations in the geothermal fluid and the temperature when the equilibrium is reached between the geothermal water and the water–rock action of the minerals in the thermal storage layer at a specific temperature. The common cation geothermal temperature scales are the Na-K geothermal temperature scale, Na-K-Ca geothermal temperature scale, and K-Mg geothermal temperature scale.
The Na-K geothermal temperature scale is based on the temperature-controlled exchange equilibrium of Na+ and K+ between the geothermal water and alkali feldspar, and this geothermometer is mainly suitable for calculating the temperature of hot water above 150 °C, with the empirical formula [31]:
T = 1217 1.438 + lg ( N a / K ) 273.15
The Na-K-Ca geothermal temperature scale is an empirical method modified on the basis of the Na-K geothermal temperature scale, which is more suitable for calculating the temperature of hot water with high Ca2+ content. It makes up for the shortcomings of the unreasonable calculation results of the Na-K geothermal temperature scale in Ca2+-rich hot water, with the empirical formula [32]:
T = 1647 lg ( N a / K ) + β ( lg ( C a / N a ) + 2.26 ) + 2.47 273.15
The K-Mg geothermal temperature scale is based on the ion-exchange reaction of potassium feldspar transforming into dolomite and chlorite, which is based on the principle that K/Mg is more sensitive to temperature decreases and can react quickly when the water temperature changes. This geothermometer is mainly suitable for calculating the temperature of hot water at low and medium temperatures, with the empirical formula [30]:
T = 4410 13.95 log ( K 2 / M g ) 273.15
The Ca-Mg geothermometer assumes the equilibrium of the waters with calcite and dolomite in the reservoir, which is reasonable in this type of system, with the empirical formula [33]:
T = 979.8 3.1170 log ( C a / M g ) + 0.07003 log e q 273.15
In Equations (1)–(4) T is the thermal storage temperature (°C) and each ion concentration is mg/L.

3.2.2. Silicon Dioxide Temperature Scale

SiO2 is a mineral commonly found in the lithosphere and hydrosphere, and common SiO2 minerals include quartz, chalcedony, and fonzanite, etc. Because the physicochemical properties of SiO2 in water are stable and unaffected by other ions, and the concentration of SiO2 in water has the characteristic of being sensitive to temperature changes, it has been widely used as a geothermal thermoscan [34]. Silicon dioxide geothermal temperature scale principle SiO2 solution at low temperatures can be maintained for a long time in a supersaturated state; SiO2 is used in a hot water solubility and temperature relationship to estimate the underground heat storage temperature. Nowadays, the commonly used silica geothermal temperature scale includes the quartz geothermal temperature scale and chalcedony geothermal temperature scale, with the empirical formula [35]:
Quartz geothermal temperature scale with no vapor loss:
T = 1309 5.19 lg S 273.15
Jade chalcedony geothermal temperature scale:
T = 1032 4.69 lg S 273.15
In Equations (5) and (6) T is the thermal storage temperature (°C) and S is the SiO2 concentration (mg/L).

3.3. Multi-Mineral Equilibrium Graphical Method

The multi-mineral equilibrium method refers to the method of determining the deep temperature by analyzing the relationship between the dissolution state and temperature of multiple minerals in the geothermal system. It is based on the principle that at a specific temperature, the temperature at which multiple mineral components in the geothermal fluid are close to dissolution equilibrium at the same time is regarded as the temperature of the deep thermal storage [16].
Mineral saturation index SI = logQ/K, where Q is the ion activity product and K is the reaction equilibrium constant at a specific temperature, using SI to determine the degree of equilibrium between minerals and geothermal water reactions in geothermal systems. If SI > 0, it indicates that the minerals are oversaturated and precipitation occurs in the hot water; if SI = 0, it indicates that the minerals are in equilibrium between dissolution and precipitation; if SI < 0, it indicates that the minerals are not saturated, and dissolution of minerals continues to occur.

3.4. Water–Rock Balance Analysis

Judging whether the ions in the geothermal fluid reach the equilibrium state is a prerequisite for calculating the thermal storage temperature using the geothermal temperature scale; therefore, before using the geothermal temperature scale for calculation, it should be judged whether the geothermal fluid reaches the water–rock equilibrium or not. Nowadays, the Na-K-Mg triangulation diagram is often used to classify the geothermal fluid into three types: fully equilibrated, partially equilibrated, and immature water [36], according to the water–rock equilibrium state and whether there is cold water mixing [34]. The Na, K, and Mg contents in the geothermal fluid samples in the study area were linearly transformed and put into the Na-K-Mg triangular diagram, and according to their position, we can judge whether the ions in the water samples reached the equilibrium state.

4. Results

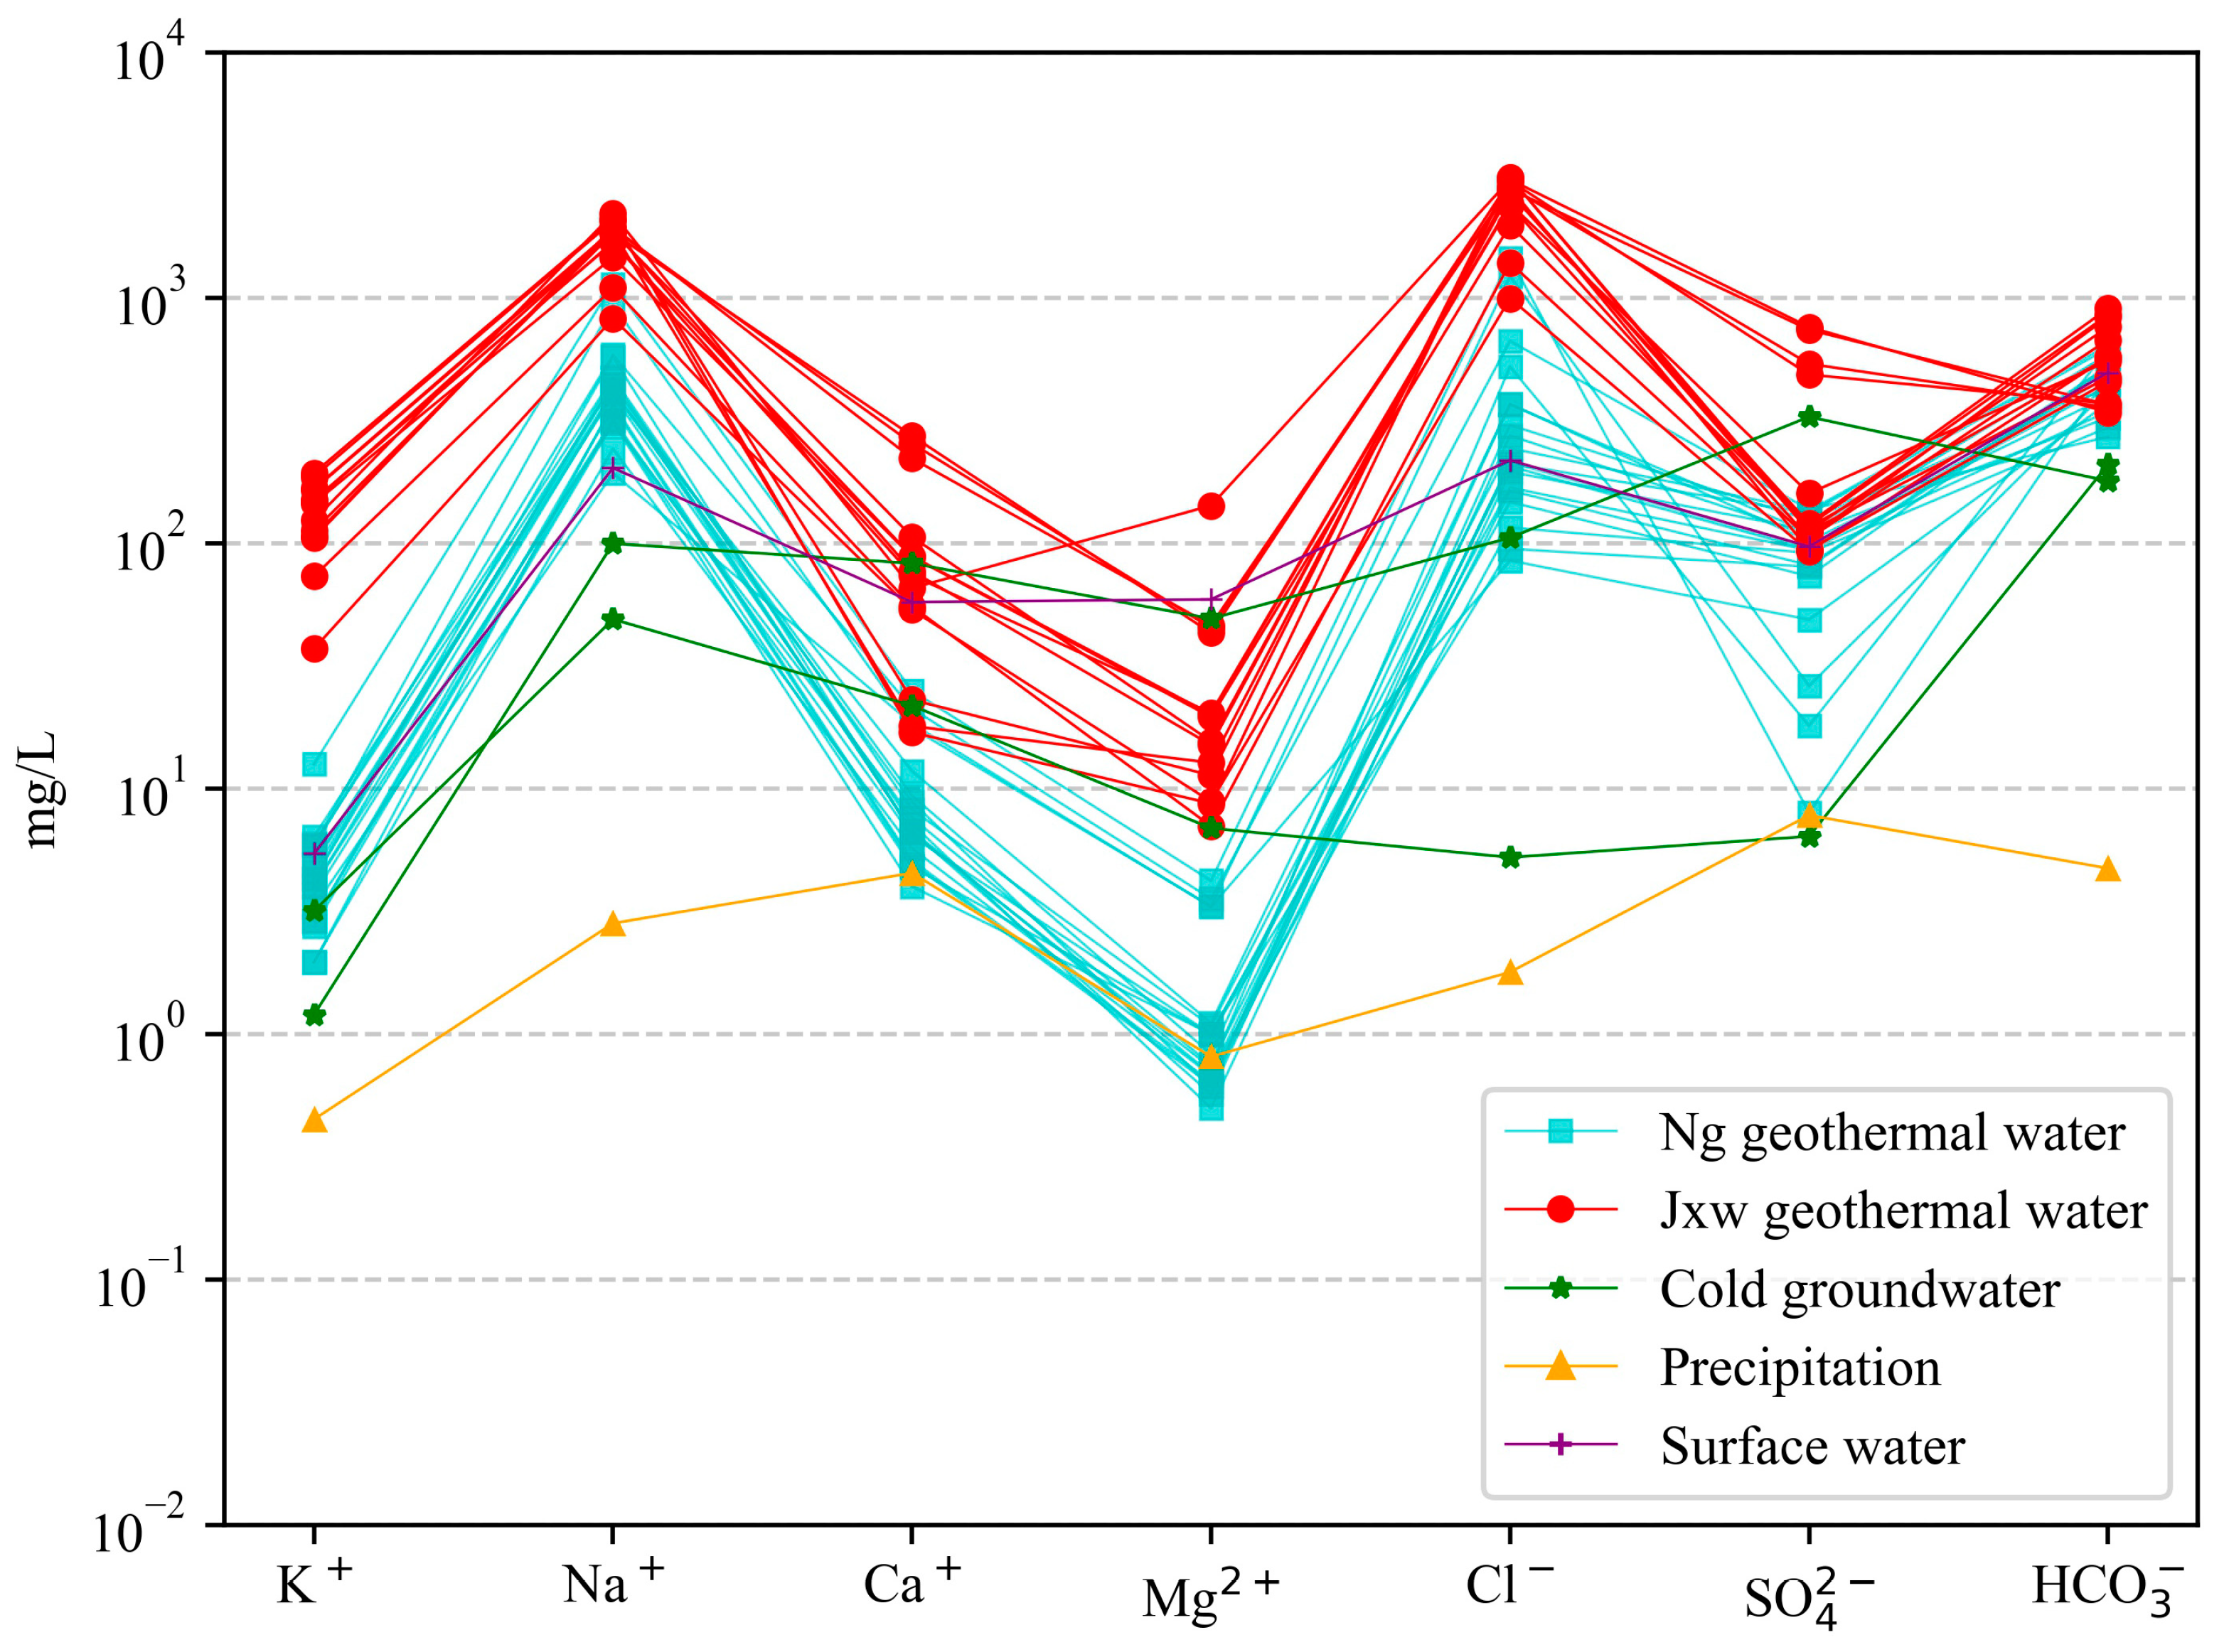
4.1. Hydrochemical Characteristics

Geothermal fluids can be divided into different geothermal water chemical types according to their chemical composition. Statistical analysis of the main chemical indicators of geothermal fluids in the study area can be seen in Table 1 and Figure 2: Ng geothermal water pH value distribution is more concentrated, with the value range of 7.78–8.58 and the average value 8.3, belonging to the weakly alkaline. The distribution of total dissolved solids (TDS) value is more concentrated, with the value range of 753.6–3193 mg/L and the average value 1390.76 mg/L. The Jxw geothermal water pH value distribution is discrete, with the value range 6.9–8.81 and the average value 8.46, belonging to weak alkaline. The total dissolved solids (TDS) distribution range is discrete, with the value range 2398–6742 mg/L and the average value 6059.2 mg/L, belonging to saline water.
From Figure 3, it can be seen that the cations of the geothermal fluids of sandstone thermal storage and carbonate thermal storage in the study area are mainly dominated by Na+, and the anions are mainly dominated by HCO3 and Cl. The high concentration of Na+ and Cl in the Jxw thermal storage also reflects the long hot water runoff time in its deeper part and deeper hot water metamorphism [37]. According to Shukarev’s classification [38], the hydrochemical types of geothermal fluids in sandstone thermal storage in the study area are mainly of the Cl·HCO3Na type, the geothermal fluids in carbonate thermal storage are mainly of the Cl-Na and Cl·HCO3Na types, and the shallow subsurface cold water is of the SO4Na·Ca and HCO3Na·Ca type water. According to studies by Apollaro et al. [39], the iso–ionic–salinity (TIS) lines were added in the correlation plot of (Na+ + K+) vs. (Ca2+ + Mg2+) to reflect the ionic salinity. As shown in Figure 4, the content of Ca2+ and Mg2+ is lower than that of Na++ K+ on the whole, and the total ionic salinity (TIS) of water ranges from 10.95 to 114.05 meq/L.
According to the results of the Schoeller diagram (Figure 5), Ca2+, Mg2+, and HCO3 in Jxw hot storage are higher than in Ng hot storage in the study area, which is mainly caused by the difference in lithology of the different hot storages. The lithology of Jxw hot storage is mainly composed of dolomite, and the main mineral fractions are dolomite and calcite; Ca2+, Mg2+, HCO3 derive mainly from the dissolution of these carbonate minerals. The main ions of the water samples—Na+, K+, Cl—are greater in Jxw thermal storage than in Ng thermal storage. The reason is that the water circulation path of Jxw thermal storage is longer, the dissolution and filtration is more adequate, and the soluble materials in the surrounding rocks enter into the hot water in large quantities. The ion concentration in the sandstone thermal storage is relatively low, which indicates that it circulates relatively fast and the flow-through speed is greater. There is a difference in the trend of ion changes between the geothermal water and the cold groundwater, indicating that they are not clearly hydraulically connected.

4.2. Estimation of Deep Thermal Storage Temperature

The thermal storage temperatures were calculated by each temperature scale and the results are shown in Table 2. The calculated ranges of Ng thermal storage in the study area using Na-K, Na-K-Ca, K-Mg, Ca-Mg, Quartz, Chalcedony, and the SI Method were 54.48–106.59 °C, 55.18–87.28 °C, 53.23–103.1 °C, 364.31–457.66 °C, 53.23–103.1 °C, respectively, 32.2–155.61 °C, 27.44–131.09 °C and 71–99 °C, while the calculated ranges of Jxw heat storage in the study area were 164.08–106.59 °C, 97–154.32 °C, 129.18–217.57 °C, 265.41–401.85 °C, 133.07–293.81 °C, 105.93–297.4 °C, and 110–153 °C, respectively. According to the comparison results, it can be seen that the Jxw thermal storage temperature derived using each temperature scale calculation method is higher than the Ng thermal storage, i.e., the thermal storage temperature of the deep Jixian carbonate samples is higher than that of the shallow Neoproterozoic sandstone thermal storage.

4.3. Water Rock Balance Results

The Na-K-Mg ternary diagram can be used to determine the degree of equilibrium of the geothermal water and rock mineral reaction as well as to estimate the thermal storage temperature, and this diagram classifies the geothermal water into three types: fully equilibrated water, partially equilibrated or mixed water, and immature water [30]. The Na-K-Mg triangular diagram of the water sample points in the study area was drawn by Aqua-Chem software (Version 3.70) (Figure 6), and most of the water samples of the thermal storage layer fall in the partial equilibrium or mixed water area, indicating that the de-watering rock action has not completely reached equilibrium. Therefore, there is a deviation between the estimation of the thermal storage layer using the cationic geothermal temperature scale and the actual thermal storage temperature, in which the water sample points of the thermal storage layer of the Ng fall in the vicinity of the complete equilibrium line, indicating that the water samples of the Ng are close to the water–rock balance line. The water samples in the Ng reservoir fall near the complete equilibrium line, indicating that the Ng reservoir water samples are close to the water–rock equilibrium state, and the cationic temperature scale can be used to estimate the thermal reservoir temperature.

5. Discussion

5.1. Analysis of Hydrochemical Evolution

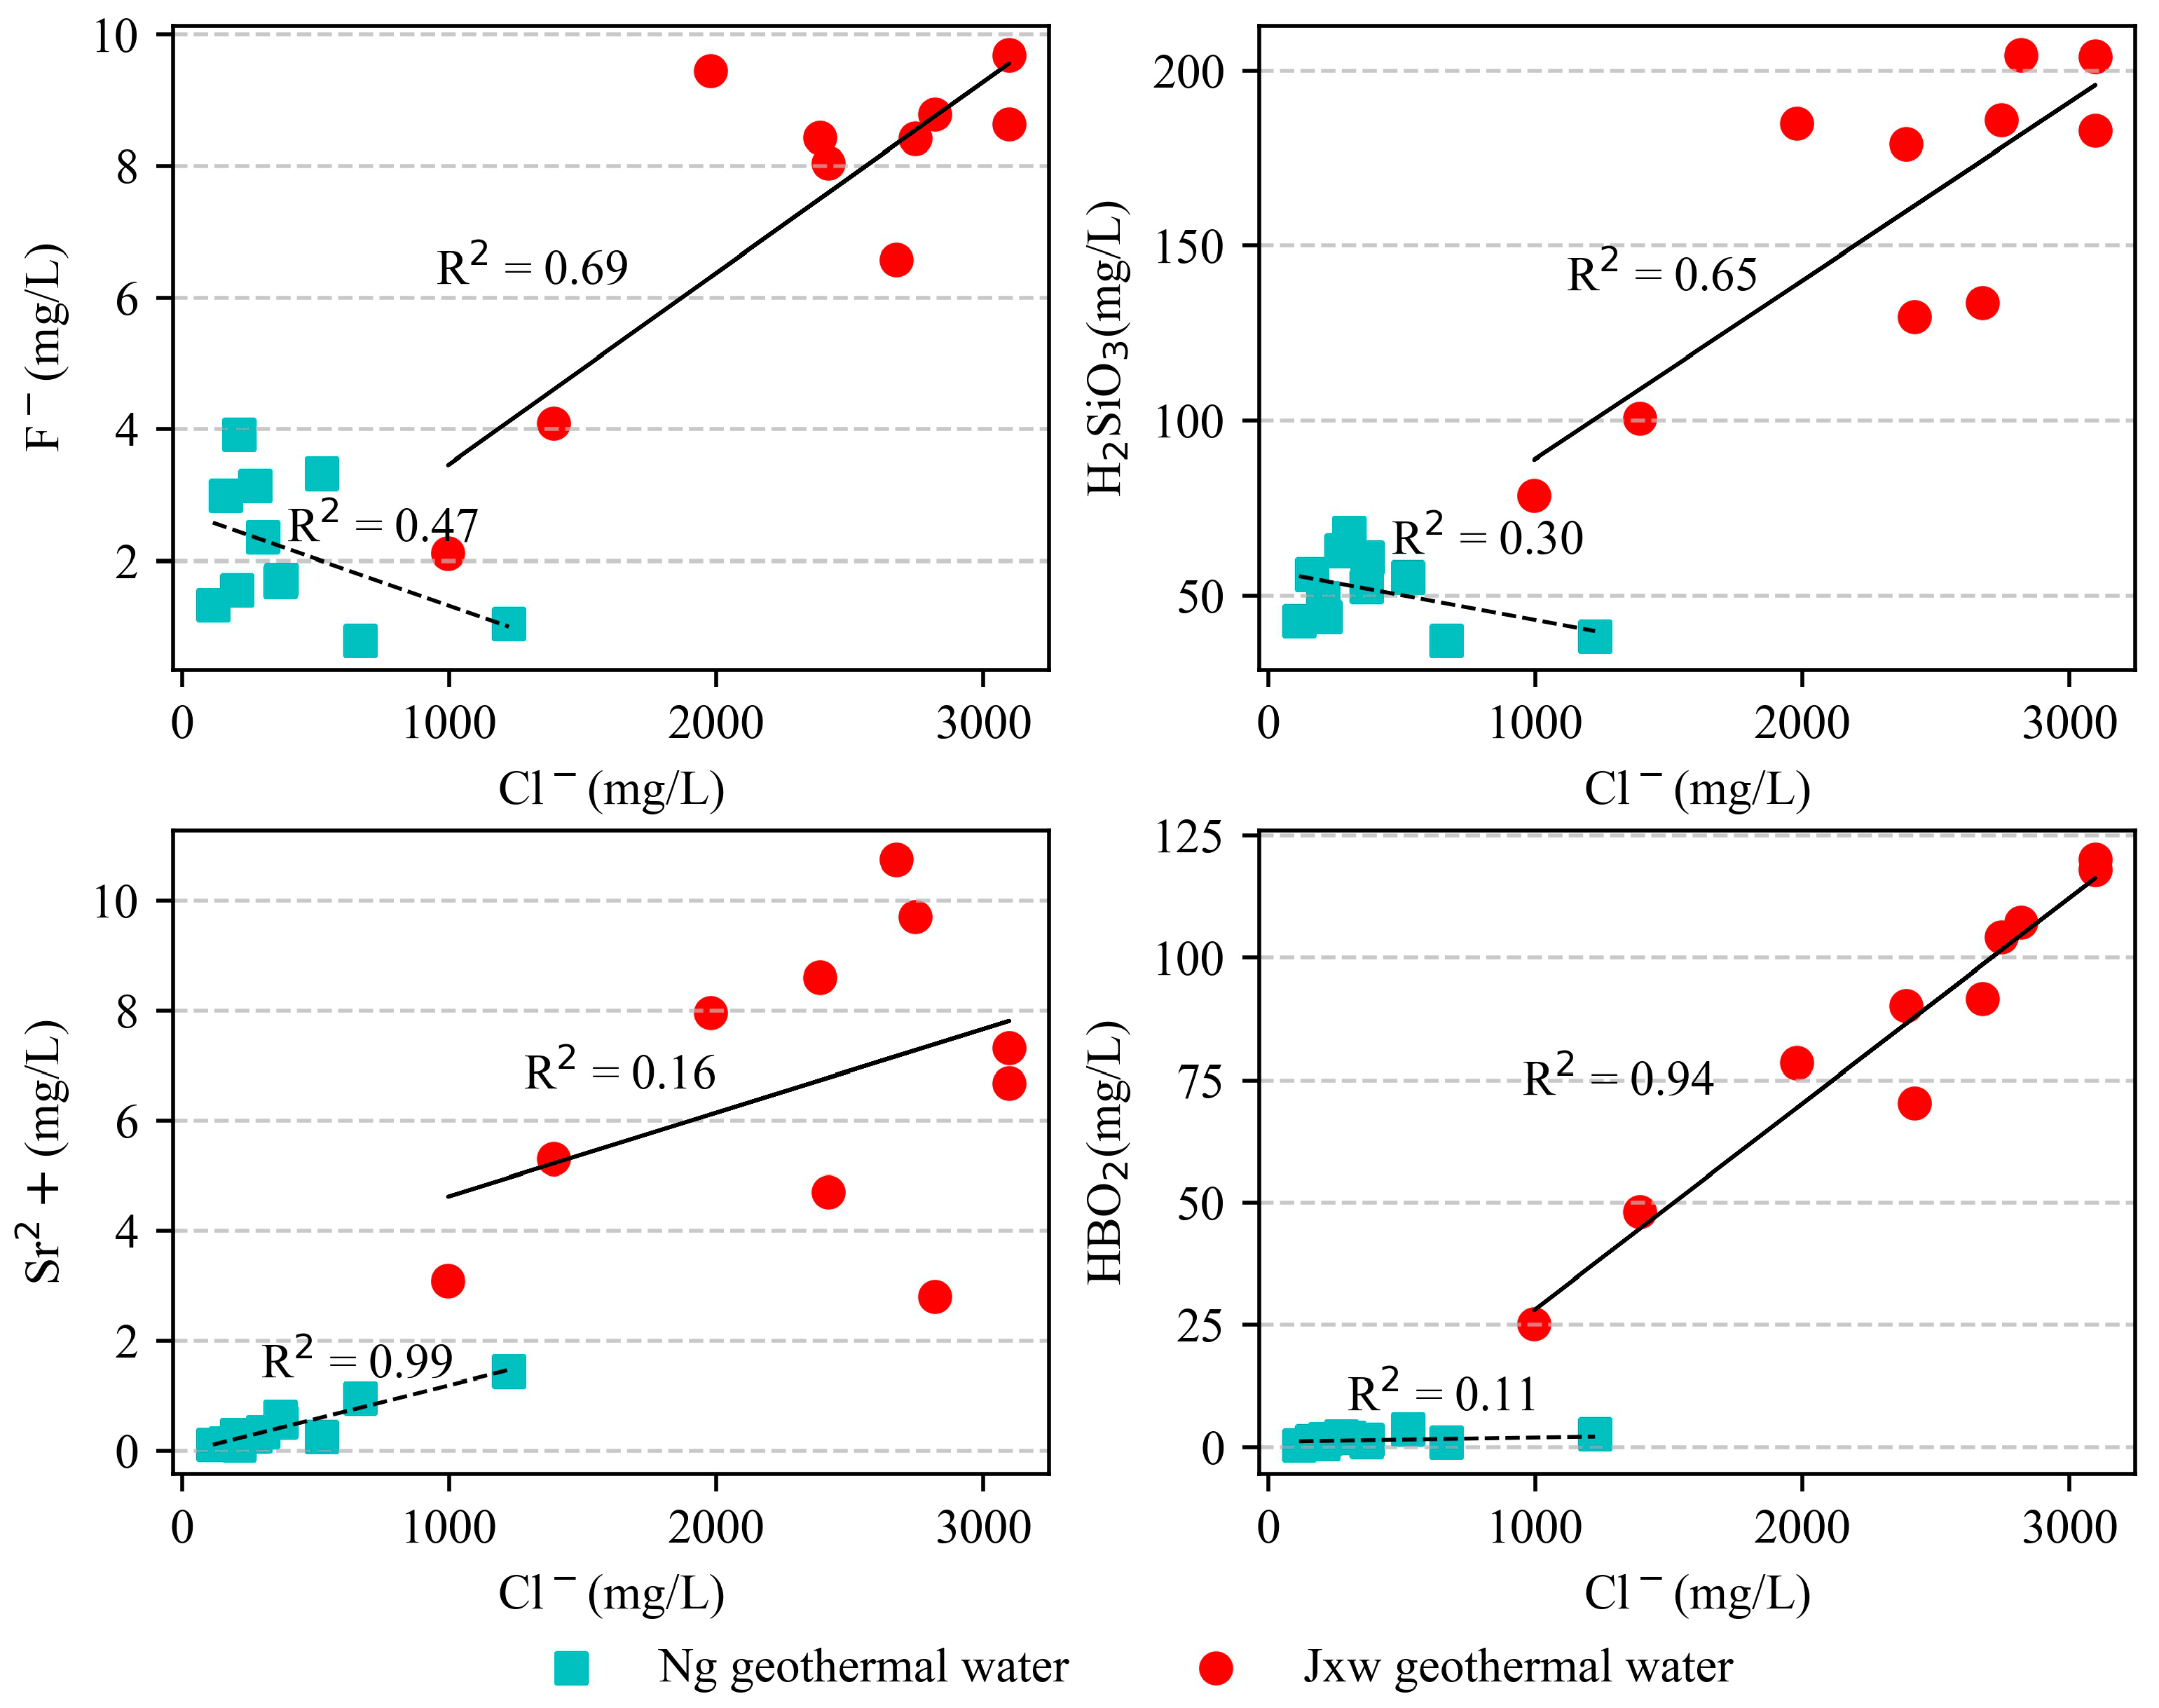
5.1.1. Correlation Analysis of Hydrochemical Components

By analyzing the correlation between the main chemical indicators and ion concentrations of the geothermal water, the groundwater runoff conditions can be obtained, and the possible sources of the hydrochemical components of the geothermal water can be inferred. Cl can serve as a good tracer in hot water systems. The principle is that Cl is not easily adsorbed on mineral surfaces or does not form mineral salts in hydrothermal systems and is in a stable state under high-temperature conditions. Therefore, the source of the ions can be determined by analyzing the correlations between Cl and other ions [20]. According to Table 3, there are significant correlations between the Cl and Na+, K+, and Ca2+ in the Ng thermal storage in the study area, indicating that these three ions have the same source as the Cl. There are significant correlations between the Cl and Na+ and K+ in the Jxw thermal reservoir in the study area, indicating that both have the same material source as the Cl, and both are derived from the dissolution of related minerals and some deep Earth materials. However, the correlations between the main ions Ca2+, Mg2+, SO42−, HCO3, and Cl are not good, indicating that these ions only originated from mineral dissolution during hydrothermal processes. HCO3 has strong correlations with Ca2+ and Mg2+, indicating that these ions mainly originated from the dissolution of dolomite. The Na+, K+, and Cl in the two types of thermal storage exhibit significant positive correlations with the total dissolved solids (TDS), indicating that these three ions have a significant impact on the changes in the TDS content of the geothermal water.
According to the hydrochemical analysis of the samples from the study area, the main trace elements in the geothermal water are F, Sr2+, metaboric acid, and metasilicic acid, which are especially enriched in the Jxw thermal reservoirs. These trace elements are mainly derived from hydrothermal processes or deep hydrothermal fluids. By plotting the relationships between Cl and F, Sr2+, metaboric acid, and metasilicic acid, the main sources of the trace elements in the deep geothermal water can be determined. According to Figure 7, the correlations between Cl and F and metasilicic acid –in the Ng thermal storage are poor. It is speculated that the Cl has different material sources, and the contents of Sr2+ and metasilicic acid in this aquifer are relatively low, indicating that these trace elements in the Ng geothermal water mainly come from the dissolution of minerals during hydrothermal processes. There are good positive correlations between Cl and F, metaboric acid, and metasilicic acid in the Jxw thermal storage, suggesting that these three trace elements have material sources similar to that of the Cl. The content of metaboric acid in geothermal water is directly proportional to the intensity of the runoff [40]. The content of the metaboric acid in the Jxw hot water in the area is significantly higher than that in the Ng hot water, indicating that the geothermal water in the Jxw thermal storage has a longer runoff path, a slower flow velocity, and a weaker runoff intensity.

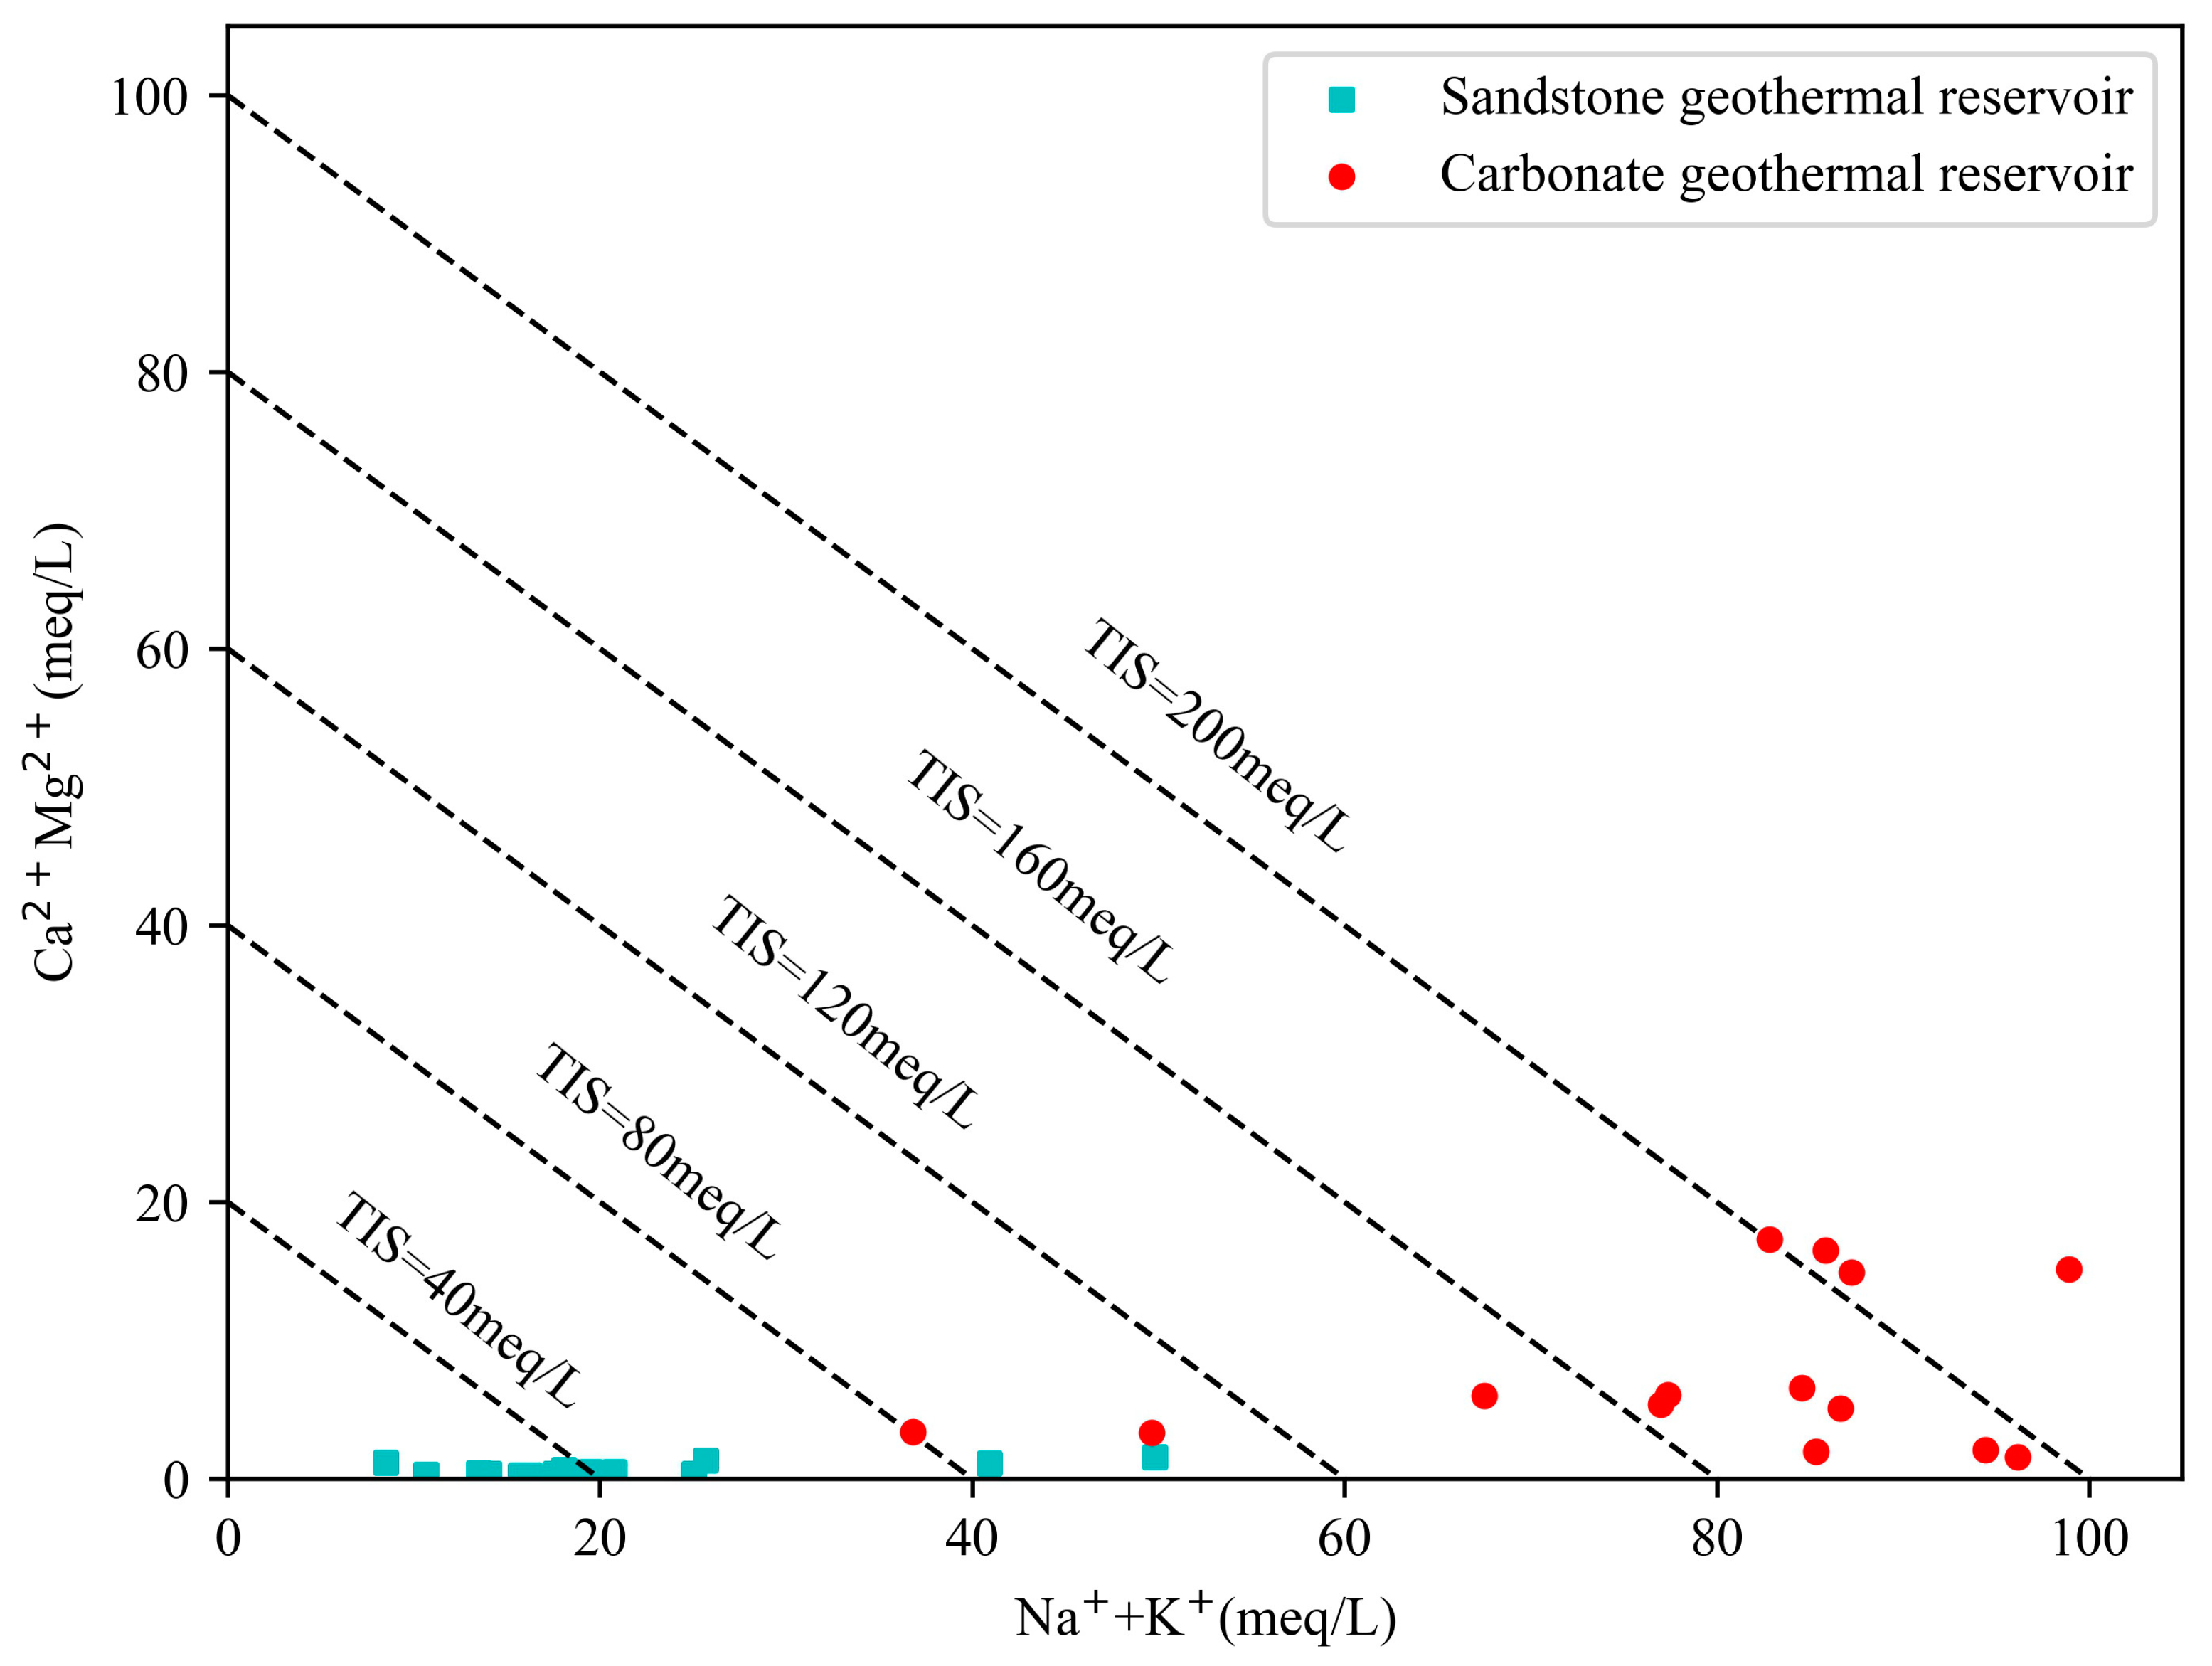
5.1.2. Characteristic Coefficients of Geothermal Water

The study of ionic ratios in formation water can reflect the degree of metamorphism, desulfurization, and salinization of groundwater. The metamorphic coefficient γNa+/γCl is used to describe the degree of groundwater metamorphism, the hydrogeological and geochemical environment of thermal reservoirs, and their sealing properties. The smaller the metamorphic coefficient is, the better the sealing of the aquifer is, and the higher the degree of metamorphism is. The desulfurization coefficient 100 × γSO42−/γCl is used to indicate the degree of sulfate removal from the groundwater, and its reaction process is SO42− + 2C + 2H2O → H2S + 2HCO3 [41]. If the desulfurization coefficient is smaller, the environment in which the geothermal water is located is sealed better and has higher reducibility. If the desulfurization coefficient is less than 1, the environment in which the aquifer is located has been completely restored. The salinization coefficient γCl/(γHCO3 + CO32−) can reflect the degree of salinity of the groundwater, and the larger the salinity coefficient is, the higher the degree of salinity of the groundwater is. The characteristic coefficient values of the geothermal water are presented in Table 4.
The metamorphic coefficient of the Ng geothermal water in the research area is 1.18–3.38, and that of the Jxw geothermal water in the research area is 1.02–1.28. The results indicate that the Jxw thermal reservoir has better sealing performance and a higher degree of metamorphism, and the environment it is located in has a stronger reducibility. The metamorphic coefficients of both the Ng and Jxw reservoirs are greater than 1, indicating that atmospheric precipitation affects the formation of the hot water in both reservoirs, but the Ng reservoir is more strongly affected.
The desulfurization index of the Ng thermal storage in the research area ranges from 1.59 to 58.1, and the desulfurization index of the Jxw thermal storage ranges from 2.47 to 6.87, both of which are lower than those of shallow groundwater, indicating that both reservoirs have undergone a certain degree of desulfurization. The Jxw thermal storage has better sealing performance than the Ng thermal storage, and its geological environment is more reducible.
The salinity coefficient of the Ng hot water in the study area ranges from 0.54 to 5.00, with an average of 1.76. The salinity coefficient of the Jxw hot water ranges from 2.98 to 11.24, with an average of 6.54, indicating that the Jxw geothermal water has a longer runoff path, slower water circulation speed, and higher salinity than the Ng geothermal water.

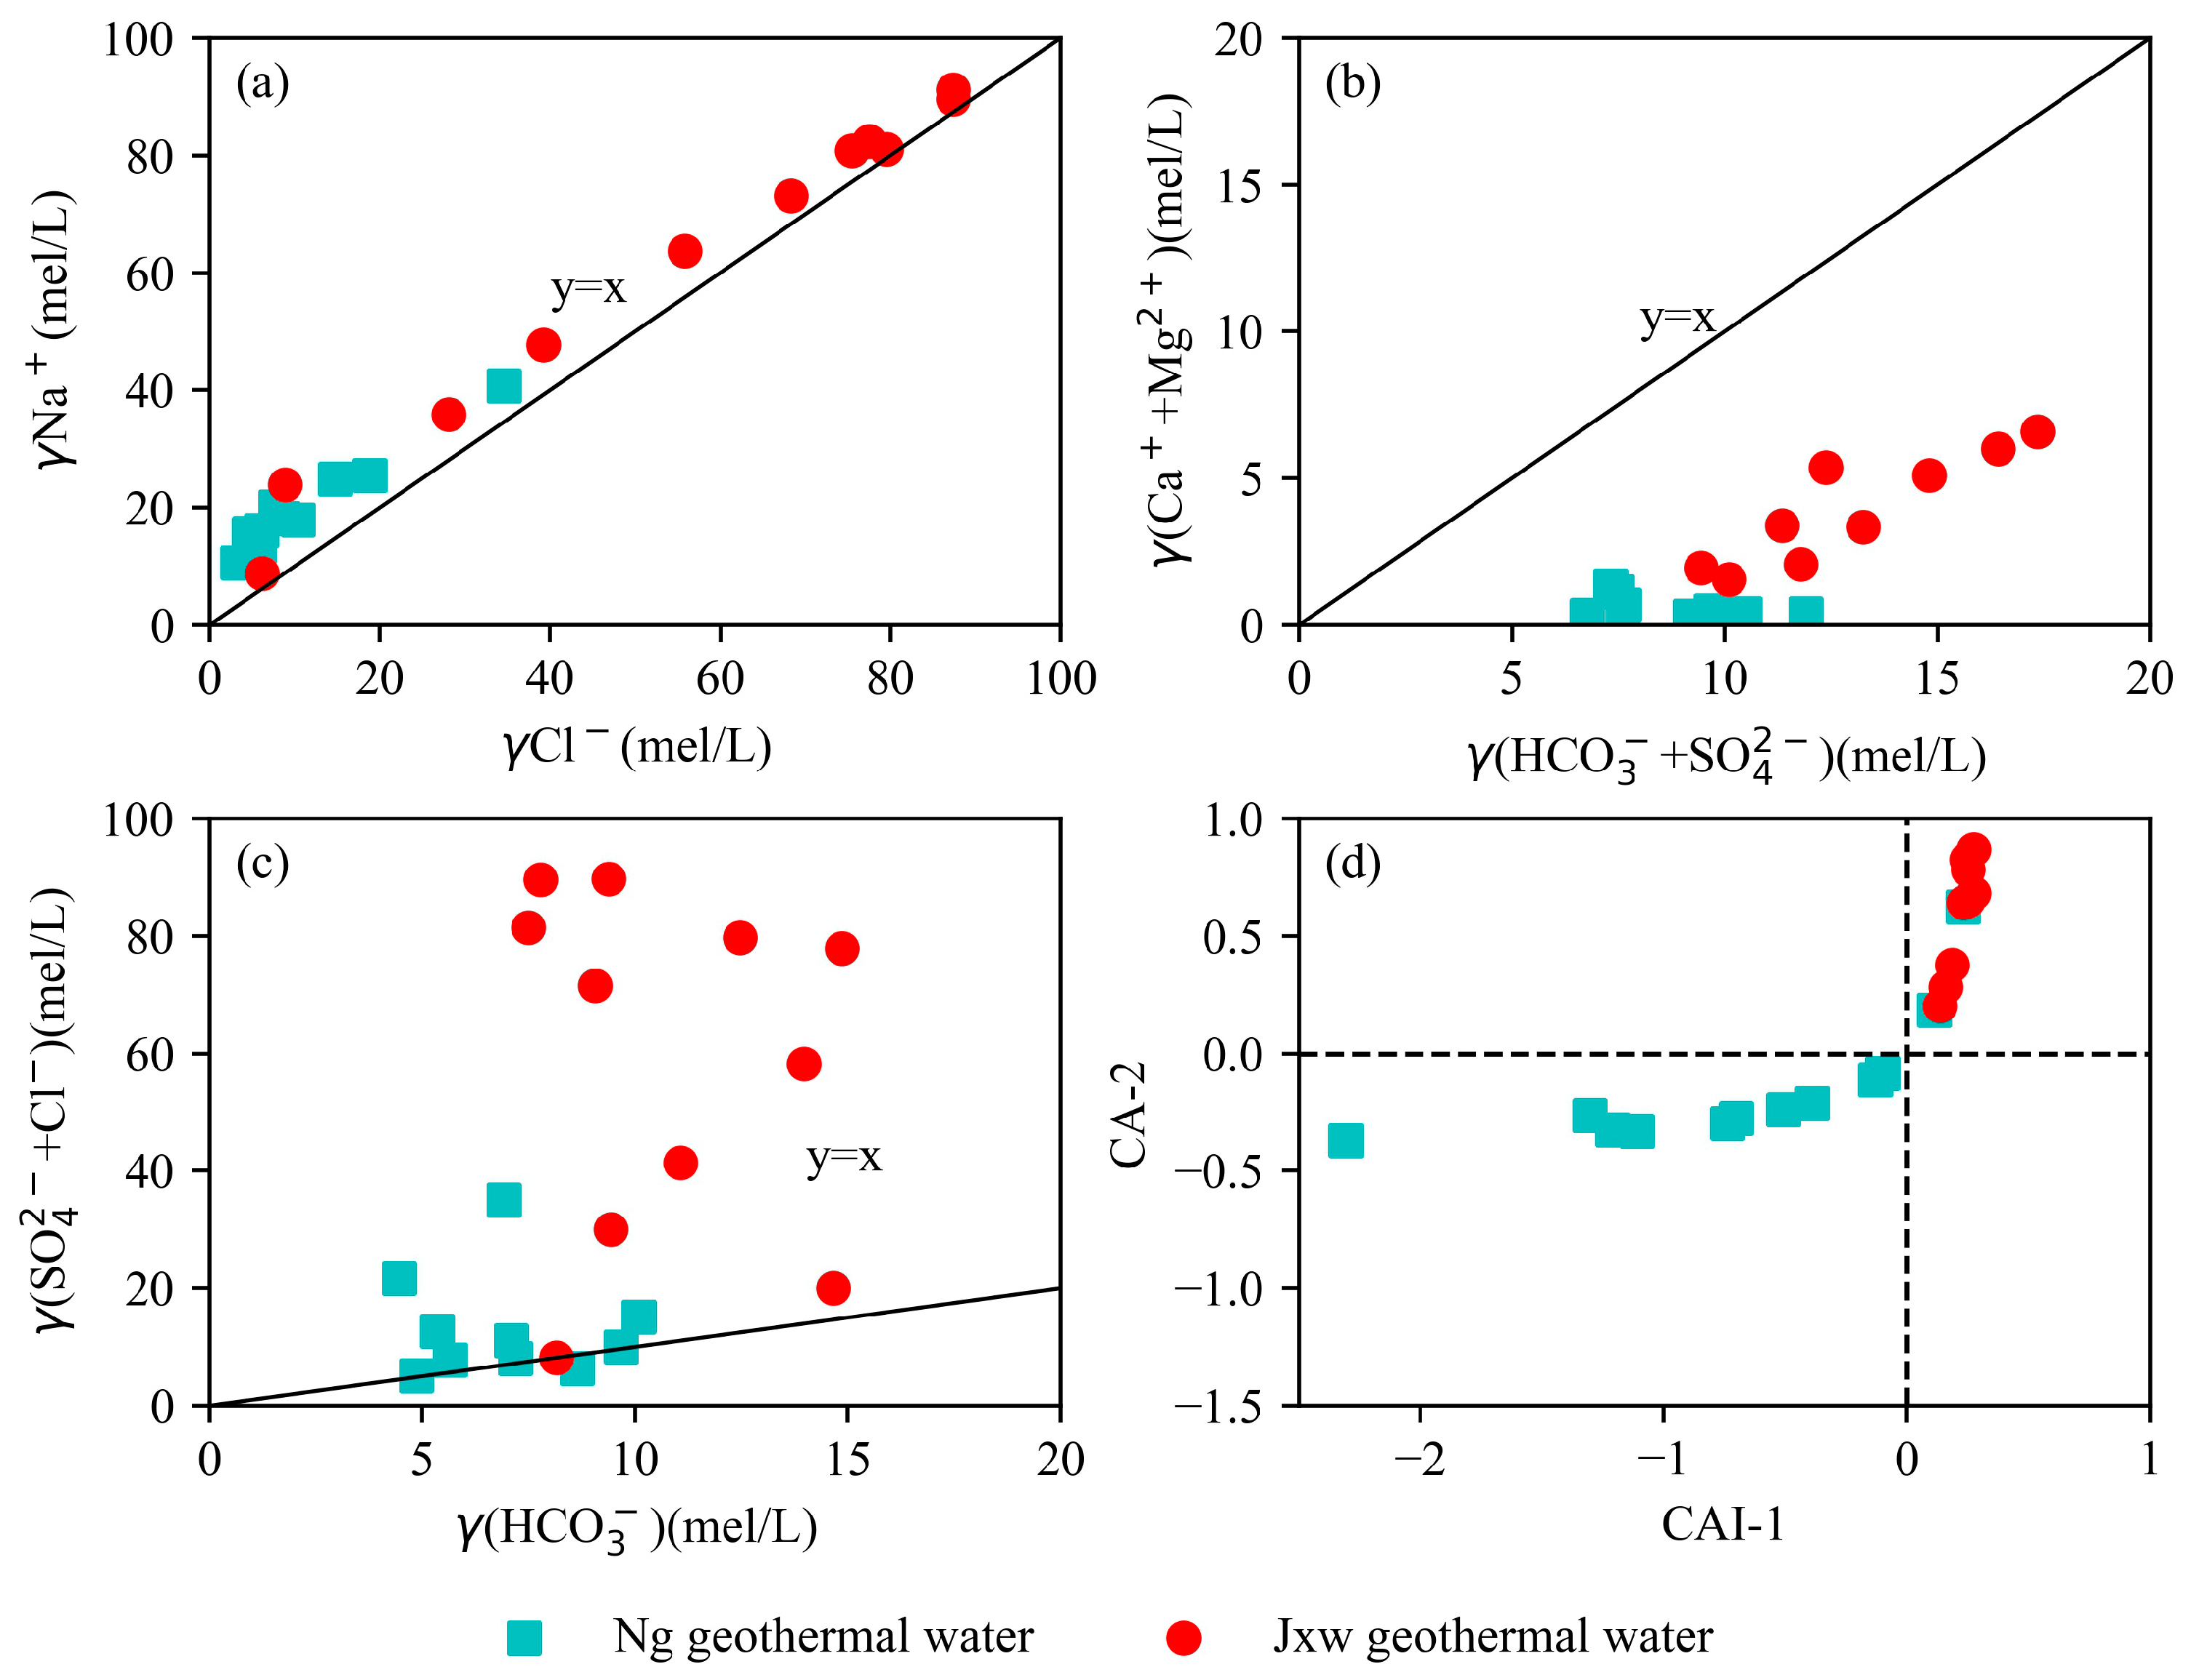
5.1.3. Main Ion Sources of Geothermal Water

During the deep circulation process of groundwater, differences in the hydrochemical components occur due to water–rock reactions with surrounding rocks [42]. By identifying the sources of the major ions, the evolution process of the hydrochemistry can be revealed. The source of Na+ can be obtained using the γNa+/γCl ratio. It can be seen from Figure 8a that the Na+ contents of all of the water samples from Ng and Jxw are slightly higher than the Cl contents, and the data plot near the y = x ray, indicating that the Na+ in the geothermal water in the study area mainly comes from salt rock dissolution. The main sources of the Ca2+ and Mg2+ in the groundwater can be analyzed using the γ(Ca2+ + Mg2+)/γ (HCO3 + SO42−) ratio, which is based on the principle that the Ca2+ and Mg2+ in groundwater generally come from the weathering and dissolution of carbonate rocks, silicates, and evaporites. It can be seen from Figure 8b that the γ(Ca2+ + Mg2+)/γ(HCO3 + SO42−) ratios of the Jxw thermal storage are greater than those of the Ng thermal storage, and the water samples are generally distributed below the y = x line. Therefore, it is concluded that the Ca2+ and Mg2+ in the Ng thermal storage water and the Jxw thermal storage water both originate from the dissolution of carbonate minerals. The γ(SO42− + Cl)/γHCO3 ratio can be used to identify the control ratio of carbonate and salt rocks during rock dissolution [43]. The γ(SO42− + Cl)/γHCO3 ratios of the water samples from the research area are shown in Figure 8c. Most of the Jxw and Ng thermal storage water samples plot above the y = x ray, indicating that the SO42− and Cl in the thermal storage water mainly come from the dissolution of evaporate salt rocks. The larger ratio of the Jxw water indicates that the SO42− and Cl in the Jxw thermal storage water are mainly from the dissolution of evaporate salt rocks.
Cation alternating adsorption is an important process in the chemical evolution of groundwater [44]. The cation alternating adsorption process in groundwater can be characterized by the chlor-alkali index (CAI-1, CAI-2), and the calculation formulas for CAI-1 and CAI-2 are as follows:
C A I 1 = C l ( N a + + K + ) C l
C A I 2 = C l ( N a + + K + ) S O 4 2 + H C O 3 + C O 3 2 + N O 3
Positive CAI values indicate ion exchange between the Na+ and K+ in groundwater and the Ca2+ and Mg2+ in the surrounding rocks. If all of the CAI values are negative, the ion exchange direction is opposite [45]. The absolute value of the CAI represents the degree of cation exchange between the groundwater and surrounding rock, and its value is directly proportional to the degree of exchange. It can be seen from Figure 8d that the CAI values of the Jxw thermal storage water are all positive, indicating that the Na+ and K+ in the Jxw thermal storage water undergo ion exchange with the Ca2+ and Mg2+ in the surrounding rock. The CAI values of the Ng thermal storage water are often negative, indicating that the alternating adsorption process of the cation ions in the geothermal water involves the exchange of the Ca2+ and Mg2+ in the geothermal water with the Na+ and K+ in the surrounding rocks. The absolute CAI-1 and CAI-2 values of the Ng geothermal water are mostly greater than those of the Jxw geothermal water, indicating a higher degree of cation alternating adsorption.

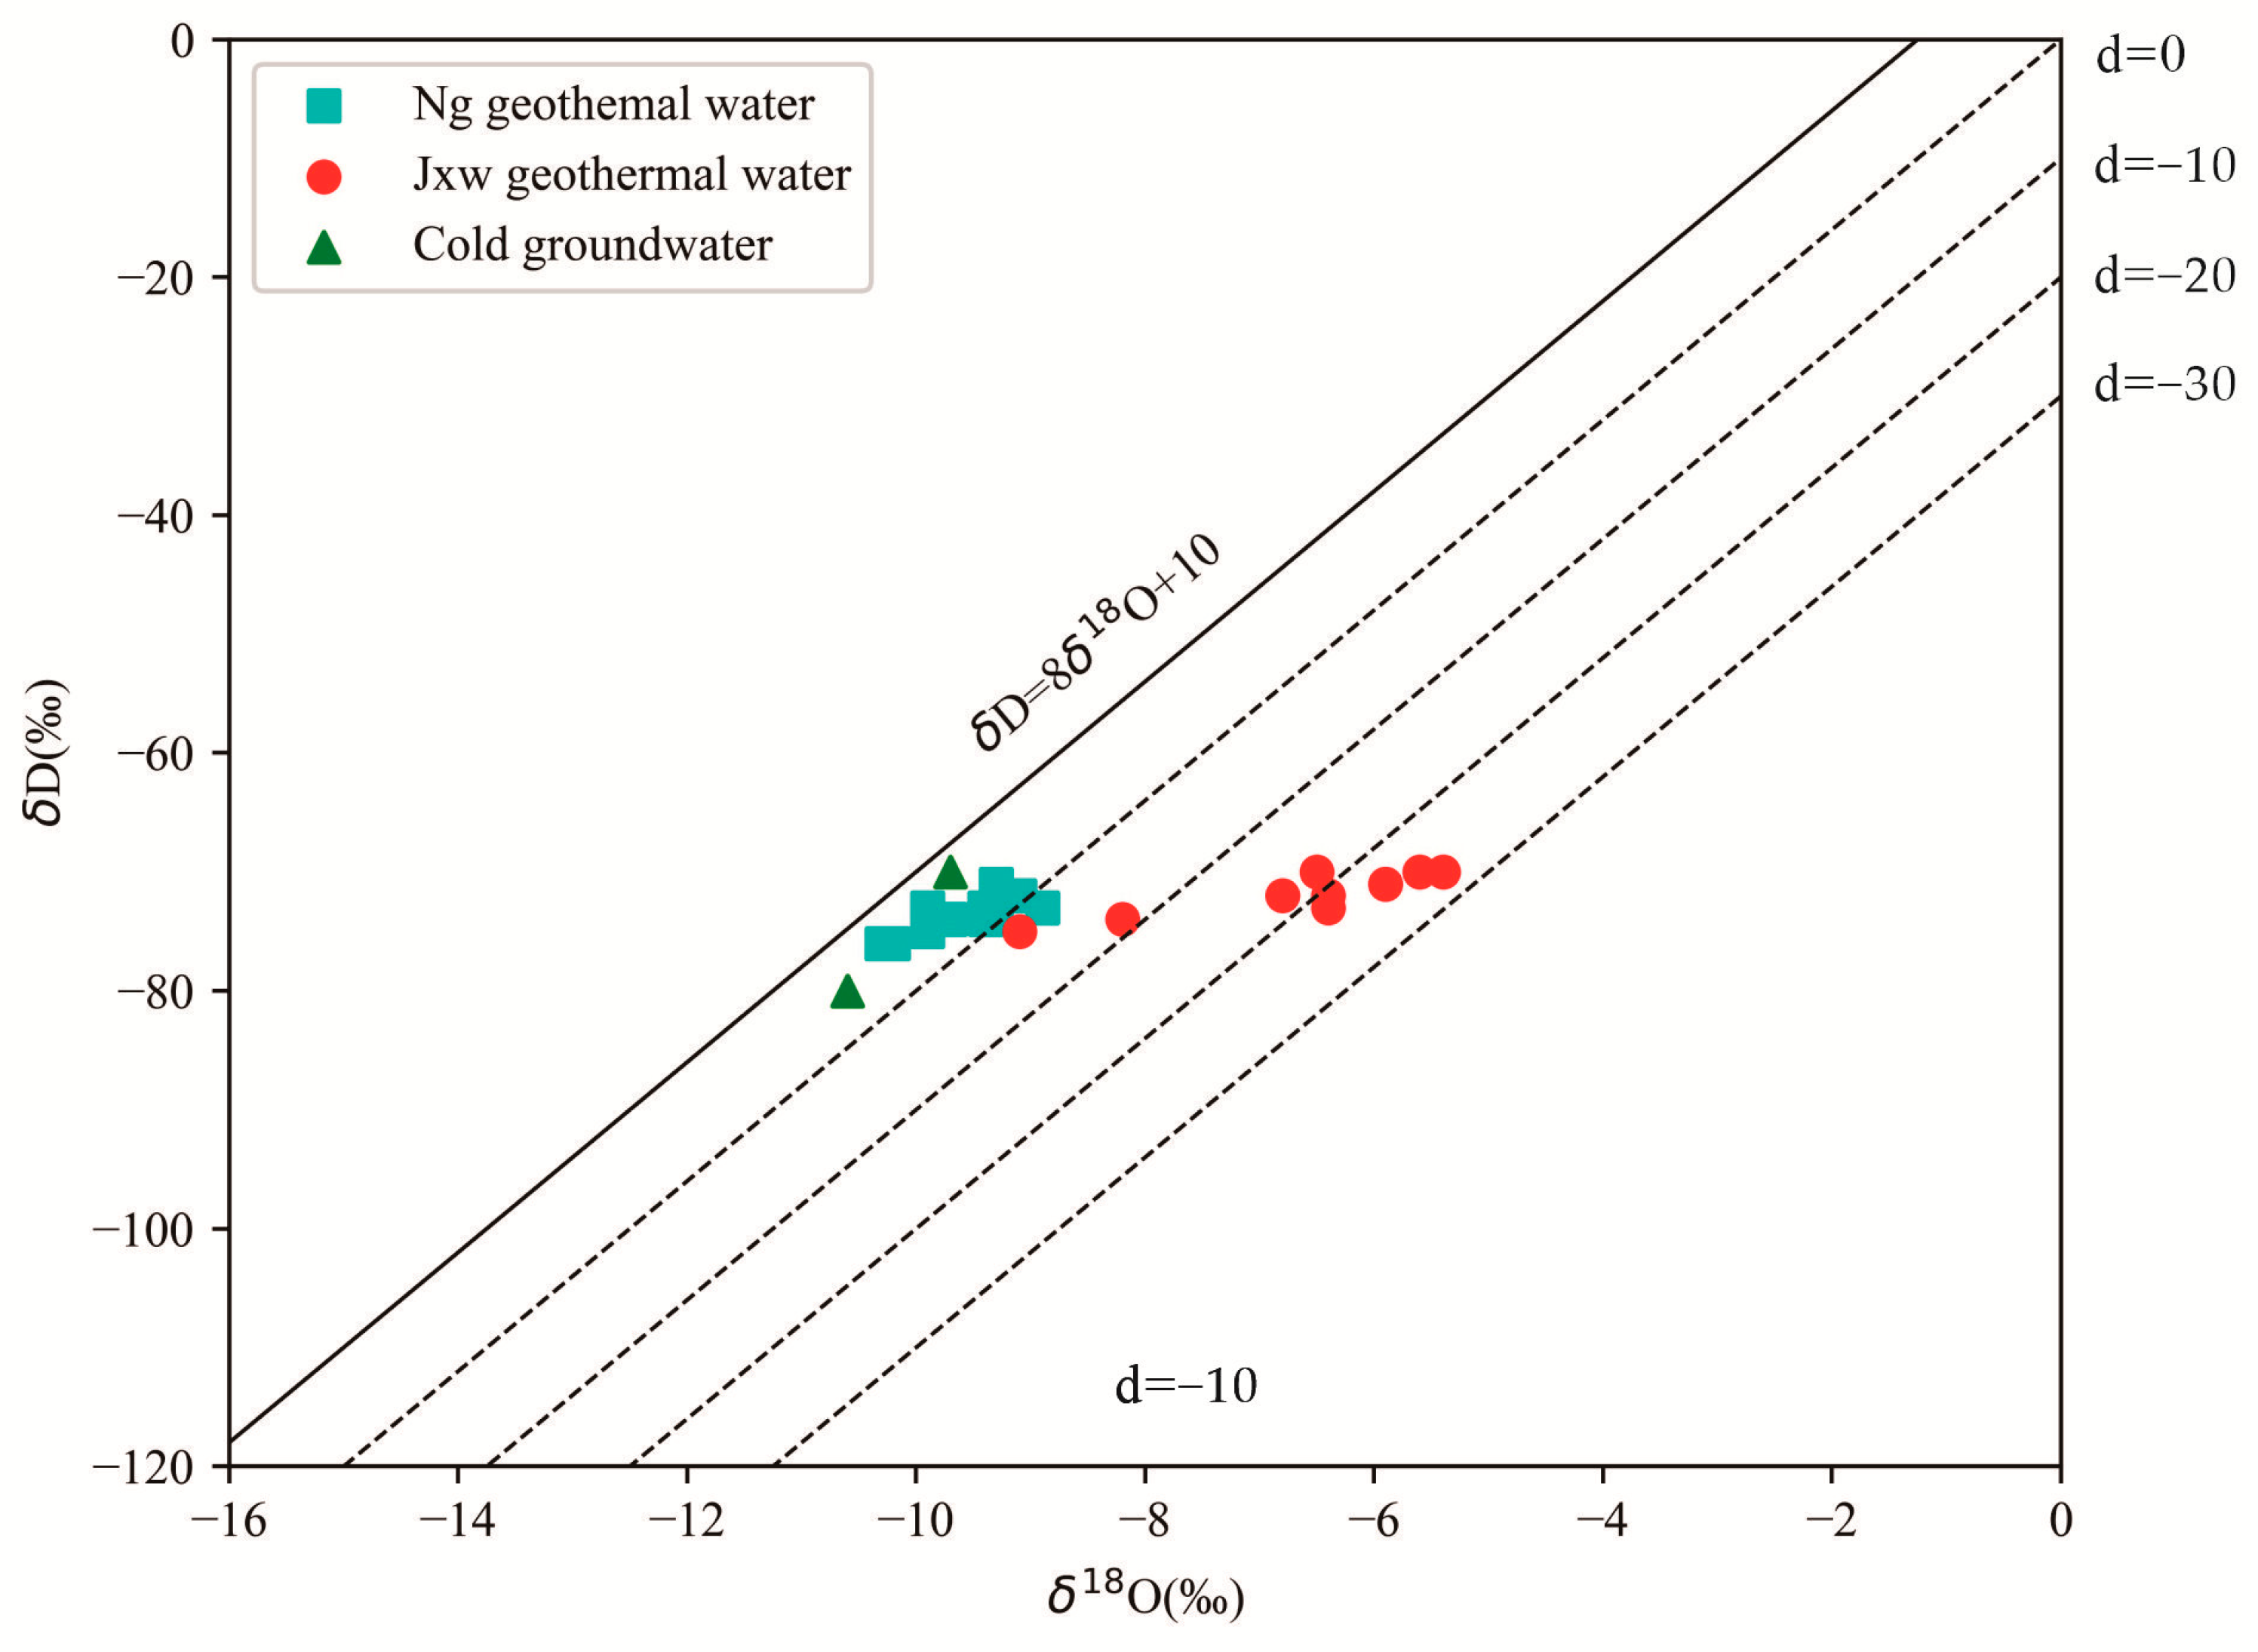
5.1.4. Source of Geothermal Water Supply

Hydrogen and oxygen isotopes are good tracers, and the recharge and elevation of groundwater during circulation can be represented by their distribution characteristics [7]. Using the hydrogen and oxygen isotope standards (Standard Mean Ocean Water, SMOW) determined by Craig [46] and the global atmospheric waterline equation (δ D = 8δ18O + 10), the study area can be divided into Ng geothermal water, Jxw geothermal water, and shallow groundwater. A plot of δD versus δ18O is shown in Figure 9. The solid line in Figure 9 represents the global atmospheric water line (GMWL), while the dashed line represents the deuterium excess parameter (d), where d can be used to measure the degree of exchange of 18O between the geothermal water and rocks. The smaller the d value is, the smaller the runoff velocity of the geothermal water is, the longer the retention time in the aquifer is, and the stronger the water–rock reaction is. The expression for d is d = δD − 8. The 18O and d values are not affected by factors such as the season and height, and their values are constant [47].
For the Ng geothermal water in the research area, δD is between −76‰ and −71‰, and δ18O is between −10.3‰ and −8.9‰. For the Jxw geothermal water, δD is between −75‰ and −70‰, and δ18O is between −9.1‰ and −5.4‰. In Figure 7, the overall distributions of the hydrogen and oxygen isotopes in the Ng geothermal water and shallow groundwater plot near the GMWL, indicating that atmospheric precipitation is the main source of the water supply. The hydrogen and oxygen isotopes of the Ng and Jxw thermal storage water shift toward the atmospheric waterline, resulting in oxygen drift, indicating that the source of the geothermal water supply is not directly supplied by local atmospheric precipitation and may have been supplied from a distance through long-term underground lateral flow [48]. It can be seen from the graph that the oxygen drift of the Jxw thermal storage is more pronounced than that of the Ng thermal storage. This is due to the higher recharge elevation of the deep Jxw thermal storage, which is supplied laterally from the distant high mountains, while the Ng thermal storage is supplied in the lower elevation piedmont plain. The d values of the Ng thermal storage in the study area are significantly lower than those of the Jxw thermal storage, indicating that the Jxw geothermal water has a slower runoff rate, longer retention time in the aquifer, and stronger water–rock reaction.

5.1.5. Elevation of Geothermal Water Supply

Liu et al. [49] found that as water vapor rises and cools, the δ18O and δD values decrease as the elevation increases. Therefore, the elevation of the geothermal water supply can be calculated from the hydrogen and oxygen isotopes of atmospheric precipitation, and the location of the geothermal water supply area can be inferred. The formula for calculating the supply elevation is as follows:
H = δ G δ P K + h
where H is the elevation of the geothermal water supply area (m); δG is the δ18O or δD value of the geothermal water sample (‰); δP refers to δ18O or δD value of the atmospheric precipitation (‰); K is the δ18O or δD elevation gradient of the atmospheric precipitation (‰/100 m); and H is the elevation of the sampling point (m).
One atmospheric precipitation sample was collected in the research area and the test results were obtained. The δD value is −55‰, and the δ18O value is −8.5‰. Due to the enrichment of 18O in the geothermal water, oxygen drift is more severe. The elevation error of the δ18O calculation for replenishment is relatively large, so δD was selected for the calculation of the atmospheric precipitation. The elevation gradient K of δD is taken as −2‰/100 m [50]. According to the formula, the elevation of the geothermal water supply area in the study area was calculated (Table 5). The geothermal water supply elevation is 763–1063 m, which is consistent with the elevation of the Taihang Mountains in the western part of the Jizhong Depression. It is speculated that the geothermal water in the study area is mainly supplied by precipitation in the mountainous areas of the western Taihang Mountains.

5.2. Deep Thermal Cycling Process

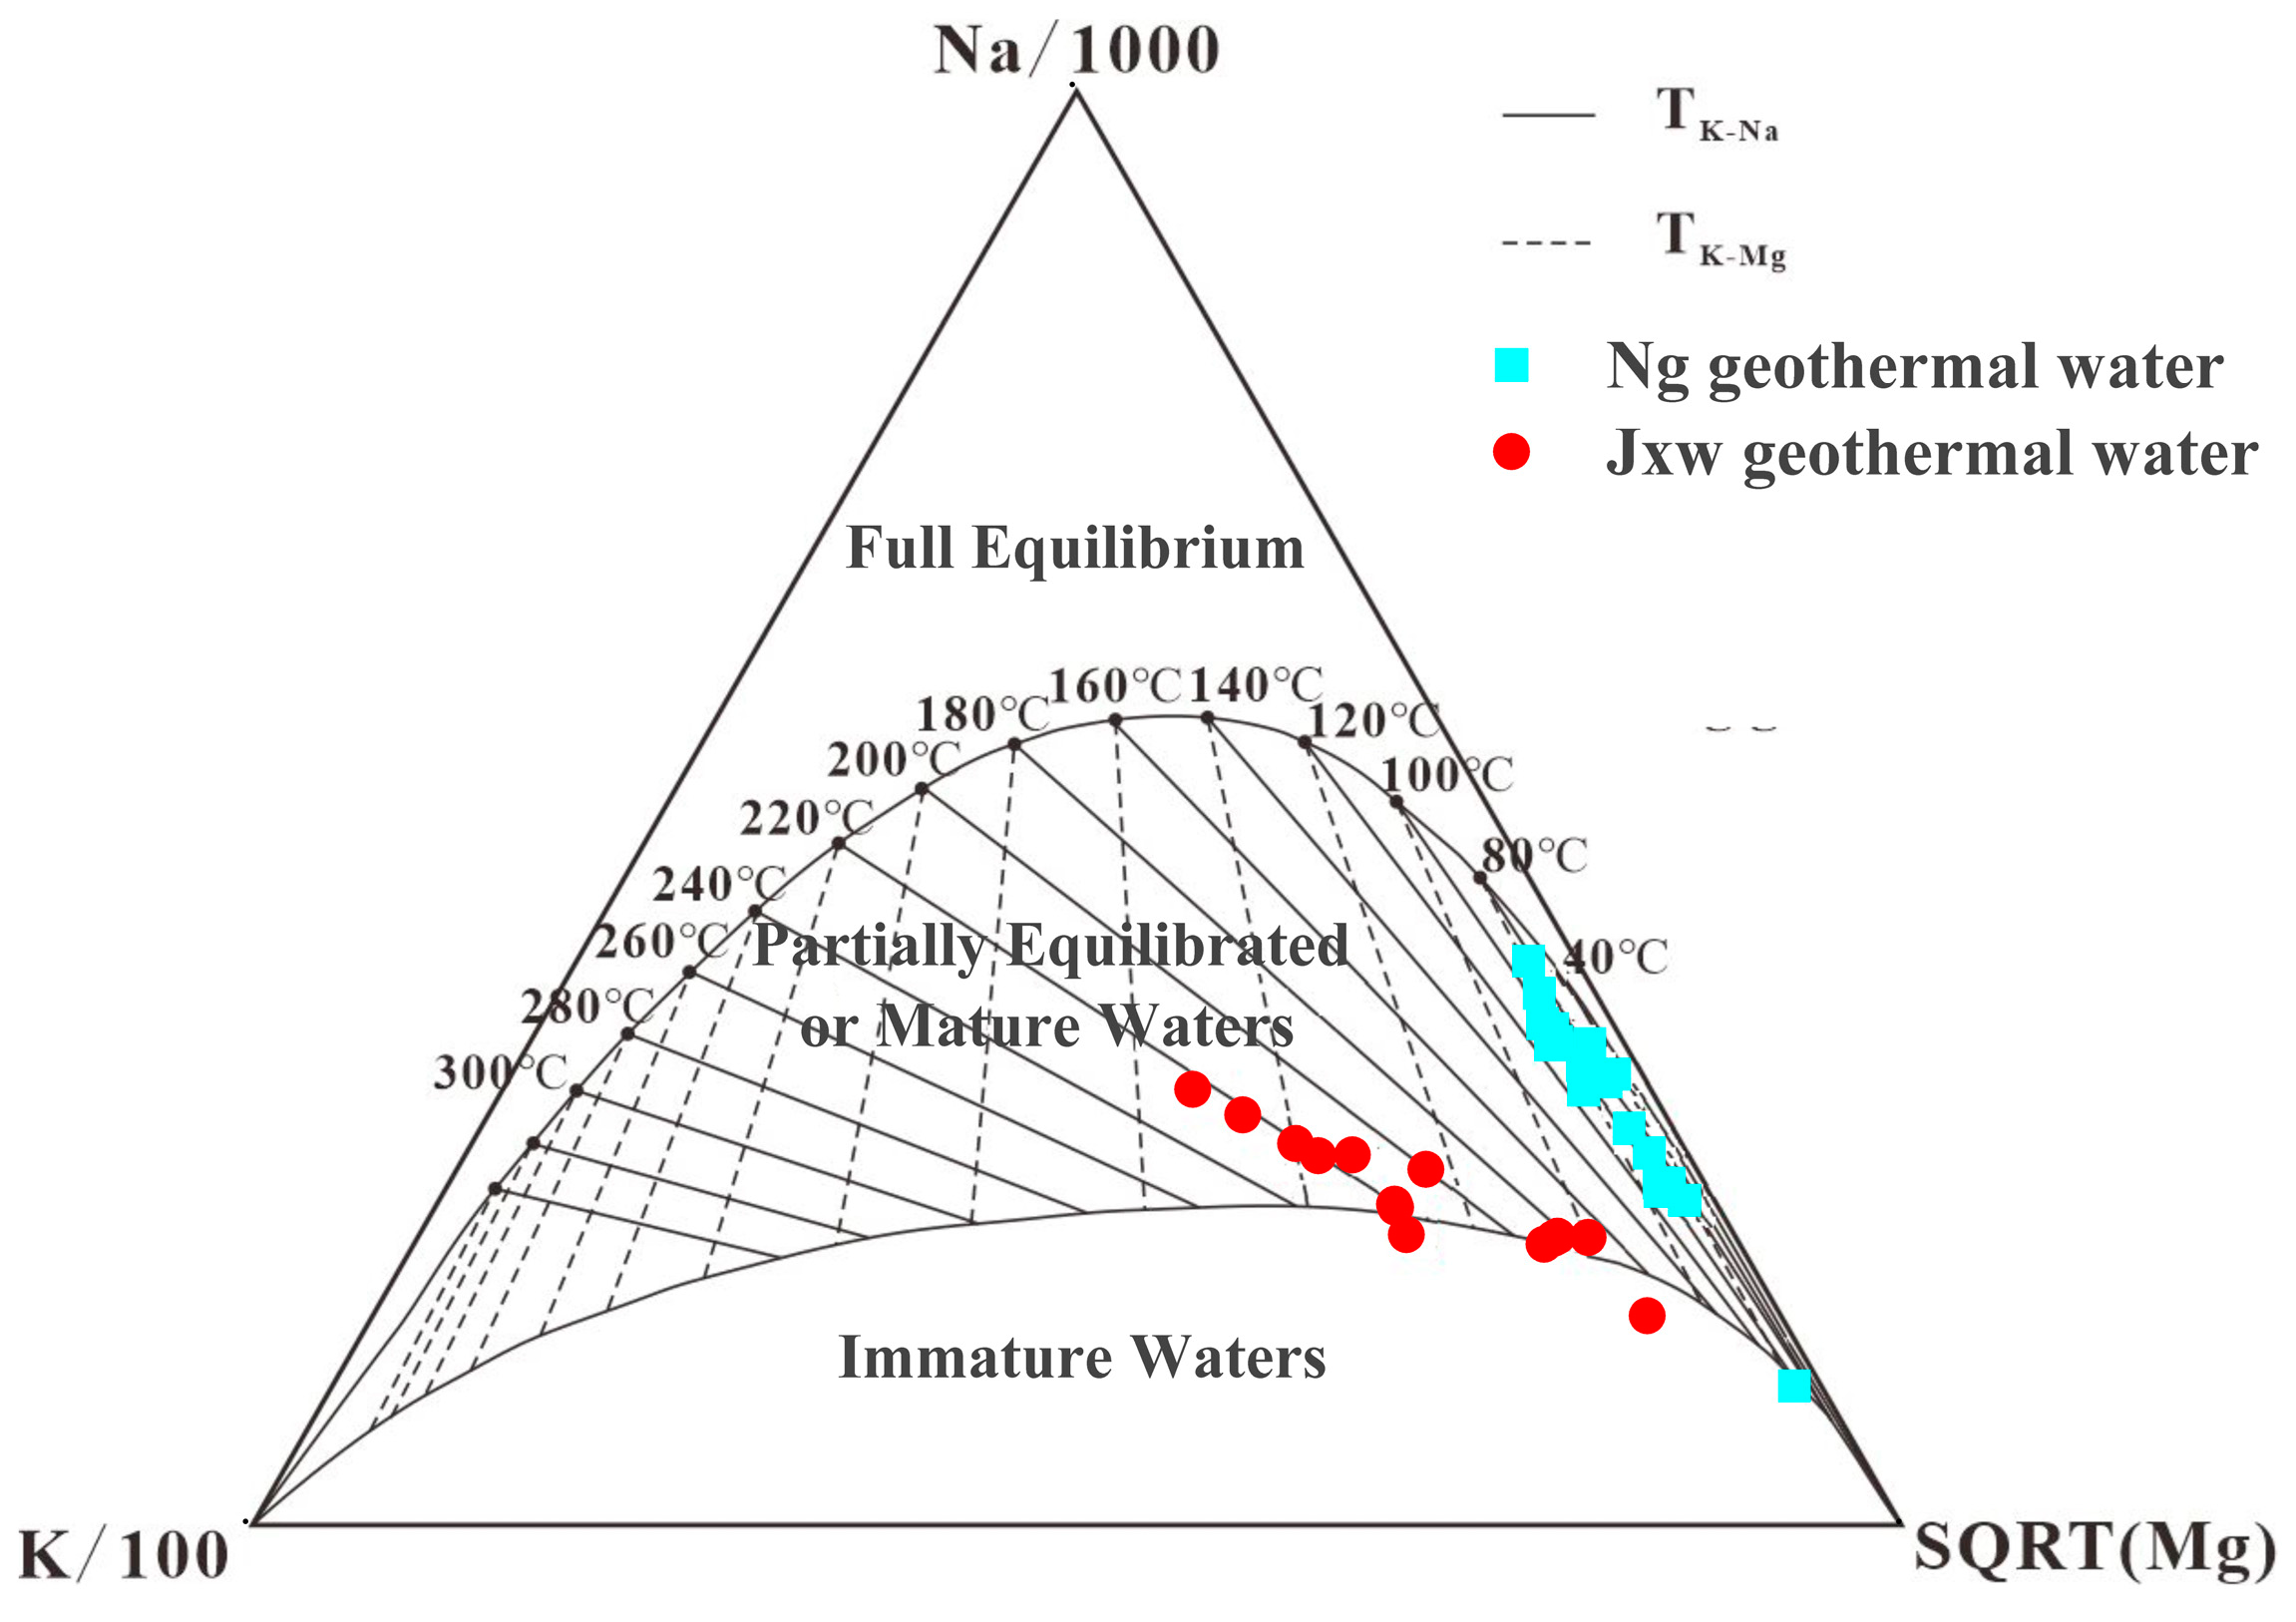
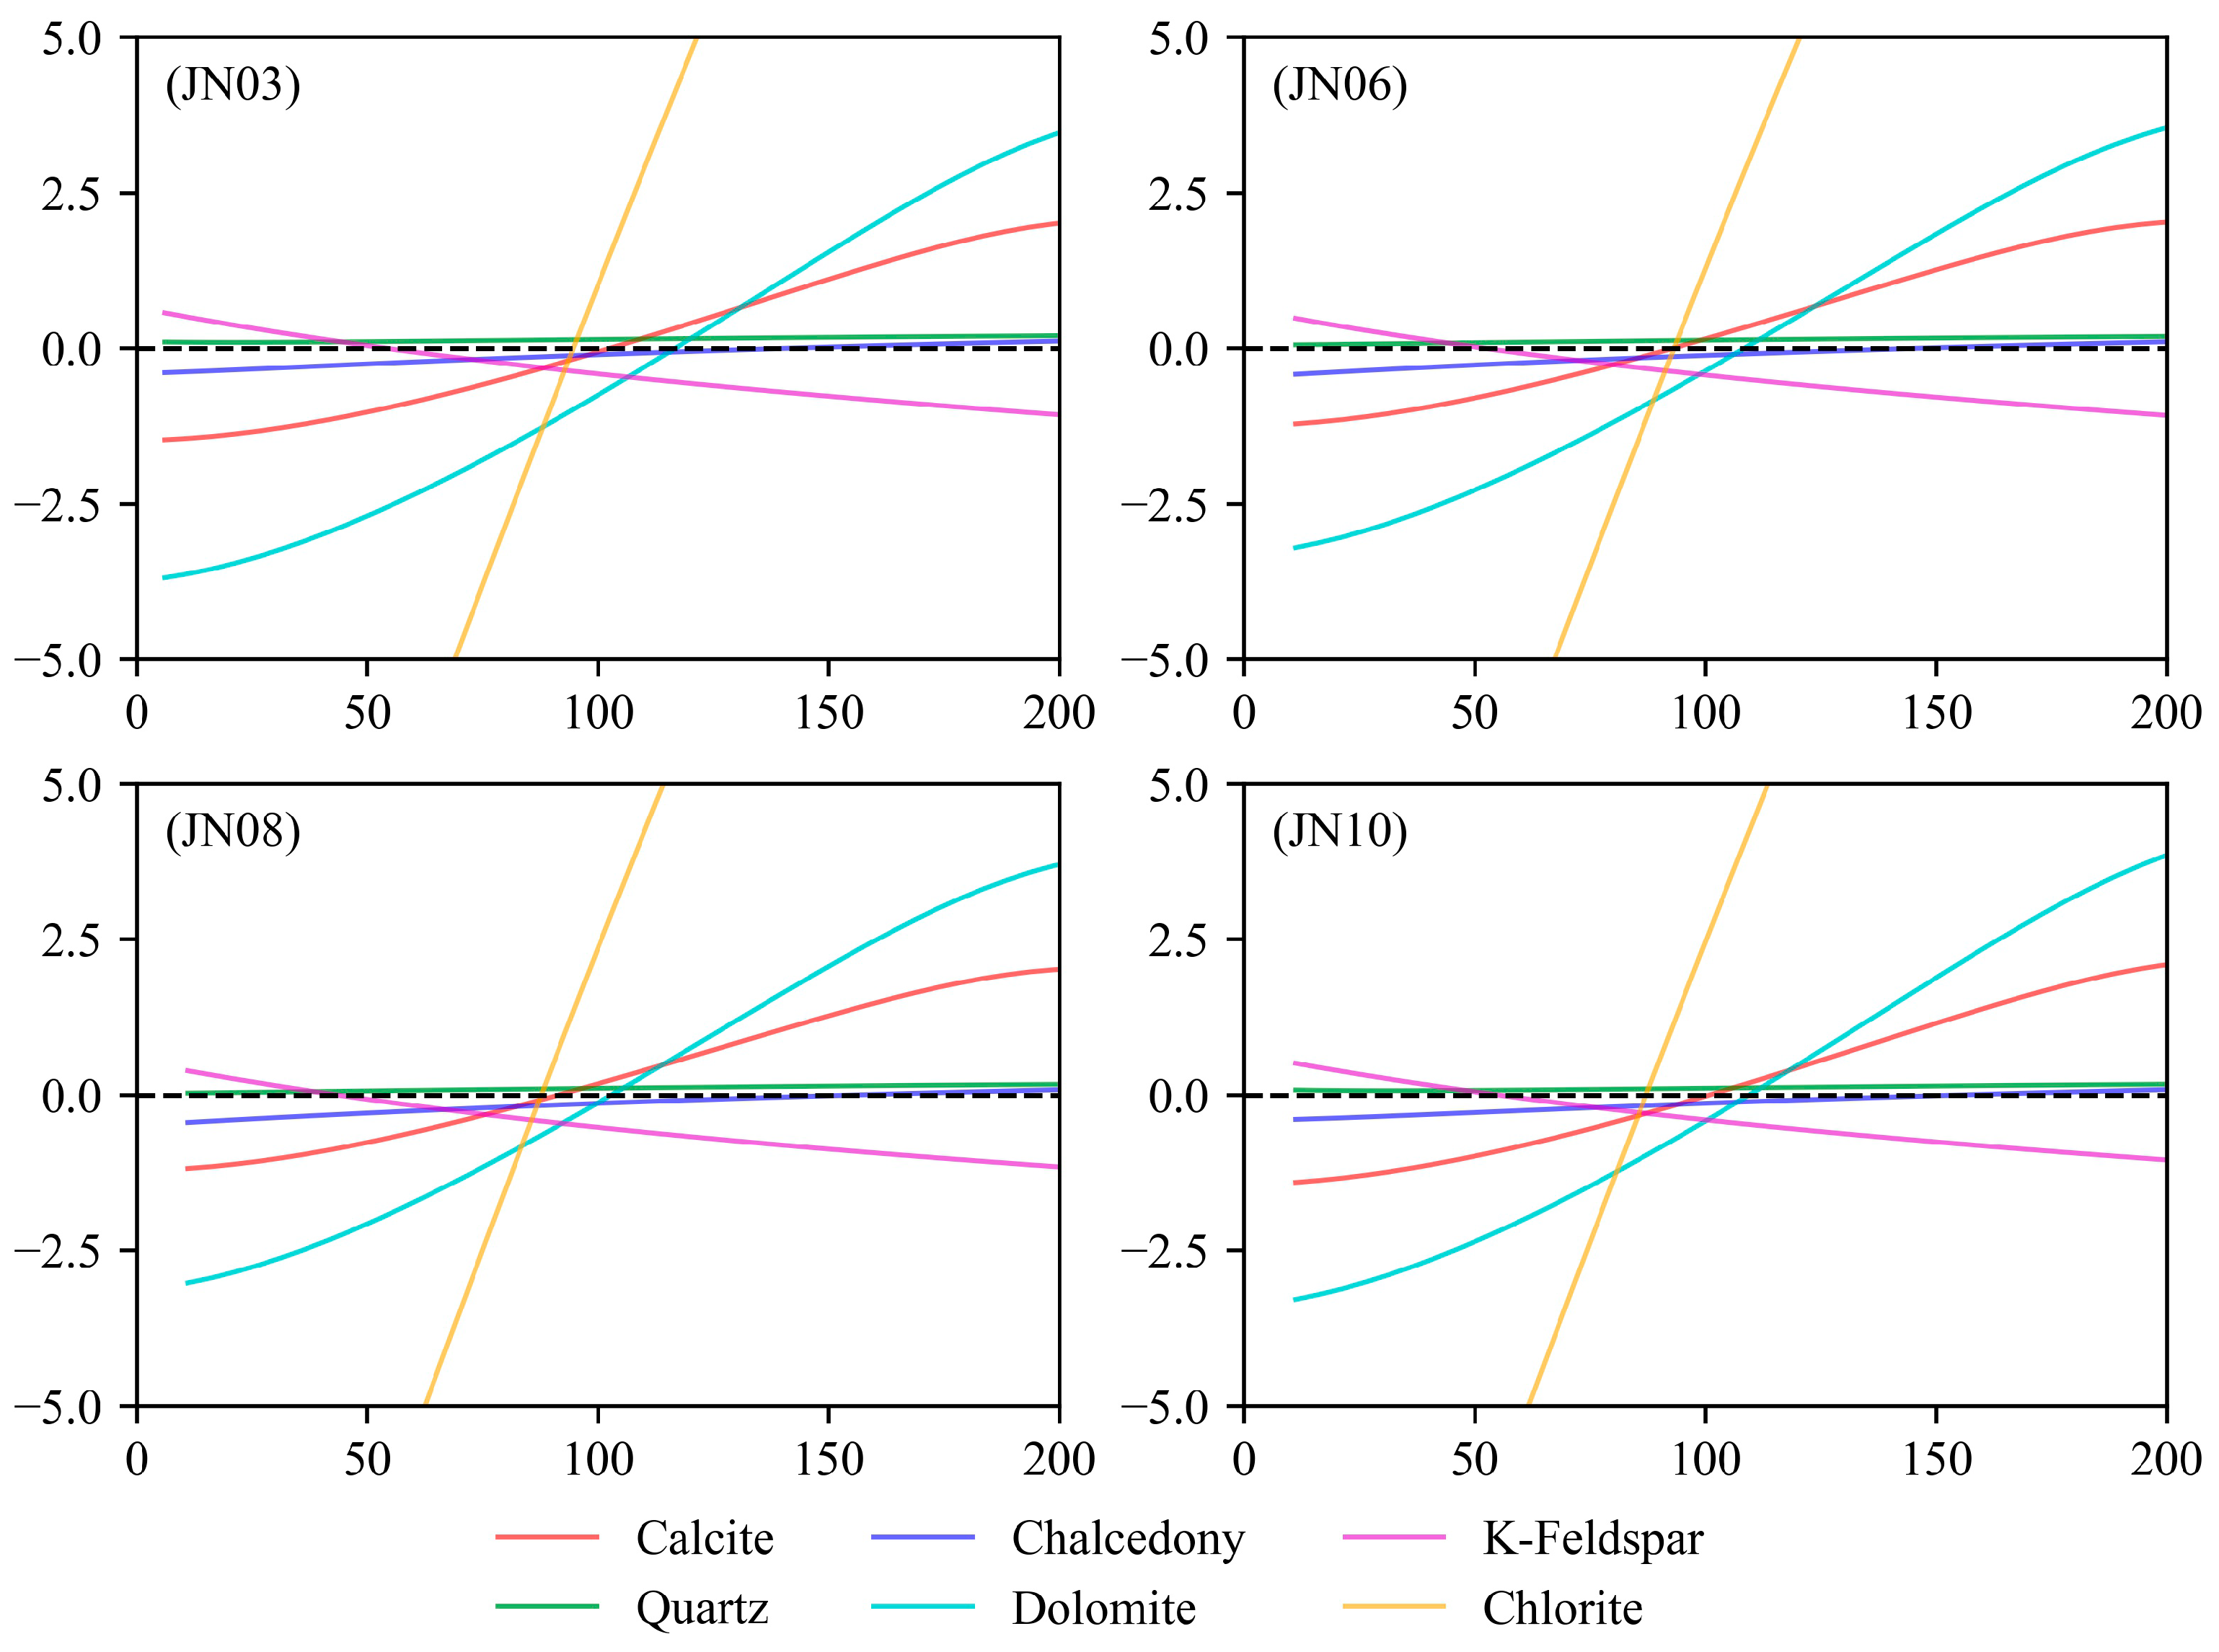
5.2.1. Deep Thermal Storage Water–Rock Equilibrium State

According to the distribution of the water sample points on the Na-K-Mg ternary diagram (Figure 6), the geothermal water samples in the study area all plot in the partially balanced and mixed water fields, and the water–rock interaction has not reached complete equilibrium. The reason for this is that cold water enters the thermal reservoir, and after mixing with the hot water, the water–rock interaction has not reached equilibrium. The Ng geothermal water samples plot near the full equilibrium waterline, and the cation temperature scales can be used to calculate the thermal storage temperature.
Due to the lack of accurate aluminum content data for water quality analysis, in this article, the fixed aluminum method was used to calculate the mineral saturation index [51]. A Ng thermal water storage sample that tended to balance water and rock was selected from each of the four structural units in the study area (Figure 10): the Baoding depression (JN03), Gaoyang low uplift (JN06), Lixian slope (JN08), and Raoyang depression (JN10). Common minerals such as calcite, quartz, chalcedony, dolomite, potassium feldspar, and chlorite in the study area were selected [30]. PHREEQC software (Version 3.7.3) was used to simulate the saturation index of each mineral in the geothermal system at 0–200 °C. The temperature was plotted as the abscissa, and the saturation index (SI) was plotted as the ordinate. The relationship between the saturation index and temperature is shown in Figure 8. On the SI-T diagram, multiple mineral lines intersect with SI = 0, which is the predicted deep temperature value. Based on this method, the study area samples were predicted. The results are presented in Table 2. The Ng thermal storage temperature predicted using the multi-mineral equilibrium method is 71–99 °C, and the Jxw thermal storage temperature is 110–153 °C.

5.2.2. Thermal Storage Temperature

By using various geothermal temperature scales to calculate the thermal storage temperatures of the sample points, it was found that when different temperature scales were applied to the same sample point, different thermal storage temperatures were obtained. The calculation of the thermal storage temperature based on each temperature scale and the actual temperature error value was carried out (Table 6). Based on the comparison diagram of the measured temperature and estimated temperature (Figure 11), it can be seen that the Na-K-Ca temperature scale and the multi-mineral equilibrium method yield overall temperature estimates that are the closest to the measured temperature. The average errors for these methods are 21.44 °C and 32.64 °C, respectively. The K-Mg temperature scale, quartz temperature scale, Na-K temperature scale, and chalcedony temperature scale yield results that are relatively close to the actual temperature for the Ng thermal storage, but there is a significant deviation in estimating the Jxw thermal storage temperature. The average error in calculating the thermal storage temperature using the Ca-Mg temperature scale is 312.32 °C, which is larger than the measured temperature of the thermal storage in the study area, indicating that the scale is not applicable to the study area. Based on Table 6 and Figure 11, the Na-K-Ca temperature scale and multi-mineral equilibrium method have relatively small errors and are suitable for the southern region of the Jizhong Depression. However, when applied to geothermal development, some points still have significant errors. Further condition analysis of the temperature scale is needed to identify the appropriate methods to reduce the differences and provide a reliable reference basis for geothermal development.

5.2.3. Thermal Cycle Depth

The North China Plain, where the Jizhong Depression is located, is a typical sedimentary basin-type geothermal resource area. The temperature of the geothermal water is positively correlated with the depth of the thermal storage cycle. The formula is as follows [52]:
H = t 1 t 2 I + h
where H is the depth of the thermal cycling (m); t1 is the thermal storage temperature (°C); t2 is the local annual average temperature (°C); I is the ground temperature gradient (°C/100 m); and h is the thickness of the constant temperature zone (m).
The average depth of the constant temperature zone in the research area is 25 m, the annual average temperature is 14.5 °C, and the geothermal gradient is 2.9 °C/100 m [26]. The calculation results of the K-Mg temperature scale presented in Table 2 were selected as the thermal storage temperature. The depth of the Jxw thermal storage cycle in the research area was calculated to be 3033–5187 m, with an average depth of 4268 m. The depth of the Ng thermal storage cycle was calculated to be 1360–2862 m, with an average depth of 2306 m.

5.3. Conceptual Circulation of the Thermal Waters

(1)
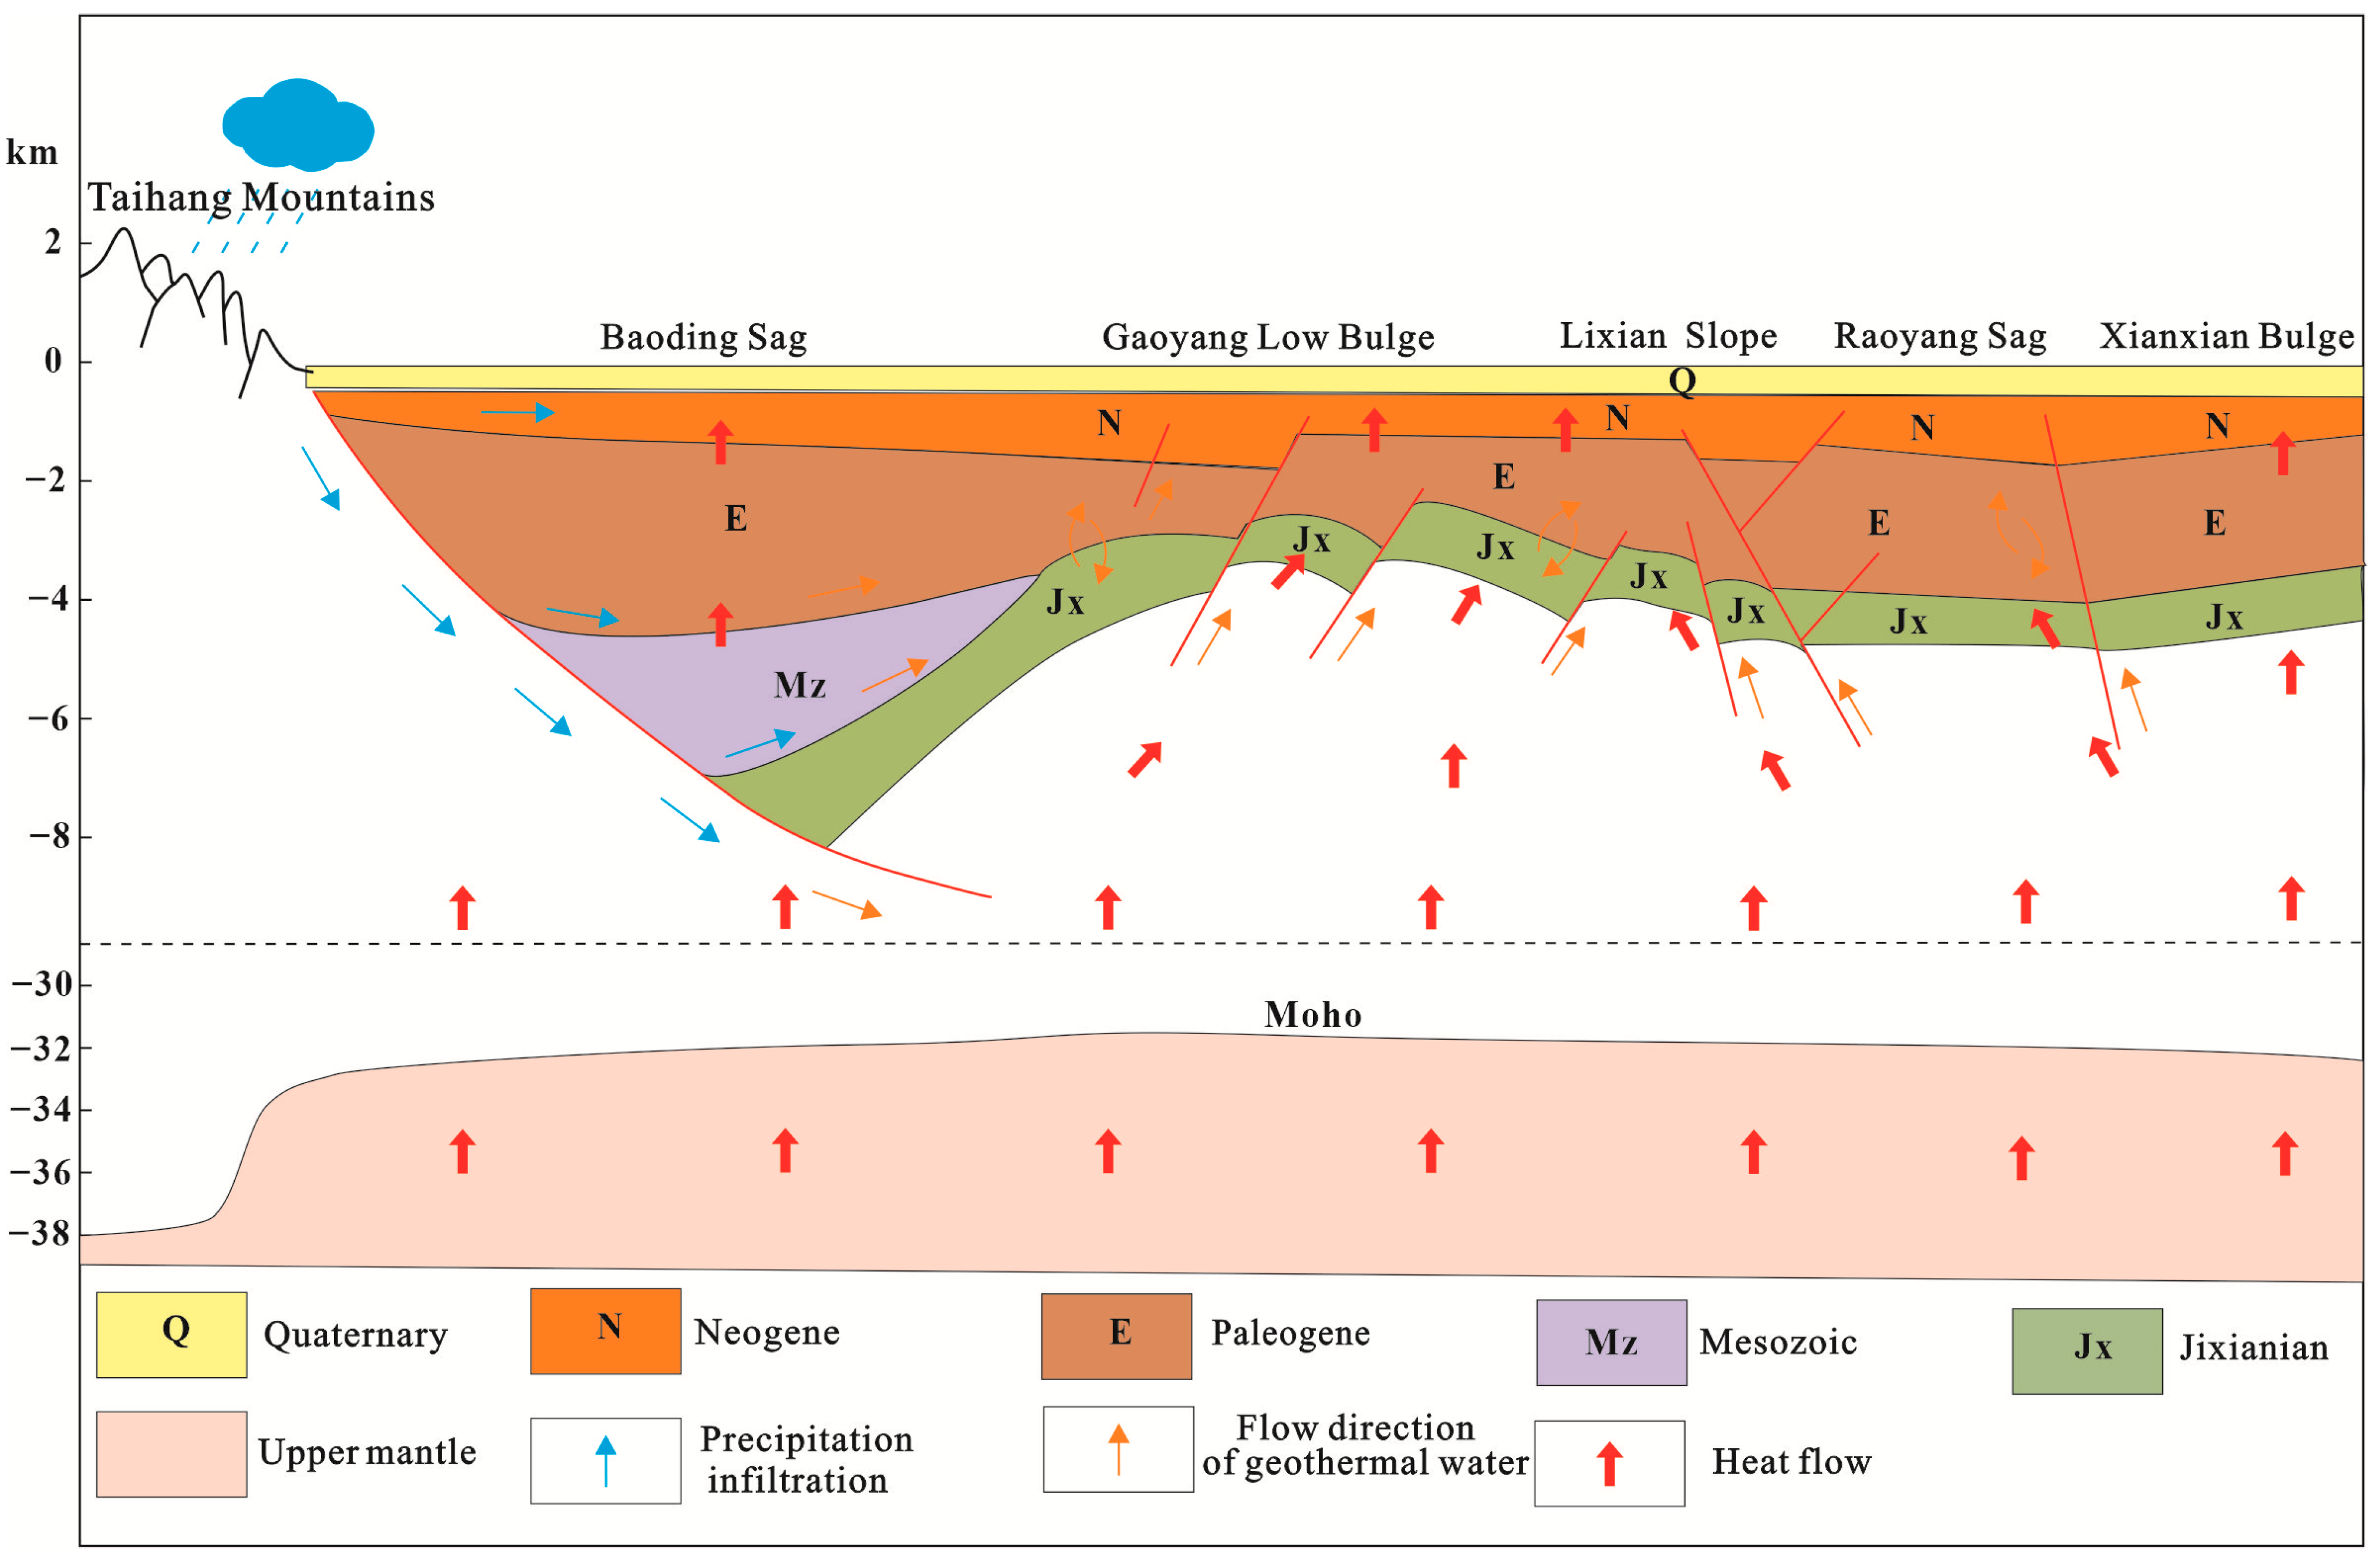
Heat source: The destruction of the North China Craton causes thinning of the lithosphere and uplift of the Moho surface at the bottom of the depression, which is more conducive to the conduction of deep heat.
(2)
Thermal reservoirs: The research area contains multiple layers of high permeability thermal reservoirs in the Neogene Guantao Formation (Ng), while in the hidden bedrock uplift area, there are underlying thermal reservoirs in the Middle Neoproterozoic Jixian Wumishan Formation (Jxw), which contain abundant geothermal resources.
(3)
Channel: The structural pattern of the alternating concavity and convexity in the research area has formed large and deep faults, and the widely developed fractures in the deep carbonate thermal reservoirs provide good channels for the migration of groundwater and thermal conduction.
(4)
Cover layer: The thermal reservoir in the southern part of the Jizhong Depression is covered by a Neogene-Paleogene sandstone layer, which has a low thermal conductivity. The upper part is covered by the Quaternary system, and the lithology is mainly composed of clay and sand layers, which have a poor thermal conductivity. Therefore, the thermal insulation effect is significant. The research area is covered with a double insulation layer, which makes the heat of the thermal reservoir less likely to dissipate and provides a good insulation effect for the heat in the thermal reservoir.
The geothermal genesis model of the study area is as follows. The atmospheric precipitation in the Taihang Mountains infiltrates and migrates along the deep faults in front of the mountain. The thermal reservoir water is supplied laterally from northwest to southeast. After a long and slow flow process, it undergoes water–rock interaction with the surrounding rock, making the chemical composition of the thermal storage water complex. Due to the shallow Moho surface in the study area, the thermal flow in the rock and the radioactive heat generated in the rock continuously heat the groundwater, resulting in local thermal convection. The water temperature gradually increases as it flows through the rock, forming deep thermal storage resources. Under the influence of multiple tectonic activities, the large and deep faults formed in the area provide good water channels, and the hot water flows along the fault channels and transfers some of the heat upwards via convection, forming shallow geothermal resources. The overlying Neogene sandstone and Quaternary cover layer in the area have a low thermal conductivity, forming a good insulation cover layer and ultimately allowing for the development of a good geothermal resource area (Figure 12).

6. Conclusions

(1)
According to the geochemical and isotopic analyses of geothermal water samples from the study area, the hydrochemical types of the geothermal fluids in the sandstone thermal storage are mainly the Cl·HCO3Na type, while the geothermal fluids in the carbonate rock thermal storage are mainly the Cl-Na type and Cl·HCO3Na type. The content of the main ions (Na+, K+, and Cl) in the water samples from the Jxw thermal storage is greater than that in the Ng thermal storage. The reason for this is that the Jxw thermal storage has a longer water cycle path, it experiences more complete leaching and filtration, and a large amount of soluble substances in the surrounding rock enter the hot water. According to the ion ratios, the components of the geothermal water are mainly controlled by dissolution and cation adsorption of the carbonate rocks. According to the calculated characteristic coefficients, the geological environment where the Jxw thermal storage is located is more enclosed than that of the Ng thermal storage, with a longer flow path, slower water circulation, and higher salinity.
(2)
By analyzing the hydrogen and oxygen isotope compositions of the thermal storage water in the study area, it was found that the main source of the Ng thermal storage water and shallow groundwater is atmospheric precipitation. The Jxw thermal storage water undergoes a more rightward oxygen drift compared to the Ng thermal storage water. This is due to the higher elevation of the deep Jxw thermal storage, which is recharged laterally from the distant high mountains, while the Ng thermal storage is recharged in a small amount in the lower altitude piedmont plain. The elevation of the geothermal water supply area in the research area is 763–1063 m, which is consistent with the elevation of the Taihang Mountains in the western part of the Jizhong Depression. It is speculated that the geothermal water is mainly supplied by precipitation in the mountainous areas of the western Taihang Mountains.
(3)
The measured temperature of the Ng thermal storage in the research area is 69.2–88 °C, and the measured temperature of the Jxw thermal storage is 82–100 °C. The Na-K-Ca temperature scale and the multi-mineral equilibrium method have relatively small errors and are suitable for the southern region of the Jizhong Depression, with average errors of 21.44 °C and 32.64 °C, respectively. The depth of the Jxw thermal storage cycle in the research area is 3033–5187 m, and the depth of the Ng thermal storage cycle is 1360–2862 m. The geothermal water sample is in partial equilibrium or is mixed water due to the entry of cold water into the thermal reservoir, and the water–rock interaction does not reach equilibrium after mixing with the hot water.
(4)
The geothermal genesis model for the study area is as follows. The precipitation in the Taihang Mountains infiltrates via faults and is supplied laterally from northwest to southeast. During the long-term runoff process, the groundwater undergoes water–rock reactions and changes in hydrochemical type and is continuously heated by the deep heat flow and radioactive heat from the rocks to form geothermal water. Some of the geothermal water forms thermal convection locally, while the rest is transferred upwards along the fault channel. Heat accumulation occurs in the structural bulge area, resulting in the formation of a convection–conduction-type geothermal system.
(5)
The bedrock thermal storage in the study area is widely distributed and has a great resource potential. Karst fissures are relatively well developed, but there are problems such as strong sealing of the geothermal water and long supply cycles. It is difficult to meet large-scale development needs by relying on natural supply. Therefore, the characteristics of the reservoir fissure development should be utilized, and artificial recharge should be conducted to achieve sustainable utilization of the thermal resources in this area.

Author Contributions

Conceptualization, L.W. and L.X.; methodology, W.L. and W.Z.; formal analysis, L.W.; investigation, L.W. and Z.Z.; resources, L.W. and T.Z.; data curation, L.W. and J.Z.; writing—review and editing, L.W.; supervision, L.X.; funding acquisition, L.X. All authors have read and agreed to the published version of the manuscript.

Funding

This research was funded by National Key R&D Projects of China, grant number 2021YFB1507300, subject number 2021YFB1507304, and the Geological Survey Project of China, grant numbers DD20190555, DD20221676.

Data Availability Statement

The datasets used and analyzed during the current study are available from the corresponding authors upon reasonable request.

Acknowledgments

The authors are supported by the China Geological Survey. We also thank the two anonymous reviewers for their thoughtful comments.

Conflicts of Interest

The authors declare no conflict of interest.

References

  1. Fagundo-Castillo, J.R.; Carrillo-Rivera, J.J.; Antigüedad-Auzmendi, I.; González-Hernández, P.; Peláez-Díaz, R.; Hernández-Díaz, R.; Cáceres-Govea, D.; Hernández-Santana, J.R.; Suárez-Muñoz, M.; Melián-Rodríguez, C.; et al. Chemical and Geological Control of Spring Water in Eastern Guaniguanico Mountain Range, Pinar Del Rìo, Cuba. Environ. Geol. 2008, 55, 247–267. [Google Scholar] [CrossRef]
  2. Mongillo, M.A.; Axelsson, G. Preface to Geothermics Special Issue on Sustainable Geothermal Utilization. Geothermics 2010, 39, 279–282. [Google Scholar] [CrossRef]
  3. Axelsson, G.; Gunnlaugsson, E.; Jonasson, T.; Olafasson, M. Low-Temperature Geothermal Utilization in Iceland-Decades of Experience. Geothermics 2010, 39, 329–338. [Google Scholar] [CrossRef]
  4. Gude, V.G. Geothermal Source Potential for Water Desalination—Current Status and Future Perspective. Renew. Sustain. Energy Rev. 2016, 57, 1038–1065. [Google Scholar] [CrossRef]
  5. Najafi, G.; Ghobadian, B. Geothermal Resources in Iran: The Sustainable Future. Renew. Sustain. Energy Rev. 2011, 15, 3946–3951. [Google Scholar] [CrossRef]
  6. Wang, G.L.; Lin, W.J. Main Hydro- Geothermal Systems and Their Genetic Models in China. Acta Geol. Sin. 2020, 94, 1923–1937. [Google Scholar] [CrossRef]
  7. Zhang, W.; Wang, G.L.; Liu, F.; Xing, L.X.; Li, M. Characteristics of Geothermal Resources in Sedimentary Basins. Geol. China 2019, 46, 255–268. [Google Scholar]
  8. Prada, S.; Cruz, J.V.; Figueira, C. Using Stable Isotopes to Characterize Groundwater Recharge Sources in the Volcanic Island of Madeira, Portugal. J. Hydrol. 2016, 536, 409–425. [Google Scholar] [CrossRef]
  9. Négrel, P.; Petelet-Giraud, E.; Millot, R. Tracing Water Cycle in Regulated Basin Using Stable δ18O–δ2H Isotopes: The Ebro River Basin (Spain). Chem. Geol. 2016, 422, 71–81. [Google Scholar] [CrossRef]
  10. Belhai, M.; Fujimitsu, Y.; Barragán, R.M.; Iwanaga, T.; Haouchine, A. Insights into Geochemical Characteristics of the Geothermal Fluids of Northwestern Algeria: An Updated Conceptual Model. Geothermics 2022, 99, 102304. [Google Scholar] [CrossRef]
  11. Ellis, A.J. Quantitative Interpretation of Chemical Characteristics of Hydrothermal Systems. Geothermics 1970, 2, 516–527. [Google Scholar] [CrossRef]
  12. Truesdell, A.H.; Nathenson, M.; Rye, R.O. The Effects of Subsurface Boiling and Dilution on the Isotopic Compositions of Yellowstone Thermal Waters. Geophys. Res. Part B Solid Earth 1977, 82, 3694–3704. [Google Scholar] [CrossRef]
  13. Armannsson, H. The Fluid Geochemistry of Icelandic High Temperature Geothermal Areas. Appl. Geochem. 2016, 66, 4–64. [Google Scholar] [CrossRef]
  14. Procesi, M.; Marini, L.; Cinti, D.; Sciarra, A.; Basile, P.; Mazzoni, T.; Zarlenga, F. Preliminary Fluid Geochemical Survey in Tete Province and Prospective Development of Geothermics in Mozambique. Geotherm. Energy 2022, 10, 2. [Google Scholar] [CrossRef]
  15. Pang, J.N.; Zhong, H.; Lv, M.; Tian, J.; Kong, Y.L. Geochemical and Isotopic Characteristics of Fluids in the Niutuozhen Geothermal Field, North China. Environ. Earth Sci. 2018, 77, 12. [Google Scholar] [CrossRef]
  16. Zhao, J.Y.; Zhang, W.; Ma, F.; Zhu, X.; Zhang, H.X.; Wang, G.L. Geothermal Fluid Chemistry Characteristics of Rongcheng Geothermal Field in Xiong’an New Area. Acta Geol. Sin. 2020, 94, 1991–2001. [Google Scholar]
  17. Xing, Y.F.; Wang, H.Q.; Li, j.; Teng, Y.G.; Zhang, B.J.; Li, y.y.; Wang, G.L. Analysis of the Chemical Field Characteristics and Influencing Factors of Geothermal Water in Xiong’an New Area. Geol. China 2022, 49, 1711–1722. [Google Scholar]
  18. Zhang, H.X.; Wang, G.L.; Zhang, W.; Ma, F.; Zhu, X.; Yue, G.F. Characteristics of the Rongcheng Bulge Geothermal Field and the Evolution of Geothermal Fluids, Xiong’an New Area, China. Water 2022, 14, 2468. [Google Scholar] [CrossRef]
  19. Deng, J.Z. Chemical Characteristics and Genesis of Thermal Water Storage in Carbonate Rocks in the Northern Part of the Jizhong Depression; East China University of Science and Technology: Shanghai, China, 2022. [Google Scholar]
  20. Zhao, Z.R.; Zhang, W.; Wang, G.L.; Xing, L.X.; Zhang, H.X.; Zhao, J.Y. Hydrogeochemical Characteristics of Gaoyang Geothermal Field in the Jizhong Depression and Their Constraints on Geothermal Genesis. Geol. China 2023, 11, 1167. [Google Scholar]
  21. Liang, S.J. The Geological Structural Characteristics and Oil and Gas Occurrence of the Late Cenozoic in the Jizhong Depression; Northwest University: Kirkland, WA, USA, 2001. [Google Scholar]
  22. Zuo, Y.H.; Qiu, N.S.; Chang, J.; Hao, Q.Q.; Li, Z.X.; Li, J.W.; Li, W.Z.; Xie, C.H. Thermal Structure of Mesozoic and Cenozoic Lithosphere in Bohai Bay Basin. Acta Geol. Sin. 2013, 87, 145–153. [Google Scholar]
  23. Wu, Z.P.; Hou, X.B.; Li, W. Discussion on Mesozoic Basin Pattern and Evolution Process in Eastern North China. Tecton Miner. 2007, 4, 385–399. [Google Scholar]
  24. Zhang, W.C.; Yang, D.X.; Chen, Y.J.; Qian, Z.; Zhang, C.W.; Liu, H.F. Characteristics of Paleogene Sedimentary structures and distribution of oil and gas in Jizhong Depression. Acta Geol. Sin. 2008, 82, 1103–1112. [Google Scholar]
  25. Chang, J.; Qiu, N.; Zhao, X.; Xu, w.; Xu, Q.; Jin, F.; Han, C.; Ma, X.; Dong, X.; Liang, X. Present-Day Geothermal Regime of the Jizhong Depression in Bohai Bay Basin, East China. Chin. Geophys 2016, 59, 14. [Google Scholar]
  26. Song, J.J.; Wang, G.L.; Xing, L.X.; Lu, C.; Qian, J.Z. Influence of Rock Thermal Conductivity Correction on the Calculated Value of Terrestrial Heat Flow—A Case Study of Jizhong Depression, Bohai Bay Basin. Geol. Rev. 2023, 69, 1349–1364. [Google Scholar]
  27. GB 8538-2016; National Food Safety Standard Methods for Examination of Drinking Natural Mineral Water. Standards Press of China: Beiing, China, 2017. (In Chinese)
  28. GB/T 5750-2006; Standard Examination Methods for Drinking Water. Standards Press of China: Beiing, China, 2007. (In Chinese)
  29. DZ/T 0064-1993; Analysis Method of Groundwater Uality. Standards Press of China: Beiing, China, 1994. (In Chinese)
  30. Giggenbach, W.F. Geothermal Solute Equilibria. Derivation of Na-K-Mg-Ca Geoindicators. Geochim. Cosmochim. Acta 1988, 52, 2749–2765. [Google Scholar] [CrossRef]
  31. Fournier, R.O. A Revised Equation for the Na/K Geothermometer. Trans. Geotherm. Resour. Counc. 1979, 3, 221–224. [Google Scholar]
  32. Fournier, R.O.; Truesdell, A.H. An Empirical Na-K-Ca Geothermometer for Natural Waters. Geochim. Cosmochim. Acta 1973, 37, 1255–1275. [Google Scholar] [CrossRef]
  33. Chiodini, G.; Frondini, F. Theoretical Geothermometers and PCOzindicators for Aqueous Solutions Coming from Hydrothermal Systems of Medium-Low Temperature Hosted in Carbonate-Evaporite Rocks. Application to the Thermal Springs of the Etruscan Swell, Italy. Appl. Geochem. 1995, 10, 337–346. [Google Scholar] [CrossRef]
  34. Li, Y.M.; Pang, Z.H.; Luo, Q.; Chen, K. Applicability Analysis of Boiling Correction Method for SiO2 Ground Thermometer in Plateau Areas. Geol. Rev. 2021, 67, 1050–1056. [Google Scholar]
  35. Fournier, R.O. Chemical Geothermometers and Mixing Models for Geothermal Systems. Geothermics 1977, 5, 41–50. [Google Scholar] [CrossRef]
  36. Lin, W.J.; Chen, X.Y.; Gan, H.N.; Yue, G.F. Geothermal Geological Characteristics and Exploration Direction of Dry Hot Rocks in the Xiamen Bay Zhangzhou Basin along the Southeast Coast. Acta Geol. Sin. 2020, 94, 2066–2077. [Google Scholar]
  37. Chen, M.X. Review and Prospect on Geothermal Studies in China. Acta Geophys. Sin. 1994, 37, 19. [Google Scholar]
  38. Wang, D.C. Fundamentals of Hydrogeology; Geological Publishing Co.: Beijing, China, 1986. [Google Scholar]
  39. Apollaro, C.; Vespasiano, G.; De Rosa, R.; Marini, L. Use of Mean Residence Time and Flowrate of Thermal Waters to Evaluate the Volume of Reservoir Water Contributing to the Natural Discharge and the Related Geothermal Reservoir Volume. Geothermics 2015, 58, 62–74. [Google Scholar] [CrossRef]
  40. Yuan, J.F. Transport of Boron in the Aquatic Environment of the Yangbajing Geothermal Field, Tibet; China University of Geosciences: Beijing, China, 2010. [Google Scholar]
  41. Du, Y.Q.; Zhu, G.Y.; Ruan, Z.; Cao, Y.H.; Shen, Z.H.; Chang, Q.H.; Chen, G.P.; Yu, B.S. Hydrochemical Characteristics, Genesis and Simulation of Mineral Dissolution-Precipitation in Cambrian Strata of the Tabei Rise, Tarim Basin. Oil Gas Geol. 2022, 43, 11. [Google Scholar]
  42. Sun, H.Y.; Wei, X.F.; Gan, F.W.; Wang, H.; Jia, F.C.; He, Z.X.; Li, D.J.; Li, J.; Zhang, J. Genetic Types and Formation Mechanisms of Strontium Rich Groundwater in the Middle and Upper Reaches of the Luanhe River Basin. Acta Geosci. Sin. 2020, 41, 65–79. [Google Scholar]
  43. Li, J.; Zhou, S.Z.; Zhao, Y.; Zhao, R.K.; Dang, Z.W.; Pan, M.Q.; Zhu, D.N.; Zhou, C.S. Analysis of the Main Ion Characteristics and Genesis of Groundwater in Huixian Karst Wetland. Environ. Sci. 2021, 42, 1750–1760. [Google Scholar]
  44. Appelo, C.A.J.; Postma, D. Geochemistry, Groundwater and Pollution; CRC Press: Boca Raton, FL, USA, 2004. [Google Scholar]
  45. Yin, Z.Y.; Luo, Q.K.; Wu, J.F.; Xu, S.H.; Wu, J.C. Identification of the Long-Term Variations of Groundwater and Their Governing Factors Based on Hydrochemical and Isotopic Data in a River Basin. J. Hydrol. 2021, 592, 125604. [Google Scholar] [CrossRef]
  46. Craig, H. The Isotopic Geochemistry of Water and Carbon in Geothermal Area. In Nuclear Geology in Geothermal Areas, Spoleto; Tongiori, E., Ed.; Consiglio Nazionale delle Ricerche: Roma, Italy, 1963; pp. 17–53. [Google Scholar]
  47. Liu, K.; Liu, Y.C.; Sun, Y.; Liu, J.R.; Wang, S.F.; Liu, Z.M. Characteristics of Deuterium Excess Parameters of Geothermal Water in Beijing. Geol. China 2015, 42, 2029–2035. [Google Scholar] [CrossRef]
  48. Zhang, B.J.; Wang, S.Q.; Kang, F.G.; Wu, Y.Q.; Li, Y.Y.; Gao, J.; Yuan, W.Z.; Xing, Y.F. Heat Accumulation Mechanism of the Gaoyang Carbonatite Geothermal Field, Hebei Province, North China. Front. Earth Sci. 2022, 10, 858814. [Google Scholar] [CrossRef]
  49. Liu, J.R.; Song, X.F.; Yue, G.F.; Sun, X.M.; Liu, X.; Wang, S.Q. Characteristics of δ18O in Precipitation over Eastern Monsoon China and the Water Vapor Sources. Chin. Sci. Bull. 2009, 54, 3521–3531. [Google Scholar]
  50. Chen, Z.Y. Study on Groundwater Resources Evolution from Paleoenvironmental Information of Groundwater System in North China Plain; Jilin University: Changchun, China, 2001. [Google Scholar]
  51. Zhang, Z.S.; Sun, Z.X.; Li, M.G.; Wang, S.J. Application of Fixed Aluminum Log (Q/K) Diagram in Hot Springs. Earth Sci. 2004, 3, 352–356. [Google Scholar] [CrossRef]
  52. Zhang, W.; Wang, G.L.; Zhao, J.Y.; Liu, F. Geochemical Characteristics of Medium-High Temperature Geothermal Fluids in West Sichuan and Their Geological Implications. Geoscience 2021, 35, 188–198. [Google Scholar]
Figure 1. (a) Tectonic unit of the Bohai Bay Basin (Modified from Chang et al. [25]); (b) The structure unit division of Jizhong Depression (Modified from Chang et al. [25]); (c) Stratigraphic Profile of the Study Area (Modified from Song et al. [26]).
Water 15 03532 g001aWater 15 03532 g001b
Figure 2. (a) The PH box plot of water samples; (b) The TDS box plot of water samples.
Water 15 03532 g002
Figure 3. The Piper triangular diagram of water samples.
Water 15 03532 g003
Figure 4. TIS salinity diagram of water samples.
Water 15 03532 g004
Figure 5. The Schoeller diagram of water samples.
Water 15 03532 g005
Figure 6. The Na-K-Mg triangular diagram of water samples.
Water 15 03532 g006
Figure 7. The relationships between trace elements and chlorine concentration.
Water 15 03532 g007
Figure 8. (a) Plots of γNa+/γCl of the water samples; (b) Plots of γ(Ca2+ + Mg2+)/γ(HCO3 + SO42−) of the water samples; (c) Plots of γ(SO42− + Cl)/γHCO3 of the water samples; (d) Plots of CAI-1/CAI-2 of the water samples.
Water 15 03532 g008
Figure 9. δD-δ18O plot for water samples.
Water 15 03532 g009
Figure 10. SI-T diagram for geothermal water.
Water 15 03532 g010
Figure 11. Comparison of measured temperature and estimated temperatures.
Water 15 03532 g011
Figure 12. Genetic model for the geothermal water in the study area.
Water 15 03532 g012
Table 1. Main ion concentration (mg/L) of water samples.
Sample NO.StratigraphicT (°C)PhK+Na+Ca2+Mg2+ClSO42−HCO3TDSSr2+δDVSMOWδ18OVSMOWFH2SiO3HBO2
JN01Ng69.27.954.6445.19.370.83369.8102396.911830.536−74−9.71.7260.891.62
JN02Ng828.165.03416.98.830.61303.4124.2432.411350.346−74−9.32.3668.021.92
JN03Ng678.04441211.811.11368110.4325.811150.636−75−9.91.6952.621.12
JN04Ng46.18.162.74308.37.610.75206.194.28344.8834.60.3−76−10.31.5649.460.64
JN05Ng44.88.581.97242.95.710.6811691.4296.8661.10.116−76−10.21.3342.930.46
JN06Ng627.944.29463.66.70.57275108.1589.412090.28−74−9.43.1462.922.3
JN07Ng73.48.192.9359.64.970.62164.181.49527.2925.70.148−73−9.42.9956.111.26
JN08Ng688.124.29573.26.590.73524.118.06615.514870.259−73−8.93.3355.283.72
JN09Ng56.18.411.96370.55.110.64214.396.45438.3967.70.114−72−9.13.9243.991.76
JN10Ng48.28.145.83586.521.233.56667.7137.1271.915920.965−73−9.90.7937.290.92
JN11Ng52.98.175.89937.517.693.32122426.24421.824651.46−71−9.31.0438.52.77
JN12Ng728.74310.2419580.3510.11063.143.54/////
JN13Ng797.943.3192.918.43.385.148.9373.4753.634.11/////
JN14Ng808.42.9316.94.81147.573.5524.7111438.96/////
JN15Ng808.363.7319.76.41168.893.7478.41125.557.46/////
JN16Ng758.814.94017.20.5195.7113.1578.4135033.29/////
JN17Ng768.455.98441.76.740.69211.8132.8622.2149879.43/////
JN18Ng887.986.39473.48.221.08244.2135.6641.7158585.54/////
JN19Ng76.47.7812.61113825.084.2214538482.1319359.8/////
JJ01Jxw827.46149.3169188.5620.082387104.9838.251228.611−72−6.48.43179.190.26
JJ02Jxw81.67.53167189477.0515.092746112.3761.256779.714−71−5.98.42186104.2
JJ03Jxw66.87.03147.91857106.315.62675120.6906.3561810.74−73−6.46.58133.891.72
JJ04Jxw717.3437.19823.953.598.86996.292.81574.623983.091−75−9.12.1178.7825.18
JJ05Jxw65.67.0573.45109855.317.041391104.5675.332125.309−74−8.24.09100.648.17
JJ06Jxw1008.38186.5206223.0311.343097116.1571.664616.689−71−5.98.63204.1118.1
JJ07Jxw84.17.08145.6146688.1519.61978118.3852.548827.97−72−6.89.4518578.48
JJ08Jxw87.68.4193.4209716.998.73096111.7473.961097.327−70−5.49.68182.9120
JJ09Jxw88.28.46165.618651812.76281894.16456.155632.811−70−5.68.78204.4107.2
JJ10Jxw1007.65150.1168274.0820.362421159.7552.249684.705−70−6.58.04129.770.36
JJ11Jxw837.79124.42201.165.7142.53034.8760.7341.76742.681.82/////
JJ12Jxw817.01107.11911255.445.222777741.8367.3629762.53/////
JJ13Jxw75.76.9112.81838274.343.133000.7487371.26227.463.96/////
JJ14Jxw89.17.46105.11944221.946.392827538.7356.9614764.61/////
JQ01Q14.97.831.299.8282.8949.34105.4327.7179.5889.70.897−70−9.70.43<0.2022.97
JQ02Q21.58.093.1849.0521.816.915.256.4209.4326.70.297−80−10.60.37<0.2021.47
JD01/195.860.452.834.540.811.797.84.7435.620.016−55−8.50.15<1.00<0.20
JB01/15.28.035.44202.957.6559.1218.197.0549711670.647−34−2.70.8112.890.96
Table 2. Calculation results of thermal storage temperature.
Simple No.Measuring TemperatureNa-KNa-K-CaCa-MgK-MgQuartzChalcedonySI Method
JN0169.282.3178.42435.3186.02138.30111.7297
JN028289.4384.45457.6689.70149.67124.4096
JN036779.5271.62430.7975.46142.80116.7292
JN0446.175.6467.40428.6069.72133.93106.8883
JN0544.871.7161.10415.0063.10132.23105.0092
JN066277.4081.32438.5391.81141.59115.3881
JN0773.471.4770.91409.4982.33126.0798.2289
JN086868.3378.29416.0187.5459.6527.4481
JN0956.154.4861.66409.0569.47135.19108.2783
JN1048.280.5766.86386.2278.81155.61131.0982
JN1152.961.2067.89376.9388.4873.9742.3571
JN127292.5872.84364.2096.79125.2997.3799
JN1379106.5955.18386.5953.23100.7870.7778
JN148076.9165.42375.1581.70120.6992.3385
JN158087.4971.02393.9383.52133.59106.5096
JN167590.0386.30457.4593.10144.19118.2778
JN177694.9287.28423.54103.10153.68128.9189
JN188894.7883.29404.23101.51154.94130.3398
JN1976.485.4883.25383.02101.7432.20125.3190
JJ0182215.20131.26362.50193.24139.88113.48117
JJ0281.6215.08139.65370.81197.42143.78117.82125
JJ0366.8206.58135.06389.33187.58147.93122.46110
JJ0471164.08101.96385.29129.18133.07105.93121
JJ0565.6192.67125.38401.85164.22139.67113.24121
JJ06100217.26148.32321.82212.80145.71119.97149
JJ0784.1225.42130.85364.16189.28146.80121.19115
JJ0887.6218.94154.32319.99217.57143.47117.47153
JJ0988.2215.68142.19306.22212.13133.86106.80150
JJ10100216.11131.21351.67196.20165.13141.86140
JJ1183179.9797.00265.41176.87293.81297.40122
JJ1281179.36108.81376.73142.28291.14293.97148
JJ1375.7186.09110.99384.45141.88249.93242.21148
JJ1489.1176.74107.90366.57145.98259.26253.74150
Table 3. Correlation coefficients of geothermal water chemistry indexes.
T (°C)pHK+Na+Ca2+Mg2+ClSO42−HCO3TDS
T (°C)1
pH−0.0971
K+0.285−0.4311
Na+−0.055−0.4330.848 **1
Ca2+−0.101−0.570 *0.686 **0.678 **1
Mg2+−0.097−0.459 *0.618 **0.645 **0.951 **1
Cl−0.162−0.462 *0.788 **0.976 **0.769 **0.740 **1
SO42−0.0260.246−0.273−0.494 *−0.359−0.473 *−0.555 *1
HCO30.611 **0.1160.2090.094−0.401−0.353−0.101−0.0341
TDS0.099−0.3650.911 **0.973 **0.674 **0.662 **0.931 **−0.460 *0.1961
T (°C)1
pH0.661 *1
K+0.606 *0.619 *1
Na+0.5130.4440.717 **1
Ca2+−0.128−0.648 *−0.3490.1441
Mg2+0.044−0.048−0.1370.4410.2591
Cl0.5090.4270.713 **0.982 **0.2150.3571
SO42−0.017−0.253−0.2750.4280.679 **0.823 **0.3971
HCO3−0.305−0.2650.18−0.348−0.363−0.512−0.382−0.699 **1
TDS0.4810.3080.638 *0.976 **0.3090.4740.974 **0.527−0.3841
Note: ** Significant correlation at the 0.01 level (two-tailed). * Significant at the 0.05 level (two-tailed).
Table 4. Geothermal water characteristic coefficients.
Sample No.StratigraphicγNa+/γCl100 × γSO42−/γClγCl/(γHCO3 + CO32−)
JN01Ng1.8620.331.60
JN022.1230.261.21
JN031.7322.161.94
JN042.3133.731.03
JN053.2358.100.67
JN062.6028.990.80
JN073.3836.720.54
JN081.692.571.46
JN092.6633.220.84
JN101.3515.144.22
JN111.181.595.00
JJ01Jxw1.093.244.90
JJ021.063.026.21
JJ031.073.335.08
JJ041.286.872.98
JJ051.225.563.54
JJ061.032.779.32
JJ071.144.413.99
JJ081.042.6711.24
JJ091.022.4710.63
JJ101.074.887.54
JQ01Q2.72127.100.60
JQ021.4432.850.75
Table 5. Calculation results for the recharge elevation of the geothermal groundwater samples.
Sample No.Supply Elevation (m)Sample No.Supply Elevation (m)
JN01963JJ01863
JN02963JJ02813
JN031013JJ03913
JN041063JJ041013
JN051063JJ05963
JN06963JJ06813
JN07913JJ07863
JN08913JJ08763
JN09863JJ09763
JN10913JJ10763
JN11813
Table 6. Estimated and actual temperature error values of each temperature scale.
No.Temperature Scale TypeError Range (°C)Average Error (°C)
1Na-k±0.33–141.3257.52
2Na-K-Ca±0.84–68.2621.44
3K-Mg±1.7–129.9750.06
4Ca-Mg±181.42–382.50312.32
5Quartz±8.35–210.8173.82
6Chalcedony±8.23–214.453.73
7SI Method±1.00–72.332.64
Disclaimer/Publisher’s Note: The statements, opinions and data contained in all publications are solely those of the individual author(s) and contributor(s) and not of MDPI and/or the editor(s). MDPI and/or the editor(s) disclaim responsibility for any injury to people or property resulting from any ideas, methods, instructions or products referred to in the content.

