
Determinants and Evaluation of Onsite Water Loss Due to Leakages in a Selected Institution in South Africa

Abstract
:1. Introduction
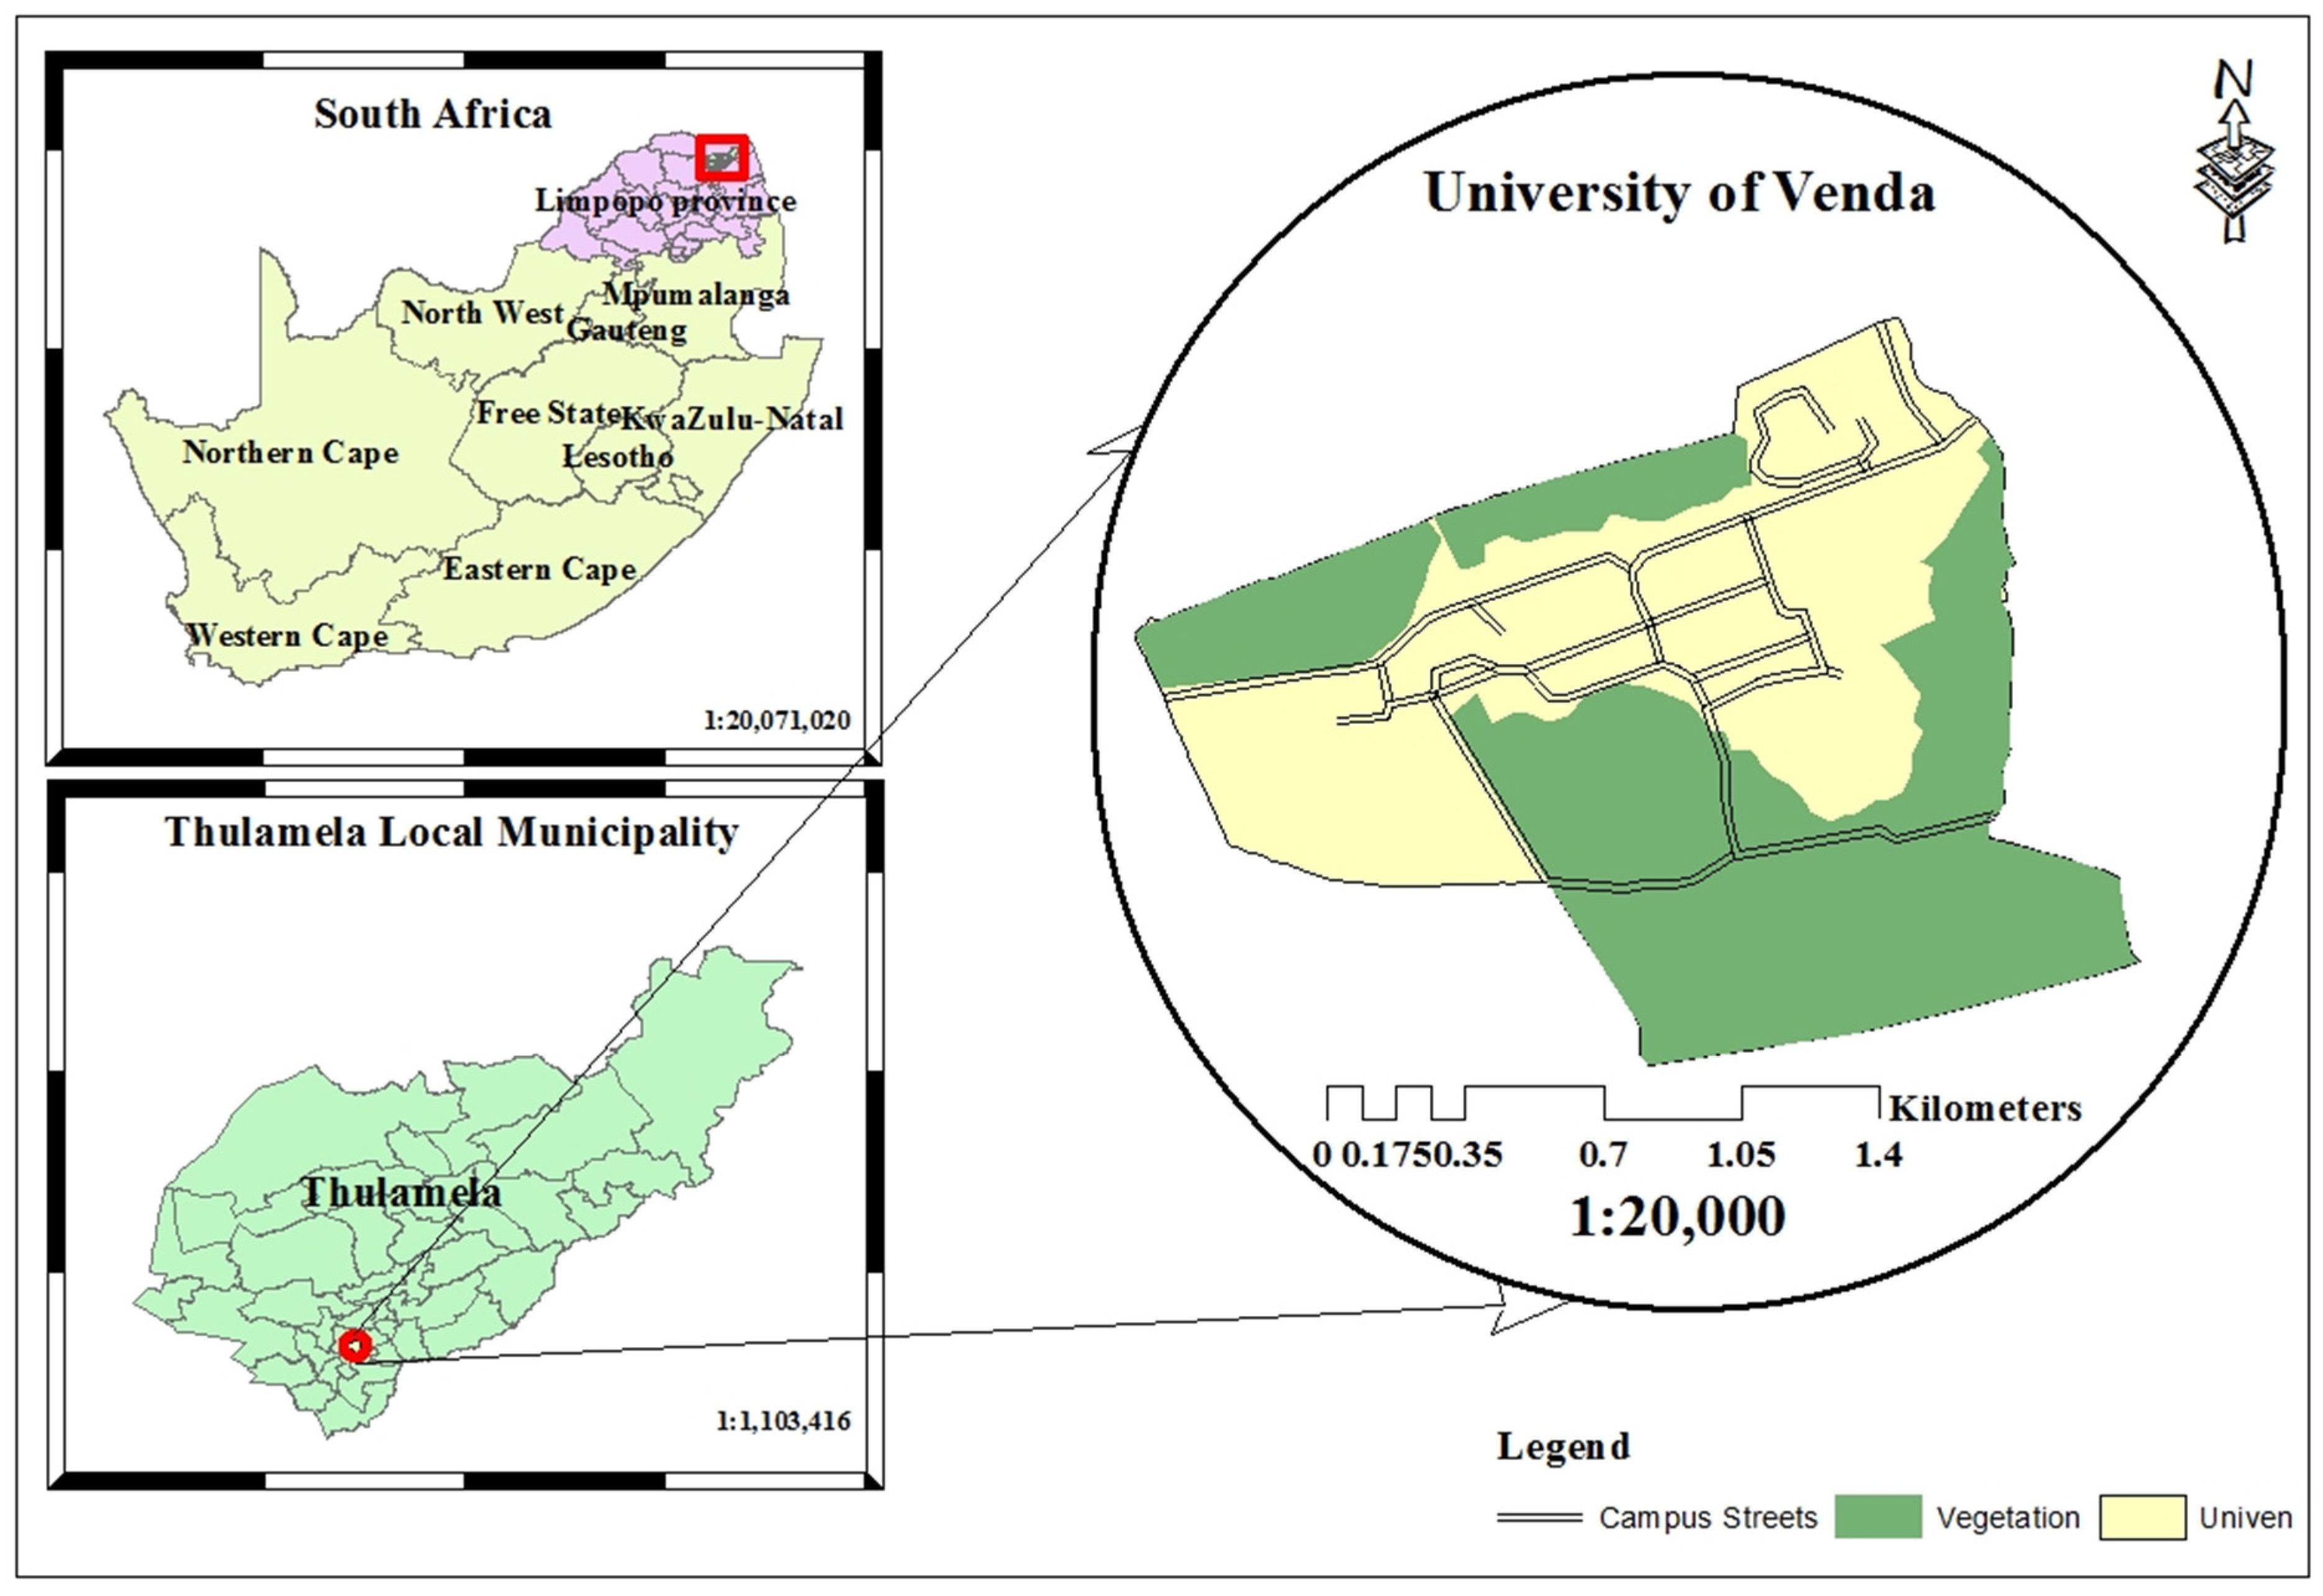
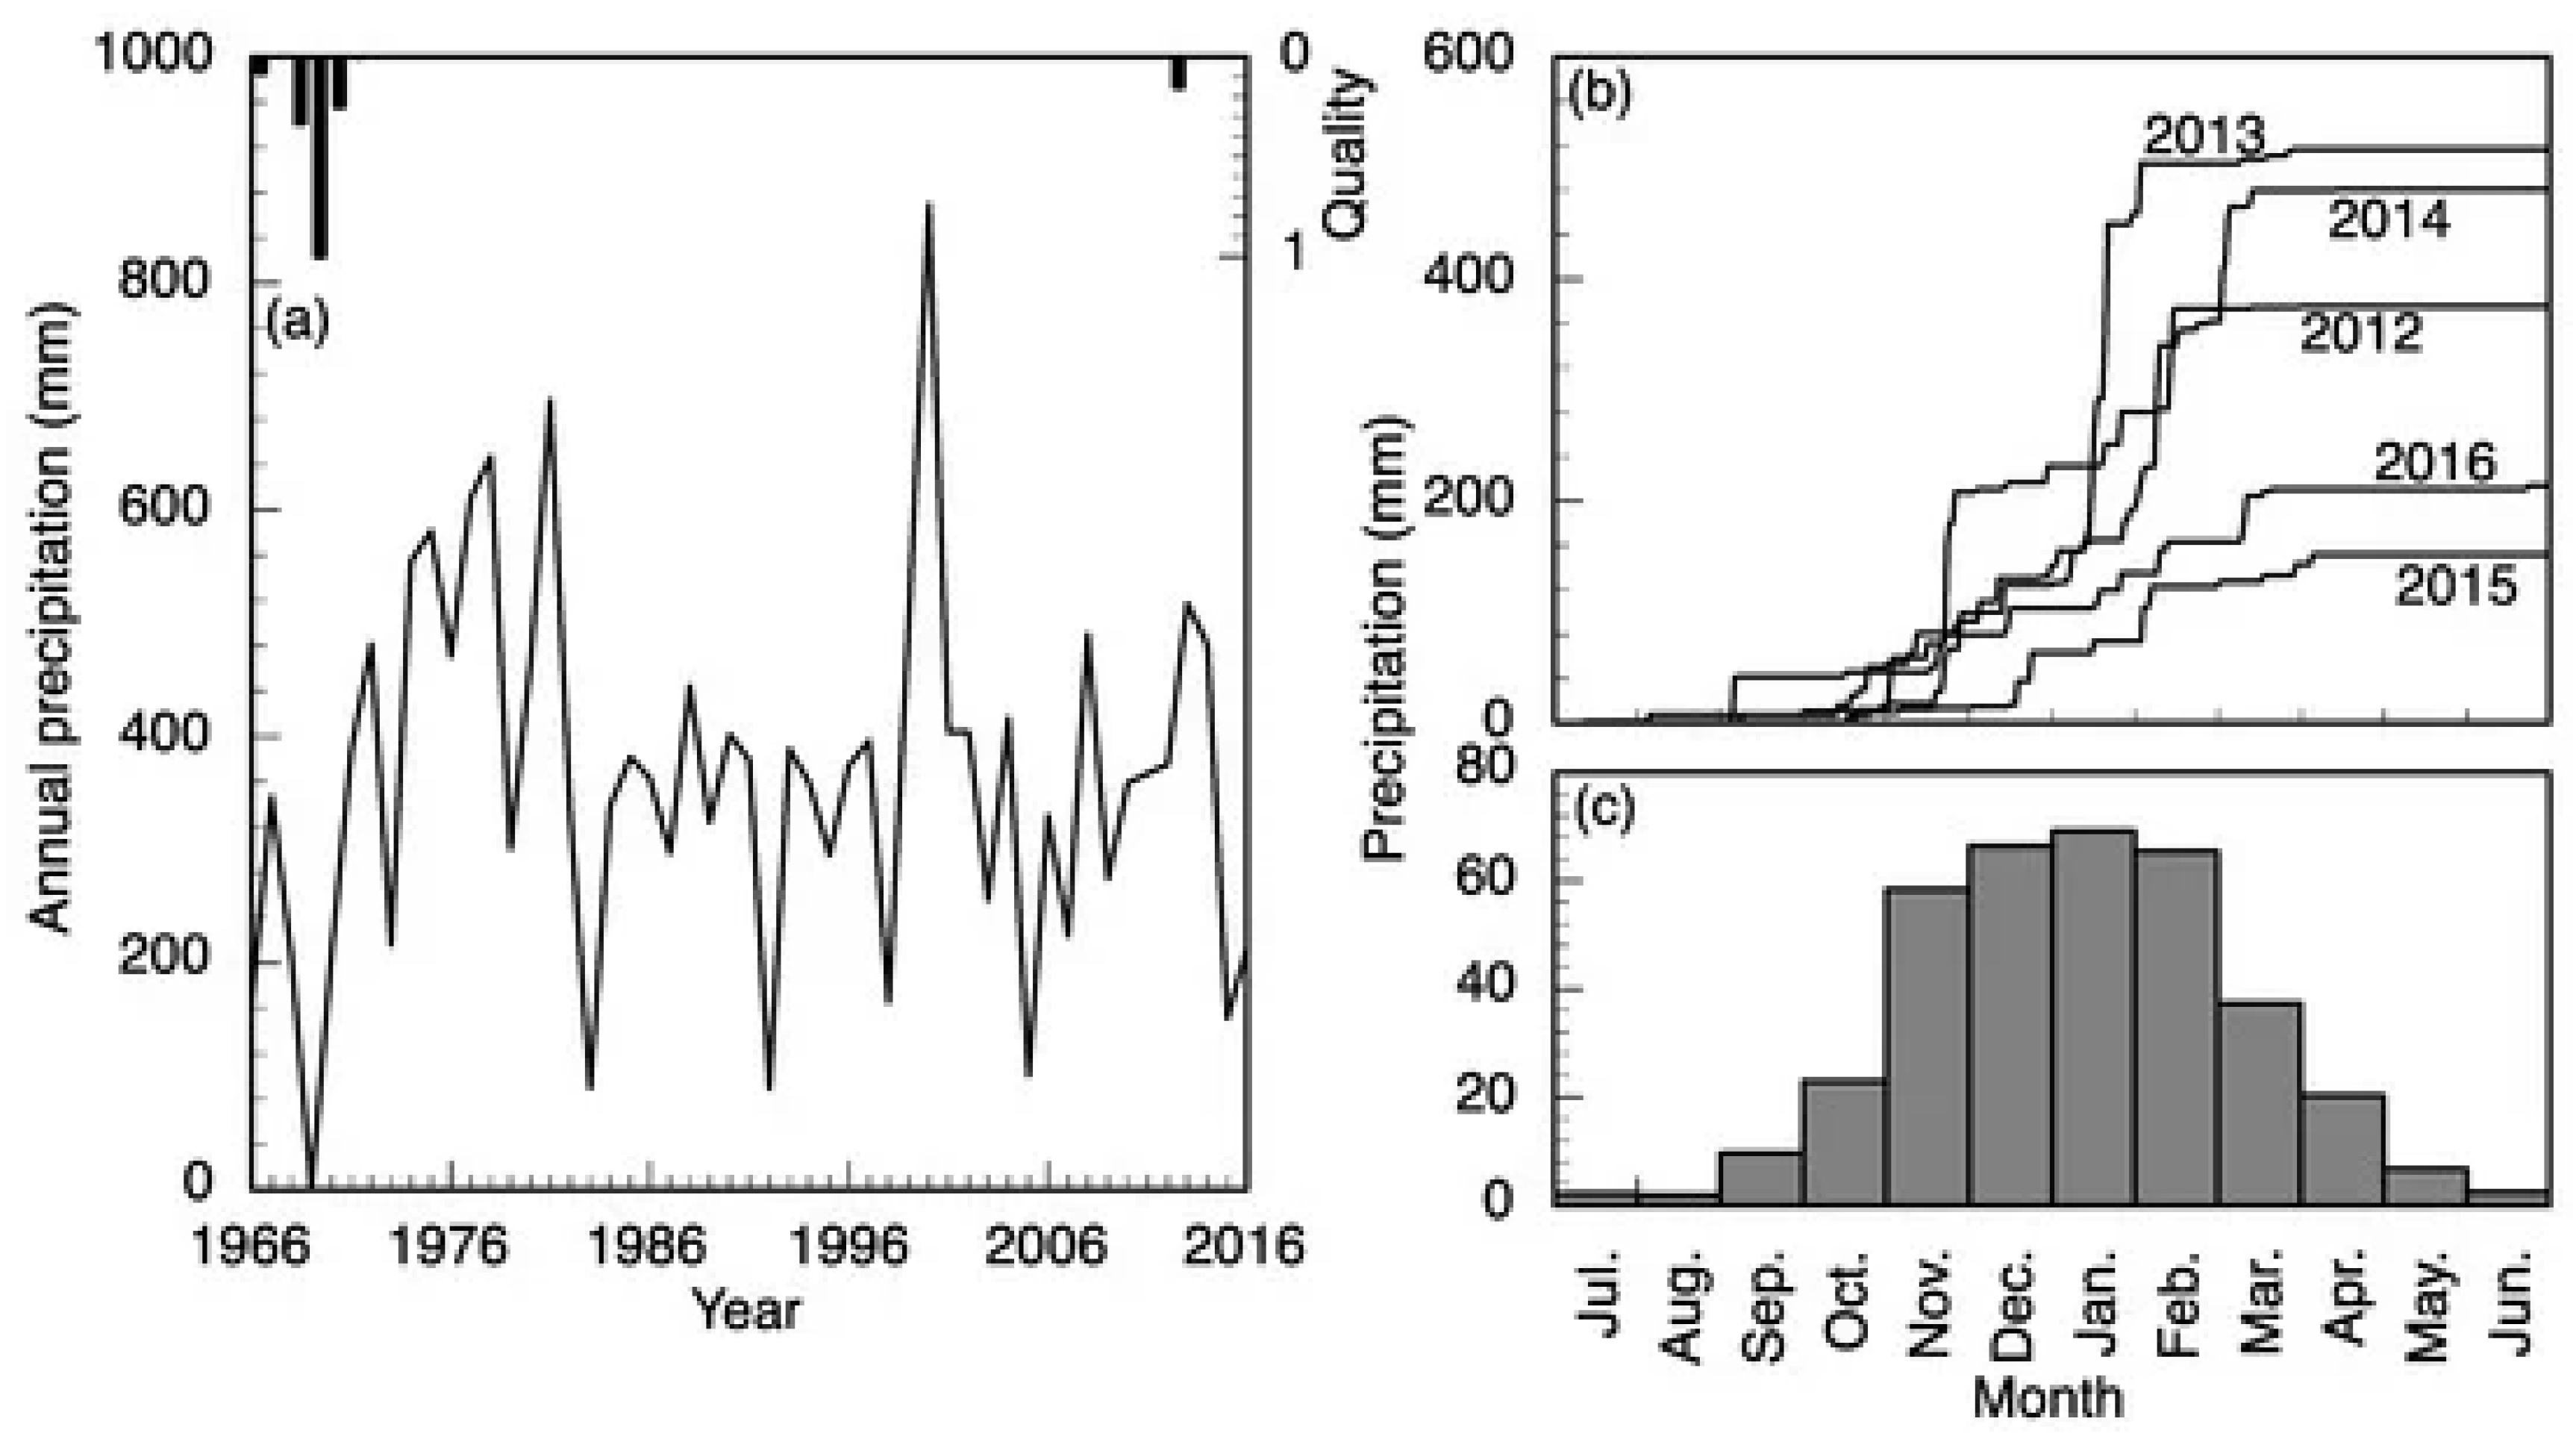
Study Area
2. Materials & Methods
2.1. Sampling
2.2. Sample Analysis
2.3. Trace Metals Pollution Indexing
2.4. Health Risk Assessment
3. Results and Discussion
3.1. Water Loss and Valuation
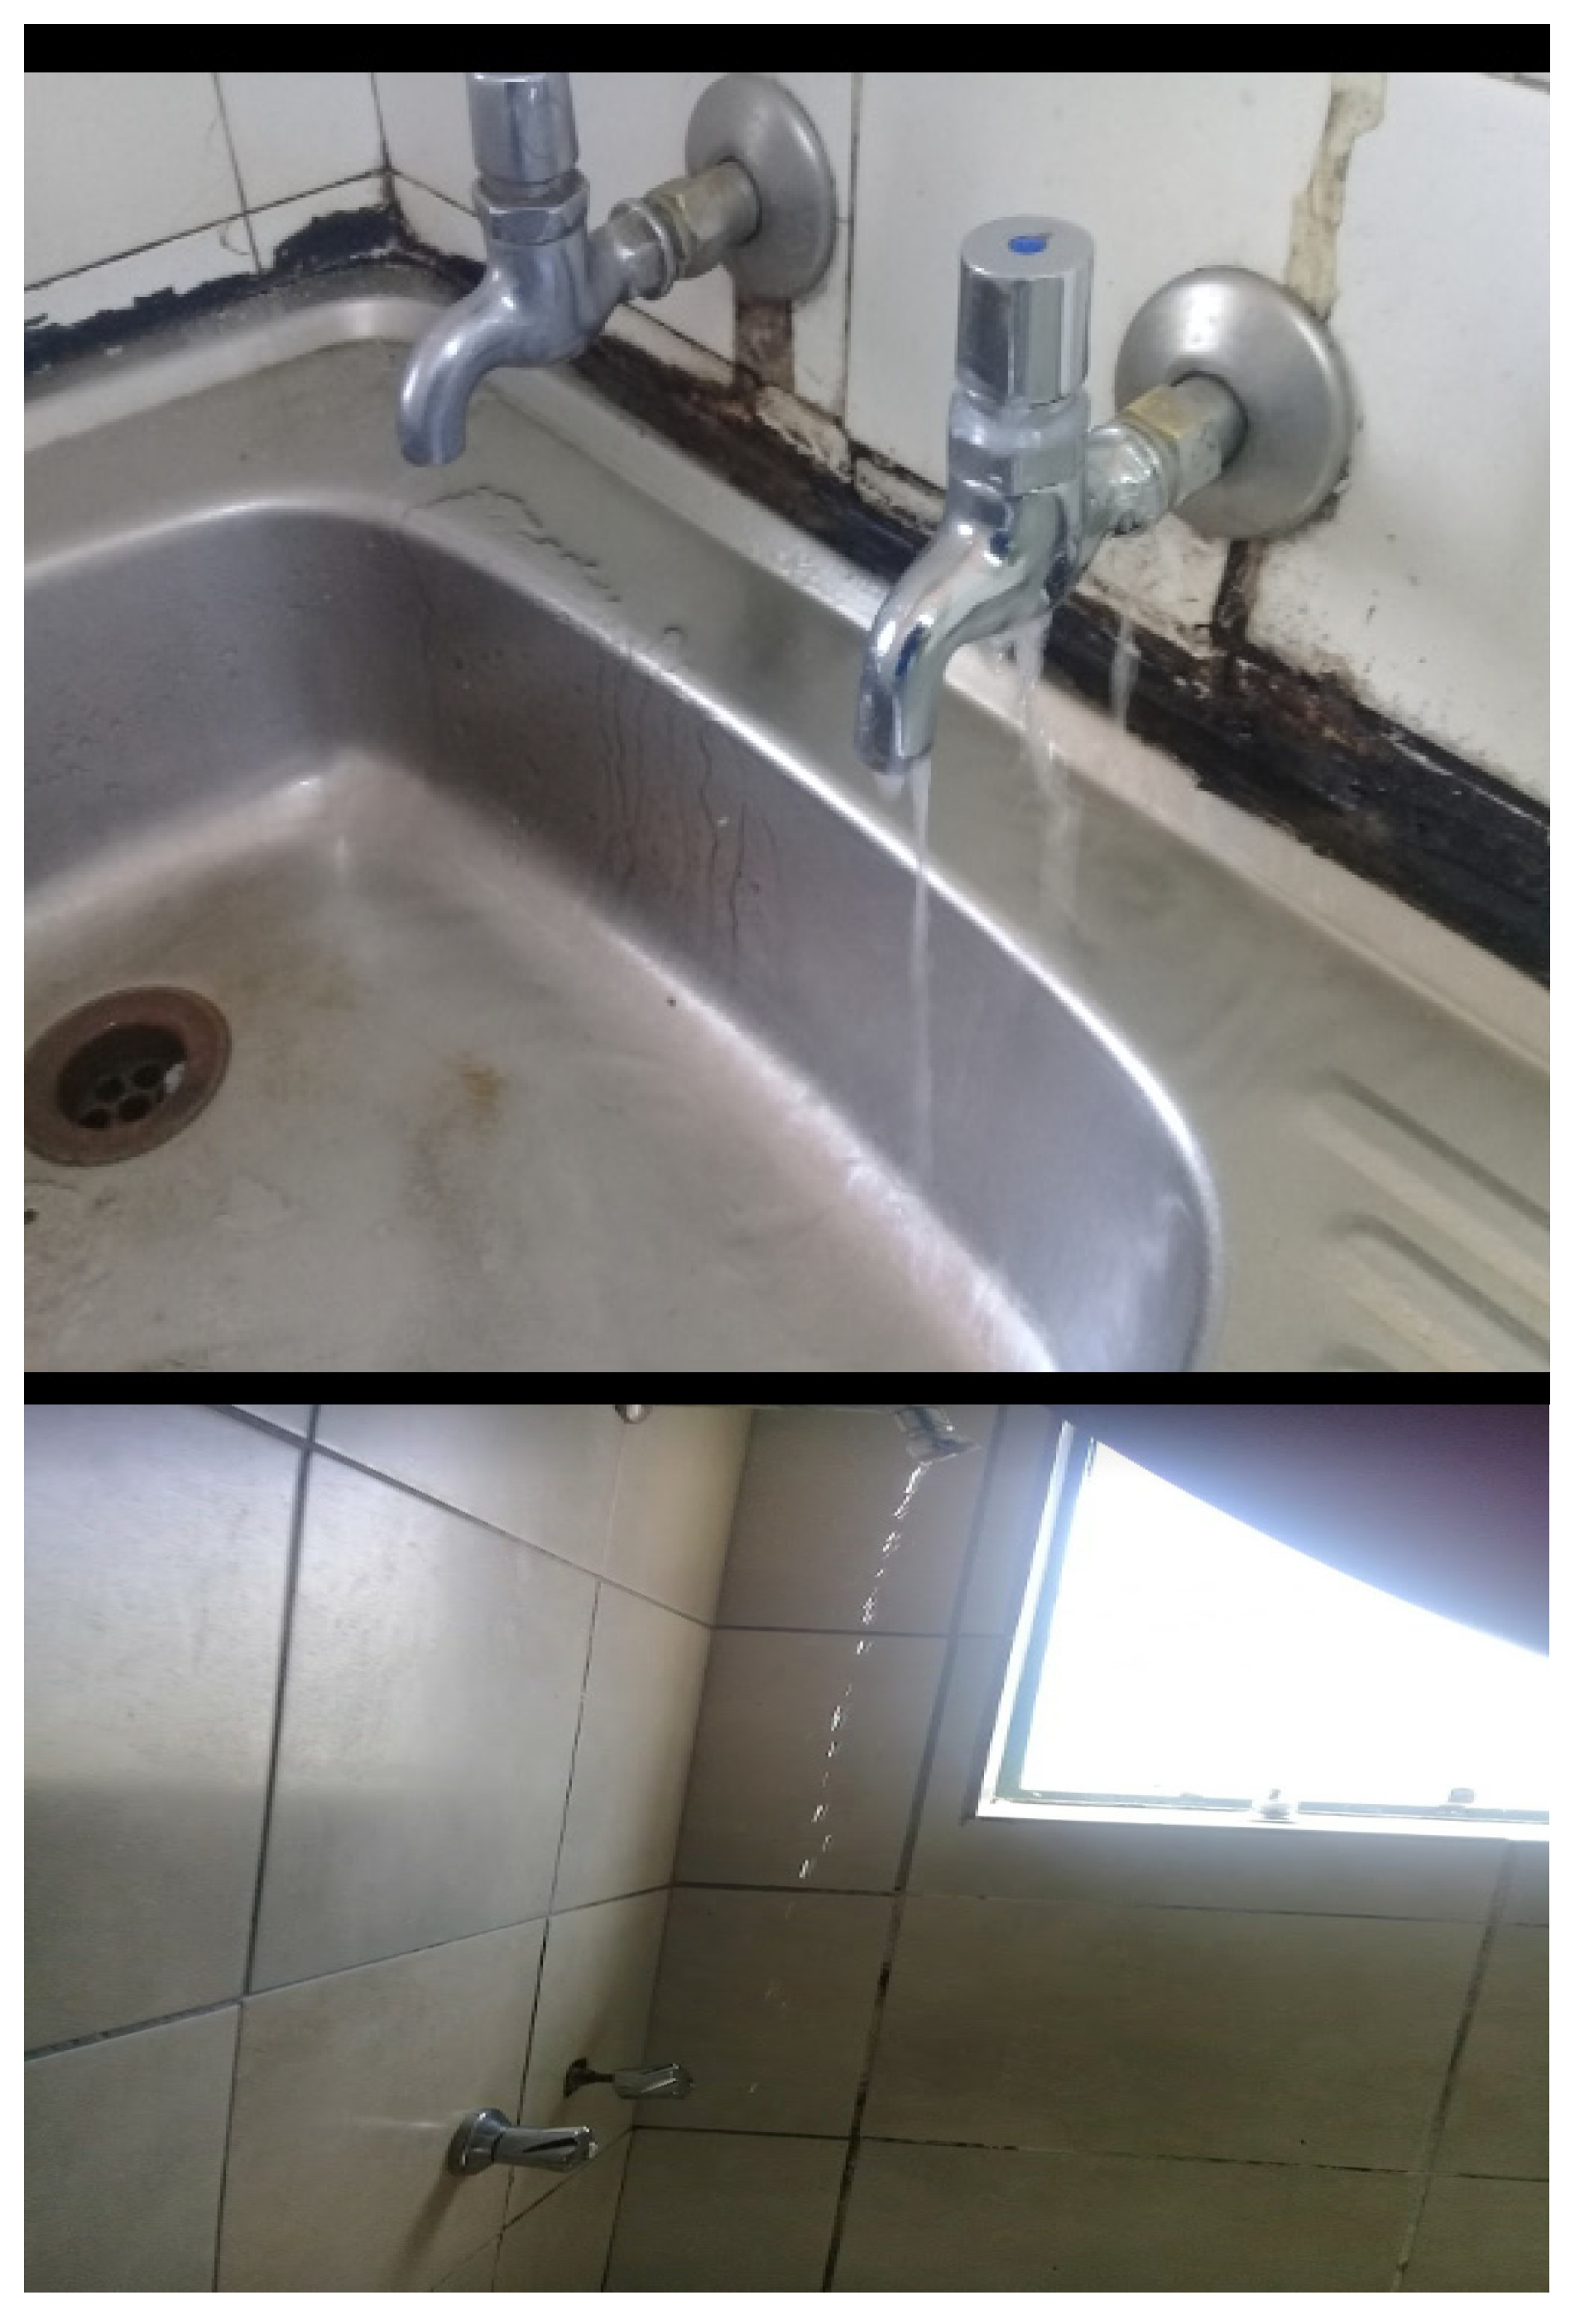
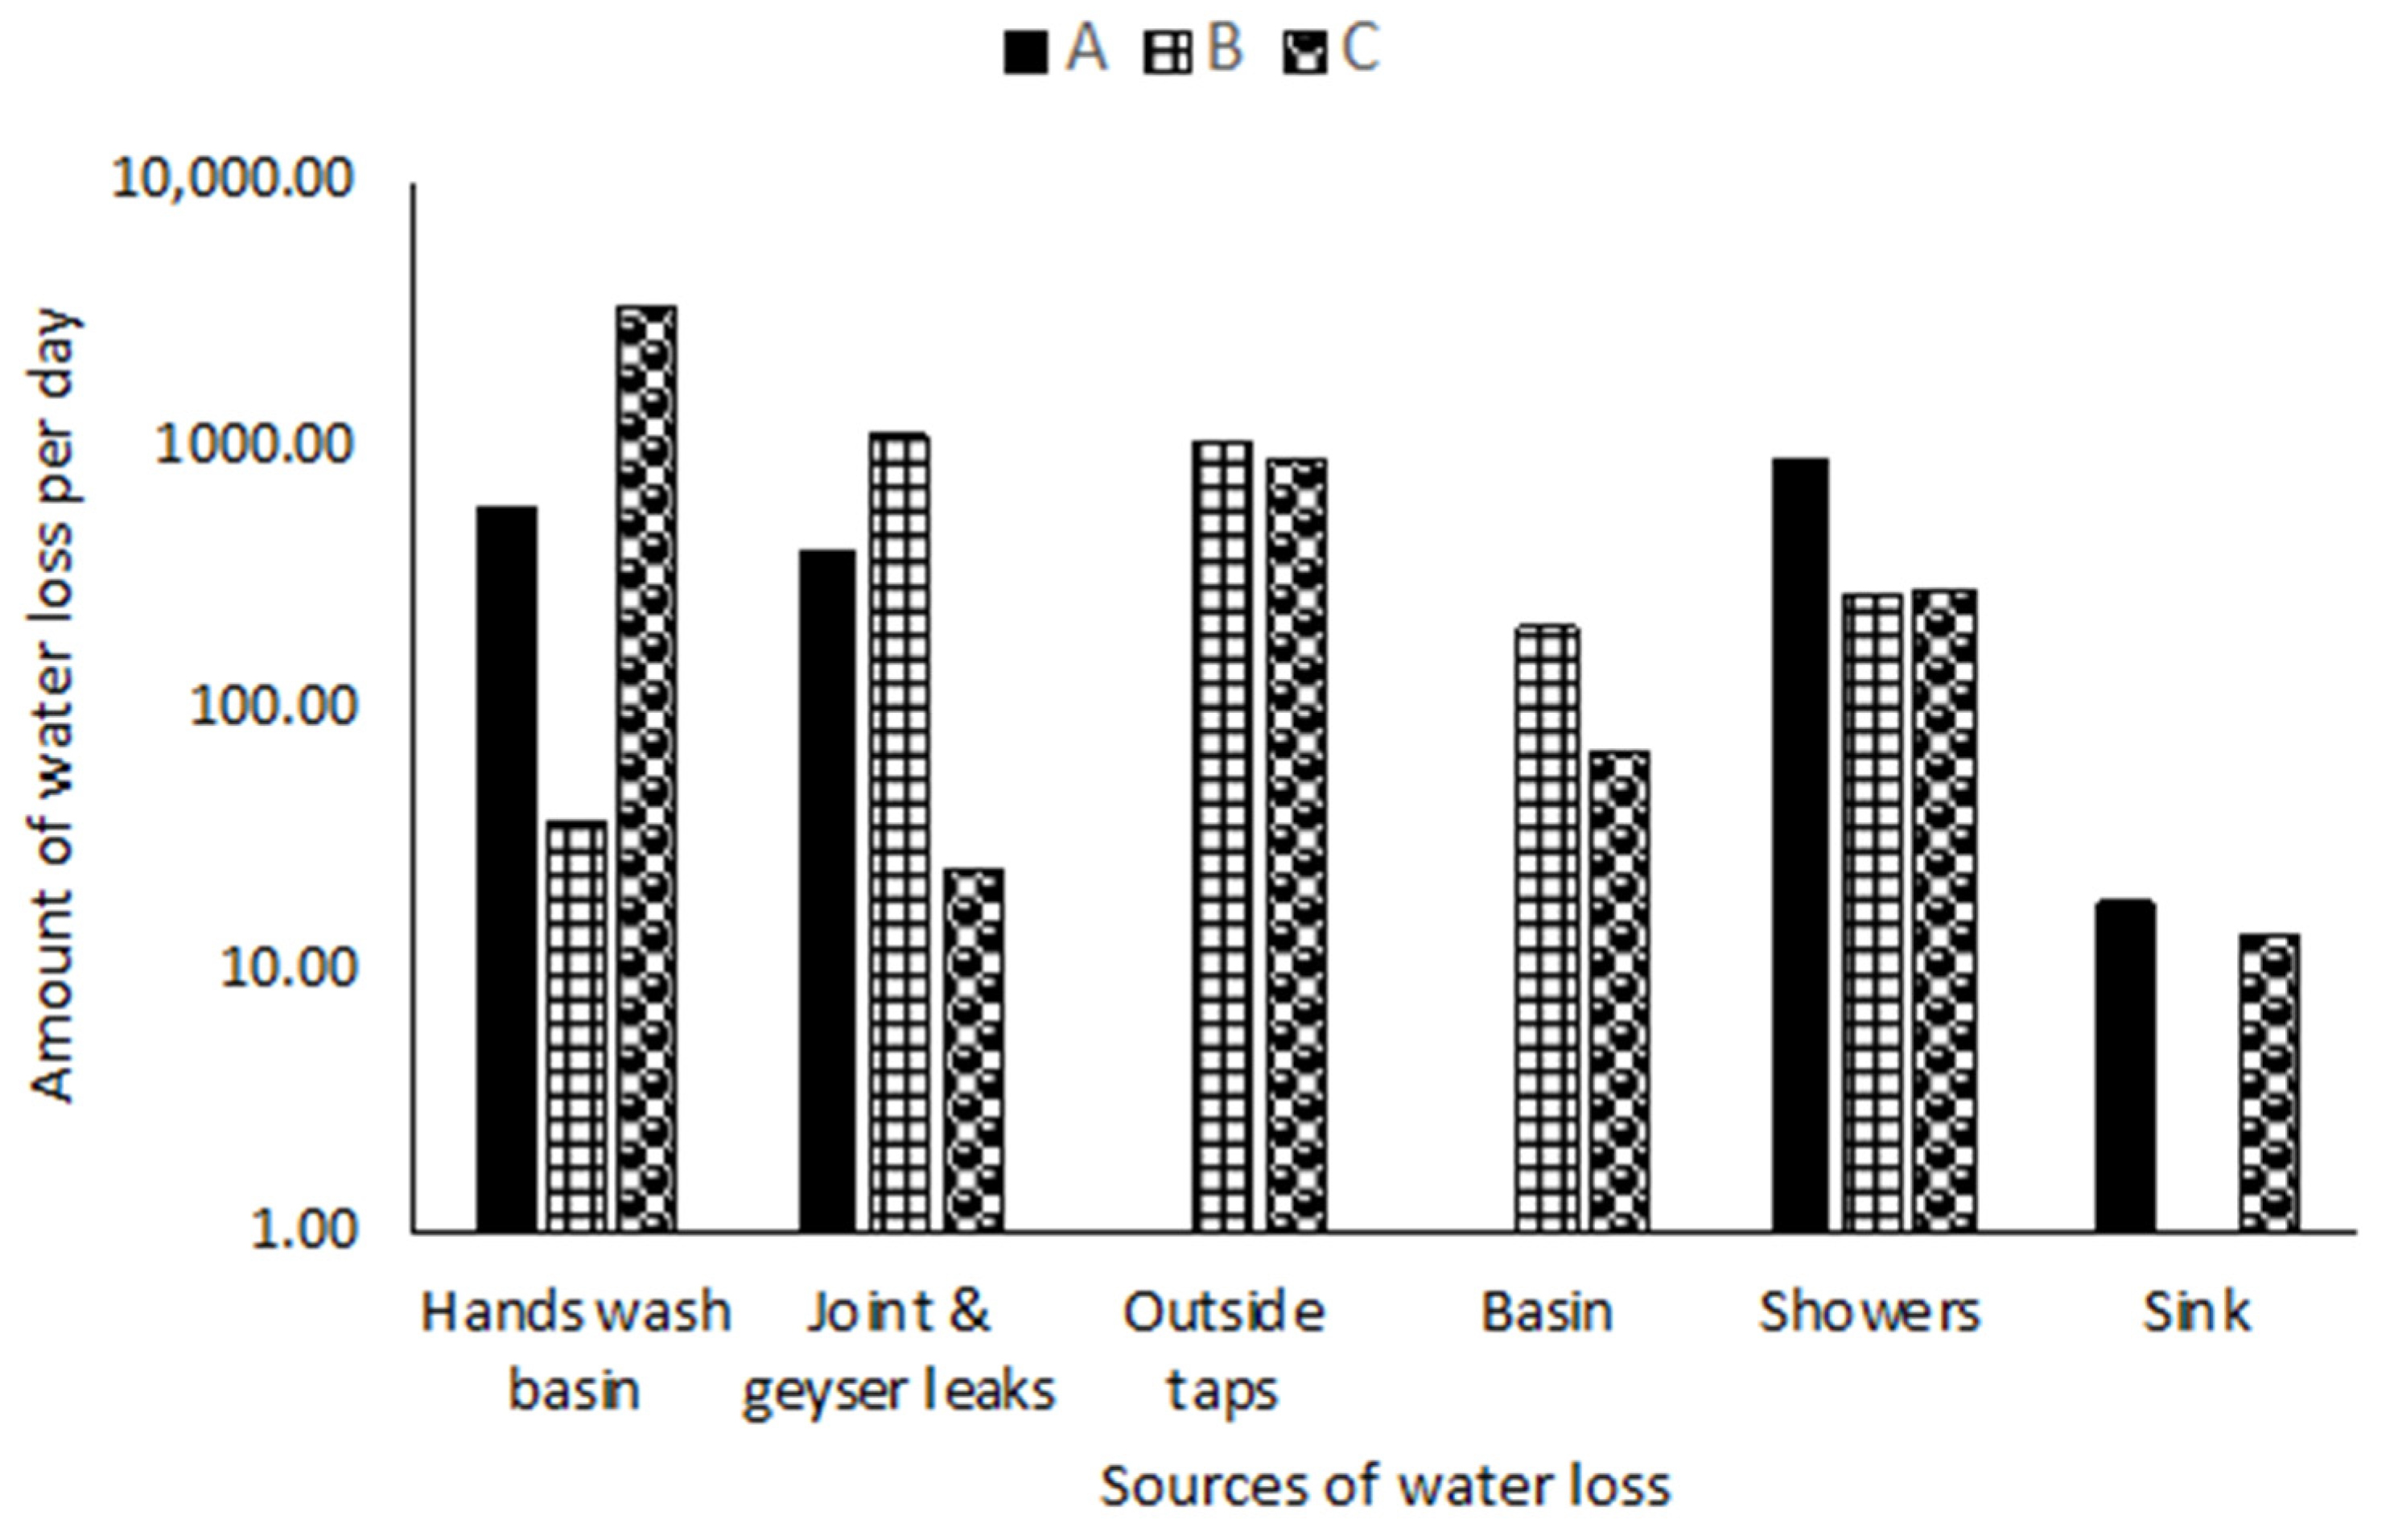
3.1.1. Water Loss Causes
3.1.2. Water Loss Analysis
3.1.3. Comparisons of Reported Cases of Onsite Water Loss
3.1.4. Economics of The Water Loss Due to Onsite Leakage
3.2. Quality of Water Loss
3.2.1. Physiochemical Parameters
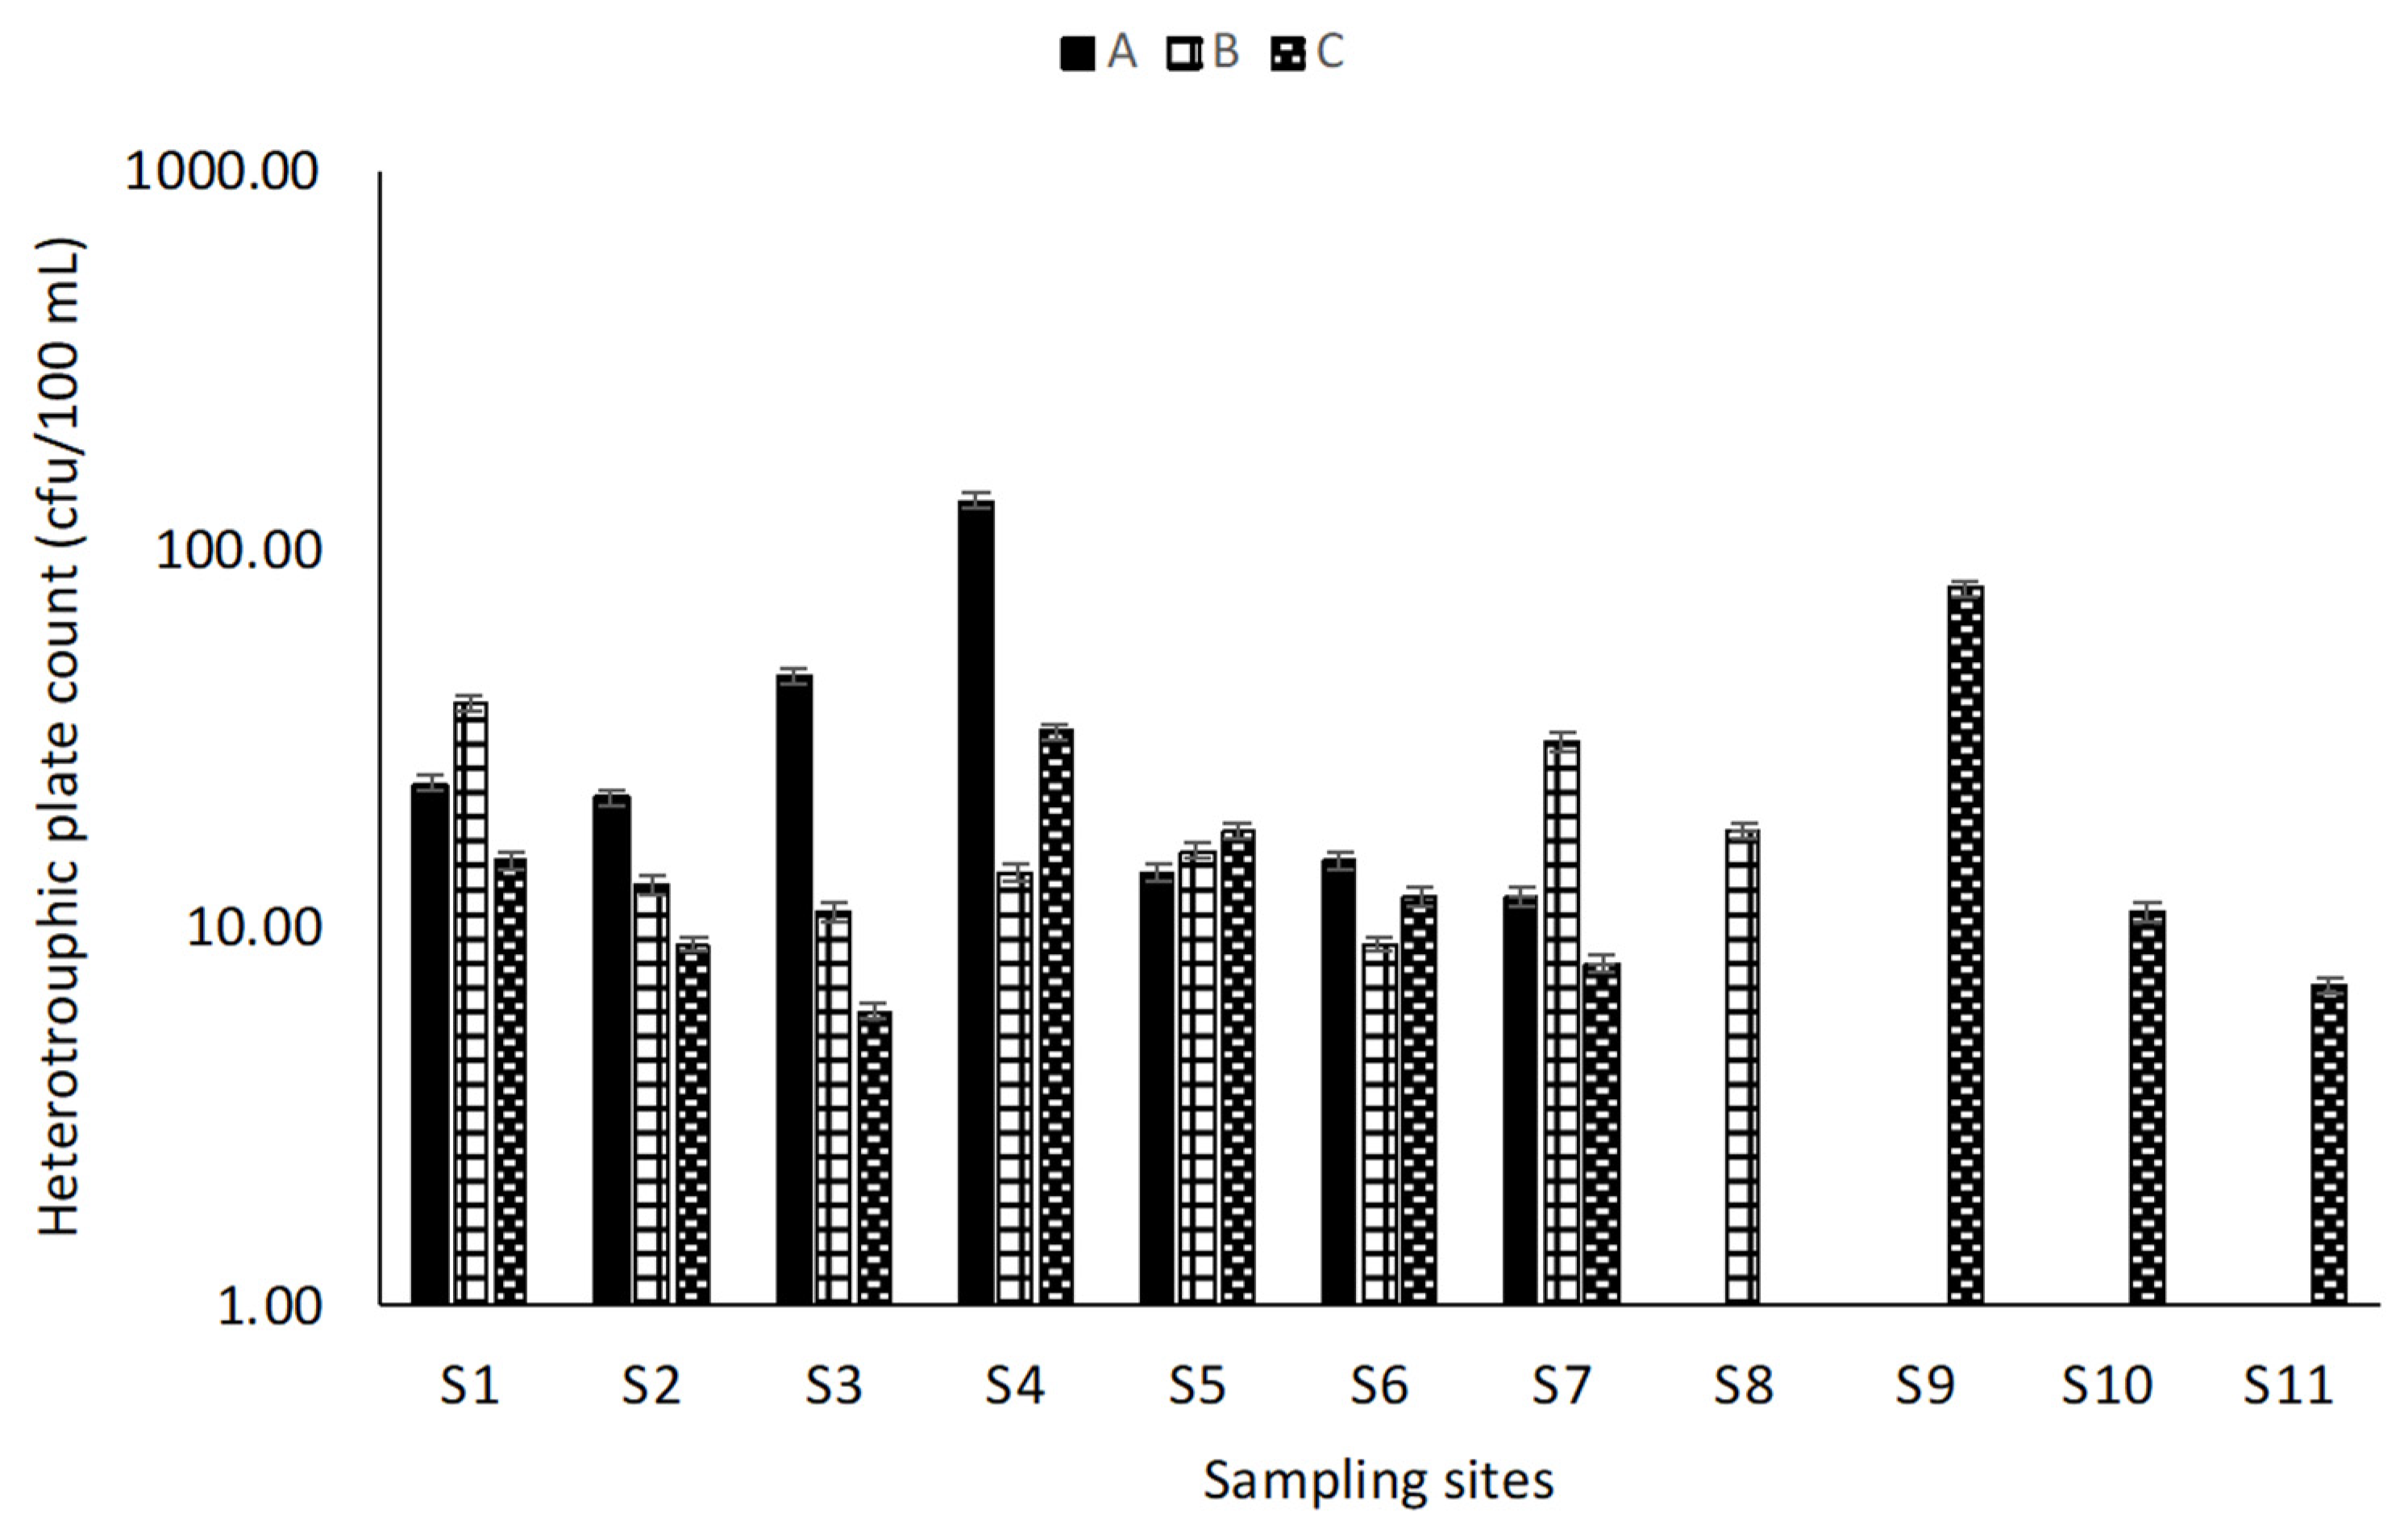
3.2.2. Microbial Analysis
3.2.3. Trace Metals
3.2.4. Trace Metals Pollution Index
3.2.5. Human Health Risk Assessment
4. Limitation of The Study
5. Conclusions
Author Contributions
Funding
Data Availability Statement
Conflicts of Interest
Appendix A

| Heavy Metals (μg/L) | Mean Concentration (Mi) | Highest Permitted Value of Drinking Water (Si) | Desirable Maximum Value (Ii) | Unit Weightage (Wi) | Sub-Index (Qi) | Wi × Qi |
|---|---|---|---|---|---|---|
| Residence A | ||||||
| Cr | 2.47 | 500 | 100 | 0.002 | 24.383 | 0.049 |
| Co | 0.08 | 1000 | 500 | 0.001 | 99.985 | 0.1 |
| Cu | 28.025 | 2000 | 1000 | 0.001 | 97.198 | 0.049 |
| Hg | 0.27 | 5 | 1 | 0.2 | 18.25 | 3.65 |
| Mn | 8.37 | 1000 | 100 | 0.001 | 10.181 | 0.010 |
| Ni | 1.92 | 350 | 150 | 0.003 | 74.04 | 0.212 |
| Zn | 19.265 | 10 | 5 | 0.1 | 285.3 | 28.53 |
| 0.102 | 28.578 | HPI = 2.92 | ||||
| Residence B | ||||||
| Cr | 2.55 | 500 | 100 | 0.002 | 24.363 | 0.049 |
| Co | 0.085 | 1000 | 500 | 0.001 | 99.983 | 0.1 |
| Cu | 46.48 | 2000 | 1000 | 0.001 | 95.352 | 0.048 |
| Hg | 0.095 | 5 | 1 | 0.2 | 22.625 | 4.525 |
| Mn | 8.325 | 1000 | 100 | 0.001 | 10.186 | 0.010 |
| Ni | 2.42 | 350 | 150 | 0.003 | 73.79 | 0.211 |
| Zn | 16.62 | 10 | 5 | 0.1 | 232.4 | 23.24 |
| 0.102 | 23.289 | HPI = 2.38 | ||||
| Residence C | ||||||
| Cr | 1.92 | 500 | 100 | 0.002 | 24.52 | 0.049 |
| Co | 0.065 | 1000 | 500 | 0.001 | 99.987 | 0.1 |
| Cu | 55.9 | 2000 | 1000 | 0.001 | 94.41 | 0.047 |
| Hg | 0.856 | 5 | 1 | 0.2 | 3.6 | 0.72 |
| Mn | 6.285 | 1000 | 100 | 0.001 | 10.413 | 0.010 |
| Ni | 1.325 | 350 | 150 | 0.003 | 74.338 | 0.212 |
| Zn | 17.105 | 10 | 5 | 0.1 | 242.1 | 24.21 |
| 0.10 | 24.26 | HPI = 2.47 | ||||
| TOTAL: | HPI = 7.77 | |||||
References
- Edokpayi, J.N.; Makungo, R.; Volenzo, E.T.; Nkuna, T.; Mathivha, F.; Odiyo, J.O. Chapter 5—Influence of global climate change on water resources in South Africa: Towards an adaptive management approach. In Water Conservation and Wastewater Treatment in BRICS Nations; Singh, P., Milshina, Y., Tian, K., Gusain, D., Bassin, J., Eds.; Elsevier: Amsterdam, The Netherlands, 2020; ISBN 9780128183397. [Google Scholar] [CrossRef]
- Greenpeace. Water Crisis in South Africa. Available online: https://www.greenpeace.org/africa/en/blogs/51757/water-crisis-in-south-africa/ (accessed on 31 October 2022).
- Shin, S.; Aziz, D.; Jabeen, U.; Bano, R.; Burian, S.J. A trade-off balance among urban water infrastructure improvements and financial management to achieve water sustainability. Urban Water J. 2022, 19, 195–207. [Google Scholar] [CrossRef]
- Mckenzie, R.; Siqalaba, Z.; Wegelin, W. The State of Non-Revenue Water in South Africa; WRC Report No. TT 522/12; Water Research Commission: Pretoria, South Africa, 2012. [Google Scholar]
- Couvelis, F.; van Zyl, J. Apparent losses due to domestic water meter under-registration in South Africa. Water SA 2015, 41, 698–704. [Google Scholar] [CrossRef] [Green Version]
- Edokpayi, J.N.; Abimbola, M.E.F.; Adeeyo, A.O.; Durowoju, O.S.; Jegede, A.O.; Odiyo, J.O. Chapter 9—Recent trends and national policies for water provision and wastewater treatment in South Africa. In Water Conservation and Wastewater Treatment in BRICS Nations; Singh, P., Milshina, Y., Tian, K., Gusain, D., Bassin, J., Eds.; Elsevier: Amsterdam, The Netherlands, 2020; ISBN 9780128183397. [Google Scholar] [CrossRef]
- Trow, S.; Farley, M. Developing a strategy for leakage management in water distribution systems. Water Sci. Technol. Water Supply 2004, 4, 149–168. [Google Scholar] [CrossRef] [Green Version]
- Saghi, H.; Aval, A. Effective Factors in Causing Leakage in Water Supply Systems and Urban Water Distribution Networks. Am. J. Civ. Eng. 2015, 3, 60. [Google Scholar] [CrossRef] [Green Version]
- Alliance to Save Energy. Munsieville Private Property Leak Repair Project—Close-Out Report; Alliance to Save Energy: Emfuleni, South Africa, 2006. [Google Scholar]
- McKenzie, R.S.; Wegelin, W.A.; Meyer, N. Leakage Reduction Projects Undertaken by Rand Water; Association with UN-Habitat: Nairobi, Kenya, 2002. [Google Scholar]
- Lugoma, M.F.T.; Van Zyl, J.E.; Ilemobade, A.A. The extent of on-site leakage in selected suburbs of Johannesburg. Water SA 2012, 38, 127–132. [Google Scholar] [CrossRef] [Green Version]
- Babić, B.; Đukić, A.; Stanić, M. Managing water pressure for water savings in developing countries. Water SA 2014, 40, 3. [Google Scholar] [CrossRef] [Green Version]
- Sangwa-Lugoma, G.; Ramanakumar, A.V.; Mahmud, S.; Liaras, J.; Kayembe, P.K.; Tozin, R.R.; Lorincz, A.; Franco, E.L. Prevalence, and determinants of high-risk human papillomavirus infection in women from a sub-Saharan African community. Sex. Transm. Dis. 2011, 38, 308–315. [Google Scholar] [CrossRef] [PubMed]
- Ruan, N.; Que, X. Research on the Leakage Problems of a Campus Water Supply System. In Proceedings of the 9th International Conference on Applied Science, Engineering and Technology (ICASET 2020), Paris, France, 27–28 August 2020. [Google Scholar]
- Susorova, I. Evaluation of the Effects of Vegetation and Green Walls on Building Thermal Performance and Energy Consumption; Illinois Institute of Technology: Chicago, IL, USA, 2013. [Google Scholar]
- Edokpayi, J.N.; Rogawski, E.T.; Kahler, D.M.; Hill, C.L.; Reynolds, C.; Nyathi, E.; Smith, J.A.; Odiyo, J.O.; Samie, A.; Bessong, P. Challenges to sustainable safe drinking water: A case study of water quality and use across seasons in rural communities in Limpopo province, South Africa. Water 2018, 10, 159. [Google Scholar] [CrossRef]
- Nkuna, Z. Towards Efficient Water Utilisation in South African Higher Education Institutions: A Case Study of University of Venda. Master’s Dissertation, University of Venda, Thohoyandou, South Africa, 2019. [Google Scholar]
- Dutta, R. Model Selection: Bayes and Frequentist Perspective. Ph.D. Thesis, Purdue University, West Lafayette, IN, USA, 2012. [Google Scholar]
- Sharma, B.L. Metal-Semiconductor Schottky Barrier Junctions and Their Applications; Springer Science & Business Media: Berlin/Heidelberg, Germany, 2013. [Google Scholar]
- Olmedo, P.; Pla, A.; Hernández, A.F.; Barbier, F.; Ayouni, L.; Gil, F. Determination of toxic elements (mercury, cadmium, lead, tin and arsenic) in fish and shellfish samples. Risk assessment for the consumers. Environ. Int. 2013, 59, 63–72. [Google Scholar] [CrossRef]
- Harrigan, W.F.; McCance, M.E. Laboratory Methods in Microbiology; Academic Press: Cambridge, MA, USA, 2014. [Google Scholar]
- Selvam, S.; Venkatramanan, S. A GIS-based assessment of water quality pollution indices for heavy metal contamination in Tuticorin Corporation, Tamilnadu, India. Arab. J. Geosci. 2015, 8, 10611–10623. [Google Scholar] [CrossRef]
- South African National Standards (SANS). Drinking Water, Part 2: Application of SANS 241-1; South African National Standards (SANS): Pretoria, South Africa, 2015. [Google Scholar]
- USEPA. EPA Method 415.3: Determination of Total Organic Carbon and Specific UV Absorbance at 254 nm in Source Water and Drinking Water, 2005. Rev. 1.1. EPA/600/R-05/055. Available online: http://www.epa.gov/nerlcwww/m_415_3Rev1_1.pdf (accessed on 6 February 2012).
- Onyele, O.G.; Anyanwu, E.D. Human health risk assessment of some heavy metals in a rural spring, southeastern Nigeria. Afr. J. Environ. Nat. Sci. Res. 2018, 1, 15–23. [Google Scholar]
- Kavcar, P.; Sofuoglu, A.; Sofuoglu, S.C. A health risk assessment for exposure to trace metals via drinking water ingestion pathway. Int. J. Hyg. Environ. Health 2009, 212, 216–227. [Google Scholar] [CrossRef] [PubMed] [Green Version]
- USEPA. Interlaboratory Validation Study Results for Cryptosporidium Precision and Recovery for USEPA Method 1622; Office of Ground Water and Drinking Water Technical Support Center: Columbus, OH, USA, 2005.
- US EPA Integrated Risk Information System. Integrated Risk Information System; Environmental Protection Agency Region I: Washington, DC, USA, 2011; p. 20460.
- Adedeji, K.B.; Hamam, Y.; Abe, B.T.; Abu-Mahfouz, A.M. Pressure management strategies for water loss reduction in large-scale water piping networks: A review. In Advances in Hydroinformatics; Springer: Berlin/Heidelberg, Germany, 2018; pp. 465–480. [Google Scholar]
- USEPA. Supplemental Guidance for Developing Soil Screening Levels for Superfund Sites; Solid Waste and Emergency Response: Washington, DC, USA, 2001; OSWER 9355.4-24.
- ECETOC (European Centre for Ecotoxicology and Toxicology of Chemicals). Exposure Factors Sourcebook for European Populations (with Focus on UK Data); Technical Report No. 79; ECETOC: Brussels, Belgium, 2001; ISSN 0773-8072-79. [Google Scholar]
- Cassa, A.M.; Van Zyl, J.E.; Laubscher, R.F. A numerical investigation into the effect of pressure on holes and cracks in water supply pipes. Urban Water J. 2010, 7, 109–120. [Google Scholar] [CrossRef]
- Barton, N.A.; Farewell, T.S.; Hallett, S.H.; Acland, T.F. Improving pipe failure predictions: Factors affecting pipe failure in drinking water networks. Water Res. 2019, 164, 114–926. [Google Scholar] [CrossRef]
- Mounce, S.R.; Boxall, J.B.; Machell, J. Development, and verification of an online artificial intelligence system for detection of bursts and other abnormal flows. J. Water Resour. Plan. Manag. 2010, 136, 309–318. [Google Scholar] [CrossRef]
- Bhagat, S.K.; Welde, W.; Tesfaye, O.; Tung, T.M.; Al-Ansari, N.; Salih, S.Q.; Yaseen, Z.M. Evaluating physical and fiscal water leakage in water distribution system. Water 2019, 11, 2091. [Google Scholar] [CrossRef] [Green Version]
- Lambert, A.; Fantozzi, M.; Thornton, J. Practical approaches to modeling leakage and pressure management in distribution systems—Progress since 2005. In Proceedings of the 21st International Conference on Computing and Control for the Water Industry, CCWI, Perugia, Italy, 2–4 September 2013. [Google Scholar]
- Pearson, D. Standard Definitions for Water Losses—A Compendium of Terms and Acronyms and Their Associated Definition in Common Use in the Field of Water Loss Management; IWA Publishing: London, UK, 2019; pp. 20–72. [Google Scholar]
- Sarrate, R.; Blesa, J.; Nejjari, F.; Quevedo, J. Sensor placement for leak detection and location in water distribution networks. Water Sci. Technol. Water Supply 2014, 14, 795–803. [Google Scholar] [CrossRef] [Green Version]
- EUREAU (European Union of National Associations of Water Suppliers and Wastewater Services). Leakage Reduction in Addressing Water Scarcity and Drought; EUREAU: Brussels, Belgium, 2011; Available online: http://www.eureau.org/administrator/components/com_europublication/pdf/512529ce328a156bbc74af3a4ec269cf2011.06.15_EAREAU_PP_Leakage.pdf (accessed on 11 April 2018).
- Deoreo, W.B.; Heaney, J.P.; Mayer, P.W. Flow trace analysis to assess water use. AWWA J. 1996, 88, 79–90. [Google Scholar] [CrossRef]
- Mayer, P.W.; Deoreo, W.B.; Opitz, E.M.; Kiefer, J.C.; Davis, W.Y.; Dziegielewski, B.; Nelson, J.O. Residential End Uses of Water Study; AWWA Research Foundation and American Water Works Association: Denver, CO, USA, 1999. [Google Scholar]
- Fourie, G.W. Leakage Management on Plumbing Systems in Households and on Government Properties; Draft Report Prepared for SIDA: Windhoek, Namibia, 2004. [Google Scholar]
- Arregui, F.; Cabrera, E.; Cobacho, R. Integrated Water Meter Management; IWA Publishing: London, UK, 2006. [Google Scholar]
- Molinos-Senante, M.; Donoso, G. Water scarcity and affordability in urban water pricing: A case study of Chile. Util. Policy 2016, 43, 107–116. [Google Scholar] [CrossRef]
- Adhena, A.; Belay, Z.; Angaw, K.; Jemal, Y. Physicochemical analysis of drinking water quality at Jigjiga City. Ethiopia. Am. J. Environ. Prot. 2015, 4, 29–32. [Google Scholar]
- Gemeda, S.T.; Springer, E.; Gari, S.R.; Birhan, S.M.; Bedane, H.T. The importance of water quality in classifying basic water services: The case of Ethiopia, SDG6. 1, and safe drinking water. PLoS ONE 2021, 16, e0248944. [Google Scholar] [CrossRef] [PubMed]
- Department of Water Affairs and Forestry (DWAF). Quality of Domestic Water Supplies—Vol. 1 Assessment Guide; Department of Water Affairs and Forestry: Pretoria, South Africa, 1998.
- Oyewale, T.A.; Adesakin, T. Mycotoxigenic Fungi Distribution and Water Quality of Raw and Treated Water from Ede-Erinle and Opa Waterworks Systems, Osun State Nigeria; ScienceOpen Preprints: Berlin, Germany, 2020. [Google Scholar]
- Pepper, I.L.; Gerba, C.P.; Gentry, T.J.; Maier, R.M. Environmental Microbiology; Academic Press: Cambridge, MA, USA, 2011. [Google Scholar]
- Ubuoh, E.; Nwakanma, C. Determination of harvested storage tank rainwater quality in Owerri, southeast Nigeria. Eur. J. Pharm. Sci. 2016, 3, 8. [Google Scholar]
- Ahmed, M.; Baki, M.A.; Islam, M.; Kundu, G.K.; Habibullah-Al-Mamun, M.; Sarkar, S.K.; Hossain, M. Human health risk assessment of heavy metals in tropical fish and shellfish collected from the river Buriganga, Bangladesh. Environ. Sci. Pollut. Res. 2015, 22, 15880–15890. [Google Scholar] [CrossRef] [PubMed]
- Boateng, T.K.; Opoku, F.; Acquaah, S.O.; Akoto, O. Pollution evaluation, sources, and risk assessment of heavy metals in hand-dug wells from Ejisu-Juaben Municipality. Ghana Environ. Syst. Res. 2015, 4, 18. [Google Scholar] [CrossRef] [Green Version]
- Eldaw, E.; Huang, T.; Elubid, B.; Mahamed, A.K.; Maham, Y. A Novel Approach for Indexing Heavy Metals Pollution to Assess Groundwater Quality for Drinking Purposes. Int. J. Environ. Res. Public Health 2022, 17, 1245. [Google Scholar] [CrossRef] [Green Version]
- Singh, G.; Kamal, R.K. Heavy metal contamination and its indexing approach for groundwater of Goa mining region, India. Appl. Water Sci. 2016, 7, 1479–1485. [Google Scholar] [CrossRef] [Green Version]
- Mirza, A.T.M.; Tanvir, R.; Moutushi, P.; Nikhil, B.; Mahmud, H.; Khorshed, A.; Zakia, A. Heavy metal pollution assessment in the groundwater of the Meghna Ghat industrial area, Bangladesh, by using water pollution indices approach. Appl. Water Sci. 2020, 10, 186. [Google Scholar] [CrossRef]
- Maskooni, E.K.; Naseri-Rad, M.; Berndtsson, R.; Nakagawa, K. Use of heavy metal content and modified water quality index to assess groundwater quality in a semiarid area. Water 2020, 12, 1115. [Google Scholar] [CrossRef] [Green Version]
- Mohammadi, A.A.; Zarei, A.; Majidi, S.; Ghaderpoury, A.; Hashempour, Y.; Saghi, M.H.; Alinejad, A.; Yousefi, M.; Hosseingholizadeh, N.; Ghaderpoori, M. Carcinogenic and non-carcinogenic health risk assessment of heavy metals in drinking water of Khorramabad, Iran. MethodsX 2019, 6, 1642–1651. [Google Scholar] [CrossRef]

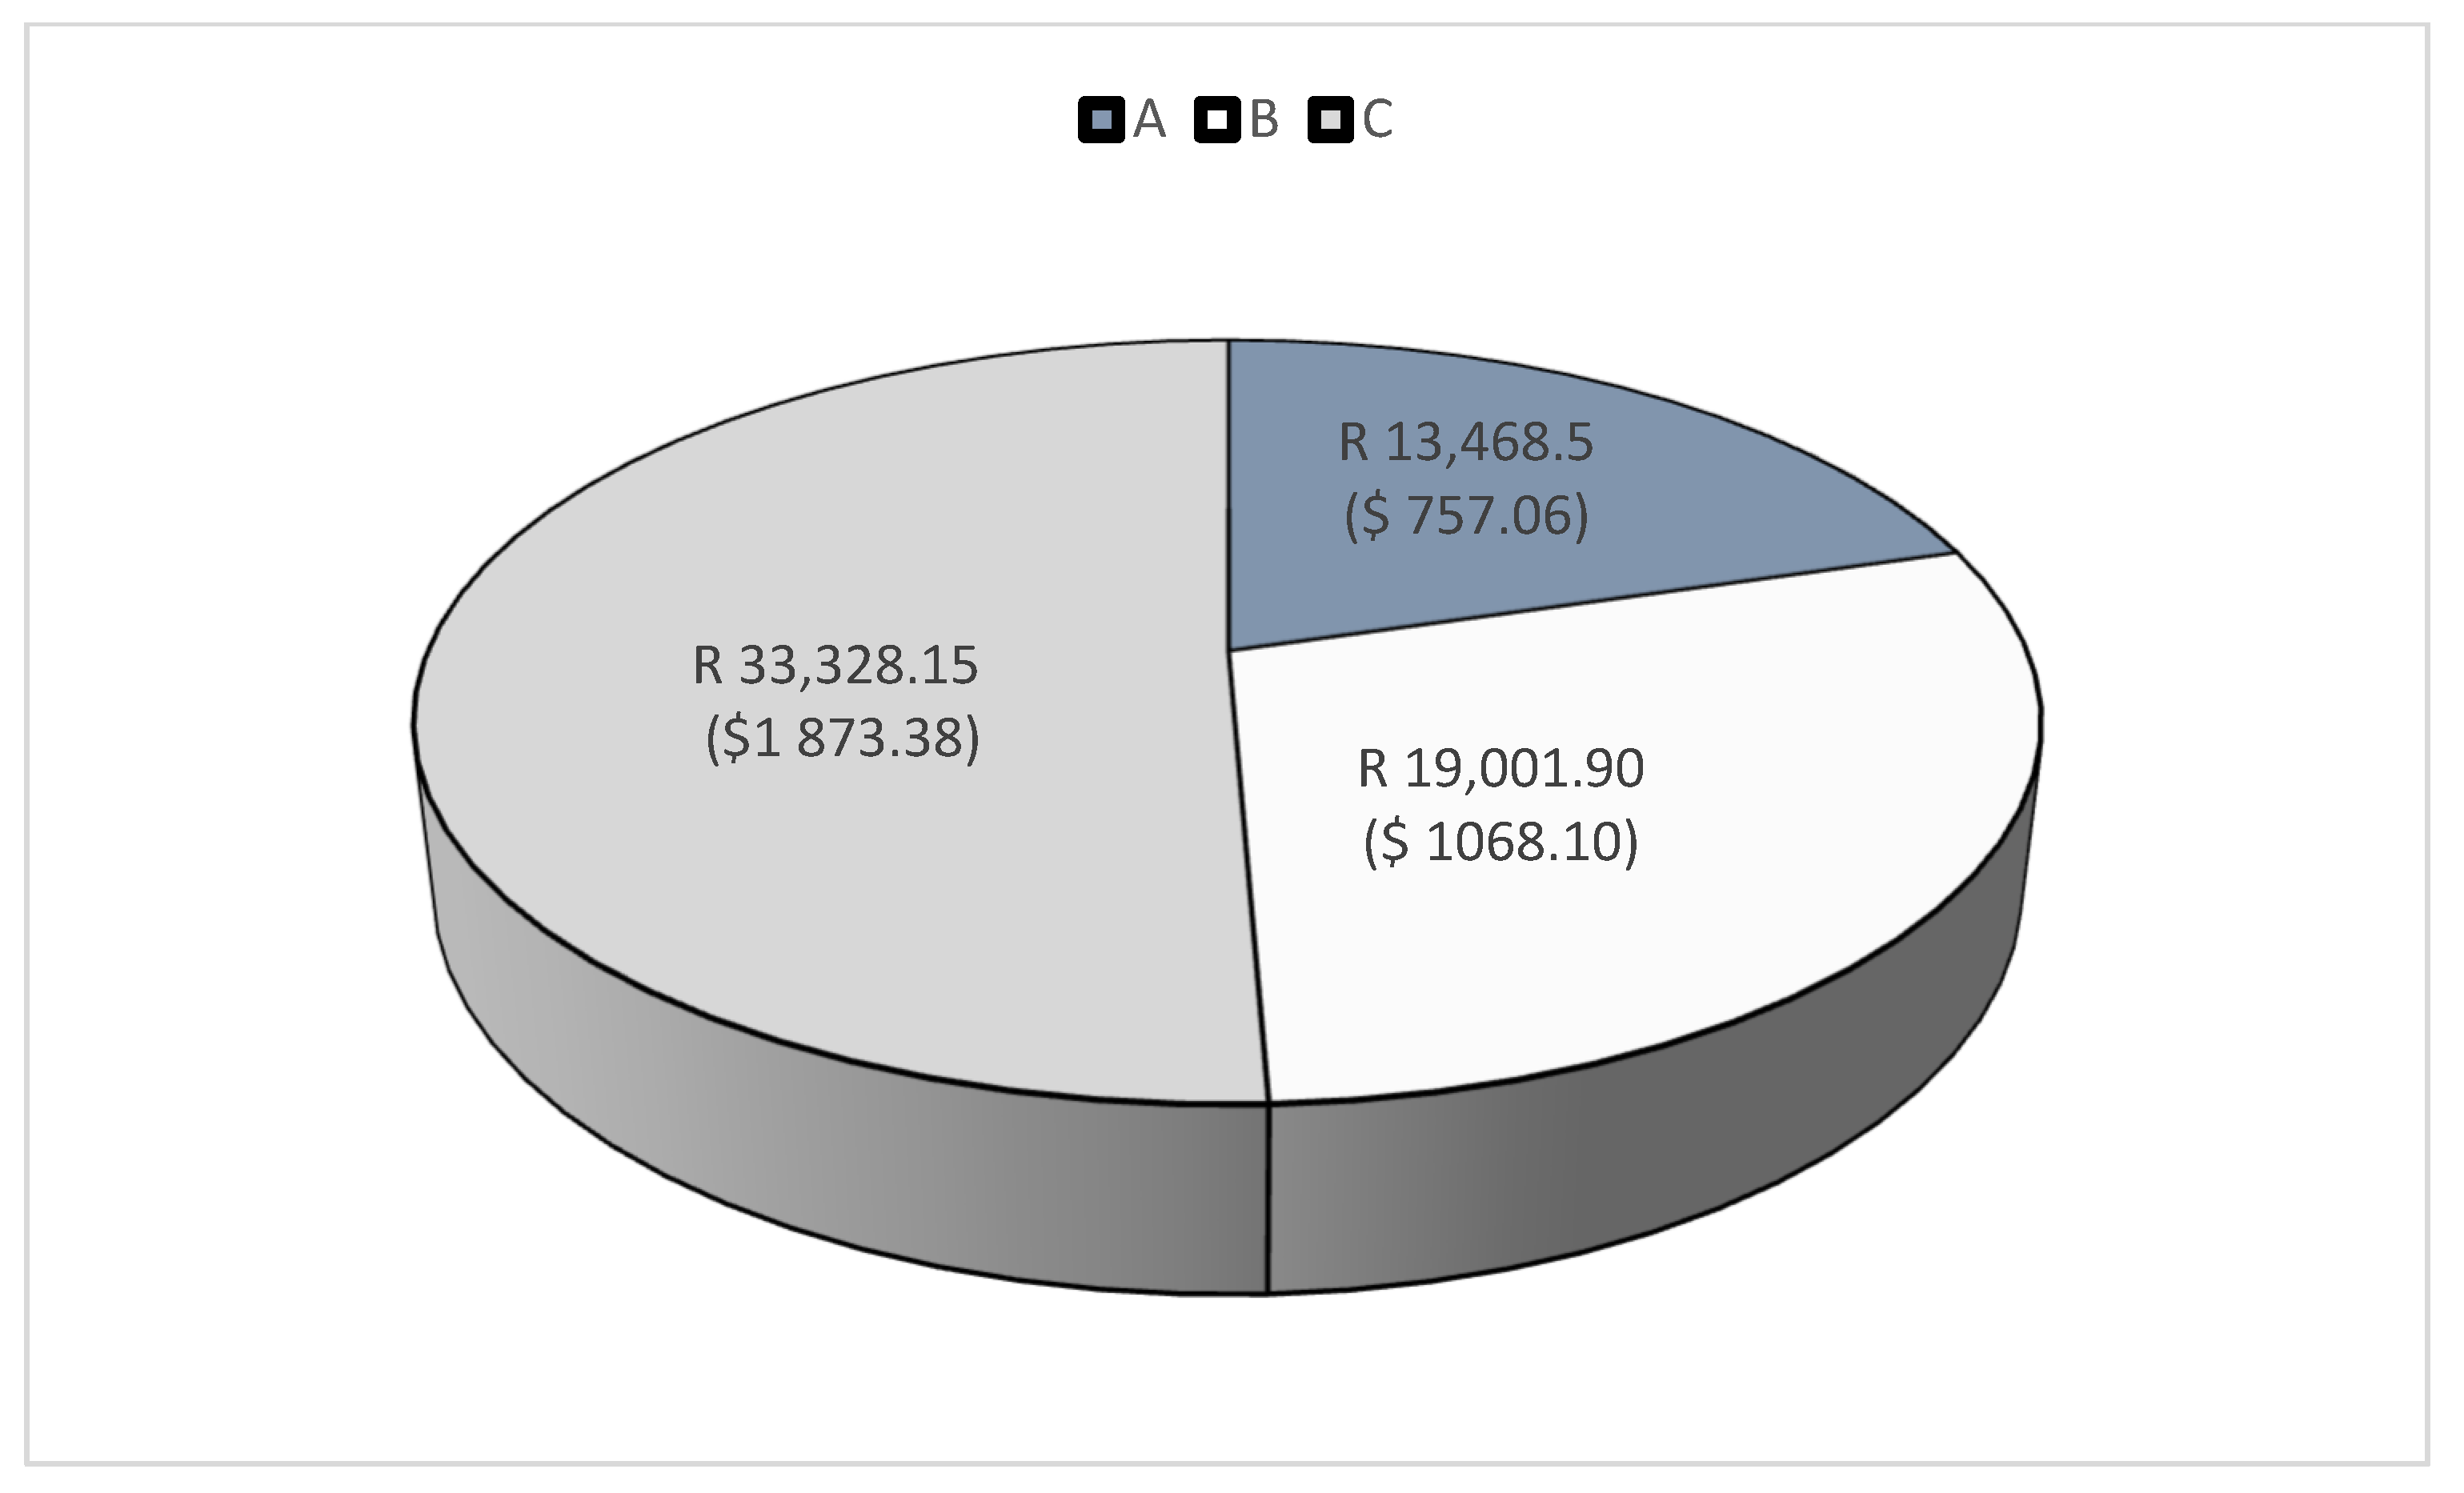
| Residence | Amount of Water per Day | |
|---|---|---|
| Litres/day | Rands/day | |
| A (n = 210) | 1845.37 | 39.90 ($2.20) |
| B (n = 180) | 2602.88 | 52.06 ($2.87) |
| C (n = 180) | 4565.31 | 91.31 ($5.03) |
| Total: | 9013.56 | 180.27 ($9.93) |
| Residence | Parameters | Min | Max | Average | Stdev | SANS 241 (2015) | WHO (2015) |
|---|---|---|---|---|---|---|---|
| A (n = 7) | Temperature (°C) | 28.0 | 30.3 | 29.08 | 0.90 | - | - |
| pH | 7.45 | 8.35 | 7.83 | 0.31 | ≥5 to ≤9.7 | 6.5 to 9.7 | |
| TDS (mg/L) | 160.0 | 630 | 460 | 219.43 | ≤1200 | 500 | |
| Salinity (ppm) | 74.5 | 85 | 79.6 | 3.52 | - | - | |
| EC (µS/cm) | 145.83 | 247.6 | 216.58 | 35.45 | ≤1700 | 600 | |
| B (n = 8) | Temperature (°C) | 27.0 | 27.6 | 27.28 | 0.22 | - | - |
| pH | 7.7 | 8.47 | 8 | 0.24 | ≥5 to ≤9.7 | 6.5 to 9.7 | |
| TDS (mg/L) | 116.6 | 646 | 432.94 | 269.1 | ≤1200 | 500 | |
| Salinity (ppm) | 75.7 | 85 | 80.05 | 3.42 | - | - | |
| EC (µS/cm) | 167.5 | 180.8 | 172.73 | 4.36 | ≤1700 | 600 | |
| C (n = 11) | Temperature (°C) | 28.2 | 29 | 28.52 | 0.24 | - | - |
| pH | 8.08 | 9.04 | 8.5 | 0.31 | ≥5 to ≤9.7 | 6.5 to 9.7 | |
| TDS (mg/L) | 117.1 | 126 | 120.6 | 2.72 | ≤1200 | 500 | |
| Salinity (ppm) | 77.7 | 85.4 | 81.01 | 2.52 | - | - | |
| EC (µS/cm) | 167.2 | 181.4 | 172.54 | 4.79 | ≤1700 | 600 |
| Residence | Trace Metal (µg/L) | Min | Max | Average | Stdev | SANS 241 (µg/L) (2015) | WHO (µg/L) (2015) |
|---|---|---|---|---|---|---|---|
| A (n = 7) | Mn | 7.36 | 9.73 | 8.30 | 0.95 | ≤50 | 50 |
| Co | 0.07 | 0.1 | 0.08 | 0.01 | ≤500 | - | |
| Ni | 1.6 | 2.9 | 2.06 | 0.46 | ≤2000 | 2000 | |
| Zn | 16.1 | 21.74 | 18.55 | 2.02 | ≤6 | 1 | |
| Hg | 0.07 | 0.45 | 0.22 | 0.17 | ≤400 | 100 | |
| Cu | 2.13 | 43.97 | 15.17 | 14.35 | ≤70 | 50,000 | |
| Cr | 2.16 | 4.71 | 2.94 | 0.9 | ≤5 | 3000 | |
| B (n = 8) | Mn | 7.62 | 12.42 | 9.57 | 1.84 | ≤50 | 50 |
| Co | 0.06 | 0.1 | 0.08 | 0.01 | ≤500 | - | |
| Ni | 1.45 | 2.98 | 2.03 | 0.48 | ≤2000 | 2000 | |
| Zn | 15.16 | 28.53 | 19.72 | 4.22 | ≤6 | 1 | |
| Hg | 0.05 | 0.48 | 0.2 | 0.14 | ≤400 | 100 | |
| Cu | 8.17 | 95.38 | 33.08 | 29.95 | ≤70 | 50,000 | |
| Cr | 1.42 | 3.13 | 2.39 | 0.61 | ≤5 | 3000 | |
| C (n = 10) | Mn | 1.55 | 10.66 | 7.76 | 2.98 | ≤50 | 50 |
| Co | 0.03 | 0.13 | 0.08 | 0.03 | ≤500 | - | |
| Ni | 0.18 | 3.7 | 1.98 | 1.01 | ≤2000 | 2000 | |
| Zn | 8.3 | 44.68 | 21.25 | 9.82 | ≤6 | 1 | |
| Hg | 0.05 | 1.66 | 0.39 | 0.49 | ≤400 | 100 | |
| Cu | 0.34 | 97.66 | 39.49 | 40.77 | ≤70 | 50,000 | |
| Cr | 0.14 | 5.96 | 2.75 | 1.64 | ≤5 | 3000 |
| Residence | Trace Metals (µg/L) | Unit Weightage (Wi) | Sub-index (Qi) | Wi × Qi |
|---|---|---|---|---|
| A (n = 7) | Cr | 0.002 | 24.383 | 0.049 |
| Co | 0.001 | 99.985 | 0.1 | |
| Cu | 0.001 | 97.198 | 0.049 | |
| Hg | 0.2 | 18.25 | 3.65 | |
| Mn | 0.001 | 10.181 | 0.010 | |
| Ni | 0.003 | 74.04 | 0.212 | |
| Zn | 0.1 | 285.3 | 28.53 | |
| HPI = 2.92 | ||||
| B (n = 8) | Cr | 0.002 | 24.363 | 0.049 |
| Co | 0.001 | 99.983 | 0.1 | |
| Cu | 0.001 | 95.352 | 0.048 | |
| Hg | 0.2 | 22.625 | 4.525 | |
| Mn | 0.001 | 10.186 | 0.010 | |
| Ni | 0.003 | 73.79 | 0.211 | |
| Zn | 0.1 | 232.4 | 23.24 | |
| HPI = 2.38 | ||||
| C (n = 10) | Cr | 0.002 | 24.52 | 0.049 |
| Co | 0.001 | 99.987 | 0.1 | |
| Cu | 0.001 | 94.41 | 0.047 | |
| Hg | 0.2 | 3.6 | 0.72 | |
| Mn | 0.001 | 10.413 | 0.010 | |
| Ni | 0.003 | 74.338 | 0.212 | |
| Zn | 0.1 | 242.1 | 24.21 | |
| HPI = 2.47 | ||||
| Total: HPI = 7.77 | ||||
| Residence | RfD | Trace Metals | Min | Max | Average | Stdev |
|---|---|---|---|---|---|---|
| A (n = 7) | 24 | Mn | 0.01 | 0.01 | 0.01 | 0.00 |
| 0.3 | Co | 0.01 | 0.01 | 0.01 | 0.00 | |
| 20 | Ni | 0.00 | 0.00 | 0.00 | 0.00 | |
| 300 | Zn | 0.00 | 0.00 | 0.00 | 0.00 | |
| 0.3 | Hg | 0.01 | 0.05 | 0.02 | 0.01 | |
| 40 | Cu | 0.00 | 0.03 | 0.01 | 0.01 | |
| 3 | Cr | 0.02 | 0.05 | 0.03 | 0.01 | |
| HI (Total) | 0.05 | 0.15 | 0.08 | 0.03 | ||
| B (n = 8) | 24 | Mn | 0.01 | 0.02 | 0.01 | 0.00 |
| 0.3 | Co | 0.01 | 0.01 | 0.01 | 0.00 | |
| 20 | Ni | 0.00 | 0.00 | 0.00 | 0.00 | |
| 300 | Zn | 0.00 | 0.00 | 0.00 | 0.00 | |
| 0.3 | Hg | 0.01 | 0.05 | 0.02 | 0.01 | |
| 40 | Cu | 0.01 | 0.07 | 0.03 | 0.02 | |
| 3 | Cr | 0.01 | 0.03 | 0.03 | 0.01 | |
| HI (Total) | 0.05 | 0.18 | 0.10 | 0.04 | ||
| C (n = 10) | 24 | Mn | 0.00 | 0.01 | 0.01 | 0.00 |
| 0.3 | Co | 0.00 | 0.01 | 0.01 | 0.00 | |
| 20 | Ni | 0.00 | 0.01 | 0.00 | 0.00 | |
| 300 | Zn | 0.00 | 0.00 | 0.00 | 0.00 | |
| 0.3 | Hg | 0.01 | 0.17 | 0.04 | 0.05 | |
| 40 | Cu | 0.00 | 0.08 | 0.03 | 0.03 | |
| 3 | Cr | 0.00 | 0.06 | 0.03 | 0.02 | |
| HI (Total) | 0.01 | 0.34 | 0.12 | 0.10 |
Disclaimer/Publisher’s Note: The statements, opinions and data contained in all publications are solely those of the individual author(s) and contributor(s) and not of MDPI and/or the editor(s). MDPI and/or the editor(s) disclaim responsibility for any injury to people or property resulting from any ideas, methods, instructions or products referred to in the content. |
© 2023 by the authors. Licensee MDPI, Basel, Switzerland. This article is an open access article distributed under the terms and conditions of the Creative Commons Attribution (CC BY) license (https://creativecommons.org/licenses/by/4.0/).
Share and Cite
Netshitanini, M.; Adeeyo, A.O.; Edokpayi, J.N. Determinants and Evaluation of Onsite Water Loss Due to Leakages in a Selected Institution in South Africa. Water 2023, 15, 217. https://doi.org/10.3390/w15020217
Netshitanini M, Adeeyo AO, Edokpayi JN. Determinants and Evaluation of Onsite Water Loss Due to Leakages in a Selected Institution in South Africa. Water. 2023; 15(2):217. https://doi.org/10.3390/w15020217
Chicago/Turabian StyleNetshitanini, Mahanyele, Adeyemi Ojutalayo Adeeyo, and Joshua Nosa Edokpayi. 2023. "Determinants and Evaluation of Onsite Water Loss Due to Leakages in a Selected Institution in South Africa" Water 15, no. 2: 217. https://doi.org/10.3390/w15020217