Article

A Model Predicting the Maximum Face Slab Deflection of Concrete-Face Rockfill Dams: Combining Improved Support Vector Machine and Threshold Regression

1
State Key Laboratory of Eco-Hydraulics in Northwest Arid Region, Xi’an University of Technology, Xi’an 710048, China
2
Shaanxi Province Institute of Water Resources and Electric Power Investigation and Design, Xi’an 710001, China
*
Author to whom correspondence should be addressed.
Water 2023, 15(19), 3474; https://doi.org/10.3390/w15193474
Submission received: 20 July 2023 / Revised: 22 September 2023 / Accepted: 27 September 2023 / Published: 2 October 2023

Abstract

:
The deformation of concrete-face rockfill dams (CFRDs) is a key parameter for the safety control of reservoir and dam systems. Rapid and accurate estimation of the deformation characteristics of CFRDs is a top priority. To realize this, we proposed a new model for predicting the maximum face slab deflection (FD) of CFRDs, combining the threshold regression (TR) and the improved support vector machine (SVM). In this paper, based on the collected 71 real measurement data from engineering examples, we constructed an adaptive hybrid kernel function with high precision and generalization ability. We optimized the selection of the main parameters of the SVM by a particle swarm optimization (PSO) algorithm. Meanwhile, we clustered the deformation parameters according to the dam height by the TR. It significantly contributes to the accuracy and generalization of the model. Finally, a prediction model for the FD characteristics of CFRDs combining TR and improved SVM was developed. The new prediction model can overcome the nonlinear abrupt feature of the sample data and achieve high precision with R2 greater than 0.8 in the final testing set. Our model is more accurate with faster convergence compared to the previous model. This study provides a more accurate model for predicting maximum face slab deflection and lays the foundation for safety control and evaluation of dams.

1. Introduction

The concrete-face rockfill dam (CFRD) is supported by a rockfill body and adopts an upstream concrete-face slab as an antiseepage structure [1]. It has the advantages of strong adaptability to foundation conditions, being able to use materials locally, occupying less arable land, saving investment, having a fast construction speed, and better safety. Due to the advantages, a large quantity of CFRDs have been constructed all over the world [2].
Excessive deformation of the dam body can easily cause cracking or even damage to the impermeable structure. The quantitative analysis of the concrete-face deformation is critical for safety assessment and the prevention of deformation damage. This phenomenon, in turn, can result in excessive leakage. For example, the CFRD of Gouhou in China and the Mohale in Lesotho [3] had varying degrees of failure risk due to the deformation and crack of the dam body [4]. Accurate prediction of the deformation characteristics of concrete faces is essential for the design and safety evaluation of CFRDs.
Traditional empirical methods take only a few influencing factors into account and have relatively large prediction errors. Furthermore, only a small number of dams are applicable to traditional empirical methods. Then, the intelligent algorithms have been raised in the field. Ren et al. [5] adopted the long, short-term memory model to establish a reliable displacement prediction model. Jia and Chi. [6] used the PSO algorithm to predict displacements of the soil parameters of the Malutang II dam. Ma et al. [7] located microseismic events by the fully convolutional neural network. Mostafaei et al. [8] developed a new automatic modal identification algorithm of ensemble learning to identify the modal parameters. Marandi et al. [9] predicted the settlement of CFRDs based on a genetic programming algorithm. The problems of the neural network model are obtaining local optimum solutions and slow convergence of the learning process. As can be seen, traditional intelligent algorithms usually suffer from the problem of failure to converge or slow convergence. Wen et al. [1] showed that the settlement characteristics of CFRDs are affected by several factors, and there is an obvious nonlinear relationship between the deformation characteristics and the influencing factors, while different influencing factors are often related to each other. Besides, Wen et al. [10] established an SVM prediction model to predict the crest settlement of CFRDs.
SVM is a machine learning algorithm developed from statistical theory. It is an available means to deal with the regression of nonlinear data. It also has wide applications in computer vision and data mining. SVM is mainly used to search the feature vectors of samples by kernel function and find the hyperplane that can optimally distinguish data to maximize the distance from each type of data to the hyperplanes. It can also clearly distinguish different types of data samples to achieve classification purposes. SVM models are usually utilized by many scholars to build a deformation prediction model. Furthermore, they combined SVM models with wavelet analysis and a PSO algorithm [11,12,13]. For example, Salkhordeh et al. [14] used SVM for detecting damage in concrete bridges. Ren et al. [15] applied SVM to the time-dependent prediction of dams and achieved better results. Although there are many factors affecting the deformation characteristics of a dam concrete face, coupled with the complex database features, it is easy to process the data and get results for SVM. At present, SVM is mainly used for the prediction of aging deformation. However, there is little research on data mining and building prediction models for multiple engineering example databases. There is a need for further research on concrete-face deformation prediction models based on SVM for CFRDs.
Although the improved SVM prediction model achieves better prediction results than the basic SVM prediction model, there is still a large error between the measured and predicted FD. The FD data of CFRDs have obvious nonlinear abrupt and jump characteristics. These specific data can deteriorate the generalization ability. Because the decision function depends on the sample points (“support vectors”) closest to the hyperplane, the accuracy of the calculation is determined by the support vector. Some sample points are too “outstanding”; they will be eliminated as outliers. The basic theory of SVM is shown in Figure 1.
To avoid the nonlinear abrupt and jump characteristics, this paper introduces the TR method to the SVM model. Firstly, we apply the TR theory to classify the CFRD example data into segments according to the relevant variables. Then, we build a prediction model based on each segment database. The TR prediction model is a nonlinear time-series model that effectively describes complex phenomena with abrupt changes, quasiperiodicity, and segmental dependence [16]. Its basic idea is to use different prediction models for different situations by the judgment of threshold. Mustafa Kocoglu et al. [17] used quantile and TR methods to measure the carbon dioxide emission affected by urbanization. Takumi Saegusa et al. [18] select variables in HIV drug adherence data using the TR Model. However, the TR prediction model has little application in the prediction deformation and safety control of hydraulic engineering.
In this paper, to achieve high precision with faster convergence, we innovatively optimize the main parameters of the SVM regression model using a PSO algorithm to establish an improved SVM prediction model. First, we collected measured deformation data of 71 CFRDs from the relevant papers [19] (see Supporting Information Table S1). We propose an adaptive hybrid kernel function suitable for predicting the deformation characteristics of CFRDs. Then, clustering of example databases using the TR theory improves prediction results and includes nonlinear sample data. Finally, an FD prediction model combining TR and improved SVM is established. The work of this paper can serve as an alternative for the precision prediction of the slab deflection of CFRDs and lay the foundation for dam safety and evaluation. The Variables, Acronyms and Terms related to the paper are shown in the Table 1.

2. Method

2.1. The SVM Algorithm

The SVM algorithm predicted the dam deformation by solving the nonlinear regression problem using kernel functions to map the sample data to a hyperspace [20]. We set the FD (y) as the label, and set dam height (X1), void ratio (X2), valley shape (X3), foundation types (X4), rockfill strength (X5), and operation time (X6) as the inputs, the mathematical mapping relationship between the output and input variables exists as:
y = f { X 1 , X 2 , X 3 , X 4 , X 5 , X 6 }
With the sample set D = {(x1s, y1), (x2s, y2), …, (xms, ym)}, the regression formula is obtained as:
f ( x ) = w x + b
where w = (w1, w2, …, wm)T is the weight coefficient, and b is the intercept distance. We introduce the Lagrange multipliers α, α* to transform the above convex quadratic optimization problem into a pairwise problem. The final regression function is obtained as:
f ( x ) = x i S V ( α i α i ) K ( x i , x ) + b
where K(xi,x) is the kernel function. The performance of the model depends on kernel functions, and different sample information should be selected for corresponding adaptive kernel functions. Then, in the case of selected kernel functions, it is also crucial to optimize their corresponding parameters.

2.2. Kernel Functions and Parameter Optimization

The poly function and RBF are usually used as the SVM kernel, showing as follows, respectively [10]:
K ( x , x ) = ( ( x , x ) + c ) d
K ( x , x ) = exp ( | | x , x | | 2 2 σ 2 )
where x and x′ are the input data; d is the poly kernel function exponent; c is the penalty term; and σ is the RBF kernel function parameter. The focus of improving the model is to select a befitting kernel function. Because of the high dispersion and high susceptibility by many factors of the CFRDs, we construct a smoothly combined hybrid kernel function based on the poly function and RBF kernel function. This hybrid kernel integrated the advantages of both kernel functions:
K m i x = η K p o l y + ( 1 η ) K r b f
where Kpoly is the polynomial kernel function, Krbf is the Gauss basis function, and η is the hybrid weight. The magnitude of the action of the two characteristic kernel functions is adjusted by adjusting the weighting coefficients so that the hybrid kernel function can be used for different data sample information.
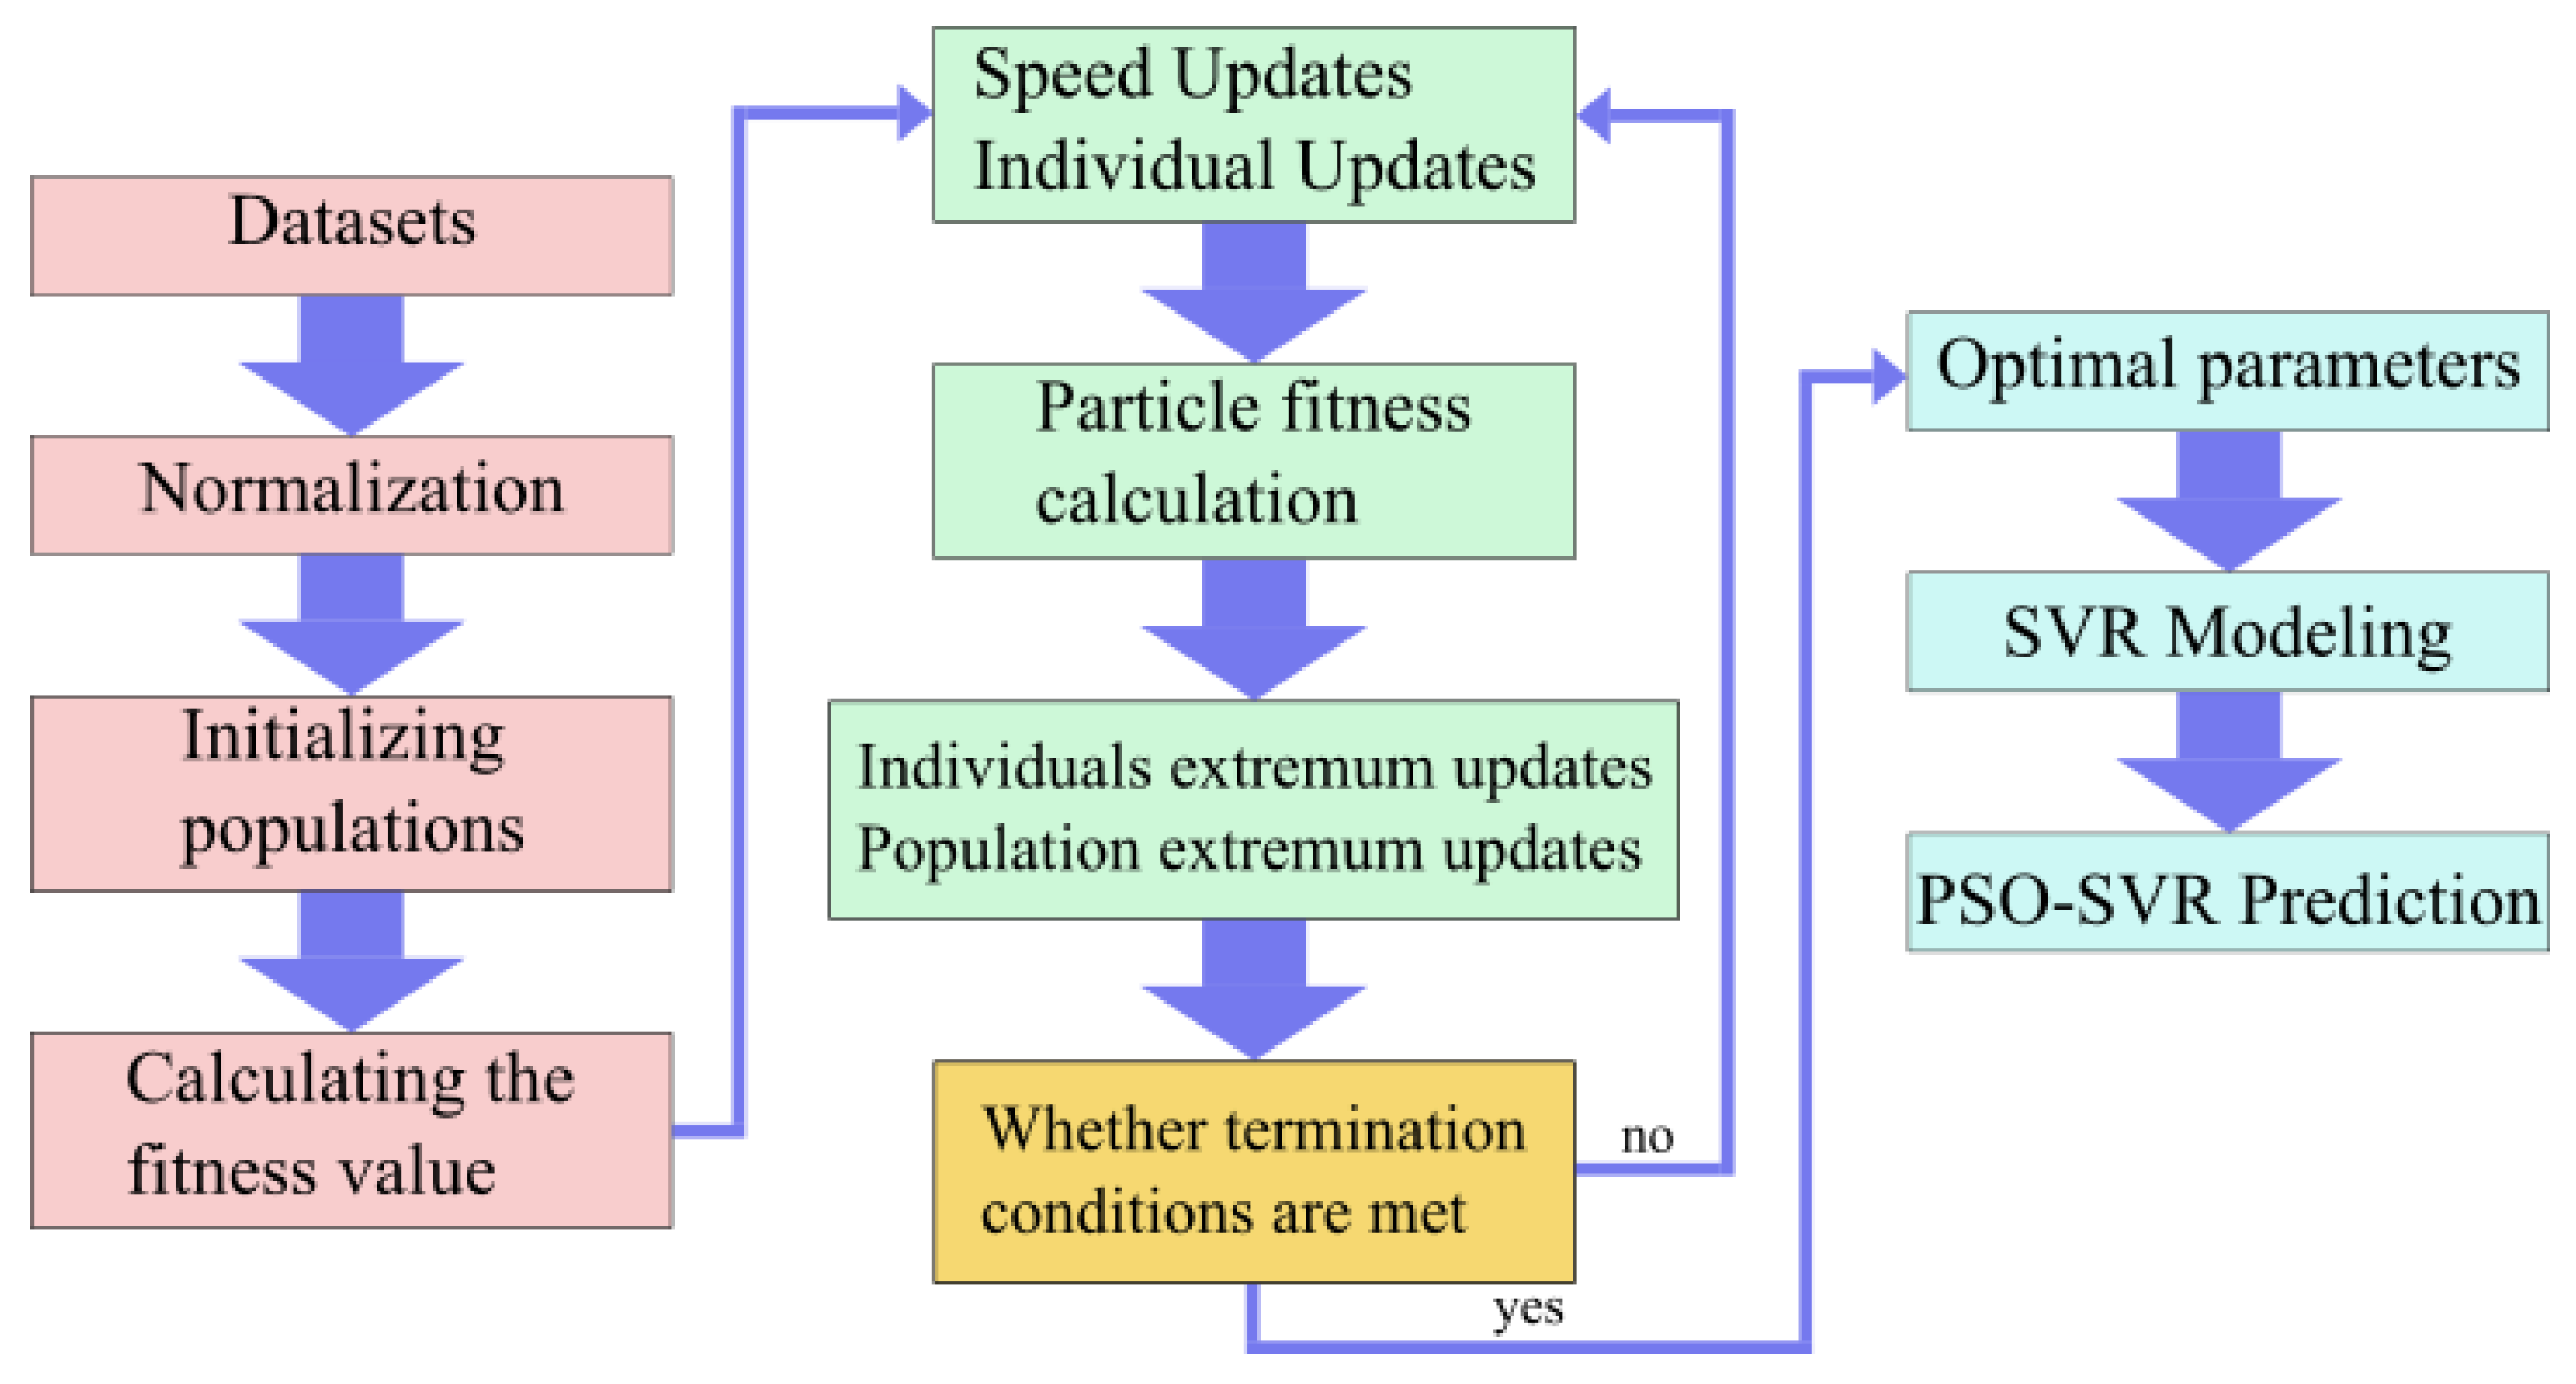
Optimization methods for the model hyperparameter search include nonheuristic methods based on analysis and intelligent optimization methods based on heuristics. Particle swarm optimization (PSO) is currently a popular intelligent optimization method with higher accuracy and speed. Figure 2 shows the flow chart of the PSO algorithm to achieve parameter optimization. The parameters to be adjusted include the regularization parameter C, the multiform kernel parameter d, the radial basis kernel parameter σ2, and the coefficient η. Here, C is used to control the fitting error of the function. The fitting error becomes smaller as σ2 becomes smaller, and the corresponding training time becomes longer. Besides, too small a value of σ2 will lead to the phenomenon of “overfitting”. The modeling process uses an insensitive loss function with ε = 0.01 and takes the parameter g = 1/2σ2 instead of the kernel parameter. The variations of σ2, η are used as the mixed weight coefficient. They can adjust the range and size of the two characteristic kernel functions according to the distribution of sample data.

2.3. Modeling Steps for the SVM Prediction Model

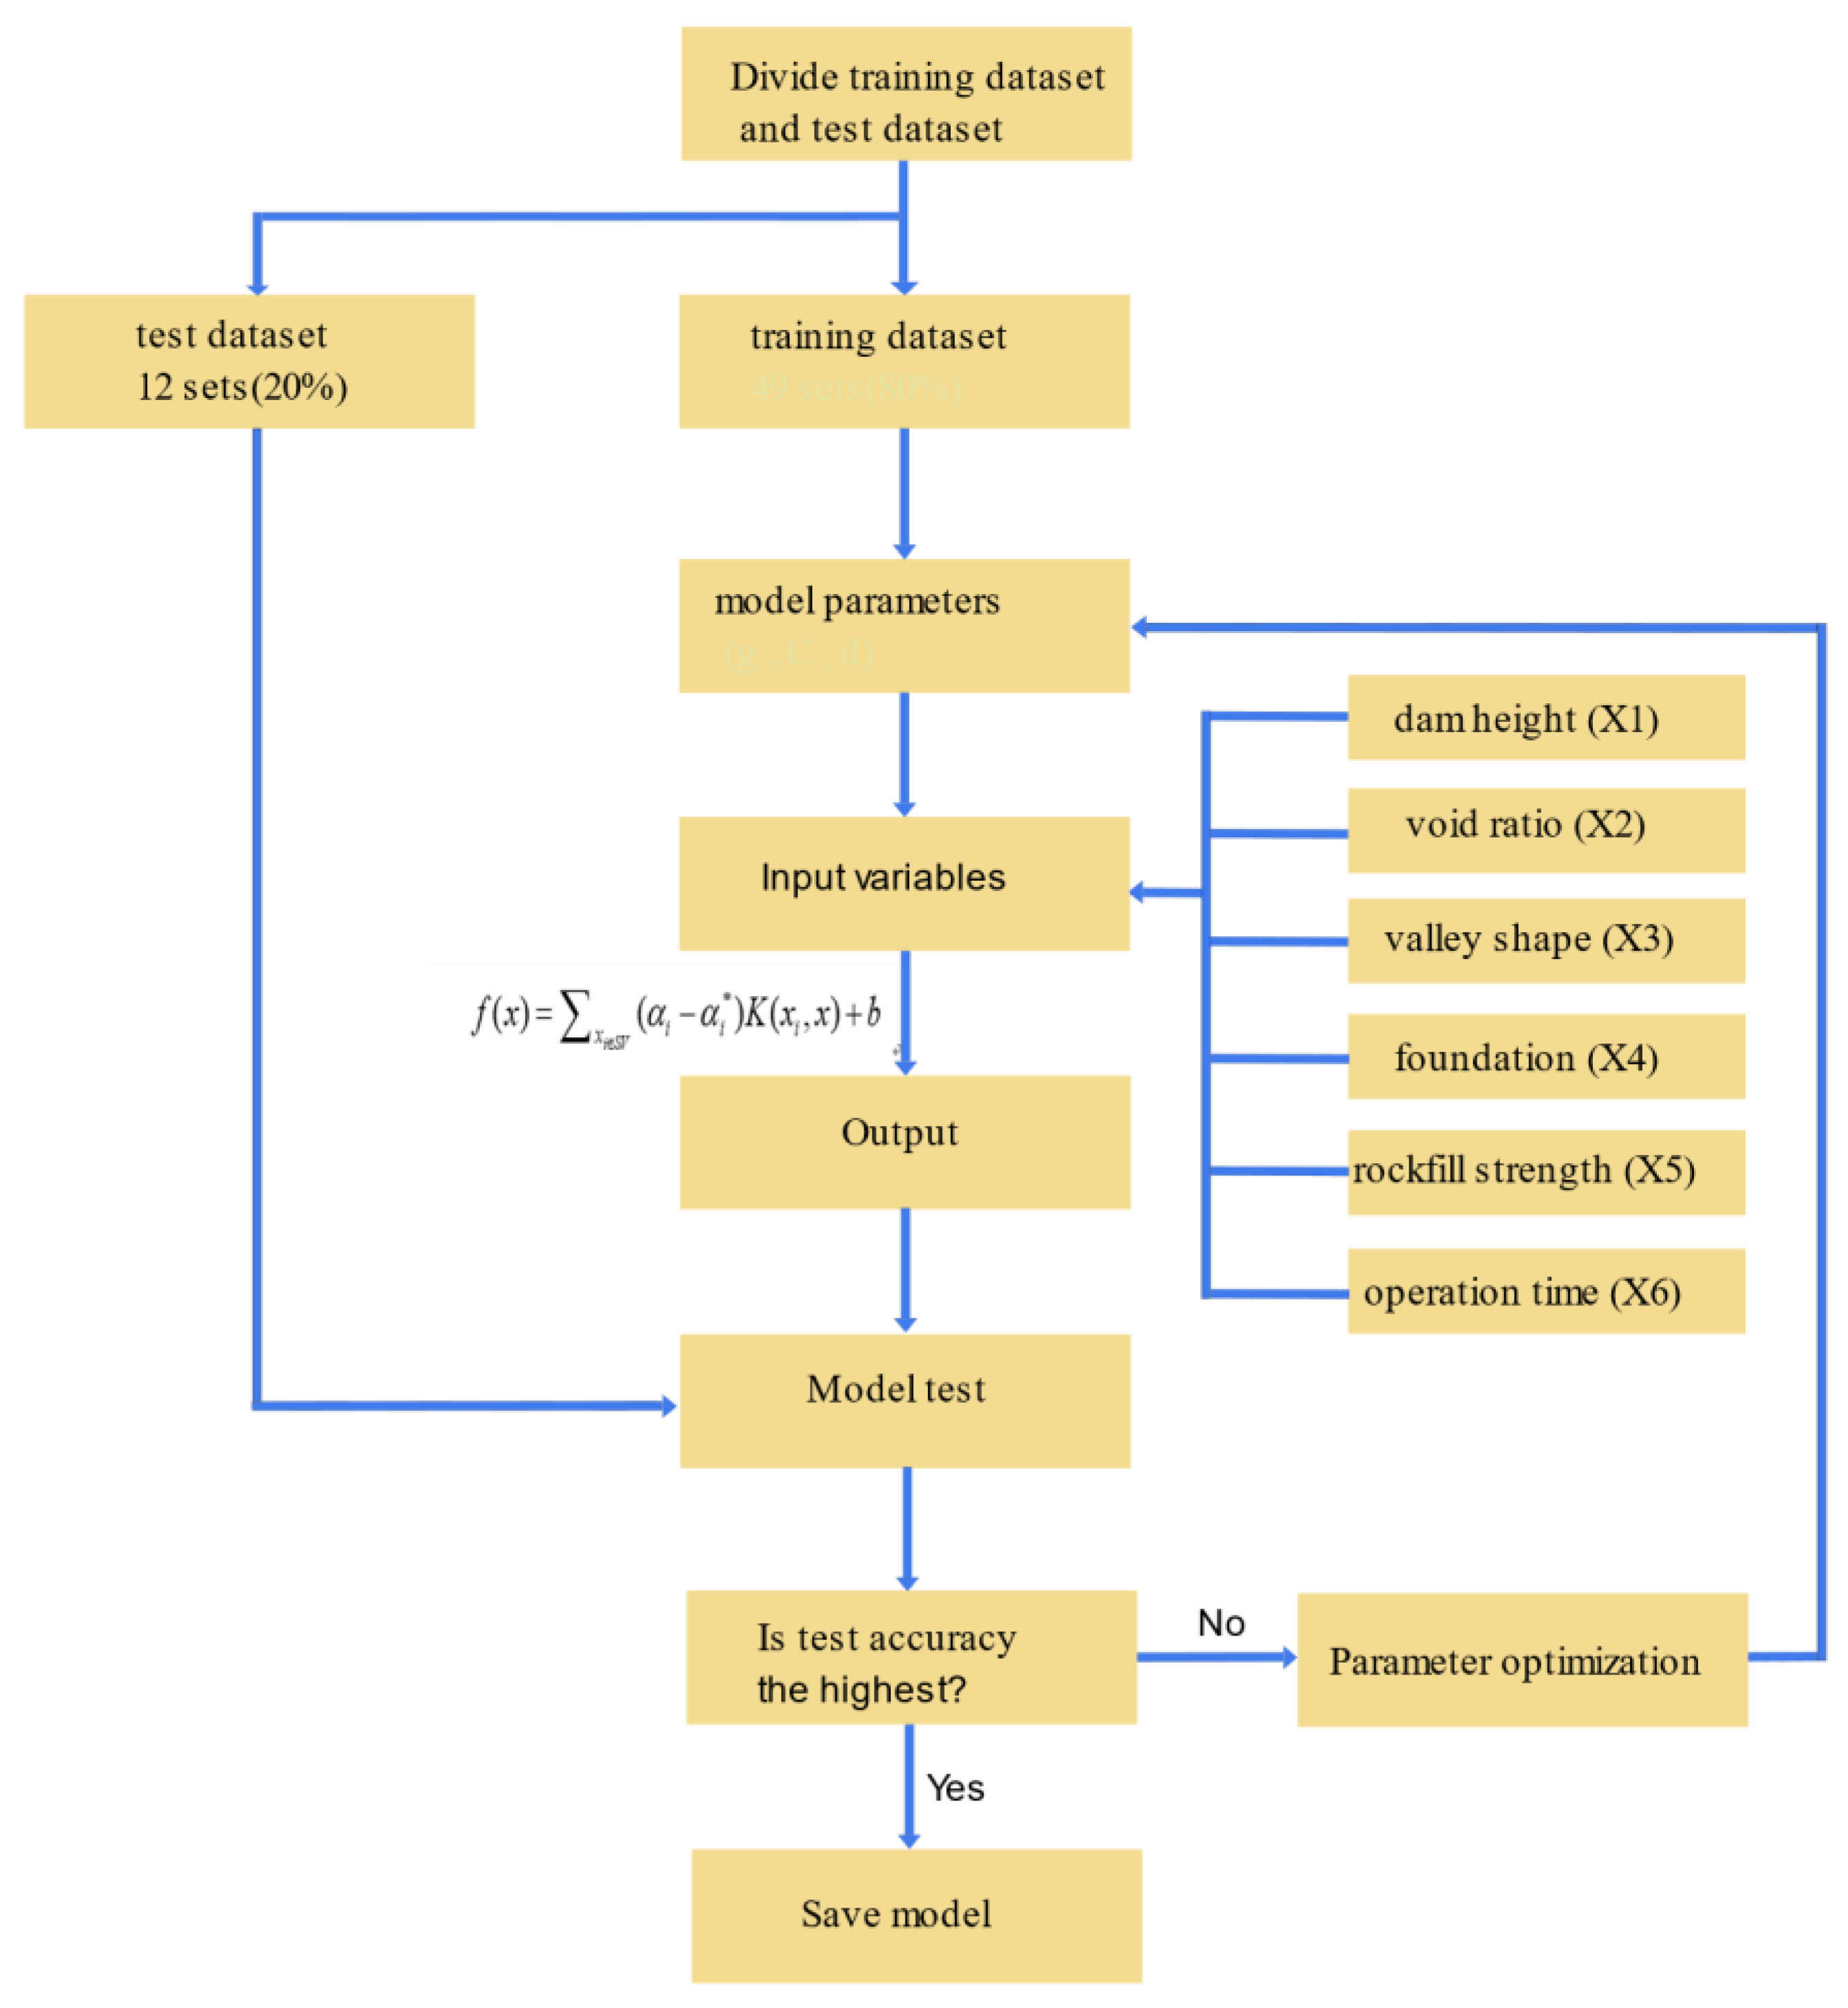
According to the above theory, the improved SVM model based on grid search (GS)-SVM and PSO-SVM for the FD prediction is established. The prediction model between the FD and the six main variables is established through the following steps:
(1)
Data selection. Since the engineering information of some instances is not complete, it is necessary to select the instances, including the FD and all control variables data from the collected instance database. The selected samples should accord with the real situation to reduce the errors. The final 71 data contain 61 instances with detailed concrete face deformation and six with the controlled variables data.
(2)
Sample preprocessing. Firstly, the collected CFRD instance data were randomly divided into training and test sets. The initial parameters were obtained from the training set, and then the adjusted parameters were obtained from the test set. From the selected instance database, 49 sets (80%) were randomly selected as training samples and the latter 12 sets (20%) as test samples. To avoid the effect of quantitative differences between different variables, the sample input and output quantities were normalized into [0, 1]. For each dimensional variable, the normalization was performed as follows:
X i = X i X min X max X min
where Xi is the sample data, Xmin is the minimum value, and Xmax is the maximum value. After normalization, the data are within [0, 1], which can reduce the error caused by the large difference in data orders.
(3)
Optimal selection of model parameters. To compare the results of different kernel functions, we adopt two different kernel functions to model for regression prediction for the maximum FD of CFRDs. To avoid certain blindness, the approximate ranges of the initialized parameter optimization are given as η = [0, 1], g = [−20, 20], C = [−20, 20], and d = [1, 4]. To show the reliability of parameter optimization algorithms, both the GS and the PSO are used for the optimal selection of parameters of different kernel functions in SVM models.
(4)
Model evaluation index. We measure the performance of the trained model by the root mean squared error RMSE and the correlation coefficient R2. The RMSE and R2 are given by the following equation:
R M S E = 1 N i = 1 N ( y i y ^ i ) 2
R 2 = 1 i = 1 N ( y i y ^ i ) 2 i = 1 N ( y i y ¯ ) 2
where n is the number of samples, yi is the measured values, y ^ i is the predicted values, y ¯ is the mean values of the measured values, and R2 is the determinable coefficient.
The root mean squared error RMSE is used to calculate the training and prediction fit errors of the samples. The determinable coefficient R2 is used to characterize the evaluation parameter of the correlation between the above-predicted and measured values. Its value is between 0 and 1. When R2 is closer to 1, the stronger the correlation is and the better the prediction is; otherwise, the worse it is. The training process is in Figure 3.

2.4. Prediction Model Combining TR and Improved SVM

We assume that the sample data are {yi, xi, qi}n, where qi is the threshold variable. The threshold variable is used to classify the sample and can also be used as an explanatory variable to explain a part of the dependent variable. They are assumed known and there are differences in the samples at different intervals. The relationship between the variables can be expressed as follows:
y i = β 1 x i I ( q i γ 1 ) + β 2 x i I ( γ 1 < q i γ 2 ) + e i
where γ is the threshold value, yi is the typical deformation parameter of a CFRD, xi is the control variables, I(·) is the indicative function, and ei is the random disturbance terms.
Before applying the threshold model, the most important task is to check whether there is a threshold effect. The specific practice can be found in the paper [21]. Enders [22] summarized a method for observing and testing threshold effects, namely the “sum of squares total-threshold graph method” (SSR-γ graph method), which is used to check the reasonableness of determining threshold variables and threshold values.
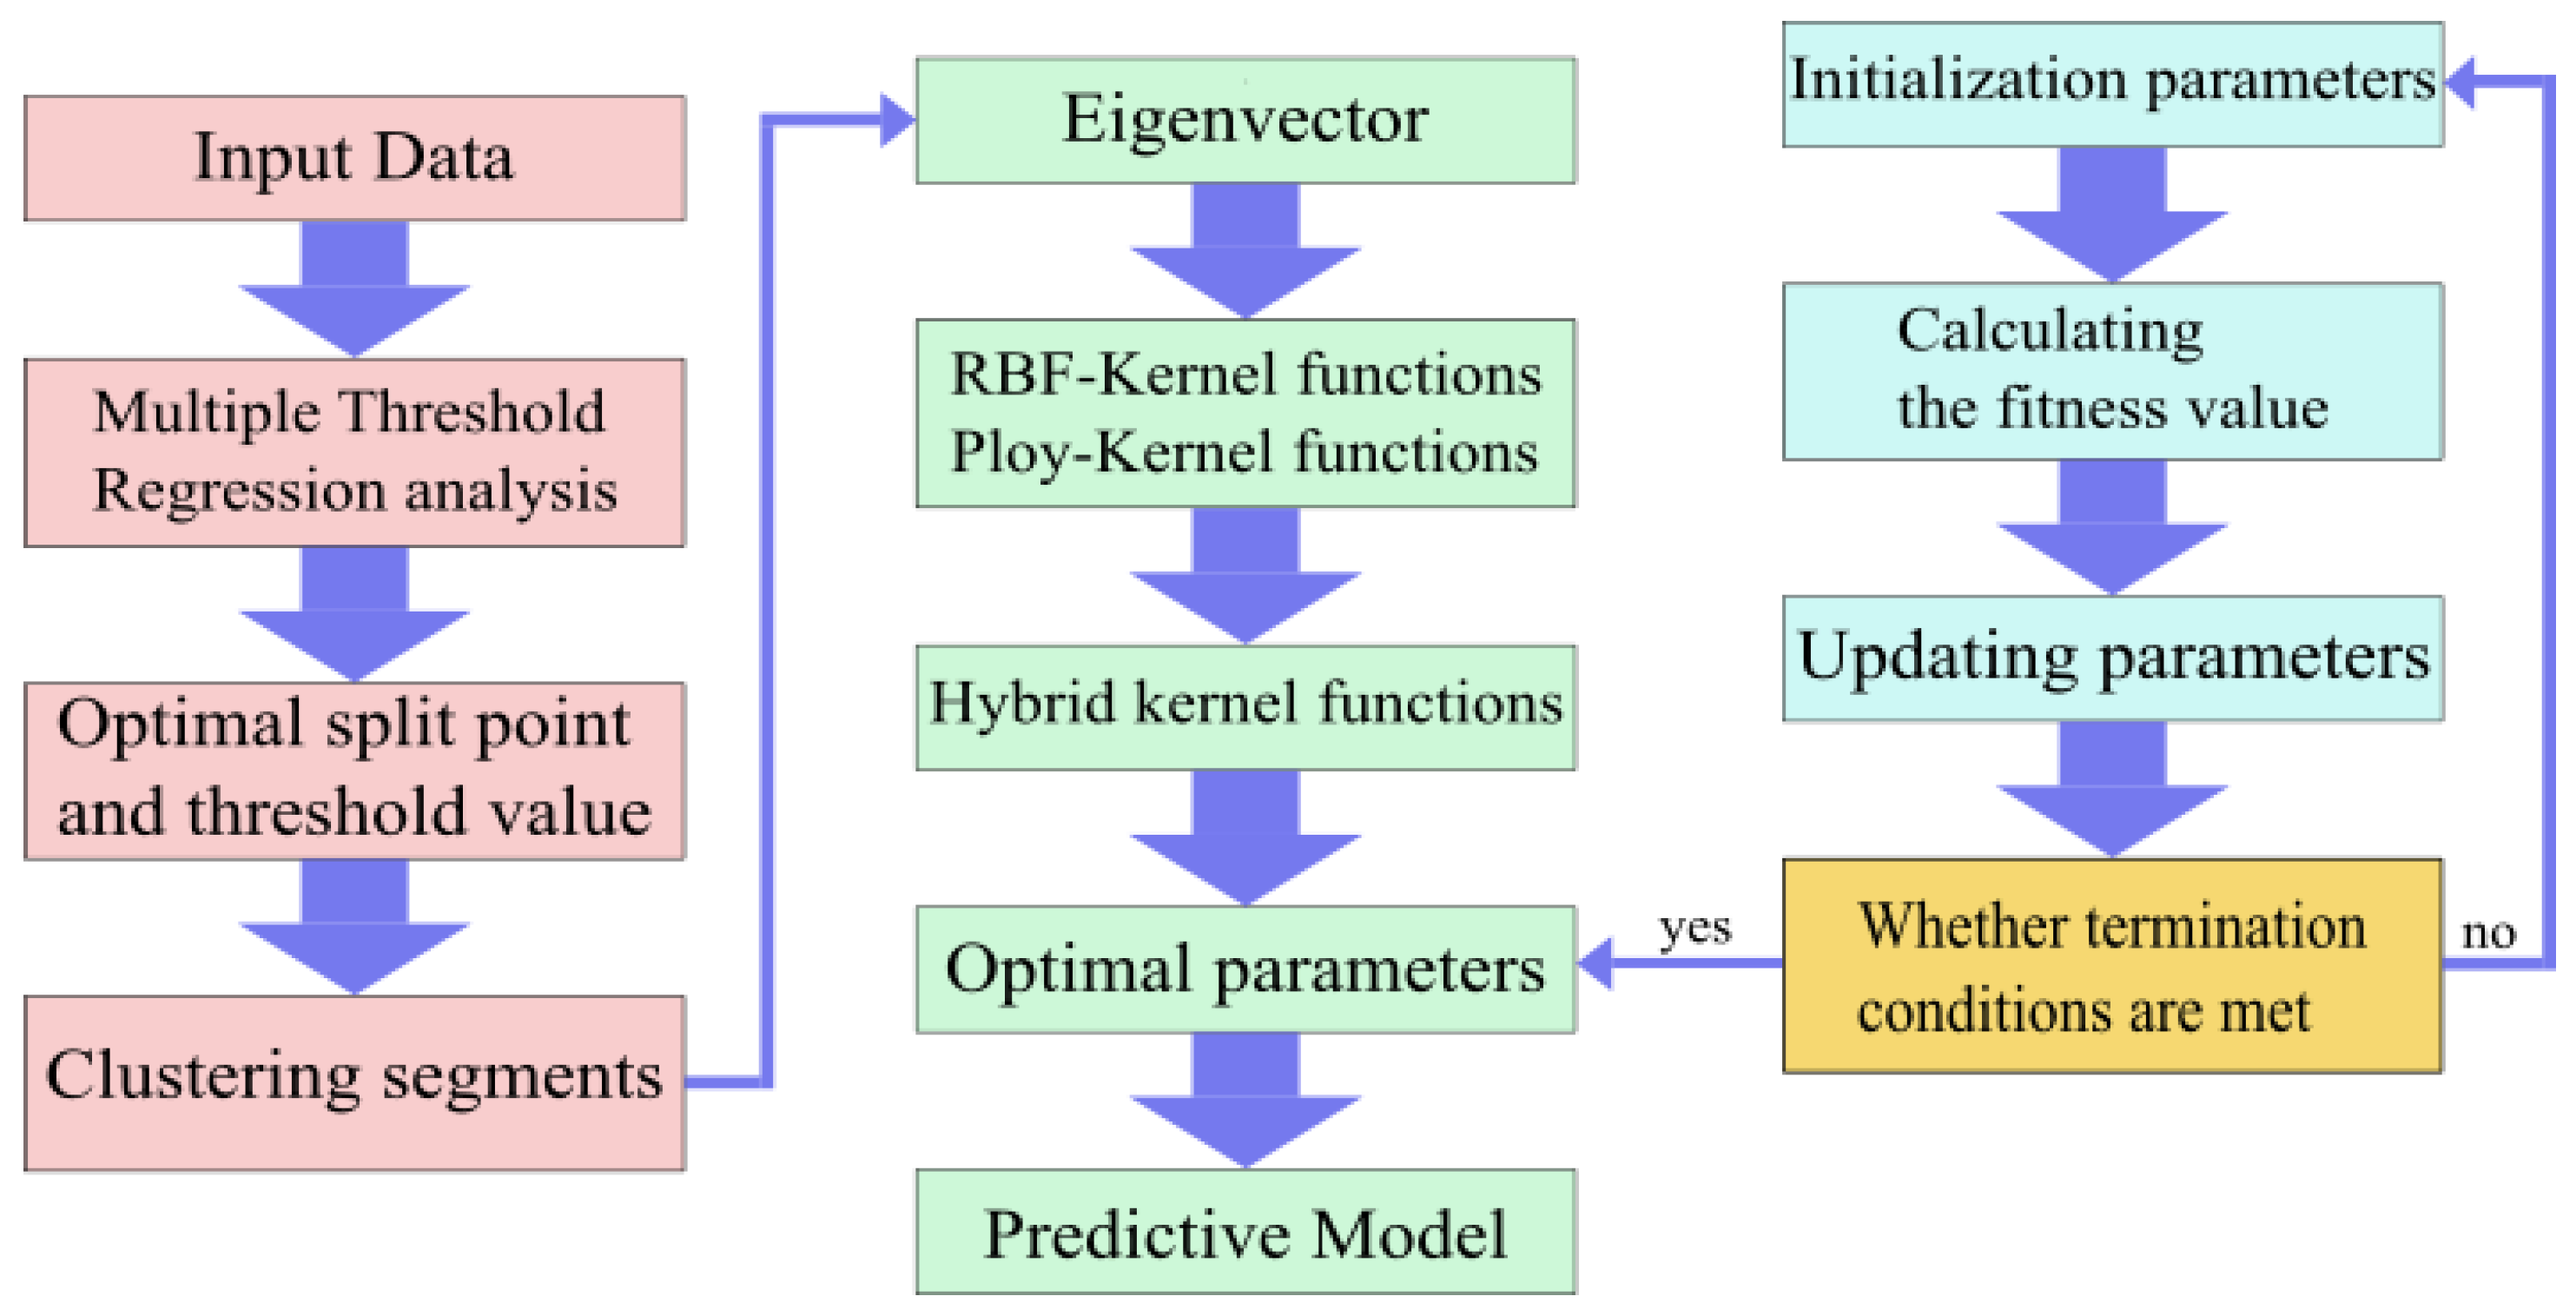
For the establishment of empirical relationships for an FD characteristic and six control variables, the workflow of TR is shown in Figure 4. Based on the analysis process, the maximum face slab deflections were studied and modeled. According to the calculation and analysis methods concerning threshold variables and threshold values, the calculation of the continuous variable influencing factors is carried out separately. As can be seen from Table 2, among the three control variables, the F-value of dam height is the largest, and the significance level exceeds 0.05. It implies that dam height is rightly the threshold variable. Then, the optimal segmentation point corresponding to the maximum F value is determined to be the corresponding threshold value.
The process of building the FD prediction model combining TR and improved SVM (TR-improved SVM) for CFRDs is shown in Figure 5. Firstly, a TR mean was used to classify the clusters of the training and test sets of the FD database of CFRDs. The training set was clustered using the dam height as the threshold variable. Then, a locally improved SVM model was built for the subsets generated from the training set clustering. The test set was classified into its segments as well as the training set. The strategy was used to build a locally improved SVM prediction model combining TR based on the global hybrid kernel function. Compared with the previous SVM models. This paper proposes a segmented modeling strategy for the SVM model.

3. Results

3.1. The SVM Prediction Model Results Analysis

Through the above analysis process, the prediction results for the FD of CFRDs from the SVM model based on the poly and RBF kernel functions are shown in Table 3. Also, the optimal parameters and results of the four models are provided in Table 3. The comparison between the predicted and measured values of the FD of CFRDs under different kernel function SVM prediction models established by different optimization algorithms is shown in Figure 6. A comparison of these four model prediction results is drawn in Figure 7.
The above results show that the errors between the predicted and measured values through different models are kept within 20%. The coefficient R2 of the model evaluation index is greater than 0.7. R2 is mainly used to test the fitting of the forecasting model to the measured data. In non-time series data fitting, it is generally considered that a better fit is obtained with R2 greater than 0.5 [23,24]. This indicates that the improved SVM models based on these two algorithms in constructing regression prediction models can obtain good results and prediction accuracy. However, the RMSE of almost all SVM models with the PSO optimization algorithm is significantly smaller than that of the GS optimization algorithm, and the R2 value of the former is somewhat larger. This indicates that the parameters optimized by PSO are more globally optimal than those optimized by GS and the GS method has been used to provide better model parameters for the SVM model, although there is still room for performance improvement. For example, the grid search parameter step setting will miss the global optimal solution, resulting in the final optimal parameters obtained being only locally optimal. The fitting results of optimization using PSO are significantly better than GS.
In model cross-validation, the RMSE values obtained in the test set of almost all models are larger than those obtained in the training set, and the values of R2 in the training set are also larger than those in the test set. This is because there is a certain amount of overfitting in the process of parameter optimization to ensure that the optimal evaluation metrics are obtained in cross-validation, resulting in better performance of R2 in the training set than in the test set.
The RBF kernel function prediction model with different optimization algorithms has a large prediction error in the test set. The corresponding fitting value of the test set is only 0.7130. This is an obvious “over-learning” phenomenon compared with the high fitting training value. The reason is that the training samples are relatively small, and the test set contains noise data. The original training set is no longer adapted to the new sample distribution characteristics. In contrast, the prediction model with the poly kernel function shows better learning ability, and the error of the training and prediction model decreases compared with that of the poly kernel function. However, the GBF kernel, because of its unique nature, has better accuracy when g = 1/2σ2 is taken as a larger value than when g is a smaller value.

3.2. The Analysis of Improved SVM Prediction Model Results

The PSO algorithm is feasible for the parameter selection for the improved SVM model based on the hybrid kernel function. The prediction results and parameter selection are obtained, as shown in Table 4. The comparison between the measured and predicted results is shown in Figure 8.

3.3. The Analysis of the Prediction Model Combining TR and Improved SVM Results

The prediction results of the training set and test set of the TR-improved SVM prediction model for each dam height interval are shown in Figure 9. From the above results, the TR-improved SVM prediction model effectively improves the prediction accuracy of both the single kernel function SVM and the hybrid kernel function SVM models, with R2 greater than 0.8. The predicted results are better than the traditional fitting method (R2 = 0:248) [25]. Meanwhile, the TR-improved SVM model is slightly superior to the similar P-SVM model(R2 = 0:0.783) [26]. The segmented clustering algorithm allows the data that conform to a certain distribution pattern to be clustered together. It can eliminate the influence of “noisy data” to a certain extent. The TR-improved SVM first divides the CFRD example data into four sample sets according to the height of the dam. Then, it builds the corresponding prediction models separately. In this way, the output of the model will be closer to the actual one.

4. Discussion

Nowadays, many prediction methods of CFRDs have been established by other scholars. The comparisons of the predicted and measured value of the maximum face slab deflection using the different methods [1] are collected in Figure 10. The red dotted line represents that the predicted results are completely accurate, and sample points falling within the blue dotted line represent the prediction error of less than 20%. As can be seen from Figure 10, the errors of traditional methods of Hunter et al. [27] and Pinto et al. [28] are basic more than 20%. The method proposed by Wen et al. gets a better prediction accuracy. The PSO-SVM prediction model proposed in this paper is relatively accurate, with a relative error almost smaller than 10%. Therefore, the improved SVM prediction model in this paper is better than the existing models of Wen et al. [1,4], Hunter et al. [27], and Pinto et al. [28]. However, there are still shortcomings in the generalization ability for any single learner. Ensemble learning can form a strong learner through training multiple single learners. The bias of a single SVM model can be reduced by ensemble learning.

5. Conclusions

This paper overcomes the shortcomings of traditional empirical prediction methods and establishes a prediction model combined with TR and SVM. This model predicted the FD of concrete-face rockfill dams based on 71 examples of data. The main conclusions of this paper are as follows:
(1)
SVM has a good performance for FD prediction of CFRDs considering input variables such as dam height, rockfill strength, foundation conditions, porosity, valley shape factor, and operation time. The PSO algorithm is a feasible method for parameter search optimization of SVM models. The hybrid kernel function PSO-SVM prediction model has good prediction accuracy.
(2)
The SVM algorithm based on the hybrid kernel function enables the prediction model to get better data suitability and nonlinear handling capability. It improves the regression accuracy and generalization ability. The idea of a hybrid kernel can also be applied to other prediction models to achieve a global−local balance.
(3)
The improved SVM prediction model with different clustering intervals is established through multiple TR analyses. This model can weaken the nonlinear abrupt deformation characteristics of the CFRD example data and make up for the shortcomings of the improved SVM prediction model. It also effectively improved the prediction accuracy and generalization ability and can be used to predict the CFRDs’ deformation characteristics accurately.
(4)
The model’s predictions provide more meaningful background information for dam design. In addition, other researchers can use this model in the prediction of other deformation characteristics of dams.
(5)
A finite element model is indeed a good process to acquire more data about the deformation of CFRD. We will further investigate the combination of ML and the finite element model to provide more simulated data about the deformation of CFRD.
(6)
According to the idea of combining the advantages of various algorithms in this paper, further efforts are needed to establish a new prediction model with more accuracy and stronger generalization ability. The model with ensemble learning or neural networks deserves to be noticed.

Supplementary Materials

The following supporting information can be downloaded at: https://www.mdpi.com/article/10.3390/w15193474/s1.

Author Contributions

Conceptualization, T.W.; Methodology, Z.W.; Software, Z.W.; Validation, Z.W.; Formal analysis, H.Z.; Investigation, W.Z.; Writing—review and editing, T.W.; Supervision, T.W. All authors have read and agreed to the published version of the manuscript.

Funding

This research was funded by the National Natural Science Foundation of China (grant number 52039008) and the No.73 General Fund of China Postdoctoral Science Foundation (2023M732829).

Data Availability Statement

Not applicable.

Conflicts of Interest

The authors declare no conflict of interest.

References

  1. Wen, L.; Chai, J.; Xu, Z.; Qin, Y.; Li, Y. A Statistical Review of the Behaviour of Concrete-Face Rockfill Dams Based on Case Histories. Géotechnique 2018, 68, 749–771. [Google Scholar] [CrossRef]
  2. Wen, L.; Li, Y.; Zhao, W.; Cao, W.; Zhang, H. Predicting the Deformation Behaviour of Concrete Face Rockfill Dams by Combining Support Vector Machine and AdaBoost Ensemble Algorithm. Comput. Geotech. 2023, 161, 105611. [Google Scholar] [CrossRef]
  3. Jia, J.S.; Xu, Y.; Hao, J.T.; Zhang, L.M. Localizing and Quantifying Leakage through CFRDs. J. Geotech. Geoenviron. Eng. 2016, 142, 06016007. [Google Scholar] [CrossRef]
  4. Wen, L.; Li, Y.; Chai, J. Multiple Nonlinear Regression Models for Predicting Deformation Behavior of Concrete-Face Rockfill Dams. Int. J. Geomech. 2021, 21, 04020253. [Google Scholar] [CrossRef]
  5. Ren, Q.; Li, M.; Li, H.; Shen, Y. A Novel Deep Learning Prediction Model for Concrete Dam Displacements Using Interpretable Mixed Attention Mechanism. Adv. Eng. Inform. 2021, 50, 101407. [Google Scholar] [CrossRef]
  6. Jia, Y.; Chi, S. Back-Analysis of Soil Parameters of the Malutang II Concrete Face Rockfill Dam Using Parallel Mutation Particle Swarm Optimization. Comput. Geotech. 2015, 65, 87–96. [Google Scholar] [CrossRef]
  7. Ma, K.; Sun, X.; Zhang, Z.; Hu, J.; Wang, Z. Intelligent Location of Microseismic Events Based on a Fully Convolutional Neural Network (FCNN). Rock Mech. Rock Eng. 2022, 55, 4801–4817. [Google Scholar] [CrossRef]
  8. Mostafaei, H.; Mostofinejad, D.; Ghamami, M.; Wu, C. A New Approach of Ensemble Learning in Fully Automated Identification of Structural Modal Parameters of Concrete Gravity Dams: A Case Study of the Koyna Dam. Structures 2023, 50, 255–271. [Google Scholar] [CrossRef]
  9. Marandi, S.M.; VaeziNejad, S.M.; Khavari, E. Prediction of Concrete Faced Rock Fill Dams Settlements Using Genetic Programming Algorithm. IJG 2012, 3, 601–609. [Google Scholar] [CrossRef]
  10. Wen, L.; Li, Y.; Zhang, H.; Liu, Y.; Zhou, H. Predicting the Crest Settlement of Concrete Face Rockfill Dams by Combining Threshold Regression and Support Vector Machine. Int. J. Geomech. 2022, 22, 04022074. [Google Scholar] [CrossRef]
  11. Song, Z.; Li, J. Research on safety monitoring forecasting model for dam based on chaos optimization support vector machine algorithm. Eng. J. Wuhan Univ. 2007, 1, 53–57. [Google Scholar]
  12. Gao, Y.; Yue, J.; Shi, X. Application of SVM to Deformation Monitoring Data Processing. Hydropower Autom. Dam Monit. 2005, 5, 36–39. [Google Scholar]
  13. Zhang, K. The Earth-Rockfill Dam Safety Monitoring Model Based on Support Vector Machine and Fuzzy Evaluation of Safety State. Master’s Thesis, Xi’an University of Technology, Xi’an, China, 2022. [Google Scholar] [CrossRef]
  14. Salkhordeh, M.; Mirtaheri, M.; Rabiee, N.; Govahi, E.; Soroushian, S. A Rapid Machine Learning-Based Damage Detection Technique for Detecting Local Damages in Reinforced Concrete Bridges. J. Earthq. Eng. 2023, 1, 1363–2469. [Google Scholar] [CrossRef]
  15. Ren, C.; Liang, Y.; Pang, G.; Lan, L. Dam Deformation Prediction Based on Grey Least Square Support Vector Machines. J. Geod. Geodyn. 2015, 35, 608–612. [Google Scholar] [CrossRef]
  16. Girma, S. Absorptive Capacity and Productivity Spillovers from FDI: A Threshold Regression Analysis*. Oxf. Bull. Econ. Stat. 2005, 67, 281–306. [Google Scholar] [CrossRef]
  17. Kocoglu, M.; Awan, A.; Tunc, A.; Aslan, A. The Nonlinear Links between Urbanization and CO2 in 15 Emerging Countries: Evidence from Unconditional Quantile and Threshold Regression. Environ. Sci. Pollut. Res. 2022, 29, 18177–18188. [Google Scholar] [CrossRef] [PubMed]
  18. Saegusa, T.; Ma, T.; Li, G.; Chen, Y.Q.; Lee, M.-L.T. Variable Selection in Threshold Regression Model with Applications to HIV Drug Adherence Data. Stat. Biosci. 2020, 12, 376–398. [Google Scholar] [CrossRef]
  19. Wen, L.; Chai, J.; Xu, Z.; Qin, Y.; Li, Y. Preliminary statistical analysis of behavior of concrete face rockfill dams. Chin. J. Geotech. Eng. 2017, 39, 1312–1320. [Google Scholar]
  20. Zhou, X.; Ma, G.; Zhang, Y. Grain Size and Time Effect on the Deformation of Rockfill Dams: A Case Study on the Shuibuya CFRD. Géotechnique 2019, 69, 606–619. [Google Scholar] [CrossRef]
  21. Yan, H.; Cao, J. A Modeling Approach for Multivariate Threshold Regression Models. Sci. Atmos. Sin. 1994, 18, 194–199. [Google Scholar]
  22. Enders, W. Applied Econometric Time Series, 2nd ed.; John Wiley & Sons Inc.: New York, NY, USA, 2004. [Google Scholar]
  23. Peng, M.; Zhang, L.M. Breaching Parameters of Landslide Dams. Landslides 2012, 9, 13–31. [Google Scholar] [CrossRef]
  24. Xu, Y.; Zhang, L.M. Breaching Parameters for Earth and Rockfill Dams. J. Geotech. Geoenviron. Eng. 2009, 135, 1957–1970. [Google Scholar] [CrossRef]
  25. Kim, Y.-S.; Kim, B.-T. Prediction of Relative Crest Settlement of Concrete-Faced Rockfill Dams Analyzed Using an Artificial Neural Network Model. Comput. Geotech. 2008, 35, 313–322. [Google Scholar] [CrossRef]
  26. Su, H.; Li, X.; Yang, B.; Wen, Z. Wavelet Support Vector Machine-Based Prediction Model of Dam Deformation. Mech. Syst. Signal Process. 2018, 110, 412–427. [Google Scholar] [CrossRef]
  27. Hunter, G.; Fell, R. Rockfill modulus and settlement of concrete face rockfill dams. J. Geotech. Geoenviron. Eng. 2003, 129, 909–917. [Google Scholar] [CrossRef]
  28. Pinto, N.D.S.; Filho, P.L.M. Estimating the maximum face deflection in CFRDs. Int. J. Hydropower Dams 1998, 5, 28–32. [Google Scholar]
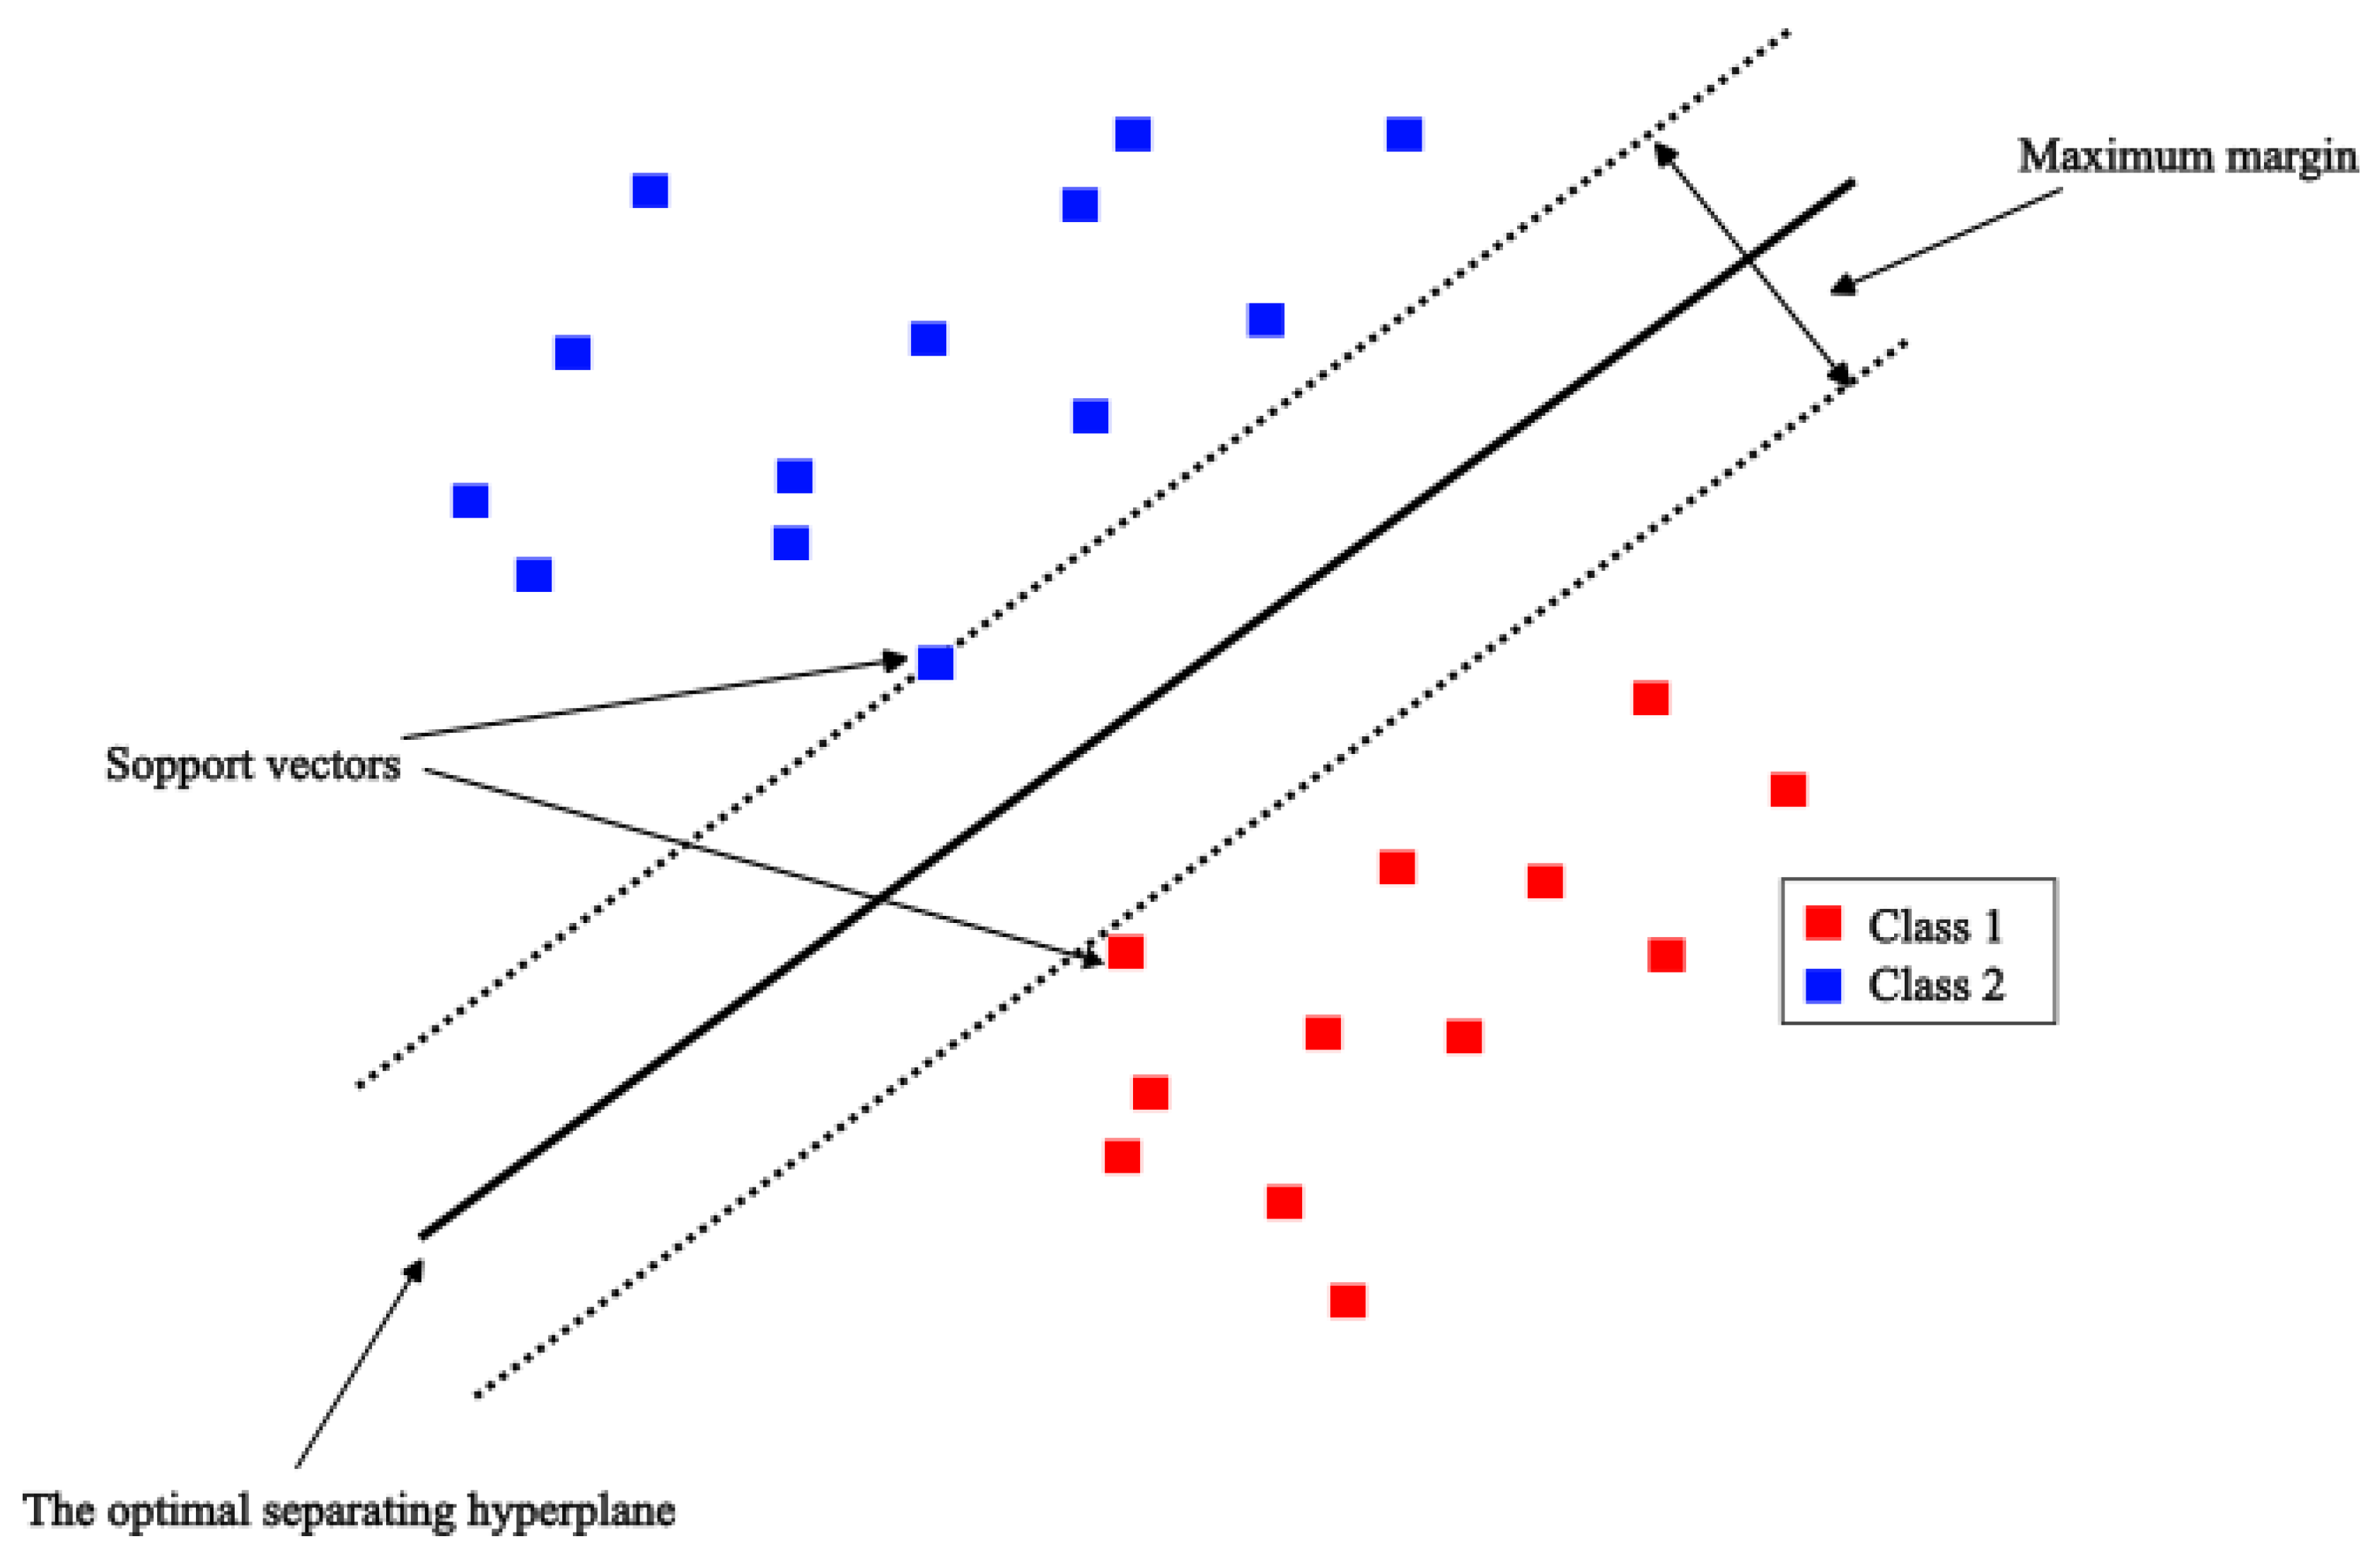
Figure 1. The basic theory of SVM.
Water 15 03474 g001
Figure 2. Particle Swarm Optimization Algorithm Flowchart.
Water 15 03474 g002
Figure 3. The Flowchart of the SVM training process.
Water 15 03474 g003
Figure 4. The TR Flowchart.
Water 15 03474 g004
Figure 5. Combining TR and Improved SVM Modeling Flowchart.
Water 15 03474 g005
Figure 6. Prediction Precision Comparison by Different Prediction Models.
Water 15 03474 g006
Figure 7. Comparison of Prediction Results Based on Different SVM Models.
Water 15 03474 g007
Figure 8. Comparison of Prediction Results under Different η.
Water 15 03474 g008
Figure 9. Prediction Accuracies of TR-Improved SVM Prediction Model.
Water 15 03474 g009
Figure 10. The comparison of the predicted value and the measured value with different models.
Water 15 03474 g010
Table 1. The variables/acronyms/terms.
Variables/Acronyms/TermsDescription
CFRDConcrete-face rockfill dam
FDDam maximum face slab deflection
TRThreshold regression
SVMSupport vector machine
PSOParticle swarm optimization
X1X1 = H/Hr, Hr = 100 m
X2Void ratio
X3Valley shape(A/H2); A = upstream slope surface area; H = dam height
X4Foundation conditions
X5Rockfill strength
X6Operation time
yLabel (%H is the ratio of the FD to the dam height)
KKernel function
RBFGauss basis function
GSGrid search
PolyPolynomial function
RMSERoot mean squared error
R2Correlation coefficient
ClusteringClustering is a typical unsupervised learning method, which learns the intrinsic relation of the data.
Optimization
algorithms
It is mainly used to speed up the training of the model, making the objective function converge quickly.
Table 2. Threshold Analysis Results of FD Behavior of CFRDs.
CharacteristicControl VariablesHeightVRRiver Valley
Shape Factor
FDoptimal partition point0.621.041.490.213.3
F value35.5829.9427.717.4924.42
Table 3. The optimal parameters and results of the different prediction models.
DeformationCategoryTraining SetsTest SetsCd or g
RMSER2RMSER2
FDPoly kernelGS0.16300.76230.22010.727524.25d = 2
PSO0.11840.78940.13620.77864.59d = 3
RBF kernelGS0.17420.75540.24390.71300.62g = 0.012
PSO0.11880.78920.14260.77462.82g = 6.498
Table 4. Prediction Accuracy and Optimal Parameter Selection of Models with Different η. Here, C and d are the Poly kernel parameters. C and g are the RBF kernel parameters, C is the regularization parameter, d is the multiform kernel parameter, and σ2 is the radial basis kernel parameter (g = 1/2σ2).
DeformationηTraining SetsTest SetsCdg
RMSER2RMSER2
FD0.10.12800.78360.160.76411630.05
0.20.11440.79180.1430.77442.8320.10
0.30.09690.80250.12110.787837.6525.78
0.40.08780.80800.10980.794654.6912.32
0.50.07030.81870.08790.80798.1744.63
0.60.06420.82240.08030.812657.1138.47
0.70.06110.82430.07640.815069.72311.21
0.80.10540.79730.13180.781317.8836.35
0.90.17090.75740.21360.731414.7625.72
Disclaimer/Publisher’s Note: The statements, opinions and data contained in all publications are solely those of the individual author(s) and contributor(s) and not of MDPI and/or the editor(s). MDPI and/or the editor(s) disclaim responsibility for any injury to people or property resulting from any ideas, methods, instructions or products referred to in the content.