Article

Bottled Mineral Waters as Unconventional Sampling in Hydro-Geological Research

1
Department of Chemical, Pharmaceutical and Agricultural Sciences, University of Ferrara, Via L. Borsari 46, 44122 Ferrara, Italy
2
New Energies and Environment, Department of Physics and Earth Sciences, Spinoff Company of Ferrara University, Via Saragat 1, 44121 Ferrara, Italy
3
Northwest Institute of Eco-Environment and Resources, Chinese Academy of Sciences, 382 West Donggang Road, Lanzhou 730000, China
4
INGV National Institute of Geophysics and Volcanology, Via U. La Malfa 153, 90146 Palermo, Italy
5
School of Environmental Studies, China University of Geosciences, Wuhan 430074, China
*
Author to whom correspondence should be addressed.
Water 2023, 15(19), 3466; https://doi.org/10.3390/w15193466
Submission received: 1 September 2023 / Revised: 26 September 2023 / Accepted: 28 September 2023 / Published: 30 September 2023
(This article belongs to the Special Issue Hydrochemistry and Isotopes in Groundwater Investigations)

Abstract

:
Bottled mineral waters originate from groundwater aquifers, their chemical composition being initially determined by geochemical water-rock interaction processes. The waters used for bottling originate from different parts of the hydrological cycle and have a unique hydro-geochemical fingerprint. As water moves through the water cycle, the isotopic composition of oxygen and hydrogen in the water molecule may change. Determining 18O and 2H can help to characterize the source of bottled water and the natural conditions of the parent water body, of the recharge area, and the influence of various processes during infiltration and water flow within the water body. Usually, the chemical composition is reported on the label of bottled waters, while stable isotopes data are often unreported and are sometimes available from scientific publications. Bottled waters from selected sites of Europe where chemical and stable isotopic composition were available have been considered and accompanying data reinterpreted. The available data have been reinterpreted by obtaining results comparable, within limitations, to traditional sampling and analytical procedures, demonstrating the usefulness of the adopted methodology in emergency cases. Therefore, the utilization of isotopic values of bottled waters should be limited to the observation of general trends in isotopic composition of feeding waters, while more local studies are advised for a better understanding of the hydro-geological circuits.

1. Introduction

Research on stable isotopes in precipitation is normally carried out by analyzing rain or snow samples collected at the monitoring stations in the IAEA-GNIP network [1]. This network and also other local monitoring networks have ensured a good knowledge of the isotopic composition of precipitation worldwide over the past few decades [2,3,4,5,6,7,8]. In this regard, it is noteworthy that the comparison between available isotopic data in precipitations and isotopic data from commercial mineral water bottles could provide further details.
However, monitoring networks can sometimes be subject to malfunctioning due to possible damage caused by natural or anthropogenic disasters. In such cases, it may be useful to use emergency protocol sampling procedures. An example of such procedures is the sampling carried out in 1995 in Japan by Tsunogai and Wakita [9], who used commercial bottles of bottled mineral water to check for possible changes in the chemical composition of spring water after a major earthquake. In 1995, the use of commercial mineral water bottles proved useful and provided satisfactory results to the extent that it has also been used on other occasions by other authors [10,11] during emergency sampling campaigns.
The world’s most popular beverage is bottled water, with annual sales continuing to rise. The bottled water industry is expanding and is steadily becoming a significant economic and public health factor. In 2005, the estimated global consumption of bottled water was approximately 165 billion liters, which equates to a per capita annual consumption of 25 L [12], while during the last two decades, bottled water consumption has increased dramatically [13].
At the worldwide scale, revenue in the Bottled Water segment amounts to USD 230.2 billion in 2014 and to USD 302.52 billion in 2022; while the market is expected to grow annually by 5.24% until 2027 [14]. Most of the above revenue is generated in the United States (USD 81.3 billion in 2014), while in Europe for the same year (2014), this commercial segment amounts to USD 45.7 billion.
According to the survey carried out by the International Bottled Water Association (IBWA [15]), the most important factor that bottled water drinkers in North America follow for selecting a specific beverage are the taste and the quality (97%), the safety (91%), the low calories (67%), and the lack of artificial sweeteners (72%). Moreover, 86% of Americans drink bottled water when traveling, 83% at work, 72% when shopping and on the go, 70% at social events where other drinks are served, 68% during sport and entertainment venues, 66% at the gym or when physically training, while 76% of all Americans regularly drink bottled water at home.
On the European market, four types of bottled water are available: natural mineral water, spring water, table water, and therapeutic/medical water. The natural mineral waters, which are generally regarded as the best bottled waters, account for the bulk of European trade. This paper considers “natural mineral waters” as defined by Directive 80/777/EEC.
More than 25% of the world’s bottled water is produced in the European Union, where 52 billion liters are consumed annually [14]. According to Council Directive 80/777/EEC [16], bottled water is categorized as mineral, spring, and table water. Only the concentrations of the major elements are required to be listed on the label, as per national laws and regulations.
Due to the fact that bottled mineral waters originate from groundwater aquifers, their chemical composition is initially determined by geochemical water-rock interaction processes. Numerous studies have examined the natural mineral content of bottled waters originating from water-rock interaction in exploited groundwater aquifers (e.g., [17,18,19,20]). In particular, Misund et al. (1999) [21] discovered a link between the chemical composition of 66 European bottled waters and the aquifer lithology.
The waters used for bottling originate from groundwaters and have a unique hydro-geochemical fingerprint. Its hydrogen (2H), oxygen (18O), and elemental composition, among others, reflect the water’s natural origin.
Chemical composition is used for defining lithological sources (silicate and carbonate rocks) and the proportion of silicate/carbonate in groundwater [22] because they are controlled by water-rock interactions.
As water moves through the water cycle, the isotopic composition of oxygen and hydrogen (i.e., 18O and 2H) in the water molecule may change. 18O and 2H values in precipitation (the ultimate water source for surface and groundwater) vary significantly with latitude and altitude [23,24,25,26,27].
Therefore, determining 18O and 2H certainly contributes to characterize the source of bottled waters and the natural conditions of the parent water body and the recharge area, as well as the influence of various processes during infiltration and water flow within the water body [6,28,29,30].
In this context, the main objective of our research is to understand whether bottled mineral waters could be used as unconventional sampling in hydrological research, that is to say, as an indicator for the isotopic data in places where bottled water is not sampled. To this end, the possible relationships between the isotopic data of meteoric precipitation and the isotopic composition of bottled water from different areas of the broader Mediterranean basin were compared.

2. Materials and Methods

The isotopic composition of hydrogen and oxygen reflects the hydrological cycle’s natural processes and the isotopic ratio (R2H/1H or 18O/16O; reported as 2H or 18O) of fresh water varies substantially and systematically across the globe due to the spatially and temporally variable climatic patterns that govern the delivery of precipitated water to geographic regions.
In order to build the database, 133 bottled water samples were collected from different countries in the Mediterranean region and analyzed in terms of chemistry and 18O and 2H isotopic composition (Figure 1; see Supplementary Material; Tables S1a,b and S2).
In particular, for Italy, 59 bottled water samples were analyzed; for Greece, 25 samples; 38 samples for Slovenia; 4 for Austria; 4 for Croatia; and 3 bottled waters for France [31,32,33,34,35].
The above publications analyzed waters bottled between 2004 and 2016. All of the oxygen isotope data are expressed in terms of δ values relative to V-SMOW (Vienna Standard Mean Ocean Water):
δ18O = [(Rsample − Rstandard)/Rstandard]*1000‰
where Rsample is the ratio of 18O/16O in the samples and Rstandard is the ratio of 18O/16O in V-SMOW.
The information relative to the precision and the repeatability of the hydro-chemical and isotopic measurements are reported in the original papers. For example, according to Brencic and Vreca [32], measurement reproducibility of duplicates was better than ±0.05% for δ18O and ±1% for δ2H; or Brencic et al. [34] reported data related to both precision and accuracy of the chemical analyses.
Also, Zuliani et al. [35] specify on this issue that repeatability for the determination of major and trace elements was greater than 5% and the total alkalinity was determined within 24 h of sample collection applying the gran titration method with a precision of ±1%. For δ2H and δ18O quality control, they used LRM W-45 with defined isotope values and an estimated measurement uncertainty of δ2H = −60.6 ± 0.7‰ and δ18O = −9.12 ± 0.04 ‰, and commercial reference materials USGS 45 (δ2H = −10.3 ± 0.2‰; δ18O = −2.238 ± 0.006‰) and USGS 46 (δ2H = −235.8 ± 0.4‰; δ18O = −29.80 ± 0.02‰). The average sample repeatability for δ2H and δ18O was 0.3 and 0.02‰, respectively.
Data were collected from 138 IAEA-GNIP stations monitoring rainwater [1,36] (see Supplementary Material; Tables S3 and S4) in the six countries considered for the study (Figure 1b). In order to compare the isotopic data of the stations’ waters with those of the bottled waters, three criteria were applied in selecting the IAEA stations: (i) maximum number of functioning stations, (ii) monitoring lasting at least three or more years, and (iii) measurements carried out after the 1990 (see Supplementary Material; Table S4). This last restrictive condition was also suggested by the relatively homogeneous and sharp increase in temperatures in Europe after 1990 (see also https://earthobservatory.nasa.gov/world-of-change/global-temperatures; accessed on 20 September 2023).
In particular, for Italy, 18 stations were considered in the period 1997–2002; for Greece, 3 stations, period 2001–2003; for Slovenia, 3 stations, period 2000–2003; for Austria, 4 stations, period 1990–2002; for Croatia, 5 stations, period 2000–2003; for France, 5 stations, period 1996–2005.

3. Results

3.1. Geochemical Features of Considered Bottled Mineral Waters

In general, the chemical composition of water is determined by the natural environment from where it originates and it is mainly affected by the local (sometimes regional) geological and hydro-geological conditions. The primary natural influences on the chemical and isotopic composition of bottled water are (i) the water-rock interaction, (ii) the transit time, and (iii) the evaporation processes of groundwaters from the considered aquifers, e.g., [22,37,38,39].
As mentioned above, the analyzed bottled waters are from Italy, Greece, Slovenia, Austria, Croatia, and France. Geochemical composition is available for 114 bottled water samples representing 86% of the bottled water, for which the isotopic composition was also available (Figure 1a; see Supplementary Material; Table S2); [31,32,33,34,35].
The problem of defining the relationships between lithology, hydro-geological conditions, and hydro-chemical facies in case of large-scale investigated areas and a large number of considered bottled waters has been already faced by Ciotoli and Guerra [40], who analyzed 434 Italian brands of bottled water and grouped them into five classes according to the outcropping rock type lithology (volcanic, metamorphic, carbonate, sedimentary, and flysch). Following the Chebotarev classification, they also represented the hydro-chemical facies in a simplified outcropping geolithological sketch (scale 1:100.000), concluding that due to the large-scale as well as the complex and highly variable geological and lithological conditions, it is not possible to systematically define the relationship between lithology and hydro-chemical facies, though for some of the bottled water springs this information could be available from the local scientific literature.
For the geographical position and the chemical composition of the bottled mineral waters, we verified the coordinates reported by the above-mentioned authors and completed the information by accessing the site of the manufacturers of the brands or by reading the label from the bottle available in the commercial distribution.
In order to distinguish the main hydro-chemical facies, pH, electrical conductivity (EC; µS/cm), and major ions (Ca2+, Mg2+, K+, Na+, Cl, SO4, HCO3, SiO2; mg/L) were considered. The statistical distribution of the physical and chemical parameters, integrated with the elevation (m, a.s.l.) of the source spring and the temperature at the spring (°C), is represented in Figure 2, Figure 3 and Figure 4.
In particular, Figure 3 shows that the electrical conductivity (EC) values range from 22 (Sant’Anna bottled water brand; Supplementary Material, Table S2, code number 2; area of origin: western Italian Alps) to 10,100 µS/cm from an andesitic aquifer in eastern Slovenia (Donat Mg bottled water brand; Supplementary Material, Table S2, code numbers 85, 86), where waters are enriched in magnesium (1.1 g/L), sulfate (2.2 g/L), and dissolved inorganic carbon (204 g/L). The median, the 25th, and the 75th percentile values of electrical conductivity are 474, 261, and 1079 µS/cm, respectively.
The lowest values of electrical conductivity (<200 µS/cm), observed in northwestern Italy, generally suggest a very short water circulation in the underground reservoir. For example, Vazquez et al. [41], studying the composition of rainwater in the Illas Cies (a Spanish island in the region of Galicia), measured a mean electrical conductivity value of about 163.7 μS/cm. Boussaton et al. [42] calculated electrical conductivity values of about 14.7 μS/cm in rainwater samples collected near the French city of Toulouse; while in Zadar (Croatia), Beysens et al. [43] analyzed the chemical properties of rain during the period 2004–2006 and observed a mean electrical conductivity of about 180 μS/cm, corresponding to low mineralization of water.
Based on the plot of bottled water in the double-bar Langelier–Ludwig diagram [44] (Figure 4), the large majority of samples (84.5%) falls in the right lower side of the graph, suggesting that in most cases, earth-alkaline bicarbonate type (Ca [Mg]-HCO3) groundwaters originated mainly from carbonate dissolution processes.
Moreover, 13% of the bottled waters indicate sodium-calcium chloride-bicarbonate (Na[K]-HCO3[Cl]) to mix waters type due to the contact of the water with magmatic (es. codes 30, 35), crystalline (es. code 2), or sandstone formations (es. code 18).
The database also contains examples of earth-alkaline sulphate waters (Ca [Mg]-SO4) resulting from the interaction with calcium dolostones and evaporite sequences (e.g., San Pellegrino bottled water; code 14 located in the Alps, north Italy). Finally, the Na-Cl type waters (codes 22 and 29) and the relatively high Cl content, characterized by very low electrical conductivity values (<100 μS/cm; Figure 3), suggest in contrast a typical meteoric origin.

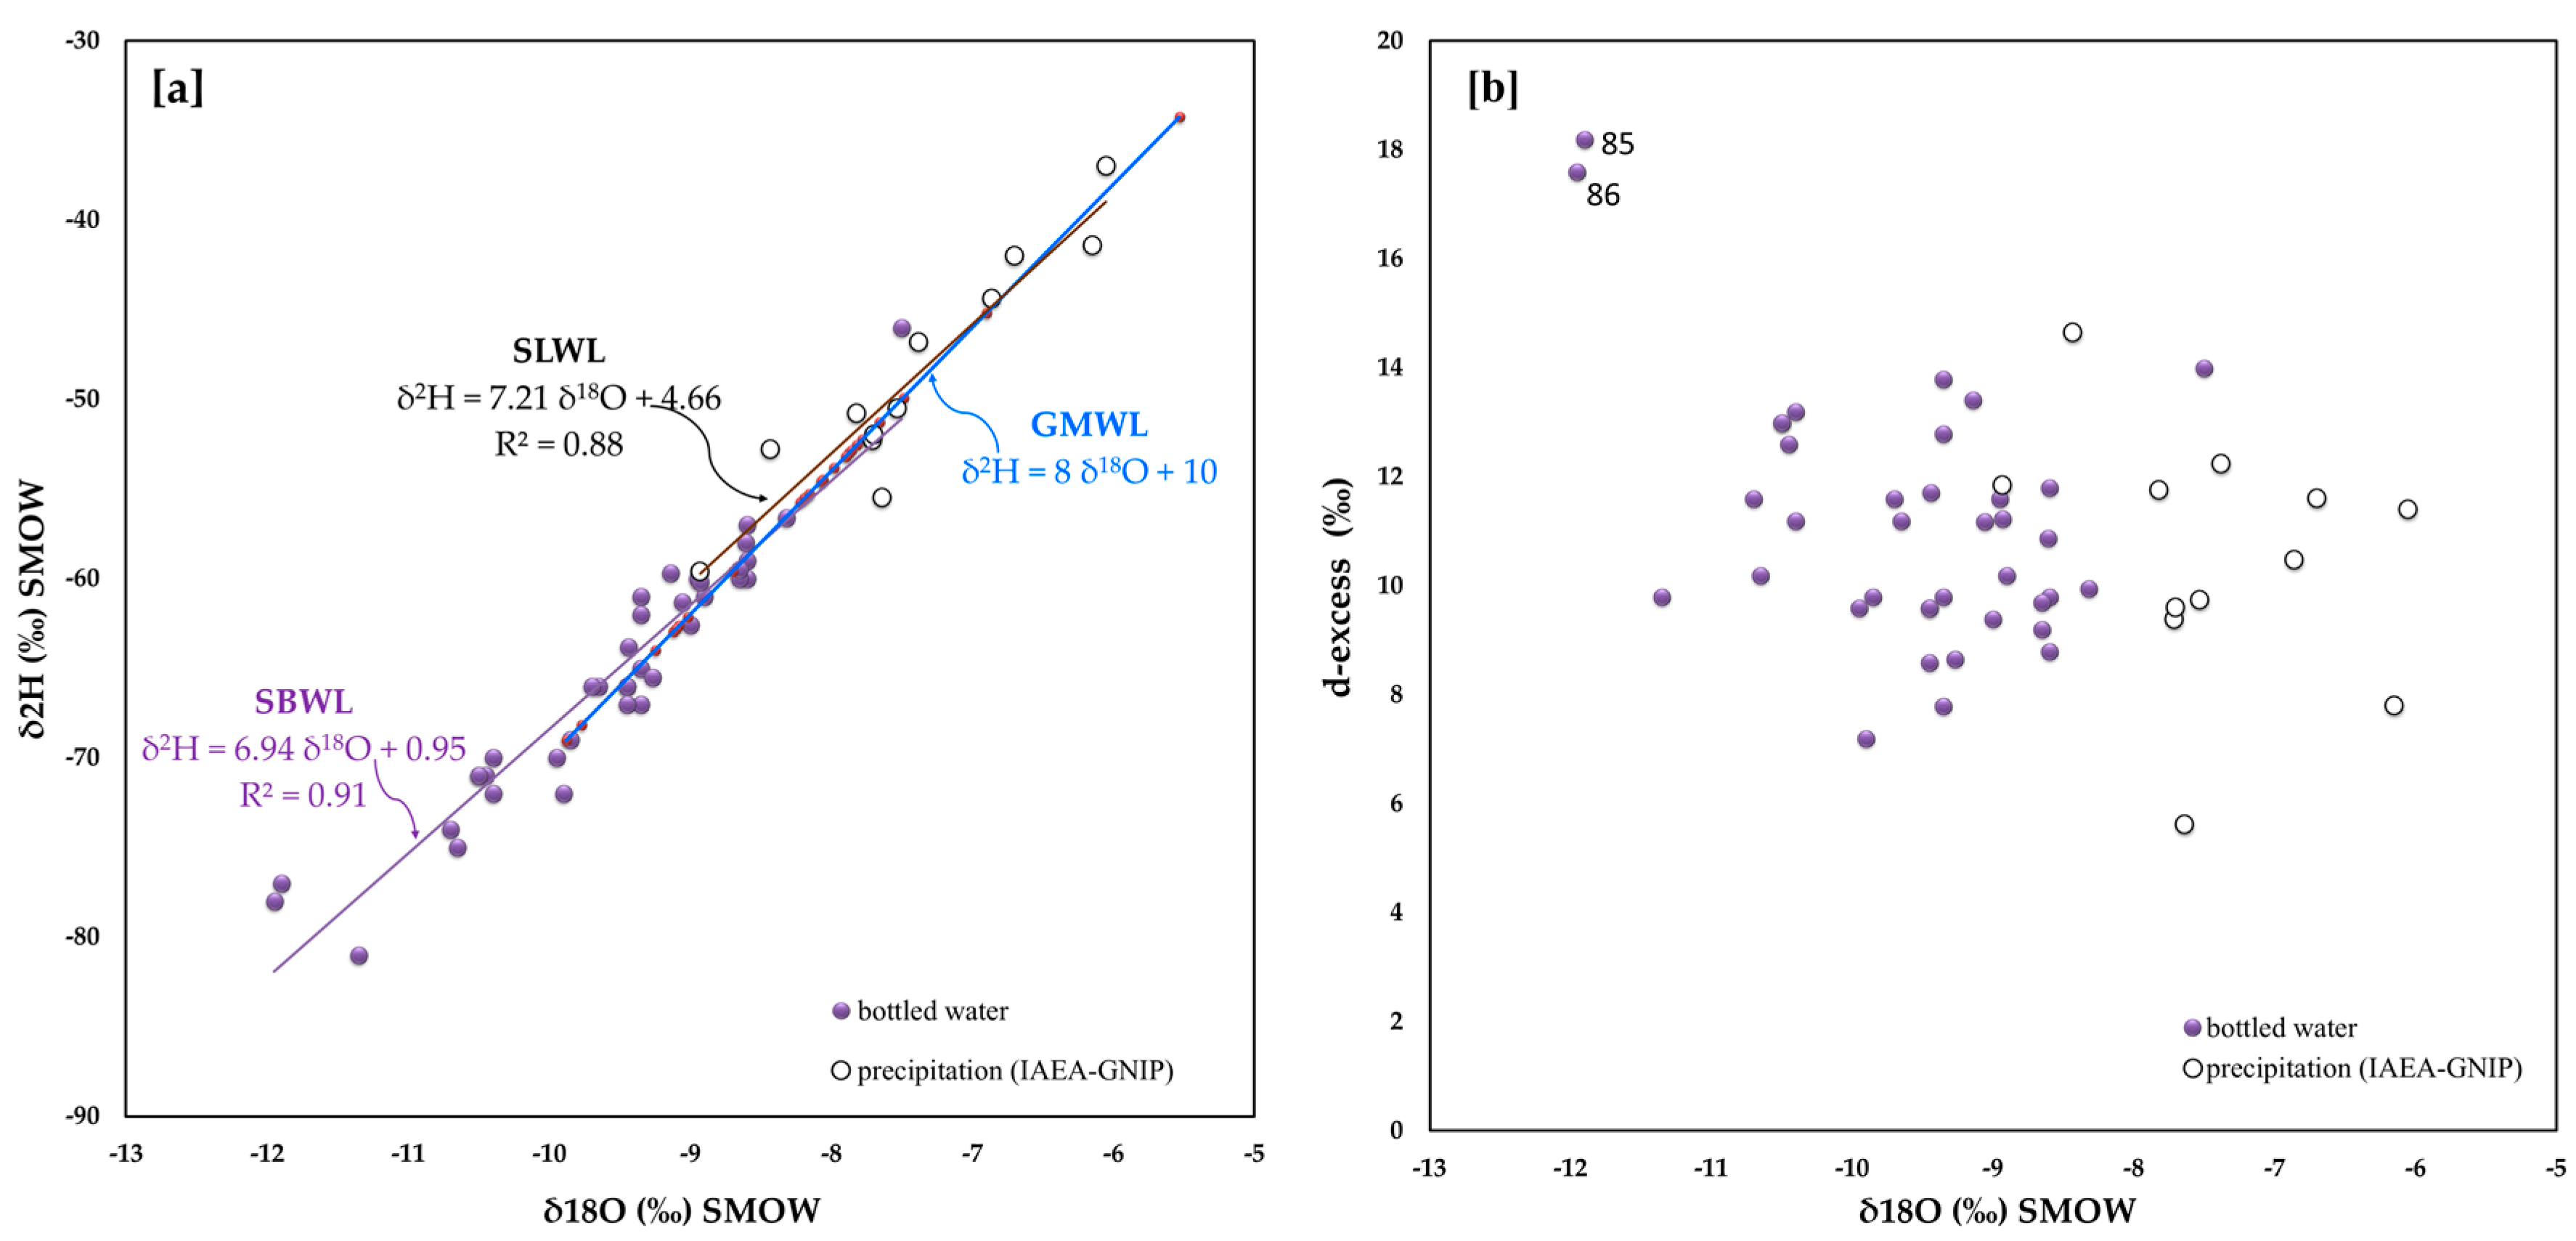
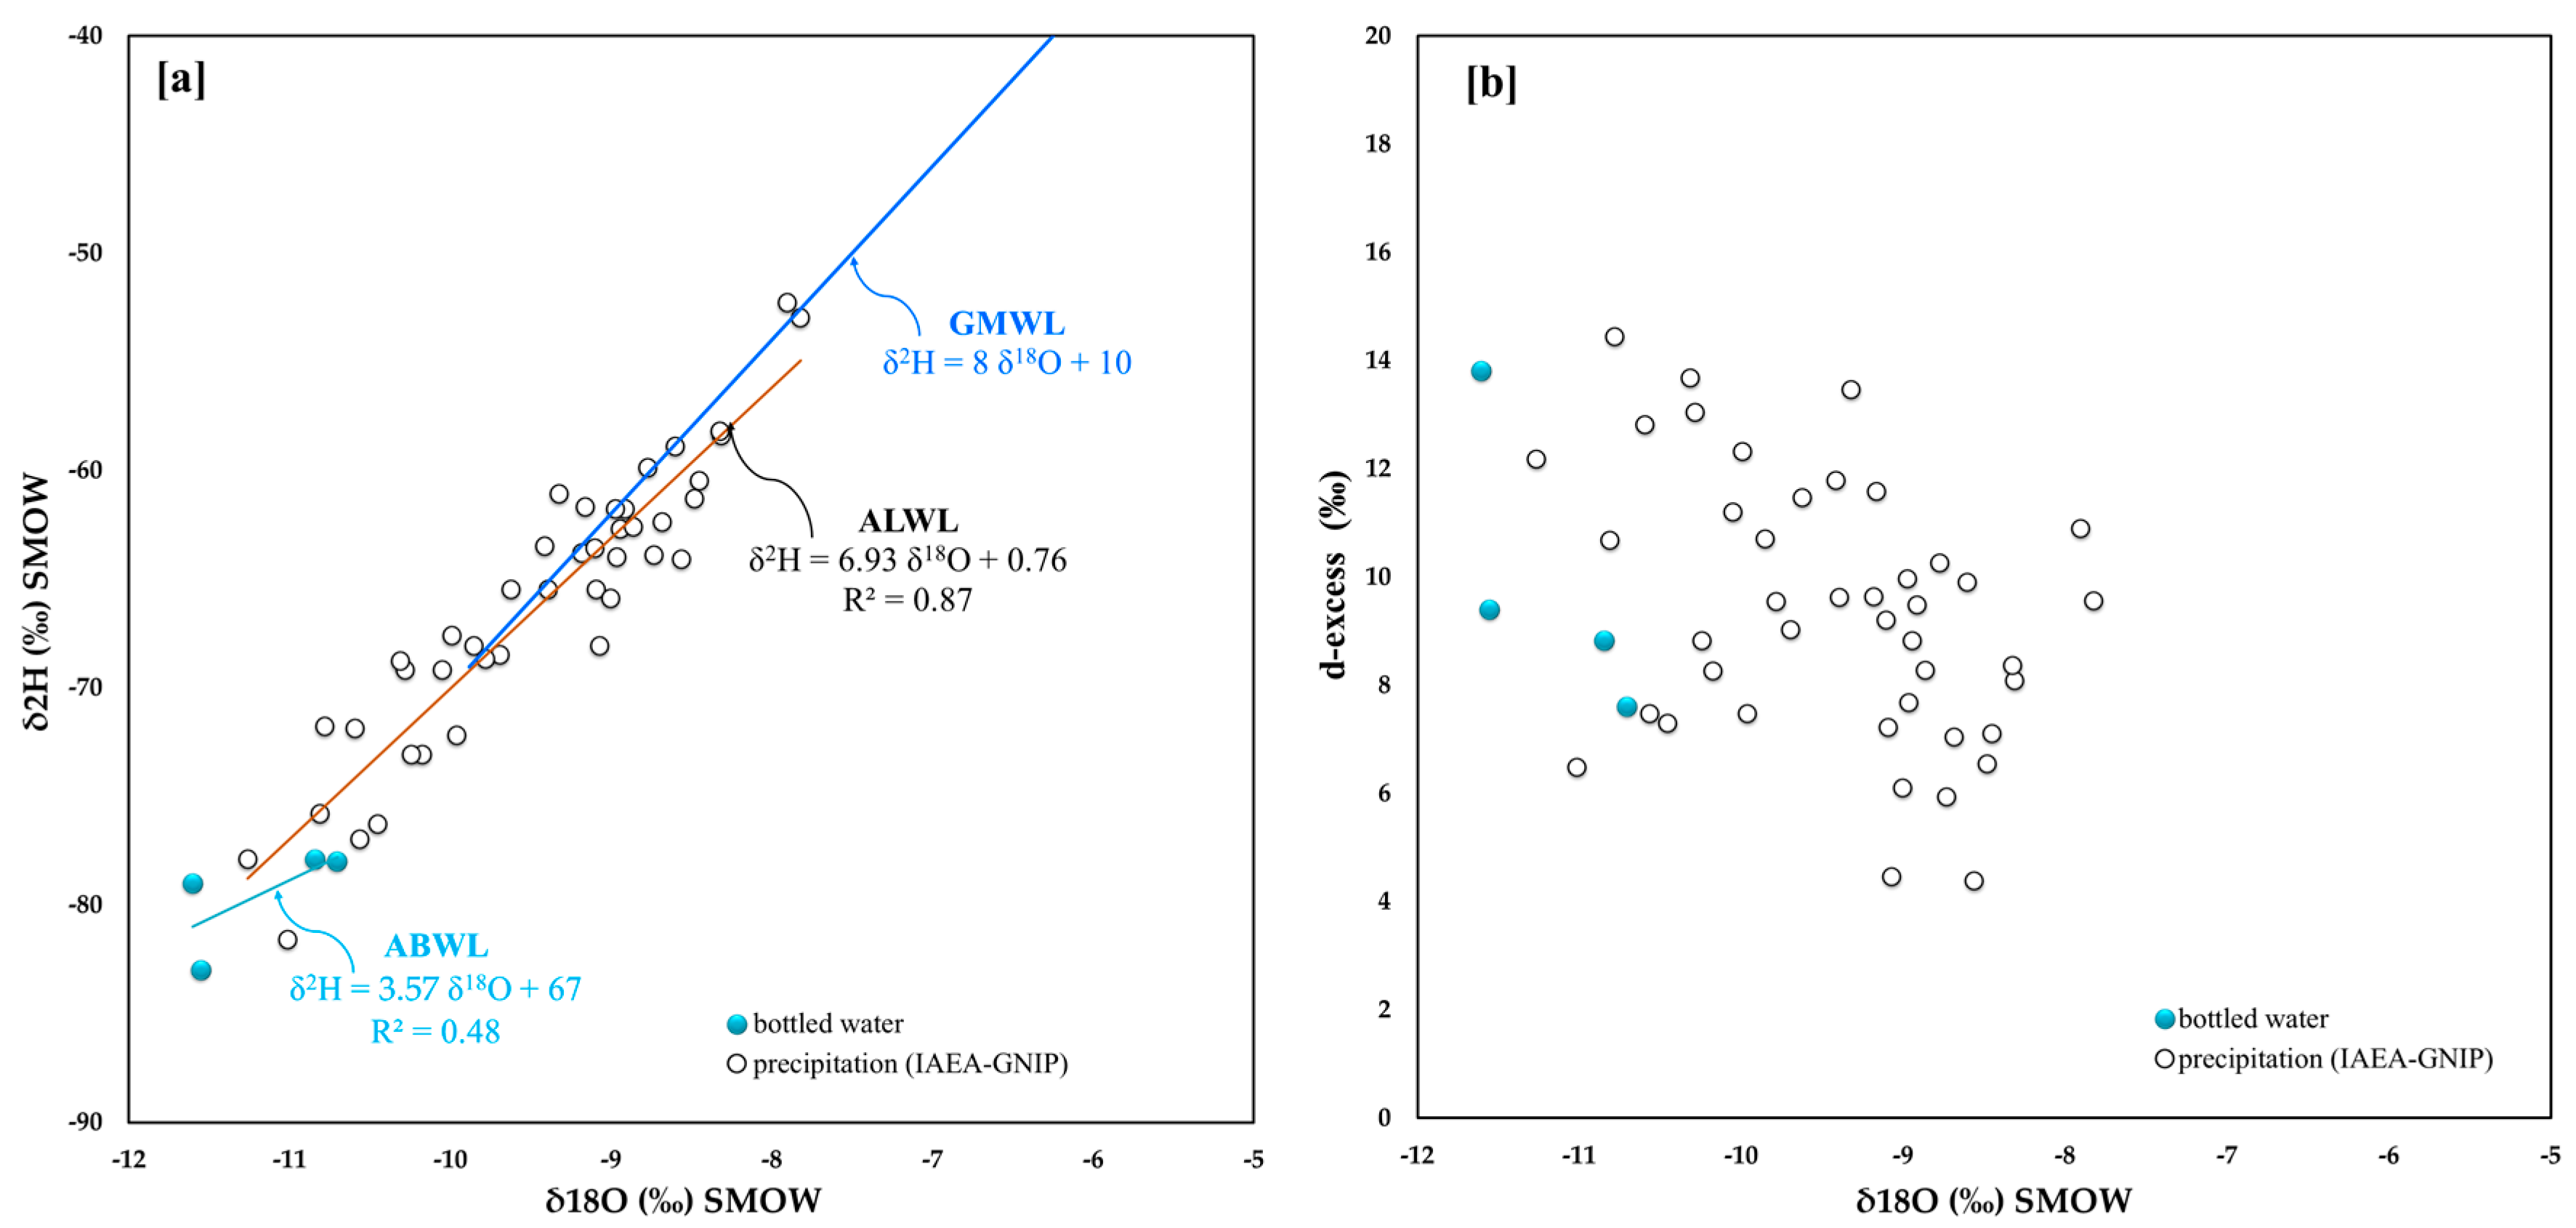
3.2. Analysis of Stable Isotopes
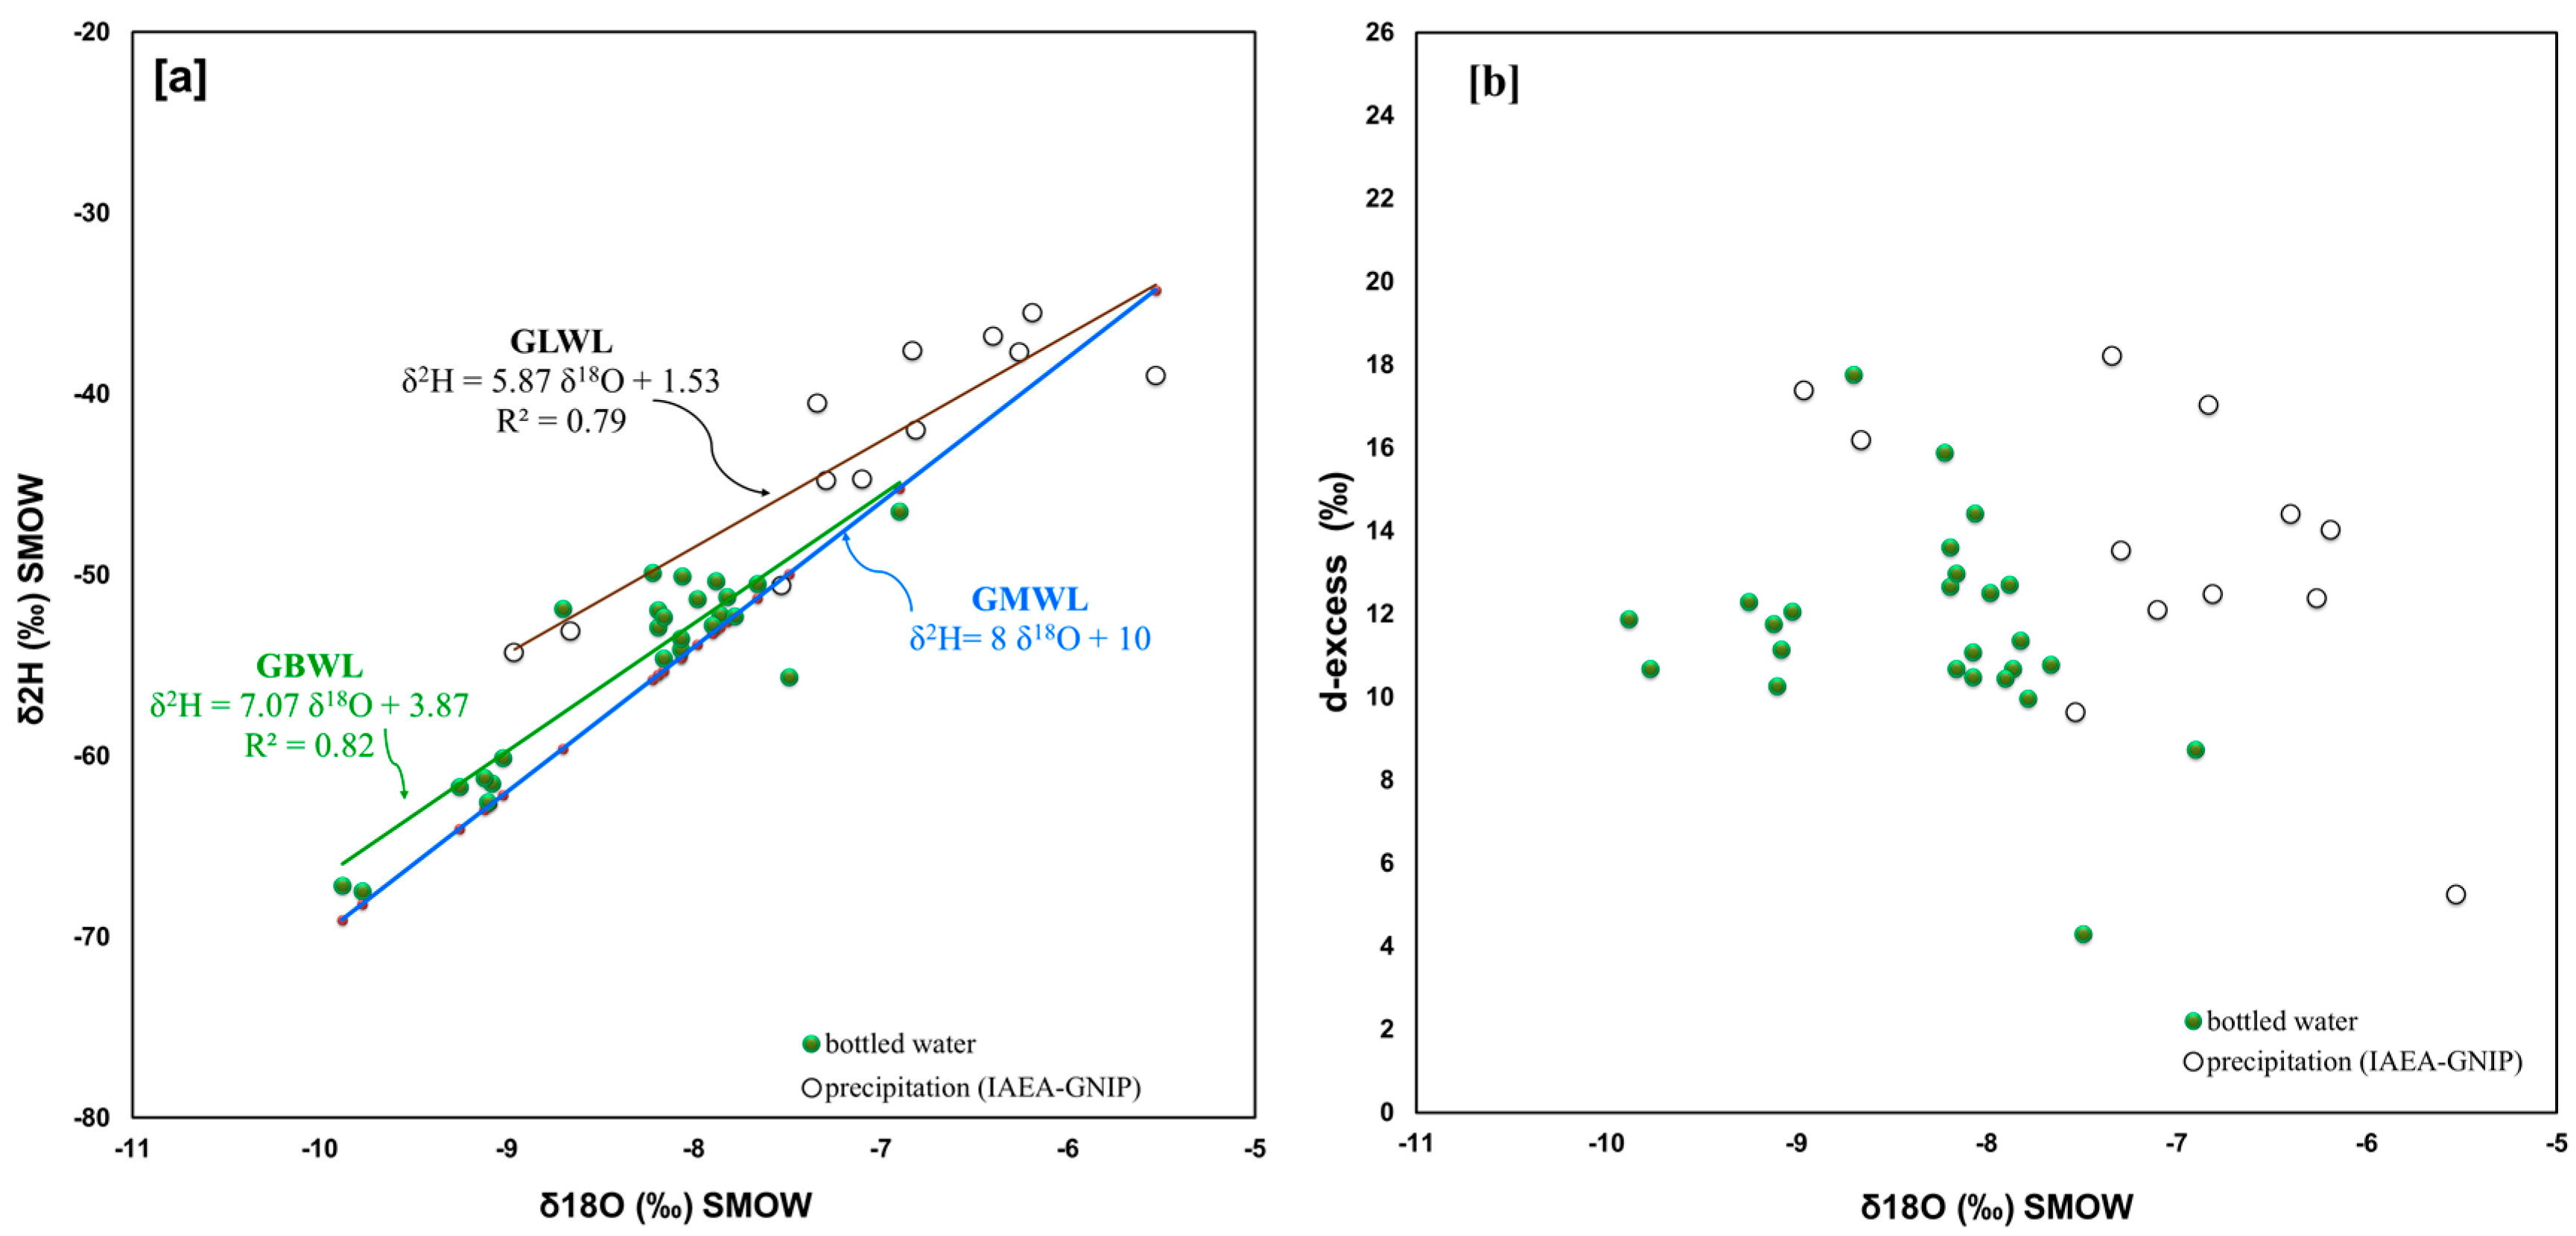
The isotopic data of bottled waters were compared with the isotopic data of rainwater monitored by IAEA-GNIP stations in the European area (Figure 5). In particular, in Figure 5a are plotted 18O/16O versus D/H (2H/1H) data for both the bottled waters of our database and the precipitation analyzed by the IAEA-GNIP monitoring network. Highly depleted values in heavy isotopes are concentrated in the stations located in the northernmost sectors of the European area (see the following section). However, local effects due to the altitude cannot be excluded. Both isotopic compositions suggest roughly similar trends, though the precipitation waters seem to have relatively higher values with respect to bottled waters. This is possibly due to the fact that bottled waters are generally fed from high-altitude springs, while the measurement stations are commonly located at lower altitudes. In this regard, in some cases, the two datasets have partially overlapping values (Italy), while in other countries like Austria, Croatia, and France, the separation between the two datasets could be due to the paucity of bottled water data.
We also calculated the excess deuterium in both precipitation and bottled water. Excess deuterium can be a crucial parameter to compare the two datasets. This isotopic parameter, defined by Dansgaard [2] as d-excess ‰ = δ2H − 8 δ18O, reflects the deviation of a water sample (precipitation) from the meteoric water line defined by Craig [45] based on the following equation:
δ2H = 8 δ18O + 10
Values of d-excess (d) vary due to kinetic phenomena that take place during evaporation and condensation processes in the water cycle, providing additional information otherwise unavailable from δ18O profiles alone (e.g., [3,46,47]). A d-excess value greater than 10 indicates evaporation in a Mediterranean environment, while a value lower than 10 corresponds to an ocean environment.
The d-excess values found in bottled waters have an overall similar distribution with respect to those of the IAEA-GNIP network stations (Figure 5b). The points outside the weak clustering of the values all belong to the precipitation dataset and are possibly due to the intrinsic uncertainties of the sampling procedures and/or local factors [48]. According to Gonfiantini [49], Rozanski et al. [50], Batibeniz et al. [51], Dünkeloh and Jacobeit [52], the prevailingly observed d-excess values suggest that the analyzed precipitations were influenced by atmospheric masses mainly of Atlantic Ocean origin and secondarily of Mediterranean.
For both distributions described above, namely the 18O/16O versus D/H and the 18O/16O versus d-excess, we performed a statistical analysis based on the standardized Score (Z-Score) approach. This method has been applied in several geochemical and isotopic studies as a useful tool to determine the number of standard deviations by which the value of a data point (in our datasets) is above or below the mean value of what is being observed or measured. Raw scores above the mean have positive standard scores, while those below the mean have negative standard scores. This statistical analysis contributes to a better understanding if a specific observation is common or exceptional (e.g., [53,54,55,56,57,58]).
For the purpose of this research, the Z-score method was applied to the stable isotopic data using the following equation:
Z-score = (X − μ)/σ
where Χ represents the isotopic values (δ2H, δ18O or d-excess); μ the average, and σ the standard deviation of each element’s isotope ratio. The obtained Z-score for the 18O/16O versus D/H and the 18O/16O versus d-excess values are plotted in Figure 5c,d, respectively. In these figures, it is possible to observe that for the bottled water, 98.4% of the Z-score values are in the range −2 ≤ z ≤ 2 for δ18O, and 96% for both δ2H and d-excess values. These results confirm the reliability of the analyzed datasets, allowing, therefore, the exploitation of their stable isotopic ratio in the present study. For both datasets of bottled waters and measured precipitations, only four δ2H values could be considered outliers, with |Z-score| > 2 indicating that they deviate more than 2 standard deviations from the relative means. Relative to the δ18O outlier were values seven and three for the bottled waters and precipitations, respectively. Finally, data from five and seven fall outside the above range of the Z-score, respectively, for the d-excess of the two datasets.
In order to better analyze the datasets, for each country considered in this research, we also calculated the trend line separately for both 18O/16O versus D/H datasets (i.e., bottled waters and precipitation measurements by IAEA-GNIP stations) and compared them. Each country will be discussed in the following section, where all corresponding graphs δ18O versus δ2H include:
(i)
the Global Meteoric Water Line (GMWL) as obtained from equation δ2H = 8 δ18O + 10 [45];
(ii)
the Local Meteoric Water Line (xLWL, where the first letter recalls the country name, e.g., ILWL for Italy and GLWL for Greece) based on the IAEA network data;
(iii)
the Local Bottled Water Line (xBWL, where the first letter recalls the country name, e.g., IBWL for Italy and GBWL for Greece).
In order to determine the relationships between the two variables, in all these diagrams we have adopted a linear regression model better representing the distribution of the observed data (equation in the form Y = aX + b). For each regression line, the correlation coefficient indicating the statistical strength of the relationship is also indicated in the figures. For completeness, the above diagrams are paired with the 18O/16O versus d-excess graphs for the corresponding sub-dataset of the country.
As mentioned above, based on these comparisons, we want to investigated whether the isotopic data of the stations’ meteoric water can be used as an indicator for the isotopic data of bottled water, in places where bottled water is not sampled.

3.2.1. Italy

A large dataset of bottled waters is available for Italy (Figure 1), and their distribution in the 18O/16O versus δ2H clearly shows two aligned clusters corresponding to IBWL and ILWL, respectively. The two regression lines have angular coefficients slightly differing by 1.1 (Figure 6a). The waters of the IAEA-GNIP stations located in Italy fall above the global meteoric line, which means that they are marginally enriched in deuterium compared to the GMWL.
Moreover, the same Figure 6a shows how the bottled waters (δ2H = 7.89 δ18O + 9.22) are located almost along the Global Meteoric Water Line. As concerns the δ18O versus d-excess graph (Figure 6b), it is possible to observe that the excess of deuterium for bottled waters averages 10.1, with a minimum value of 6.2 and a maximum of 14.8, while d-excess for sampled IAEA-GNIP waters is much more variable, from a minimum of 3.5 to a maximum of 24.8, with an average of 15.7.
From these observations, we could infer that bottled waters in Italy are less affected by precipitations originating within the Mediterranean if compared to IAEA-GNIP waters. This effect may be due to the relatively large geographic scattering of the available and considered stations in Italy (Figure 2).

3.2.2. Greece

The spatial distribution of the analyzed bottled water sites for Greece is relatively uniform (Figure 1), while the angular coefficient of the trend lines for the two datasets (GBWL and GLWL) have a difference of 1.2 (Figure 7a). The most negative values in 18O and 2H are observed in the samples from central Greece (codes 71 and 72; Lamia area; mountains Oiti). It is worth noting that both waters lie above the GMWL, which means that they are slightly enriched in D compared to the GMWL, but still the values (d-excess) of the two groups are in line with each other (Figure 7b).
In particular, the binary diagram δ18O versus d-excess (Figure 7b) shows that the bottled and the station waters have varying values of d-excess with similar maxima and minima. Indeed, the average d-excess for the bottled waters and for the IAEA-GNIP waters is 11.7 and 13.2, respectively, while the ranges are 4.3–17.8 and 5.2–18.2. Both types of waters can be said to be at least partially affected by a significant Mediterranean evaporation environment.

3.2.3. Slovenia

Thirty-eight brands of bottled water were taken into consideration in Slovenia (Figure 1). From the diagram represented in Figure 8a, it is clear that for both the SBWL and SLWL datasets, the regression lines are almost parallel and characterized by a very similar angular coefficient differing by only 0.27. Although the two clusters are aligned and basically fall along the GMWL, the IAEA-GNIP stations subset is characterized by less negative values.
From Figure 8b, it is possible to observe that the d-excess for both groups of waters have ranged between 6 and 15, with the exception of two samples reaching a value of about 18.0 and corresponding to the Donat Mg water brand (codes 85 and 86). The average of the d-excess for bottled waters is 11.1 and for local IAEA-GNIP stations waters is 10.5. Accordingly, it is possible to infer that both types of waters evaporated in a mixed Atlantic and Mediterranean environment.

3.2.4. Austria

In Austria, we could, unfortunately, find only four bottled waters (Figure 1 and Figure 9a), and, therefore, the regression line for the isotopic data (ABWL) obtained from such a small statistical population is poorly constrained (R2 = 0.48) and highly skewed relative to the trend line for the IAEA station waters (ALWL). Indeed, the angular coefficient for the two curves is ca. 3.6 and 6.9, respectively. On the other hand, the data associated with the waters from the IAEA stations are fairly well aligned with the GMWL.
Also, for the d-excess parameter (Figure 9b), the Austrian points are largely dispersed. If compared with those from Italy, Greece, and Slovenia, they have lower maximum values. The maximum and the minimum for the Austrian data are 14.4 and 4.4, respectively, and both points belong to the waters of the IAEA-GNIP stations.
The mean d-excess value for bottled water is 9.9, while for station waters it is 9.4, therefore suggesting that evaporation of the feeding waters mainly occurred in the oceanic environment.

3.2.5. Croatia

Also, for Croatia, only four bottled water samples are available (Figure 1) and similar to Austria, the statistical significance of the regression line for the isotopic data (CBWL) is relatively small (Figure 10a). The associated angular coefficient is equal to ca. 4.1 and, thus, is quite different from that obtained for the IAEA-GNIP monitoring stations (CLWL). On the other hand, the latter is ca. 7.2, quite similar in trend to the GMWL, though the data are slightly shifted upwards in the graph (i.e., less negative values), suggesting some amount of depletion of the deuterium.
For the same datasets, Figure 10b shows that the points are very scattered both in terms of δ18O, varying from −10.8 to −5.0, and d-excess, ranging between 3.0 and 19.0. The average of deuterium excess for bottled water is 9.51, while for waters from local IAEA-GNIP stations it is 10.5, and this value indicates a mainly Atlantic evaporation environment.

3.2.6. France

Finally, despite the fact that data from only three bottled waters are available for France (Figure 1), a much larger number of water samples from the IAEA-GNIP stations could be analyzed (Figure 2). Notwithstanding the very poor statistical population, the bottled waters almost perfectly aligned (R2 = 1.00), similar to the IAEA-GNIP stations data (R2 = 0.96). The angular coefficients of the two curves (FBWL and FLWL) differ by 2.4 (Figure 11a). It is worth noting that the waters of the IAEA-GNIP stations fall almost perfectly along the GMWL.
Figure 11b shows that the d-excess values for both datasets fall in the range 5–14, with the exception of two points, which likely suggests a seasonal recharge effect being all investigated catchment basins in the same geographic area of France.
The average d-excess of 9.0 indicates a mixed Atlantic and Mediterranean evaporation environment.

4. Discussion

The chemical and stable isotopic composition of natural water represents a memory of all the processes that took place from its formation to the sampling, including the transport phases. From a geochemical point of view, Ca(Mg)-HCO3 facies are defined as bicarbonate natural mineral waters and constitute the majority of the analyzed dataset. Bicarbonate waters are cold and alkaline mineral waters with low mineral content and diuretic properties. Various studies have evidenced the positive effects of bicarbonate mineral waters on the digestive tract, in particular when HCO3 is >600 mg/L ([59]; and references therein).
Due to the relatively low electrical conductivity values (mean 474 μS/cm; Figure 2 and Figure 3), a quality classification of the considered bottled waters is inappropriate, while trace elements not reported in the labels of the bottles could eventually reveal other details. In the recent past, human administrations of oxygen-18 and of deuterium much higher than the values found in nature have been attempted, but no adverse biological effects have been reported ([60]; and references therein). Therefore, the observed scattering of isotopic values should not be considered as a matter of concern for human consumption.
The isotopic compositions of hydrogen and oxygen reflect the hydrological cycle’s natural processes. Numerous authors have observed tight correlations of 2H and 18O with latitude, altitude, temperature, and continentality and these patterns are well-documented on maps of precipitation stable isotope ratios (e.g., [4,28,61,62,63,64]).
The isotopic composition of precipitation could be also locally governed by regional-scale processes. For example, the composition is largely influenced by the provenance of the wet air masses, the trajectories of the water vapor transport over the continents, their possible partial condensation in correspondence with continental areas, and generally by the average rain-out history of the air masses (e.g., [7,65]).
In this regard, and as a consequence of the intense air-sea interaction processes and the contribution of sea vapor to feed moisture-depleted continental air masses, the broader Mediterranean basin is characterized by a relatively complex pattern. Indeed, the trend line for meteoric waters within the eastern Mediterranean is estimated to be 2H = 8 δ18O + 20 [1,7], whereas for the western Mediterranean waters, it is 2H = 8 δ18O + 13.7 [66]. The difference in intercept values reflects the difference in origin, vapor supply, and removal history of air masses over the two regions, as observed in recent isotopic measurements of atmospheric vapor collected across the Mediterranean Sea [61].
As concerns the observed variations in d-excess, the causes could be several. Indeed, they could have been induced by differences in temperature, relative humidity, and wind speed at the sea surface, where most of the global atmosphere’s moisture originates, as well as from the contribution of recycled continental vapor [49]. Due to the intense evaporation of seawater in conditions of moisture deficit, air masses in continental areas have a deuterium excess greater than that observed globally [61]. This effect has been widely observed in coastal precipitation affecting the eastern Mediterranean basin [67,68], whereas precipitation in the western Mediterranean is clearly more influenced by moisture from the Atlantic Ocean [69].
On this note, we document that the isotopic composition of the considered bottled waters reveals significant similarities with IAEA-GNIP sampled precipitation waters. In almost all the investigated countries, bottled waters have been found to be relatively depleted in Oxygen and Hydrogen isotopic ratios when compared to IAEA-GNIP sampling points. This effect may be due to the seasonal recharge, which induces more depleted precipitation. Some differences related to d-excess have been found in Italy, where the geographic scattering of IAEA-GNIP sampling stations may affect data interpretation.

5. Conclusions

The interpretation of the isotopic data available for the considered bottled waters proved to be a useful tool for better understanding the feeding source and the evolution processes of selected aquifers. It may also assist in determining the origin of the bottled water, the natural conditions of the parent water, and the production process that transports water from the capture zone to the bottle. These characteristics are a result of the fact that water isotopes may serve as tracers of water’s ultimate source, reflecting the site of water evaporation rather than extraction. In addition, post-precipitation events, such as evaporation, can alter the isotopic signature of the source.
Bottled water samples from the Mediterranean Basin document the range and relationships between the stable isotopes. In particular, the range and patterns of stable hydrogen and oxygen isotopic variability in bottled waters from Italy are very wide and range from −13.8‰ to −5.5‰ for δ18O, and from −99‰ to −36‰ for δ2H. The relative equation of bottled water samples is δ2H = 7.89 δ18O + 9.22 (R2 = 0.89; data number: 59), very close to the regression line of the global meteoric waters.
The isotopic composition of Slovenian bottled waters ranges from −12.0‰ to −7.5‰ for δ18O, and from −81.0‰ to −46.0‰ for δ2H, and the linear relationships of the two parameters are expressed by the algebraic equation δ2H = 6.94 δ18O + 0.95(R2 = 0.91; data number: 38). Differently in Greece, the obtained regression line is described by equation δ2H = 7.07 δ18O + 3.87 (R2 = 0.82; data number: 25), ranging between −9.9‰ and −6.9‰ for δ18O, and from −67.5‰ to −46.5‰ for δ2H.
For Croatian bottled waters, the isotopic composition ranges between −10.8‰ and −9.5‰ for δ18O, and between −75.0‰ and −69.0‰ for δ2H, described by equation δ2H = 4.06 δ18O + 30.08 (R2 = 0.80; data number: 4). While from Austrian bottled samples, the linear relationship is expressed by equation δ2H = 3.57 δ18O + 67 (R2 = 0.48; data number: 4); with a very small range for δ18O (between −11.6‰ and −10.7‰), and from −83.0‰ to −77.9 ‰ for δ2H. For French bottled waters, the isotopic composition presents oscillation between −10.2‰ and −8.9 for δ18O, and from −74.0‰ to −57.6‰ for δ2H, with an associated best-fit equation δ2H = 4.06 δ18O + 30.08 (R2 = 0.80; data number: 3).
As a final comment, the obtained results are comparable, within the discussed limitations, with those obtained through the analysis of data collected in the IAEA-GNIP monitoring network. Based on the calculation of the excess of deuterium for each bottled water and for each IAEA-GNIP station water, we suggest that the waters of Italy, Greece, and Slovenia have mainly evaporated in the Mediterranean environment as they all have d-excess values greater than 10. In Croatia, the average excess of deuterium in the bottled waters (9.5) slightly differs from the IAEA-GNIP station waters (10.5); while for Austria and France, d-excess is lower than 10, indicating evaporation in the oceanic environment. Also, seasonal recharge processes may affect the feeding characteristics of aquifers; thus, the utilization of isotopic values of bottled waters should be limited to the observation of general trends in the isotopic composition of feeding waters, while more local studies are required for a better understanding of the hydro-geological circuits.

Supplementary Materials

The following supporting information can be downloaded at: https://www.mdpi.com/article/10.3390/w15193466/s1, Table S1a: Bottled waters considered in this paper (code number; brand name; location; isotopic composition in oxygen and deuterium; reference). Table S1b: Bottled water: sampling information. Table S2: Chemical composition of the bottled waters considered in this paper (code number, brand name, water type; elevation in m, a.s.l.; physical and chemical composition). Table S3: References of IAEA-GNIP stations monitoring of rainwater. Table S4: List of IAEA-GNIP stations monitoring rainwater and relative periods of operation (highlighted in yellow). In red, the reference period in this article.

Author Contributions

Conceptualization, D.R. and G.M.; methodology, D.R.; validation, D.R. and G.M.; formal analysis, C.V.; writing—original draft preparation, D.R., G.M., C.V.; writing—review and editing, D.R., G.Z., and G.M.; supervision, D.R.; project administration, D.R.; funding acquisition, D.R. All authors have read and agreed to the published version of the manuscript.

Funding

The research activities of D.R. are supported by a contract in the frame of the PON REACT EU Project by the Italian MUR (No. 09-G-48651-15) and G.M. received funds from the Chinese Academy of Sciences as a visiting professorship for senior international scientists (No. 2018VMA007). This work was partially supported by the National Key Research and Development Program of China (2021YFA0719003; 2019YFA0708501).

Data Availability Statement

Not applicable.

Acknowledgments

Thanks to Dimitra K. Rapti, Carlo Antonio Caputo, and Christos Raptis for their contribution in data collection and two anonymous reviewers for their comments that contributed to improve the final version of the paper.

Conflicts of Interest

The authors declare no conflict of interest.

References

  1. IAEA-GNIP. Available online: https://www.iaea.org/services/networks/gnip (accessed on 3 June 2022).
  2. Dansgaard, W. Stable isotopes in precipitation. Tellus 1964, 16, 436–468. [Google Scholar] [CrossRef]
  3. Gat, J.R.; Carmi, I. Evolution of the Isotopic Composition of Atmospheric Waters in the Mediterranean Sea Area. J. Geophys. Res. 1970, 75, 3039–3048. [Google Scholar] [CrossRef]
  4. Gat, J.R. Oxygen and hydrogen isotopes in the hydrologic cycle. Annu. Rev. Earth Planet. Sci. 1996, 24, 225–262. [Google Scholar] [CrossRef]
  5. Araguás-Araguás, L.; Froehlich, K.; Rozanski, K. Deuterium and oxygen-18 isotope composition of precipitation and atmospheric moisture. Hydrol. Process. 2000, 14, 1341–1355. [Google Scholar] [CrossRef]
  6. Bowen, G.J.; Wilkinson, B. Spatial distribution of δ18O in meteoric precipitation. Geology 2002, 30, 315–318. [Google Scholar] [CrossRef]
  7. Bowen, G.J.; Revenaugh, J. Interpolating the isotopic composition of modern meteoric precipitation. Water Resour. Res. 2003, 39, 1299. [Google Scholar] [CrossRef]
  8. ErdelyiIstvan, D.; Hatvani, I.G.; Jeon, H.; Jones, M.; Tyler, J.; Kern, Z. Predicting spatial distribution of stable isotopes in precipitation by classical geostatistical-and machine learning methods. J. Hydrol. 2023, 617 Pt C, 129129. [Google Scholar] [CrossRef]
  9. Tsunogai, U.; Wakita, H. Precursory chemical changes in ground water: Kobe earthquake, Japan. Science 1995, 269, 61–63. [Google Scholar] [CrossRef]
  10. Inan, S.; Balderer, W.P.; Leuenberger-West, F.; Yakan, H.; Uozvan, A.; Freund, F.T. Springwater chemical anomalies prior to the Mw = 7.2 Van Earthquake (Turkey). Geochem. J. 2012, 46, e11–e16. [Google Scholar] [CrossRef]
  11. Fidani, C.; Balderer, W.; Leuenberger, F. The possible influences of the 2012 Modena earthquakes on the fluorescence spectra of bottled mineral water. Hydrol. Curr. Res. 2017, 8, 288. [Google Scholar] [CrossRef]
  12. Naddeo, V.; Zarra, T.; Belgiorno, A. A comparative approach to the variation of natural elements in Italian bottled waters according to the national and international standard limits. J. Food Compos. Anal. 2008, 21, 505–514. [Google Scholar] [CrossRef]
  13. Ballantine, P.W.; Ozanne, L.K.; Bayfield, R. Why buy free? exploring perceptions of bottled water consumption and its environmental consequences. Sustainability 2019, 11, 757. [Google Scholar] [CrossRef]
  14. STATISTA Database. Available online: https://www.statista.com/outlook/cmo/non-alcoholic-drinks/bottled-water/eu-27 (accessed on 15 January 2023).
  15. IBWA. International Bottled Water Association. 2023. Available online: https://bottledwater.org/nr/consumers-want-bottled-water-to-be-available-wherever-drinks-are-sold-and-if-its-not-most-will-choose-another-packaged-beverage-that-uses-much-more-plastic/ (accessed on 15 January 2023).
  16. EC. Council directive 80/777/EEC of 15 July 1980 on the approximation of the laws of the Member States relating to the exploitation and marketing of natural mineral waters. Off. J. Eur. Commun. 1980, 229, 1–10. [Google Scholar]
  17. Tapias, J.C.; Melián, R.; Sendrós, A.; Font, X.; Casas, A. Geochemical Characterisation and Health Concerns of Mineral Bottled Waters in Catalonia (North-Eastern Spain). Water 2022, 14, 3581. [Google Scholar] [CrossRef]
  18. Lee, K.-J.; Yu, S.; Kim, K.-H.; Kang, K.-G.; Moon, S.-H.; Kim, M.-S.; Yun, S.-T. Hydrogeochemical Characteristics of Bottled Waters Sourced from Bedrock Aquifers in South Korea: Evaluation of Water Type and Natural Background Levels. Water 2022, 14, 1457. [Google Scholar] [CrossRef]
  19. Rman, N.; Szőcs, T.; Palcsu, L.; Lapanje, A. Chemical and isotopic composition of CO2-rich magnesium–sodium–bicarbonate–sulphate-type mineral waters from volcanoclastic aquifer in Rogaška Slatina, Slovenia. Environ. Geochem. Health 2022, 44, 2187–2214. [Google Scholar] [CrossRef] [PubMed]
  20. Iyakarea, J.D.; Taupinb, J.-D.; Hitimanaa, C.N.; Dusabimanaa, T.; Ghalitc, M.; El Ouahabid, M.; Benalie, M.; Ngendof, C.; Gharibi, E.K. Hydrochemical study of bottled water in Rwanda and relationship with their origin. Water Supply 2022, 22, 1155–1167. [Google Scholar] [CrossRef]
  21. Misund, A.; Frengstad, B.; Siewers, U.; Reimann, C. Variation of 66 elements in European mineral waters. Sci. Total. Environ. 1999, 243–244, 21–41. [Google Scholar] [CrossRef]
  22. Fugedi, U.; Kuti, L.; Jordan, G.; Kerek, B. Investigation of the hydrogeochemistry of some bottled mineral waters in Hungary. J. Geochem. Explor. 2010, 107, 305–316. [Google Scholar] [CrossRef]
  23. Kendall, C.; Caldwell, E.A. Fundamentals of Isotope Geochemistry. In Isotope Tracers in Catchment Hydrology; Kendall, C., McDonnell, J.J., Eds.; Elsevier Science B.V.: Amsterdam, The Netherlands, 1998; pp. 51–86. [Google Scholar]
  24. Rozanski, K.; Sonntag, C.; Munnich, K.O. Factors controlling stable isotope composition of European precipitation. Tellus 1982, 34, 142–150. [Google Scholar] [CrossRef]
  25. Poage, M.A.; Chamberlain, C.P. Empirical Relationships Between Elevation and the Stable Isotope Composition of Precipitation and Surface Waters: Considerations for Studies of Paleoelevation Change. Am. J. Sci. 2001, 301, 1–15. [Google Scholar] [CrossRef]
  26. Guo, H.; Zhu, G.; He, Y.; Zhou, J.; Pan, H.; Ma, X.; Zhang, J. Dynamic characteristics and influencing factors of precipitation δ18O, China. Theor. Appl. Clim. 2019, 138, 899–910. [Google Scholar] [CrossRef]
  27. Vystavna, Y.; Matiatos, I.; Wassenaar, L.I. Temperature and precipitation effects on the isotopic composition of global precipitation reveal long-term climate dynamics. Sci. Rep. 2021, 11, 18503. [Google Scholar] [CrossRef]
  28. Clark, I.D.; Fritz, P. Environmental Isotopes in Hydrogeology, 2nd ed.; Lewis Publisher: Boca Raton, FL, USA, 1997; pp. 13–168. ISBN 978 1 5667 0249 2. [Google Scholar] [CrossRef]
  29. Bowen, G.J.; Winter, D.A.; Spero, H.J.; Zierenberg, R.A.; Reeder, M.D.; Cerling, T.E.; Ehleringer, J.R. Stable hydrogen and oxygen isotope ratios of bottled waters of the world. Rapid Commun. Mass Spectrom. 2005, 19, 3442–3450. [Google Scholar] [CrossRef] [PubMed]
  30. Rapti-Caputo, D.; Martinelli, G. The geochemical and isotopic composition of aquifer systems in the deltaic region of the Po River plain (northern Italy). Hydrogeol. J. 2009, 17, 467–480. [Google Scholar] [CrossRef]
  31. Raco, B.; Dotsika, E.; Feroni, A.C.; Battaglini, R.; Poutoukis, D. Stable isotope composition of Italian bottled waters. J. Geochem. Explor. 2013, 124, 203–211. [Google Scholar] [CrossRef]
  32. Brencic, M.; Vreca, P. Identification of sources and production processes of bottled waters by stable hydrogen and oxygen isotope ratios. Rapid Commun. Mass Spectrom. 2006, 20, 3205–3212. [Google Scholar] [CrossRef] [PubMed]
  33. Dotsika, E.; Poutoukis, D.; Raco, B.; Psomiadis, D. Stable isotope composition of Hellenic bottled waters. J. Geochem. Explor. 2010, 107, 299–304. [Google Scholar] [CrossRef]
  34. Brenčič, M.; Ferjan, T.; Gosar, M. Geochemical survey of Slovenian bottled waters. J. Geochem. Explor. 2010, 107, 400–409. [Google Scholar] [CrossRef]
  35. Zuliani, T.; Kanduč, T.; Novak, R.; Vreča, P. Characterization of bottled waters by multielemental analysis, stable and radiogenic isotopes. Water 2020, 12, 2454. [Google Scholar] [CrossRef]
  36. IAEA-GNIP Database. Available online: https://nucleus.iaea.org/wiser (accessed on 3 June 2022).
  37. Hem, J.D. Study and Interpretation of the Chemical Characteristics of Natural Water, 3rd ed.; U.S. Geological Survey: Reston, VA, USA, 1985; Water-Supply Paper 2254.
  38. Dinelli, E.; Lima, A.; De Vivo, B.; Albanese, S.; Cicchella, D.; Valera, P. Hydrogeochemical analysis on Italian bottled mineral waters: Effects of geology. J. Geochem. Explor. 2010, 107, 317–335. [Google Scholar] [CrossRef]
  39. Yu, S.; Chae, G.; Oh, J.; Kim, S.-H.; Kim, D.-I.; Yun, S.-T. Hydrochemical and Isotopic Difference of Spring Water Depending on Flow Type in a Stratigraphically Complex Karst Area of South Korea. Front. Earth Sci. 2021, 9, 712865. [Google Scholar] [CrossRef]
  40. Ciotoli, G.; Guerra, M. Distribution and physico-chemical data of Italian bottled natural mineral waters. J. Maps 2016, 12, 917–935. [Google Scholar] [CrossRef]
  41. Vázquez, A.; Costoya, M.; Peña, R.M.; García, S.; Herrero, C. A rainwater quality monitoring network: A preliminary study of the composition of rainwater in Galicia (NW Spain). Chemosphere 2003, 51, 375–386. [Google Scholar] [CrossRef] [PubMed]
  42. Boussaton, M.; Coquillat, S.; Chauzy, S.; Georgis, J.F. Influence of water conductivity on micro-discharges from raindrops in strong electric fields. Atmos. Res. 2005, 76, 330–345. [Google Scholar] [CrossRef]
  43. Beysens, D.; Lekouch, I.; Muselli, M.; Mileta, M.; Milimouk-Melnytchouk, I.; Sojat, V. Physical and chemical properties of dew and rain water in the Dalmatian coast, Croatia. In Proceedings of the 5th International Conference on Fog, Fog Collection and Dew, Münster, Germany, 25–30 July 2010. FOGDEW2010-24. [Google Scholar]
  44. Langelier, W.F.; Ludwig, H.F. Graphical Methods for Indicating the Mineral Character of Natural Waters. J. Am. Water Works Assoc. 1942, 34, 335–352. [Google Scholar] [CrossRef]
  45. Craig, H. Isotopic variations in meteoric waters. Science 1961, 133, 1702–1703. [Google Scholar] [CrossRef]
  46. Pfahl, S.; Sodemann, H. What controls deuterium excess in global precipitation? Clim. Past 2014, 10, 771–781. [Google Scholar] [CrossRef]
  47. LeGrande, A.N.; Schmidt, G.A. Global gridded data set of the oxygen isotopic composition in seawater. Geophys. Res. Lett. 2006, 33, L12604. [Google Scholar] [CrossRef]
  48. Natali, S.; Baneschi, I.; Doveri, M.; Giannecchini, R.; Selmo, E.; Zanchetta, G. Meteorological and geographical control on stable isotopic signature of precipitation in a western Mediterranean area (Tuscany, Italy): Disentangling a complex signal. J. Hydrol. 2021, 603, 126944. [Google Scholar] [CrossRef]
  49. Gonfiantini, R. On the isotopic composition of precipitation. In Hydrology and Isotope Geochemistry; In Proc. Int. Symp memory of Jean Charles Fontes; CNRS-Universitè de Paris-Sud: Bures-sur-Yvette, France, 1998; pp. 3–22. [Google Scholar]
  50. Rozanski, K.; Araguás-Araguás, L.; Gonfiantini, R.; Swart, P.K.; Lohmann, K.C.; Mckenzie, J.; Savin, S. Isotopic Patterns in Modern Global Precipitation. Climate Change in Continental Isotopic Records; Am. Geophys Union: Washington, DC, USA, 1993; pp. 1–36. [Google Scholar] [CrossRef]
  51. Batibeniz, F.; Ashfaq, M.; Önol, B.; Turuncoglu, U.U.; Mehmood, S.; Evans, K.J. Identification of major moisture sources across the Mediterranean Basin. Clim. Dyn. 2020, 54, 4109–4127. [Google Scholar] [CrossRef]
  52. Dünkeloh, A.; Jacobeit, J. Circulation dynamics of Mediterranean precipitation variability 1948–98: Circulation dynamics of mediterranean precipitation variability. Int. J. Climatol. 2003, 23, 1843–1866. [Google Scholar] [CrossRef]
  53. Zhao, Y.; Zhang, B.; Chen, G.; Chen, A.; Yang, S.; Ye, Z. Tracing the geographic origin of beef in China on the basis of the combination of stable isotopes and multielement analysis. J. Agric. Food Chem. 2013, 61, 7055–7060. [Google Scholar] [CrossRef] [PubMed]
  54. Balaram, V.; Satyanarayanan, M. Data quality in geochemical elemental and isotopic analysis. Minerals 2022, 12, 999. [Google Scholar] [CrossRef]
  55. Dunn, P.J.H.; Carter, J.F.; Chesson, L.A.; Doyle, S.P.; Howa, J.D.; Gaunt, W.; Whetton, M. The FIRMS Network’s PT scheme: What can be learned about inter-laboratory performance? Forensic Chem. 2021, 22, 100306. [Google Scholar] [CrossRef]
  56. Millar, C.; Janzen, K.; Nehemy, M.F.; Koehler, G.; Hervé-Fernández, P.; McDonnell, J.J. Organic contamination detection for isotopic analysis of water by laser spectroscopy. Rapid Commun. Mass Spectrom. 2021, 35, e9118. [Google Scholar] [CrossRef] [PubMed]
  57. Won, E.-J.; Kim, S.H.; Go, Y.-S.; Kumar, K.S.; Kim, M.-S.; Yoon, S.-H.; Bayon, G.; Kim, J.-H.; Shin, K.-H. A Multi-Elements Isotope Approach to Assess the Geographic Provenance of Manila Clams (Ruditapes philippinarum) via Recombining Appropriate Elements. Foods 2021, 10, 646. [Google Scholar] [CrossRef] [PubMed]
  58. Terzer-Wassmuth, S.; Ortega, L.; Araguás-Araguás, L.; Wassenaar, L.I. The first IAEA inter-laboratory comparison exercise in Latin America and the Caribbean for stable isotope analyses of water samples. Isot. Environ. Health Stud. 2020, 56, 391–401. [Google Scholar] [CrossRef] [PubMed]
  59. Quattrini, S.; Pampaloni, B.; Brandi, M.L. Natural mineral waters: Chemical characteristics and health effects. Clin. Cases Miner. Bone Metab. 2016, 13, 173–180. [Google Scholar] [CrossRef]
  60. Davies, P.S.W. Stable isotopes: Their use and safety in human nutrition studies. Eur. J. Clin. Nutr. 2020, 74, 362–365. [Google Scholar] [CrossRef] [PubMed]
  61. Gat, J.R.; Klein, B.; Kushnir, Y.; Roether, W.; Wernli, H.; Yam, R.; Shemesh, A. Isotope composition of air moisture over the Mediterranean Sea: An index of the air-sea interaction pattern. Tellus 2003, 55B, 953–965. [Google Scholar]
  62. Bowen, G.J.; Cai, Z.; Fiorella, R.P.; Putman, A.L. Isotopes in the water cycle: Regional- to global-scale patterns and applications. Annu. Rev. 2019, 47, 453–479. [Google Scholar] [CrossRef]
  63. Rozanski, K.; Froelich, K.J.; Mook, W.G. Environmental Isotopes in the Hydrological Cycle, Principles and Applications, Surface Water; IHP-V-Technical Documents in Hydrology; Mook, W.G., Ed.; UNESCO/IAEA: Paris, France, 2001; Volume III, p. 117. [Google Scholar]
  64. Mook, W.G. Environmental Isotopes in the Hydrological Cycle. Principles and Applications, Introduction theory, methods, review; IHP-V-Technical Documents in Hydrology; Mook, W.G., Ed.; UNESCO/IAEA: Paris, France, 2001; Volume I, p. 164. [Google Scholar]
  65. Merlivat, L.; Jouzel, J. Global climatic interpretation of the deuterium-oxygen 18 relationship for precipitation. J. Geophys. Res. Atmos. 1979, 84, 5029–5033. [Google Scholar] [CrossRef]
  66. Celle-Jeanton, H.; Gonfiantini, R.; Travi, Y.; Sol, B. Oxygen-18 variations of rainwater during precipitation: Application of the Rayleigh model to selected rainfalls in Southern France. J. Hydrol. 2004, 289, 165–177. [Google Scholar] [CrossRef]
  67. Kattan, Z. Environmental isotope study of the major karst springs in Damascus limestone aquifer systems: Case of the Figeh and Barada springs. J. Hydrol. 1997, 193, 161–182. [Google Scholar] [CrossRef]
  68. Longinelli, A.; Selmo, E. Isotopic composition of precipitation in Italy: A first overall map. J. Hydrol. 2003, 270, 75–88. [Google Scholar] [CrossRef]
  69. Cruz-San Julian, J.; Araguás, L.; Różánski, K.; Benavente, J.; Cardenal, J.; Hidalgo, M.C.; Garcia-Lopez, S.; Martinesz-Garrido, J.C.; Moral, F.; Olias, M. Sources of precipitation over South-Eastern Spain and groundwater recharge. An isotopic study. Tellus 1992, 44B, 226–236. [Google Scholar] [CrossRef]
Figure 1. (a) Distribution of the bottled water investigated sites (see Supplementary Materials; Table S1a); and (b) of the IAEA-GNIP stations considered in the present research (see Supplementary Materials; Table S4).
Water 15 03466 g001
Figure 2. Box and whisker plots distribution (median; box edges: lower 25% and upper 75% quartiles; whiskers lower 10% and upper 90% percentiles). Electrical conductivity values (EC) in µS/cm at 25 °C; elevation of the spring (elev.) in meters a.s.l.
Water 15 03466 g002
Figure 3. Electrical conductivity values (µS/cm at 25 °C) in the bottled water (for numbers refer to the code listed in the Supplementary material, Table S2.).
Water 15 03466 g003
Figure 4. Langelier-Ludwig diagram showing the major ionic composition of the bottled waters. The labelled symbols represent bottled water samples discussed in the text, where associated numbers refer to the code listed in the Supplementary Material, Table S2.
Water 15 03466 g004
Figure 5. 18O/16O versus D/H (a); O18O/16O versus d-excess values, in bottled waters and in the precipitation (IAEA-GNIP monitoring network; (b)) and plot diagram of Z-score values (c,d).
Water 15 03466 g005
Figure 6. Italy: (a) 18O/16O vs. D/H in bottled water and related straight line, IAEA-GNIP network isotope data for the period 1997–2002 and related straight line; (b) 18O/16O versus d-excess.
Water 15 03466 g006
Figure 7. Greece (a) 18O/16O versus D/H in bottled water and related straight line, IAEA-GNIP network isotope data (reference period 2001–2003) and related straight line; (b) 18O/16O versus d-excess.
Water 15 03466 g007
Figure 8. Slovenia (a) 18O/16O versus D/H in bottled water and related straight line, IAEA-GNIP net-work isotope data from the years 2000 to 2003 and related straight line; (b) 18O/16O versus d-excess.
Water 15 03466 g008
Figure 9. Austria (a) 18O/16O versus D/H in bottled water and related straight line, IAEA-GNIP net-work isotope data for 1990–2002 and related straight line; (b) 18O/16O versus d-excess.
Water 15 03466 g009
Figure 10. Croatia (a) 18O/16O versus D/H in bottled water and related straight line, IAEA-GNIP net-work isotope data from 2000 to 2003 and related straight line; (b) 18O/16O versus d-excess.
Water 15 03466 g010
Figure 11. France (a) 18O/16O versus D/H in bottled water and related straight line, IAEA-GNIP net-work isotope data (period 1997–1998) and related straight line; (b) 18O/16O versus d-excess.
Water 15 03466 g011
Disclaimer/Publisher’s Note: The statements, opinions and data contained in all publications are solely those of the individual author(s) and contributor(s) and not of MDPI and/or the editor(s). MDPI and/or the editor(s) disclaim responsibility for any injury to people or property resulting from any ideas, methods, instructions or products referred to in the content.

