Abstract
While humans need water to survive, water can also efficiently transmit microbial diseases and heavy metals to consumers. Over 50,000 water violations occurred in 2020 and such burdens were not borne equally amongst consumers. Yet, the factors that drive such variation remain unclear. We examined the interactions between water quality and inherited equity gaps in one of the most diverse urban areas in the United States. We used publicly available drinking water datasets to determine which contaminant was most prevalent between 2010–2020 and who was significantly more likely to be affected by this contamination. We found that a lack of legal rights to control the water quality in one’s home (i.e., renting) was the number one predictor of heavy metal violations in a municipality. Individuals who spoke a language other than English were significantly more likely to rent homes with unsafe drinking water. To ensure equity in public health outcomes, current mandates must expand to include the design of actionable plans which include linguistically and culturally diverse residents, landlords, and tenants, as stakeholders in public water and housing decision making and remediation processes.
1. Introduction
Humans need water to survive, but water can also efficiently transmit both microbial diseases and heavy metals resulting in public health concerns [1]. Globally, roughly four billion microbial outbreaks occur annually [2]. Half of such waterborne diseases are linked to contaminated potable water which can result in infectious diseases, skin diseases, and cancer [3]. Between 2011 and 2012, the United States of America reported thirty-two water borne outbreaks that resulted in over 400 illnesses, 100 hospitalizations, and over twelve deaths [3]. Water can also contain excess amounts of thirty-five metals that are hazardous to human health, including twenty-three heavy metals (e.g., lead (Pb)) [4,5]. Contamination from lead in drinking water with amounts as low as 1 μg/dL can result in neurodevelopment, reproductive, and cardiovascular public health concerns [6]. Lead concentrations in water sources are typically low, but such water can be contaminated as it is transported through leaded pipes, across solder, and out of faucets [6].
The United States Environmental Protection Agency (US EPA) established the Safe Drinking Water Act (SDWA) in 1974 to designate the safe legal limits for over ninety chemical and microbial contaminants in potable water [1,7,8]; however, discriminatory practices have increased environmental health disparities [9]. While regulations are federal, states retain primacy and can set their own standards to ensure that regional concerns are also met [8]. Yet, large numbers of safety violations persist in public water supplies [10]. Of the United States active 150,438 public water supply departments, 51,573 incurred at least one violation of which 4470 were deemed serious [11]. However, such burdens are not borne equally among water consumers; from 2013 to 2017 over one million Black, Indigenous, and other people of color (BIPOC) residing in the United States had insecure access to clean water [9]. Federal and state administrations inconsistently address urban environmental health disparities; this leaves diverse communities at constant risk with the underlying causes and effects not well understood [12,13].
Water service lines are often owned by homeowners, allowing state dismissal of quality concerns [14]. Yet, historic redlining practices forced BIPOC communities to settle in areas that were deemed least desirable, not by choice, but because of maps that directed home loan institutions to deny loans to them elsewhere [15,16]. Since these practices can directly lead to disparities in public environmental health hazards, even when controlling for confounding variables such as water quality violation rates [17], it is essential to determine if historic redlining continues to affect poor water quality. If it does not, it is essential to determine other factors that may be responsible for driving persistent water quality violations, such as resource availability or diversity-driven effects which no longer correspond to historic redlining because of high mobility [14,18,19,20,21,22,23,24,25,26,27].
Diversity is complex and includes qualities such as language, nationality, and race [28]. Such factors may influence an individual’s likelihood of knowing about or addressing water quality issues, because they are more likely to seek assistance and/or information from individuals who speak the same language, are of the same nationality, and/or the same race [29,30,31]. Diversity and inclusive assistance seeking may also affect the likelihood that one chooses, or is forced, to settle in areas of increased risk because of factors which continue to drive inequitable access to safe housing and infrastructure. Therefore, it is essential to identify the complex ways in which diversity interacts with environmental health to tailor efforts specifically to the communities they serve and ensure equitable access to safe drinking water [13].
New Jersey is one of the nation’s most diverse states; nearly half of New Jersey residents identify as members of the BIPOC community and 22% speak a language other than English [32,33]. Of such BIPOC and linguistically diverse residents, roughly 63% are immigrants who speak a language other than English at home, 35% are naturalized US citizens, and 28% are not US citizens [32]. These diverse residents drink from New Jersey’s public water systems (PWSs), primarily (70%) sourced from surface water. Of the thirty-four public water systems which rely on surface water, 29% of them incurred violations in 2020; 38% of these violations were for treatment techniques and 62% for monitoring [34]. Still, we do not know if, or how, diverse communities are more heavily burdened by these violations, significantly hindering our ability to ensure environmental justice.
New Jersey’s public water systems (PWSs) are split into community water systems that are categorized as privately-owned, municipal (i.e., city water), or noncommunity water systems (i.e., businesses that are supplied by their own wells). As of 2020, 16% of New Jersey’s active PWSs were community water systems supplying more than half of the state’s residents. If a PWS fails to remain in federal and state compliance, they receive a violation (e.g., Monitoring & Reporting violation) and/or a fine of USD 250–22,000 [35]. New Jersey’s Department of Environmental Protection (NJDEP) requires all community water systems to provide yearly reports to consumers (i.e., Consumer Confidence Reports by July 1st) and a certification by October 1st which summarizes information pertaining to the quality of their water [35]. Additionally, state law requires the constant monitoring and testing of surface water sources (e.g., rivers, lakes, and streams) and the constant monitoring of water to housing units. If a monitored public water system exceeds a maximum contaminant level (MCL), it must be brought into compliance within one year. However, in 2020 alone, there were eighty-eight reporting violations that were disseminated to seventy-three public water systems in New Jersey, for failure to present a consumer confidence report (CCR) to consumers by 1 July. By 20 April 2021 less than half of the public water systems returned to compliance by distributing their CCRs [5,34,35]. It is essential to determine where drinking water violations are most prevalent to significantly reduce public environmental health hazards [17,36].
Here, we use ten years of data on urban New Jersey, to answer the following questions: (1) what is the current status of water quality?; (2) who is most affected by water contamination?; and (3) why are water quality burdens not borne equally and what are their effects? Such data will aid policy makers in not only identifying regions of water quality concern, but also tailoring remediation efforts to address the underlying social, historical, and/or economic mechanisms which drive such variation.
2. Data and Methods
2.1. Study Site and Detailed Data Collection
2.1.1. Study Site
We examined the interactions between water quality and inherent inequity gaps in thirty-four diverse municipalities in Hudson and Essex County, New Jersey. These citizens are served by twenty-seven water departments, which have incurred 443 water violations within the prior ten years (2010–2020, as reported by New Jersey Department of Environmental Protection Drinking Water Watch [37]. We selected these municipalities in Hudson and Essex County, New Jersey, because of the following: (a) their large population size [32]; (b) the proportion of BIPOC and linguistic diversity [32]; and (c) the availability of Home Owner’s Loan Corporation (HOLC) data [38]. We used the proportion of residents who identify as BIPOC, speak a language other than English at home, self-report as speaking English ‘less than very well’, are foreign-born, or who are non-US citizens as indicators of a municipality’s diversity [32]. To understand the relationship between diversity and environmental health, we used ten years (2010–2020) of spatial data on the following: (1) community member identity, language, education (i.e., Bachelor’s degree or higher), financial capacity (i.e., proportion of the population below the poverty line, US 5-year American Community Survey (ACS) [32]; (2) water contamination [37], public health [39]; (3) current and historic (1935 Home Owner’s Loan Corporation (HOLC)) policy and municipality maps [38,40,41,42,43,44,45]. We used data between 2010 and 2020 for all variables, except selected census data which was only available in 2012, 2013, 2015, or 2017 (i.e., health insurance, computer, broadband subscriptions, and proportion of population below the poverty line). We log transformed all demographic data, when appropriate, to fulfill linear model assumptions. All figures were generated using R (version 4.1.2), statistical analyses were completed in JMP Pro 16, and maps were generated using Arc Geographic Information System (GIS) Pro 10.8.2.
2.1.2. What Is the Current Status of Water Quality?
Using drinking water quality violation data, as reported by NJDEP DWW, we calculated the total number, mean, and standard deviation of all violations listed. We then categorized violations within and across, municipality/municipalities between 2010 and 2020 into the following: (1) metal contaminants (i.e., lead, iron-manganese, mercury, chromium, cadmium, barium, arsenic, silver, manganese, iron, nickel, thallium total, beryllium total, and zinc); (2) non-metal contaminants (i.e., stage 2 total trihalomethanes haloacetic-five (TTHM HAA5), total trihalomethanes haloacetic-five (THM HAA5), chlorine, total haleoacetic acids-five (HAA5), Escherichia coli (E. coli), total trihalomethanes (TTHM), coliform, nitrate, fluoride, selenium, perfluorononanoic acid (PFNA), 1,2,3-trichloropropane, 1,2-dibromo-3-chloropropane, tetrachloroethylene, ethylene dibromide, total dissolved solids (TDS), trichloroethylene, sodium, potential hardness (pH), 1,1-dichloroethylene, cryptosporidium, color, cyanide, turbidity, antimony total, copper free, combined uranium, inorganics, asbestos, and fecal coliform); and (3) rule violations (i.e., lead and copper rule (LCR), consumer confidence report (CCR), state rule, revised total coliform rule (RTCR), water quality parameter (WQP) total, volatile organic compounds (VOCs) federal, public notice, disinfection byproducts (DBP) stage 1, VOCs state, research address database monitoring and reporting (RAD_M&R) historical, VOCS phase 1, filter backwash rule, and interim enhanced surface water treatment rule (IESWTR)). Rule violations differ from metal and non-metal contaminants; if a site has exceeded the maximum contaminant level (MCL) of a metal (e.g., lead), as per EPA guidelines [11], a violation has not been incurred. Violations have incurred if the water department does not inform the public or replace lead service lines (LSLs) after the MCL is exceeded.
2.1.3. Who Is Most Affected by Water Contamination?
We used linear regressions (Equation (1)) to determine how diversity changed between 2010 and 2020, where is our year response variable, and represents change in diversity, from an intercept of [46,47]:
Given the non-normal distribution of water quality violations (i.e., which do not meet the assumptions of a parametric t-test), we used non-parametric Wilcoxon tests (Equation (2)) to determine whether municipalities with water contamination (i.e., total, metal, non-metal, and rule violations) were significantly more diverse (i.e., racial and linguistically diverse) than those without contamination [46,47]. For our one-sided non-parametric Wilcoxon test, if > we reject the null hypothesis () that a municipality with one or more water quality violations was significantly more diverse. Z measures the amount of standard deviations a data point is from the mean of a distribution and the p-value measures the level of significance (we considered values < 0.05 significant) [46,47]. To examine who is most affected by specific water contaminations, we tested each water violation (e.g., lead, chlorine, fluoride, selenium, and public notice) against BIPOC identity, nationality, citizenship, and the proportion of the population who spoke a language other than English at home, or self-identified as not speaking English well:
2.1.4. Why Are Water Quality Burdens Not Borne Equally?
We used a partition analysis (Equation (3)) to examine how, and at what threshold, the following factors affected the proportion of the population to attain and act on water violations [46,47]: (1) diversity (i.e., the proportion of that municipality which identified as BIPOC, who spoke a language other than English at home, who self-reported as “not speaking English well”, who were foreign-born residents or non-US citizens); (2) financial capacity (i.e., proportion of the population below the poverty line); (3) home ownership (i.e., proportion of households which are renter-occupied); (4) education (i.e., proportion of residents who have a Bachelor’s degree or higher); (5) historic segregation policy (i.e., home owners loan corporation (HOLC) policies [38]). In Equation (3) refers to the number of blocks in the treatment in relation to water violations, and refers to the response in our variables when the th treatment is in the th block [46,47]:
To examine if and how historic segregation policy negatively affected diversity, we converted the letter grade of each geographic region into a numerical equivalent for analysis, from A (most desirable = 1) to D (hazardous = 4), based on the varying levels of ‘risk’ as perceived by the HOLC. From such data, we determined which municipalities were redlined from a mean grade of 3 (C = declining) and 4 (D = hazardous) and calculated the mean and standard deviation of HOLC grades. Once the threshold was determined, we examined how it changed between 2010 and 2020 and used a normal generalized linear model (GLM; Equation (4)) to examine if, and how, (1) diversity, (2) financial capacity, (3) legal rights, (4) necessary information, and (5) historic segregation policy best predicted it. Given that our demographic census data was log transformed, normal GLMs were most applicable in determining such relationships by examining the linear relationship between multiple variables. In Equation (4), refers to the response variable which we wanted to predict in relation to our threshold. Our unknown constant was reflected in , and our independent predictor variables were reflected in Our random error was , with our response veering from the mean value of by being assumed to be independent, have a mean value of 0, and a variance of , and normally distributed. Once these assumptions to were met, the deterministic portion of the model (Equation (5)) was used where the average value of for values was equal to the deterministic model [46,47]:
Finally, using open access data on levels of lead in the blood samples of children six months to six years of age [39], we examined how elevated blood lead levels (EBLLs) changed between 2010 and 2020 (using Equation (1)). For this test, we used as our year response variable, represents the amount of EBLL change, and represents our intercept. We used non-parametric Wilcoxon tests (Equations (2)) and GLMs (Equations (4) and (5)) to determine and predict, using diversity, who is most negatively affected by EBLLs, and why [46,47].
3. Results
3.1. What Is the Current Status of Water Quality?
Poor water quality persists across urban New Jersey; 443 water violations occurred within the past ten years, with each municipality incurring 1.15 ± SD2.86% violations during the prior decade. Between 2010 and 2020, violations significantly increased (R2(160) = 0.08, 11.79, p = 0.0006; Figure 1). Of these violations, 59.4% were non-metal, 32.3% were rule violations, and 8.3% were metal violations (Figure 2). While non-metal violations are increasing over time (0.68 ± SD2.16 per municipality annually; R2(385) = 0.03, 12.36, p = 0.0005), rule and metal violations have decreased (e.g., Lead and Copper Rule and State Rule: 0.37 ± SD1.27; R2(385) = 0.07, 28.87, p < 0.0001; Metal:1.0 ± SD0.39; R2(385) = 0.04, 17.39, p < 0.0001).
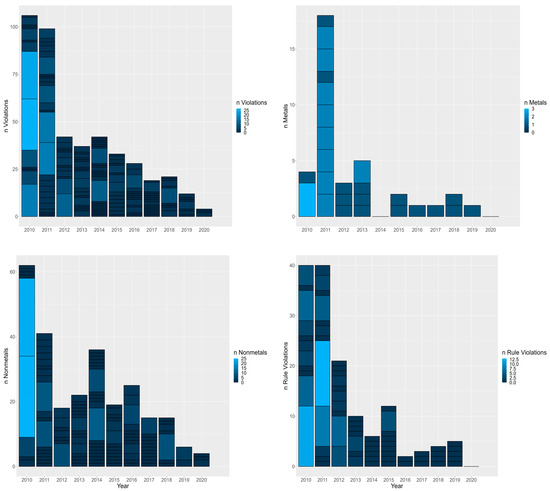
Figure 1.
Municipality drinking water violations by type (i.e., total, metal, rule, and non-metal) of violation between 2010 and 2020 significantly increased. Of these violations, 59.4% were non-metal, 32.3% were rule violations, and 8.3% were metal violations (with non-metal violations increasing over time).
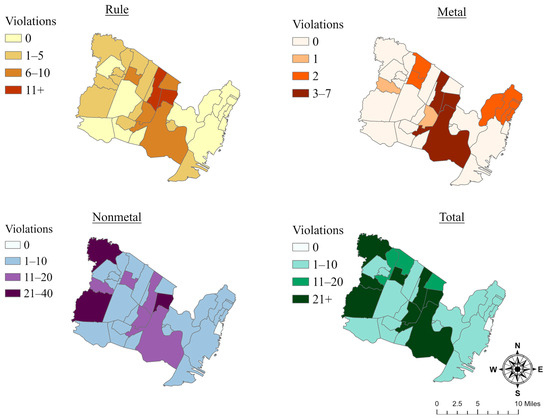
Figure 2.
Drinking water violation concentrations across the municipalities in Essex and Hudson County, New Jersey (2010–2020). The most common metal violation was for lead, rule violation was for Lead and Copper Rule (LCR), and non-metal violation was for excess chlorine.
The most common violation for metal was lead (Figure 3; 0.07 ± SD0.34; 73.0% of all metal violations), rule was the Lead and Copper Rule (LCR; mean 0.16 ± SD0.86; 43.4% of all rule violations; Figure 4), and non-metal was excess chlorine (mean 0.27 ± SD1.40; 39.2% of all non-metal violations; Figure 5; Tables S1 and S2). Lead, LCR, and chlorine violations were prevalent between 2010 and 2014, but significantly decreased from 2015 until 2020 (R2(396) = 0.12, 16.37, p < 0.0001; R2(396) = 0.22, 45.22, p < 0.0001); and R2(396) = 0.05, 16.65, p < 0.0001, respectively).
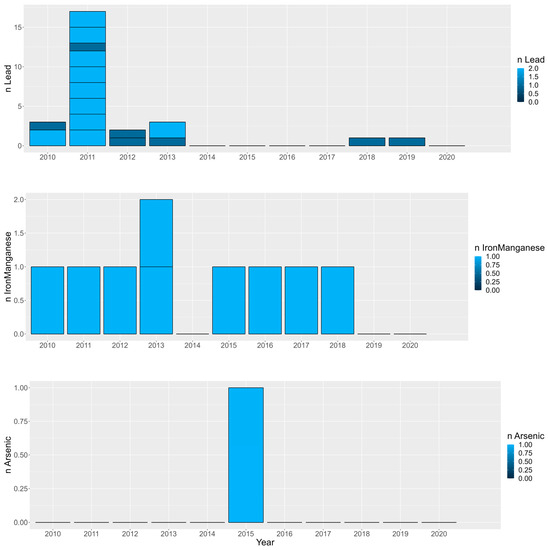
Figure 3.
Metal drinking water violations in municipalities between 2010 and 2020 as reported by the New Jersey Department of Environmental Protection Agency: Drinking Water Watch. Of the contaminant violations depicted, the most prevalent metal violation was lead. PWSs did not incur violations to silver, mercury, chromium, cadmium, barium, zinc, beryllium total, manganese, nickel, iron, and thallium total (not depicted).
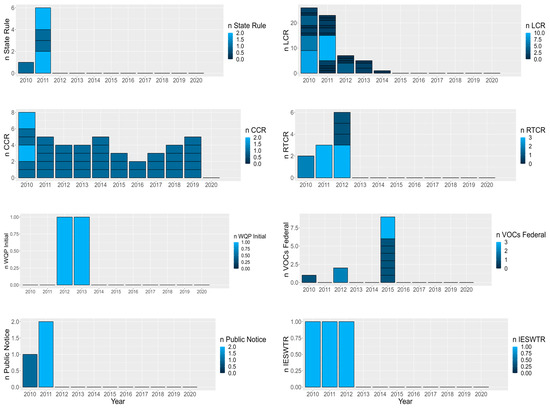
Figure 4.
Rule drinking water violations in municipalities between 2010 and 2020 as reported by the New Jersey Department of Environmental Protection Agency: Drinking Water Watch. Of the contaminant violations depicted, the most prevalent rule violation was the Lead and Copper Rule (LCR). PWSs did not incur violations to VOCs Phase 1, Filter Backwash Rule, VOCs State, DBP Stage 1, and RAD_M&R Historical rules (not depicted).
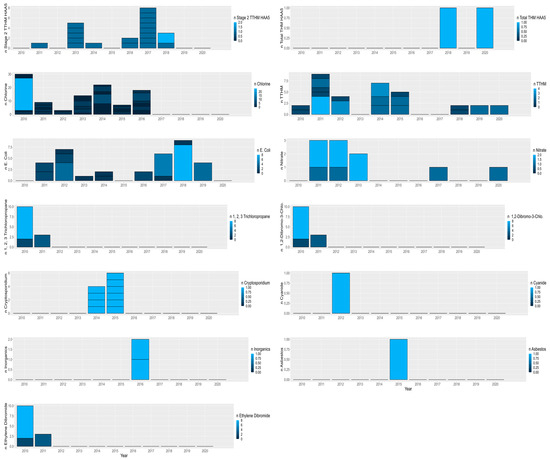
Figure 5.
Non-metal drinking water violations in municipalities between 2010 and 2020 as reported by the New Jersey Department of Environmental Protection Agency: Drinking Water Watch. Of the contaminant violations depicted, the most prevalent non-metal violation was chlorine. PWSs did not incur violations to fecal coliform, selenium, 1,1-dichloroethylene, THA HAA5, TDS, sodium, trichloroethylene, pH, coliform, fluoride, PFNA, copper free, color,, tetrachloroethylene, turbidity, antimony total, and combined uranium (not depicted).
3.2. Who Is Most Affected by Water Contamination?
Of the over 6 million residents in our study area, 63.4% identified as BIPOC. The largest subpopulation within this BIPOC population were individuals who identified as Black (29.8%), followed by complex compound or “Other” identities which included Hispanic and/or Latino ethnicities (20.4%), Asian (12.4%), American Indian and Alaska Native (<1.00%), and Native Hawaiian and Other Pacific Islander (<1.00%). Nearly one-fifth (16.3%) of individuals spoke a language other than English, of which 63.3% were foreign born, 52.4% self-reported that they speak English “less than very well”, and 28.0% were not US-citizens. Racial and linguistic diversity has remained relatively constant over the prior decade (R2(385) = 0.00, 0.21, p = 0.64); R2(385) = 0.00, 0.15, p = 0.70; respectively; Figure 6 and Figure 7; Table S3 and Figure S1).
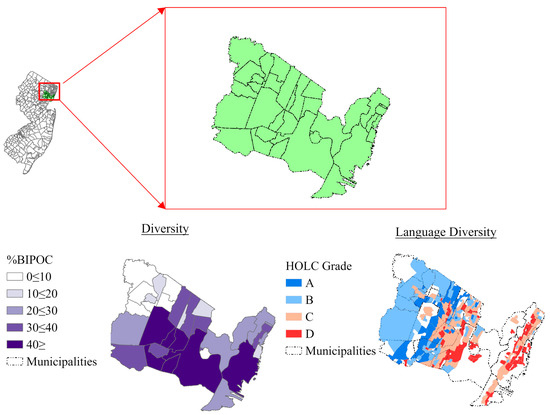
Figure 6.
Geographic variation in the diversity (Census 2020) and historic redlining practices (Lavery 2020) of the study site.
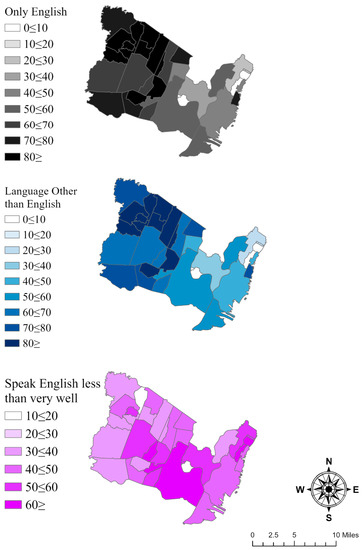
Figure 7.
Geographic variation in linguistic diversity (Census 2020) in the municipalities in Essex and Hudson County, New Jersey (2010–2020).
The burdens of water contamination were not borne equally amongst these groups and were particularly high amongst residents who were either BIPOC or spoke a language other than English at home. Diverse municipalities had poorer water quality driven by high levels of heavy metal (lead) contamination. Communities with drinking water that violated at least one regulation, had higher proportions of residents who were BIPOC, than those which had safe drinking water (Z(1385) = −2.06, p = 0.04; 22.04 ± SD11.36% vs. 28.22 ± 11.19%). While they had similar proportions of residents who self-reported as “not speaking English well” or spoke a language other than English at home overall (Figure 8), communities with water quality violations contained significantly higher proportions of foreign-born residents or non-US citizens who spoke a language other than English at home (57.74 ± SD9.32% vs. 63.52 ± 7.89%; Z(1385) = −2.07, p = 0.04; 22.04 ± SD11.36% vs. 28.22 ± 11.19% respectively). Municipalities with both heavy metal violations overall, and lead violations specifically, had significantly higher proportions of both BIPOC and non-English home-speaking residents (Table 1; Tables S4 and S5). Municipalities with non-metal violations also had higher proportions of non-US citizens who spoke a language other than English at home (Z(1385) = −2.36, p = 0.02; 28.29 ± SD11.21% vs. 22.35 ± 10.59%; Table 2; Tables S6 and S7). Such patterns were not seen in overall rule regulations, which were found in similarly diverse municipalities (Figure 9; Table 3; Tables S8 and S9).
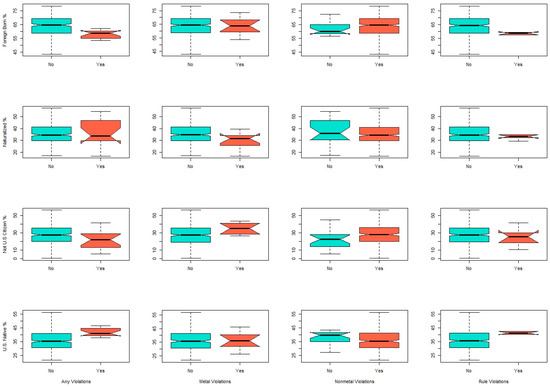
Figure 8.
Total violations and their breakdowns in relation to diversity in the municipalities in Essex and Hudson County, New Jersey (2010–2020). Of the violations depicted, ‘No’ (depicted as the color ‘turquoise’ in R) signifies no violations present and ‘Yes’ (depicted as the color ‘tomato’ in R) signifies violations present.

Table 1.
Non-parametric Wilcoxon test results. Metal violations among BIPOC residents including residents who speak a language other than English at home in the municipalities of Essex and Hudson County, New Jersey (2010–2020).

Table 2.
Non-parametric Wilcoxon test results. Non-metal violations among BIPOC residents including residents who speak a language other than English at home in the municipalities of Essex and Hudson County, New Jersey (2010–2020).
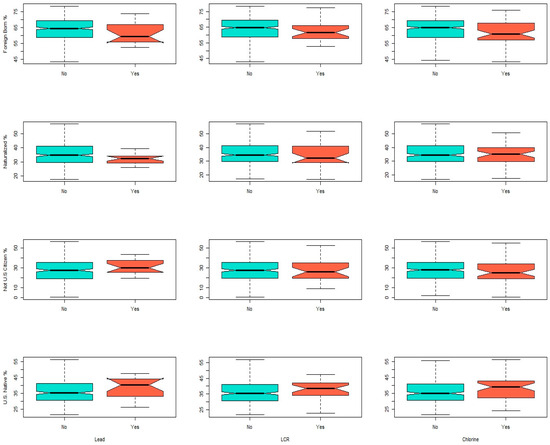
Figure 9.
Lead (left), Lead and Copper Rule (LCR; (middle)), and Chlorine (right) in the municipalities in Essex and Hudson County, New Jersey (2010–2020). Of the violations depicted, ‘No’ (depicted as the color ‘turquoise’ in R) signifies no violations present and ‘Yes’ (depicted as the color ‘tomato’ in R) signifies violations present. Such violations were weighted against the proportion of the population that were U.S. Natives, Not a U.S. Citizen, Naturalized, and Foreign Born.

Table 3.
Non-parametric Wilcoxon test results. Rule violations among BIPOC residents including residents who speak a language other than English at home in the municipalities of Essex and Hudson County, New Jersey (2010–2020).
3.3. Why Are Water Quality Burdens Not Borne Equally and What Are Their Effects?
Lead violations were highest within communities which could not control their exposure. Our partition analysis showed that the proportion of homes rented within a municipality was the best predictor of whether or not that municipality’s water exceeded the maximum allowable lead content. Nearly one-fifth (17.2%) of all variation in lead violations could be predicted based on whether or not more than 1.8% of homes in that municipality were rented. While less than half (37.9%) of municipalities had renter populations which exceeded 1.8%, they contained 94.1% of lead violations during the prior decade. Renting significantly increased during the study (R2(385) = 0.02, 6.88, p = 0.009), despite no significant change in the proportion of the population below the poverty line (R2(383) = 0.00, 0.03, p = 0.85). The generalized linear model showed that the best, and only significant predictor of the proportion of homes within a municipality which were rented was the proportion of that population which spoke a language other than English at home, regardless of their English proficiency, nationality, or citizenship (Table 4).

Table 4.
Best predictor of renter-occupied municipalities in Essex and Hudson County, New Jersey (2010–2020; χ2 (8) = 66.57, p < 0.0001; AICc = −1289.77, Wi = 689).
These water quality violations significantly affected the health of diverse residents. Elevated blood lead levels significantly decreased from 2010 among children from ages six to twenty-six years of age (R2(42) = 0.17, 7.95, p = 0.008). We could accurately predict the number of elevated blood lead levels (EBLLs) in a municipality by its lead violations and the attributes of its residents; however, the proportion of children with elevated blood lead levels was best predicted by BIPOC identity, and did not correlate with renting or languages spoken (Table 5; Tables S6–S9).

Table 5.
Best predictor of children in municipalities with elevated blood lead levels in Essex and Hudson County, New Jersey (2010–2020; χ2 (10) = 23.58, p = 0.009; AICc = −198.56, Wi = 45).
4. Discussion
Poor water quality persists across urban New Jersey; 97% of municipalities incurred at least one water quality violation during the prior decade. Violations against heavy metals such as lead were especially high and were significantly more likely to burden diverse communities characterized by a high proportion of residents who identify as BIPOC or who speak a language other than English at home. Such communities experience 8% of all metal violations, of which 73% were for lead found in drinking water. While lead exposure has largely declined within the United States, studies have shown that diverse municipalities are increasingly burdened with such heavy metal violations [48,49,50]. Given that diverse municipalities tend to experience disproportionate burdens of drinking water quality violations, water quality control must be a top priority for significantly reducing such contaminants to below the maximum contaminant level (MCLs) of both state and federal regulations.
These findings are consistent with national studies which show diverse communities are more likely to drink water which has been contaminated by lead from aged and failing pipe infrastructure [19,27]. The best predictor of a municipality’s lead violations was the proportion of individuals who rented their home. New Jersey differs from many other centers of water contamination because service lines are often owned by homeowners, allowing state dismissal of water quality concerns [14]. While the structure and composition of pipes can affect the quality of water distributed nationally, one-half to three-quarters of lead violations are found in rental properties [51]. One reason for these high violations is that renters do not have the same rights, incentives, or capacity as home-owners or landlords to inspect their service lines or replace them when lead is found [19,52]. Whereas most (85%) homes owned by their residents are up-to-code, 50% of renting units have at least one code violation that can damage the health of its tenants. Upon sale, home-owners are required to test their drinking water for contamination, and remediate any violations before its sale, at the seller’s expense [34,53]. However, such testing is not required before a property is rented, leaving tenants at increased risk. Moreover, this often disproportionately exposes diverse and other vulnerable communities to negative health risks [18,20,21,22,23,24,25,26]. Lead is transmitted to drinking water from the lead and lead-soldered pipes still used in many areas throughout the United States [6]. Removing such lead service lines (LSLs) is the most effective way to eliminate lead contamination [36]. Because diverse renting communities are disproportionately affected by such contaminated water, state regulations which address the drivers of such disparities in drinking water are critical [10].
Individuals who speak a language other than English at home are significantly more likely to rent homes with unsafe drinking water. Reduced rates of home-ownership and an increase in renting are more prevalent in areas with increased racial and linguistic diversity [10,54,55]. Areas with increased proportions of racially and linguistically diverse residents are more likely to be isolated and have limited renting units. Such inequitable units are based on biases and discrimination surrounding potential tenants who have names which are perceived as ethnically diverse; additionally, interactions between landlords and potential tenants can reveal further biases based on accents or diverse English vernacular [56]. Potential tenants with diverse names (e.g., Hispanic-sounding names) are able to be identified roughly 76% of the time which can lead to housing discrimination [57]. Moreover, overall discrimination from algorithms that landlords’ use, that are aimed at being inclusive, also discriminate by relying on inequitable factors such as income and credit scores that unequally targets diverse residents [55,56,58,59]. As a result of such immediate tenant discrimination, it is thus unsurprising that many diverse individuals are less likely to seek governmental assistance from individuals who are not of the same or similar background(s) [29,30,31,55,60]. Given that renters are more likely to be diverse and have limited control over their drinking water, it is crucial for water quality control measures to address such lack of drinking water control that renters have. Federal law requires sellers to not only test their drinking water but also disclose the results to potential home-buyers [61]. Federal testing and disclosure laws must also be extended to potential renters to ensure all residents have access to information pertaining to the quality of their drinking water.
Interestingly, BIPOC communities had higher rates of elevated lead blood levels than residents who speak a language other than English. This difference in public health effects may be because children of BIPOC residents are exposed to lead from other sources, such as contaminated soils [49], or because residents who speak a language other than English at home may not be tested for lead at the same frequency as other populations. When lead screening in populations is reduced, high-risk groups are often left disproportionately untested, resulting in population-level exposure estimates of only two-thirds of that of actual rates [62]. Increasing tests for lead exposure by partnering with trusted community organizations and schools, investing in safe housing, and increasing tenant ability to ensure that they have a clean and safe home, can improve the health and safety of tenants, specifically children [63].
Linguistically diverse renting communities are disproportionately affected by lead contaminated drinking water. While replacing lead service lines is the most effective way to significantly reduce lead violations, discrimination continues to reduce the likelihood that diverse residents benefit from such efforts, despite their increased risk of public health disparities [19,52]. Partnering with diverse community organizations, outreach programs, and directly including linguistically diverse renters as important stakeholders in the decision making and remediation process may increase the efficacy of mitigation efforts and improve water quality and public health outcomes [63]. Further, extending home-owner requirements to test, disclose, and remediate water quality violations between tenants, and not only when a property is sold, may help ensure equity in public health outcomes.
5. Conclusions
As of 2021, the New Jersey state Senate passed a bill mandating that with any PWS that exceeds the lead action level (AL), a written notice should be provided to residents or property owners/tenants, that a lead AL has been exceeded, no later than ten days after it was detected [64]. Landlords are then required to distribute the notice to tenants and post the notice/information within three business days. While this bill is certainly effective for the distribution of information, more measures must be put in place under New Jersey state law to ensure the safety of public health. The current bill (enacted one year after the study period) relies on PWSs to notify residents, and requires landlords to then inform tenants; however, the bill did not specify repercussions if PWSs and/or landlords violate these new mandates, nor did it specify how tenants would be informed if a landlord failed to notify residents.
We propose that mandates be put in place as follows: (1) that not only apply to lead values that exceed ALs but require strict notifications regarding all drinking water violations that place public health at risk; (2) that landlords test, disclose, and remediate water issues both prior to renting to new tenants and to existing tenants when necessary; (3) that both landlords and tenants must also receive notice if/when drinking water violations occur as an added public health precaution within seven business days; (4) that if violations repeatedly occur despite fines, placing the public’s health at risk, violators should incur more effective penalties (e.g., the possibility of licenses to operate being temporarily revoked and transferred to the state); (5) that as soon as ALs are exceeded, remediation periods be shortened to within seven to ten business days. Moreover, as a global society, we are increasingly focusing on sustainability efforts to meet the needs of the present without compromising the needs of future generations. Therefore, by implementing such mandates, NJ can focus on increasing the good health and wellbeing (SDG 3) of its diverse residents. What is an interesting distinction is that while NJ municipal water is still ‘treated’ drinking water, many individuals still lack clean drinking water (SDG 6) which can result in devastating public health effects [65]. However, this distinction should not only focus on municipal drinking water, but also whether the water source is surface or groundwater, the length of the pipeline, the material of the pipeline, and the water retention time in the pipeline from the source to the consumer. Such considerations were not a part of this municipal-level analysis and should be considered in future finer scale consumer-level research to quantify their relative impact on public health. Increased efforts need to be made to find solutions to ensure the public health of residents that not only meet the needs of the present but also the needs of future generations.
Supplementary Materials
The following supporting information can be downloaded at: https://www.mdpi.com/article/10.3390/w15193446/s1, Figure S1: Geographic variation in linguistic diversity among non-US, foreign-born, naturalized citizens (Census, 2020) in the municipalities in Essex and Hudson County, New Jersey (2010–2020).; Table S1: Total violations across municipalities in Essex and Hudson County, New Jersey (2010–2020; NJ Drinking Water Watch, 2020).; Table S2: Most common violations across municipalities in Essex and Hudson County, New Jersey (2010–2020).; Table S3: Minimum and maximum diversity percentages across Municipalities in Essex and Hudson County, New Jersey (2010–2020) in relation to historic redlining grades.; Table S4: Metal violations among linguistically diverse residents in the municipalities of Essex and Hudson County, New Jersey (2010–2020).; Table S5: Metal violations among BIPOC residents including residents who speak a language other than English at home in the municipalities of Essex and Hudson County, New Jersey (2010–2020).; Table S6: Nonmetal violations among linguistically diverse residents in the municipalities of Essex and Hudson County, New Jersey (2010–2020).; Table S7: Nonmetal violations among BIPOC residents including residents who speak a language other than English at home in the municipalities of Essex and Hudson County, New Jersey (2010–2020).; Table S8: Rule violations among linguistically diverse residents in the municipalities of Essex and Hudson County, New Jersey (2010–2020).; Table S9: Rule violations among BIPOC residents including residents who speak a language other than English at home in the municipalities of Essex and Hudson County, New Jersey (2010–2020).
Author Contributions
Conceptualization, R.C. and C.B.; Methodology, R.C., D.Y., K.W., P.L. and C.B.; Resources, R.C.; Data curation, R.C.; Writing—original draft, R.C. and C.B.; Writing—review & editing, R.C., D.Y., K.W., P.L. and C.B. R.C. wrote the first draft of the manuscript and completed all analyses. All authors have read and agreed to the published version of the manuscript.
Funding
This research received no external funding.
Data Availability Statement
Datasets generated and analyzed during the study are available as Supplementary Materials.
Acknowledgments
We would like to extend our sincerest gratitude to our editor, and reviewers, as well as Chris Snyder and Charles (CJ) Knoble for their support.
Conflicts of Interest
The authors declare no conflict of interest.
References
- Allaire, M.; Haowei, W.; Lall, U. National trends in drinking water quality violations. Proc. Natl. Acad. Sci. USA 2018, 115, 2078–2083. [Google Scholar] [CrossRef] [PubMed]
- Osiemo, M.; Ogendi, G.; M’Erimba, C. Microbial Quality of Drinking Water and Prevalence of Water-Related Diseases in Marigat Urban Centre, Kenya. Environ. Health Insights 2019, 13, 1178630219836988. [Google Scholar] [CrossRef] [PubMed]
- Wen, X.; Chen, F.; Lin, Y.; Zhu, H.; Yuan, F.; Kuang, D.; Jia, Z.; Yuan, Z. Microbial Indicators and Their Use for Monitoring Drinking Water Quality—A Review. Sustainability 2020, 12, 2249. [Google Scholar] [CrossRef]
- Malik, Q.; Khan, M. Effect on Human Health due to Drinking Water Contaminated with Heavy Metals. J. Pollut. Eff. Control. 2016, 5, 1000179. [Google Scholar] [CrossRef]
- Mirzabeygi, M.; Abbasnia, A.; Yunesian, M.; Nodehi, R.; Yousefi, N.; Hadi, M.; Mahvi, A. Heavy metal contamination and health risk assessment in drinking water of Sistan and Baluchistan, Southeastern Iran. Hum. Ecol. Risk Assess. Int. J. 2017, 23, 1893–1905. [Google Scholar] [CrossRef]
- Levallois, P.; Barn, P.; Valcke, M.; Gauvin, D.; Kosatsky, T. Public Health Consequences of Lead in Drinking Water. Curr. Environ. Health Rep. 2018, 5, 255–262. [Google Scholar] [CrossRef] [PubMed]
- Benham, M.; Woltemade, C. Elevated Lead Levels in Public Drinking Water Systems Despite Governmental Policies: Flint, Michigan Case Study. Middle States Geogr. 2016, 49, 9–20. [Google Scholar]
- Environmental Protection Agency Drinking Water Requirements for States and Public Water Systems: Drinking Water Regulations. 2017. Available online: https://www.epa.gov/dwreginfo/drinking-water-regulations (accessed on 18 December 2022).
- Meehan, K.; Jurjevich, J.; Chun, N.; Sherrill, J. Geographies of insecure water access and the housing—Water nexus in US cities. Proc. Natl. Acad. Sci. USA 2020, 117, 28700–28707. [Google Scholar] [CrossRef]
- Schaider, L.; Swetschinski, L.; Campbell, C.; Rudel, R. Environmental justice and drinking water quality: Are there socioeconomic disparities in nitrate levels in U.S. drinking water? Environ. Health 2019, 18, 3. [Google Scholar] [CrossRef]
- Environmental Protection Agency. Ground Water and Drinking Water: Basic Information about Lead in Drinking Water. 2020. Available online: https://www.epa.gov/ground-water-and-drinking-water/basic-information-about-lead-drinking-water#getinto (accessed on 18 December 2022).
- Henderson, S.; Wells, R. Environmental Racism and the Contamination of Black Lives: A Literature Review. J. Afr. Am. Stud. 2021, 25, 134–151. [Google Scholar] [CrossRef]
- Menton, M.; Larrea, C.; Latorre, S.; Martinez-Aller, J.; Peck, M.; Temper, L.; Walter, M. Environmental justice and the SDGs: From synergies to gaps and contradictions. Sustain. Sci. 2020, 15, 1621–1636. [Google Scholar] [CrossRef]
- Chachura, M. Old Pipes in Brick City: Equal Protections & The Newark Water Crisis; Rutgers Race & the Law Review: Newark, NJ, USA, 2021; Volume 22, pp. 124–155. [Google Scholar]
- Tolnay, S. The African American “Great Migration” And Beyond. Annu. Rev. Sociol. 2003, 29, 209–232. [Google Scholar] [CrossRef]
- McClure, E.; Feinstein, L.; Cordoba, E.; Douglas, C.; Emch, M.; Robinson, W.; Galea, S.; Aiello, A. The legacy of redlining in the effect of foreclosures on Detroit residents’ self-rated health. Health Place 2019, 55, 9–19. [Google Scholar] [CrossRef] [PubMed]
- Nardone, A.; Casey, J.; Morello-Frosch, R.; Mujahid, M.; Balmes, J.; Thakur, N. Association between historical residential redlining and current age-adjusted rates of emergency department visits due to asthma across eight cities in California: An ecological study. Lancet Planet. Health 2020, 4, 24–31. [Google Scholar] [CrossRef] [PubMed]
- Agyeman, J.; Schlosberg, D.; Craven, L.; Matthews, C. Trends And Directions In Environmental Justice: From Inequity To Everyday Life, Community, And Just Sustainabilities. Annu. Rev. Environ. Resour. 2016, 41, 321–340. [Google Scholar] [CrossRef]
- Allen, M.; Clark, R.; Cortuvo, J.; Grigg, N. Drinking Water and Public Health in an Era of Aging Distribution Infrastructure. Public Work. Manag. Policy 2018, 23, 301–309. [Google Scholar] [CrossRef]
- Bullard, R. Environmental Justice: It’s More Than Waste Facility Siting. Soc. Sci. Q. 1996, 77, 493–499. [Google Scholar]
- Clark, L.; Millet, D.; Marshall, J. National Patterns in Environmental Injustice and Inequality: Outdoor NO2 Air Pollution in the United States. PLoS ONE 2014, 9, e94431–e94438. [Google Scholar] [CrossRef]
- Kim, S.; Carswell, A. The mediation effect on indoor air quality on health: A comparison of homeowners and renters. Indoor Air 2022, 39, e130108. [Google Scholar] [CrossRef]
- McDonald, Y.; Jones, N. Drinking Water Violations and Environmental Justice in the United States, 2011–2015. Am. J. Public Health 2018, 108, 1401–1407. [Google Scholar] [CrossRef]
- Parris, C.; Hegtvedt, K.; Johnson, C. Assessments of Environmental Injustice among Black Americans. Soc. Curr. 2021, 8, 45–63. [Google Scholar] [CrossRef]
- Parris, C.; Hegtvedt, K.; Watson, L.; Johnson, C. Justice for All? Factors Affecting Perceptions of Environmental and Ecological Injustice. Soc. Justice Res. 2014, 27, 67–98. [Google Scholar] [CrossRef]
- Robb, K.; Amigo, N.; Marcoux, A.; McAteer, M.; Jong, J. Using Integrated City Data and Machine Learning to Identify and Intervene Early on Housing-Related Public Health Problems. J. Public Health Manag. Pract. 2022, 28, E497–E505. [Google Scholar] [CrossRef]
- Zielina, M.; Bielski, A.; Mlyńska, A. Leaching of chromium and lead from the cement mortar lining into the flowing drinking water shortly after pipeline rehabilitation. J. Clean. Prod. 2022, 362, 362. [Google Scholar] [CrossRef]
- Servaes, S.; Choudhury, P.; Parikh, A. What is diversity? Pediatr. Radiol. 2022, 52, 1708–1710. [Google Scholar] [CrossRef] [PubMed]
- Brabeck, K.; Guzman, M. Exploring Mexican-Origin Intimate Partner Abuse Survivors’ Help-Seeking Within Their Sociocultural Contexts. Violence Vict. 2009, 24, 817–832. [Google Scholar] [CrossRef] [PubMed]
- Robinson, S.; Ravi, K.; Schrag, R. A Systematic Review of Barriers to Formal Help Seeking for Adult Survivors of IPV in the United States, 2005–2019. Trauma Violence Abus. 2021, 22, 1279–1295. [Google Scholar] [CrossRef]
- Mookerjee, S.; Cerulli, C.; Fernandez, I.; Chin, N. Do Hispanic and Non-Hispanic Women Survivors of Intimate Partner Violence Differ in Regards to Their Help-Seeking? A Qualitative Study. J. Fam. Violence 2015, 30, 839–851. [Google Scholar] [CrossRef]
- Census. United States Census Bureau. 2020. Available online: https://www.census.gov/quickfacts/fact/table/NJ/PST045222 (accessed on 14 April 2022).
- Office of Diversity and Inclusion. Welcome. 2021. Available online: https://www.nj.gov/treasury/diversity/welcome.shtml (accessed on 14 April 2022).
- NJDEP Division of Water Supply and Geoscience. Private Well Testing Act (PWTA). 2022. Available online: https://www.state.nj.us/dep/watersupply/pw_pwta.html (accessed on 15 March 2023).
- New Jersey Department of Environmental Protection. 2020 Annual Compliance Report on Public Water Systems; Annual Compliance Report; New Jersey Department of Environmental Protection: Trenton, NJ, USA, 2021. [Google Scholar]
- Lu, H.; Romero-Canyas, R.; Hiltner, S.; Neltner, T.; McCormick, L.; Niederdeppe, J. Research to move toward evidence-based recommendations for lead service line disclosure policies in home buying and home renting scenarios. Int. J. Environ. Res. Public Health 2019, 16, 963. [Google Scholar] [CrossRef]
- NJ Drinking Water Watch. Public Water Systems. NJDEP Division of Water Supply & Geoscience. 2020. Available online: https://www9.state.nj.us/DEP_WaterWatch_public/JSP/WaterSystems.jsp (accessed on 1 December 2020).
- Lavery, D. Home Owners’ Loan Corporation (HOLC) Neighborhood Redlining Grade [Feature Layer]. Scale Not Given. 2020. Available online: https://services.arcgis.com/jIL9msH9OI208GCb/arcgis/rest/services/HOLC_Neighborhood_Redlining/FeatureServer (accessed on 6 April 2021).
- NJ Health. Childhood Lead Poisoning in New Jersey Annual Reports. State of New Jersey Department of Health. 2020. Available online: https://www.state.nj.us/health/childhoodlead/data.shtml (accessed on 5 December 2020).
- Esri Data. USA Counties (Generalized). [Polygon Layer]. Scale Not Given. 2021. Available online: https://services.arcgis.com/P3ePLMYs2RVChkJx/arcgis/rest/services/USA_Counties_Generalized/FeatureServer (accessed on 1 January 2023).
- Esri Federal Data. American Indian Reservations—Federally Recognized Tribal Entities. [Feature Layer]. Scale Not Given. 2022. Available online: https://services2.arcgis.com/FiaPA4ga0iQKduv3/arcgis/rest/services/AIANNHA_v1/FeatureServer (accessed on 1 January 2023).
- NJ OGIS. Municipal Boundaries of NJ. [Feature Layer]. Scale Not Given. 2022. Available online: https://maps.nj.gov/arcgis/rest/services/Framework/Government_Boundaries/MapServer (accessed on 1 January 2023).
- New Jersey Office of GIS. County Boundaries of NJ, Hosted, 3857. [Feature Layer]. Scale Not Given. 2022. Available online: https://montclair.maps.arcgis.com/home/item.html?id=ed7887264b054f4e82a4afb23a9214a4 (accessed on 30 January 2023).
- NJDEP GIS Government Open Data. Municipal Boundaries of NJ. [Feature Layer]. Scale Not Given. 2020. Available online: https://njogis-newjersey.opendata.arcgis.com/datasets/3d5d1db8a1b34b418c331f4ce1fd0fef_2/explore (accessed on 6 April 2021).
- U.S. Census Bureau. TIGER/Line with Selected Demographic and Economic Data. 2021. Available online: https://www.census.gov/geographies/mapping-files/2010/geo/tiger-data.html (accessed on 1 January 2023).
- Mendenhall, W.; Beaver, R.; Beaver, B. Introduction to Probability and Statistics; Cengage Learning: Boston, MA, USA, 2012. [Google Scholar]
- Moore, D.; McCabe, G.; Craig, B. Introduction to the Practice of Statistics; W. H. Freeman: New York, NY, USA, 2016. [Google Scholar]
- Geron, M.; Cowell, W.; Amarasiriwardena, C.; Andra, S.; Carroll, K.; Kloog, I.; Wright, R.; Wright, R. Racial/ethnic and neighborhood disparities in metals exposure during pregnancy in the Northeastern United States. Sci. Total Environ. 2022, 820, 153249. [Google Scholar] [CrossRef]
- Teye, S.; Yanosky, J.; Cuffee, Y.; Weng, X.; Luquis, R.; Farace, E.; Wang, L. Exploring persistent racial/ethnic disparities in lead exposure among American children aged 1–5 years results from NHANES 199-2016. Int. Arch. Occup. Environ. Health 2021, 94, 723–730. [Google Scholar] [CrossRef] [PubMed]
- Odetola, L.; Sills, S.; Morrison, S. A pilot study on the feasibility of testing residential tap water in North Carolina: Implications for environmental justice and health. J. Expo. Sci. Environ. Epidemiol. 2021, 31, 972–978. [Google Scholar] [CrossRef] [PubMed]
- Li, M.; Liu, Z.; Chen, Y.; Hai, Y. Characteristics of iron corrosion scales and water quality variations in drinking water distribution systems of different pipe materials. Water Res. 2016, 106, 593–603. [Google Scholar] [CrossRef] [PubMed]
- Caballero-Gómez, H.; White, H.; O’shea, M.; Pepino, R.; Haworth, M.; Gieré, R. Spatial Analysis and Lead-Risk Assessment of Philadelphia, USA. GeoHealth 2022, 6, e2021GH000519. [Google Scholar] [CrossRef] [PubMed]
- Environmental Protection Agency. Understanding the Safe Drinking Water Act. 2004. Available online: https://www.epa.gov/sites/default/files/2015-04/documents/epa816f04030.pdf (accessed on 14 March 2023).
- Pace, C.; Balazas, C.; Bangia, K.; Depsky, N.; Renteria, A.; Morello-Frosch, R.; Cushing, L. Inequities in Drinking Water Quality Among Domestic Well Communities and Community Water Systems, California, 2011–2019. Am. J. Public Health 2022, 112, 88–97. [Google Scholar] [CrossRef] [PubMed]
- Phillips, D. Landlords avoid tenants who pay with vouchers. Econ. Lett. 2017, 151, 48–52. [Google Scholar] [CrossRef]
- Hanson, A.; Hawley, Z. Do landlords discriminate in the rental housing market? Evidence from an internet field experiment in US cities. J. Urban Econ. 2011, 70, 99–114. [Google Scholar] [CrossRef]
- Gaddis, M. Racial/Ethnic Perceptions from Hispanic Names: Selecting Names to Test for Discrimination. SOCIUS 2017, 3, 1–11. [Google Scholar] [CrossRef]
- Hanson, A.; Santas, M. Field Experiment Tests for Discrimination against Hispanics in the U.S. Rental Housing Market. South. Econ. J. 2014, 81, 135–167. [Google Scholar] [CrossRef]
- Rosen, E.; Garboden, P.; Cossyleon, J. Racial Discrimination in Housing: How Landlords Use Algorithms and Home Visits to Screen Tenants. Am. Soc. Rev. 2021, 86, 787–822. [Google Scholar] [CrossRef]
- Byrow, Y.; Pajak, R.; Specker, P.; Nickerson, A. Perceptions of mental health and perceived barriers to mental health help-seeking amongst refugees: A systematic review. Clin. Psychol. Rev. 2020, 75, 101812. [Google Scholar] [CrossRef] [PubMed]
- Bae, H. The impact of the residential lead paint disclosure rule on house prices: Findings in the American Housing Survey. J. Hous. Built Environ. 2016, 31, 19–30. [Google Scholar] [CrossRef]
- Kamai, E.; Daniels, J.; Delamater, P.; Lanphear, B.; Gibson, J.; Richardson, D. Patterns of Children’s Blood Lead Screening and Blood Lead Levels in North Carolina, 2011–2018—Who is Tested, Who Is Missed? Environ. Health Perspect. 2022, 130, 67002. [Google Scholar] [CrossRef] [PubMed]
- Sampson, R. Legacies of inequality, legacy lead exposures, and improving population well-being. Proc. Natl. Acad. Sci. USA 2022, 119, e2202401119. [Google Scholar] [CrossRef]
- State of New Jersey. Senate, No. 968. 2020. Available online: https://pub.njleg.gov/bills/2020/S1000/968_I1.PDF (accessed on 10 July 2023).
- United Nations. The 17 Goals. 2023. Available online: https://sdgs.un.org/goals (accessed on 8 August 2023).
Disclaimer/Publisher’s Note: The statements, opinions and data contained in all publications are solely those of the individual author(s) and contributor(s) and not of MDPI and/or the editor(s). MDPI and/or the editor(s) disclaim responsibility for any injury to people or property resulting from any ideas, methods, instructions or products referred to in the content. |
© 2023 by the authors. Licensee MDPI, Basel, Switzerland. This article is an open access article distributed under the terms and conditions of the Creative Commons Attribution (CC BY) license (https://creativecommons.org/licenses/by/4.0/).