
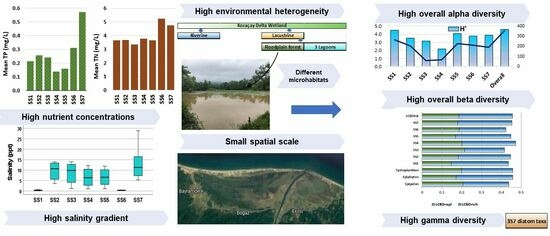
Environmental Heterogeneity and Salinity Gradient Impacted the Alpha and Beta Diversities of Diatom Assemblages in a Coastal Delta Wetland


Abstract
:
1. Introduction
2. Materials and Methods
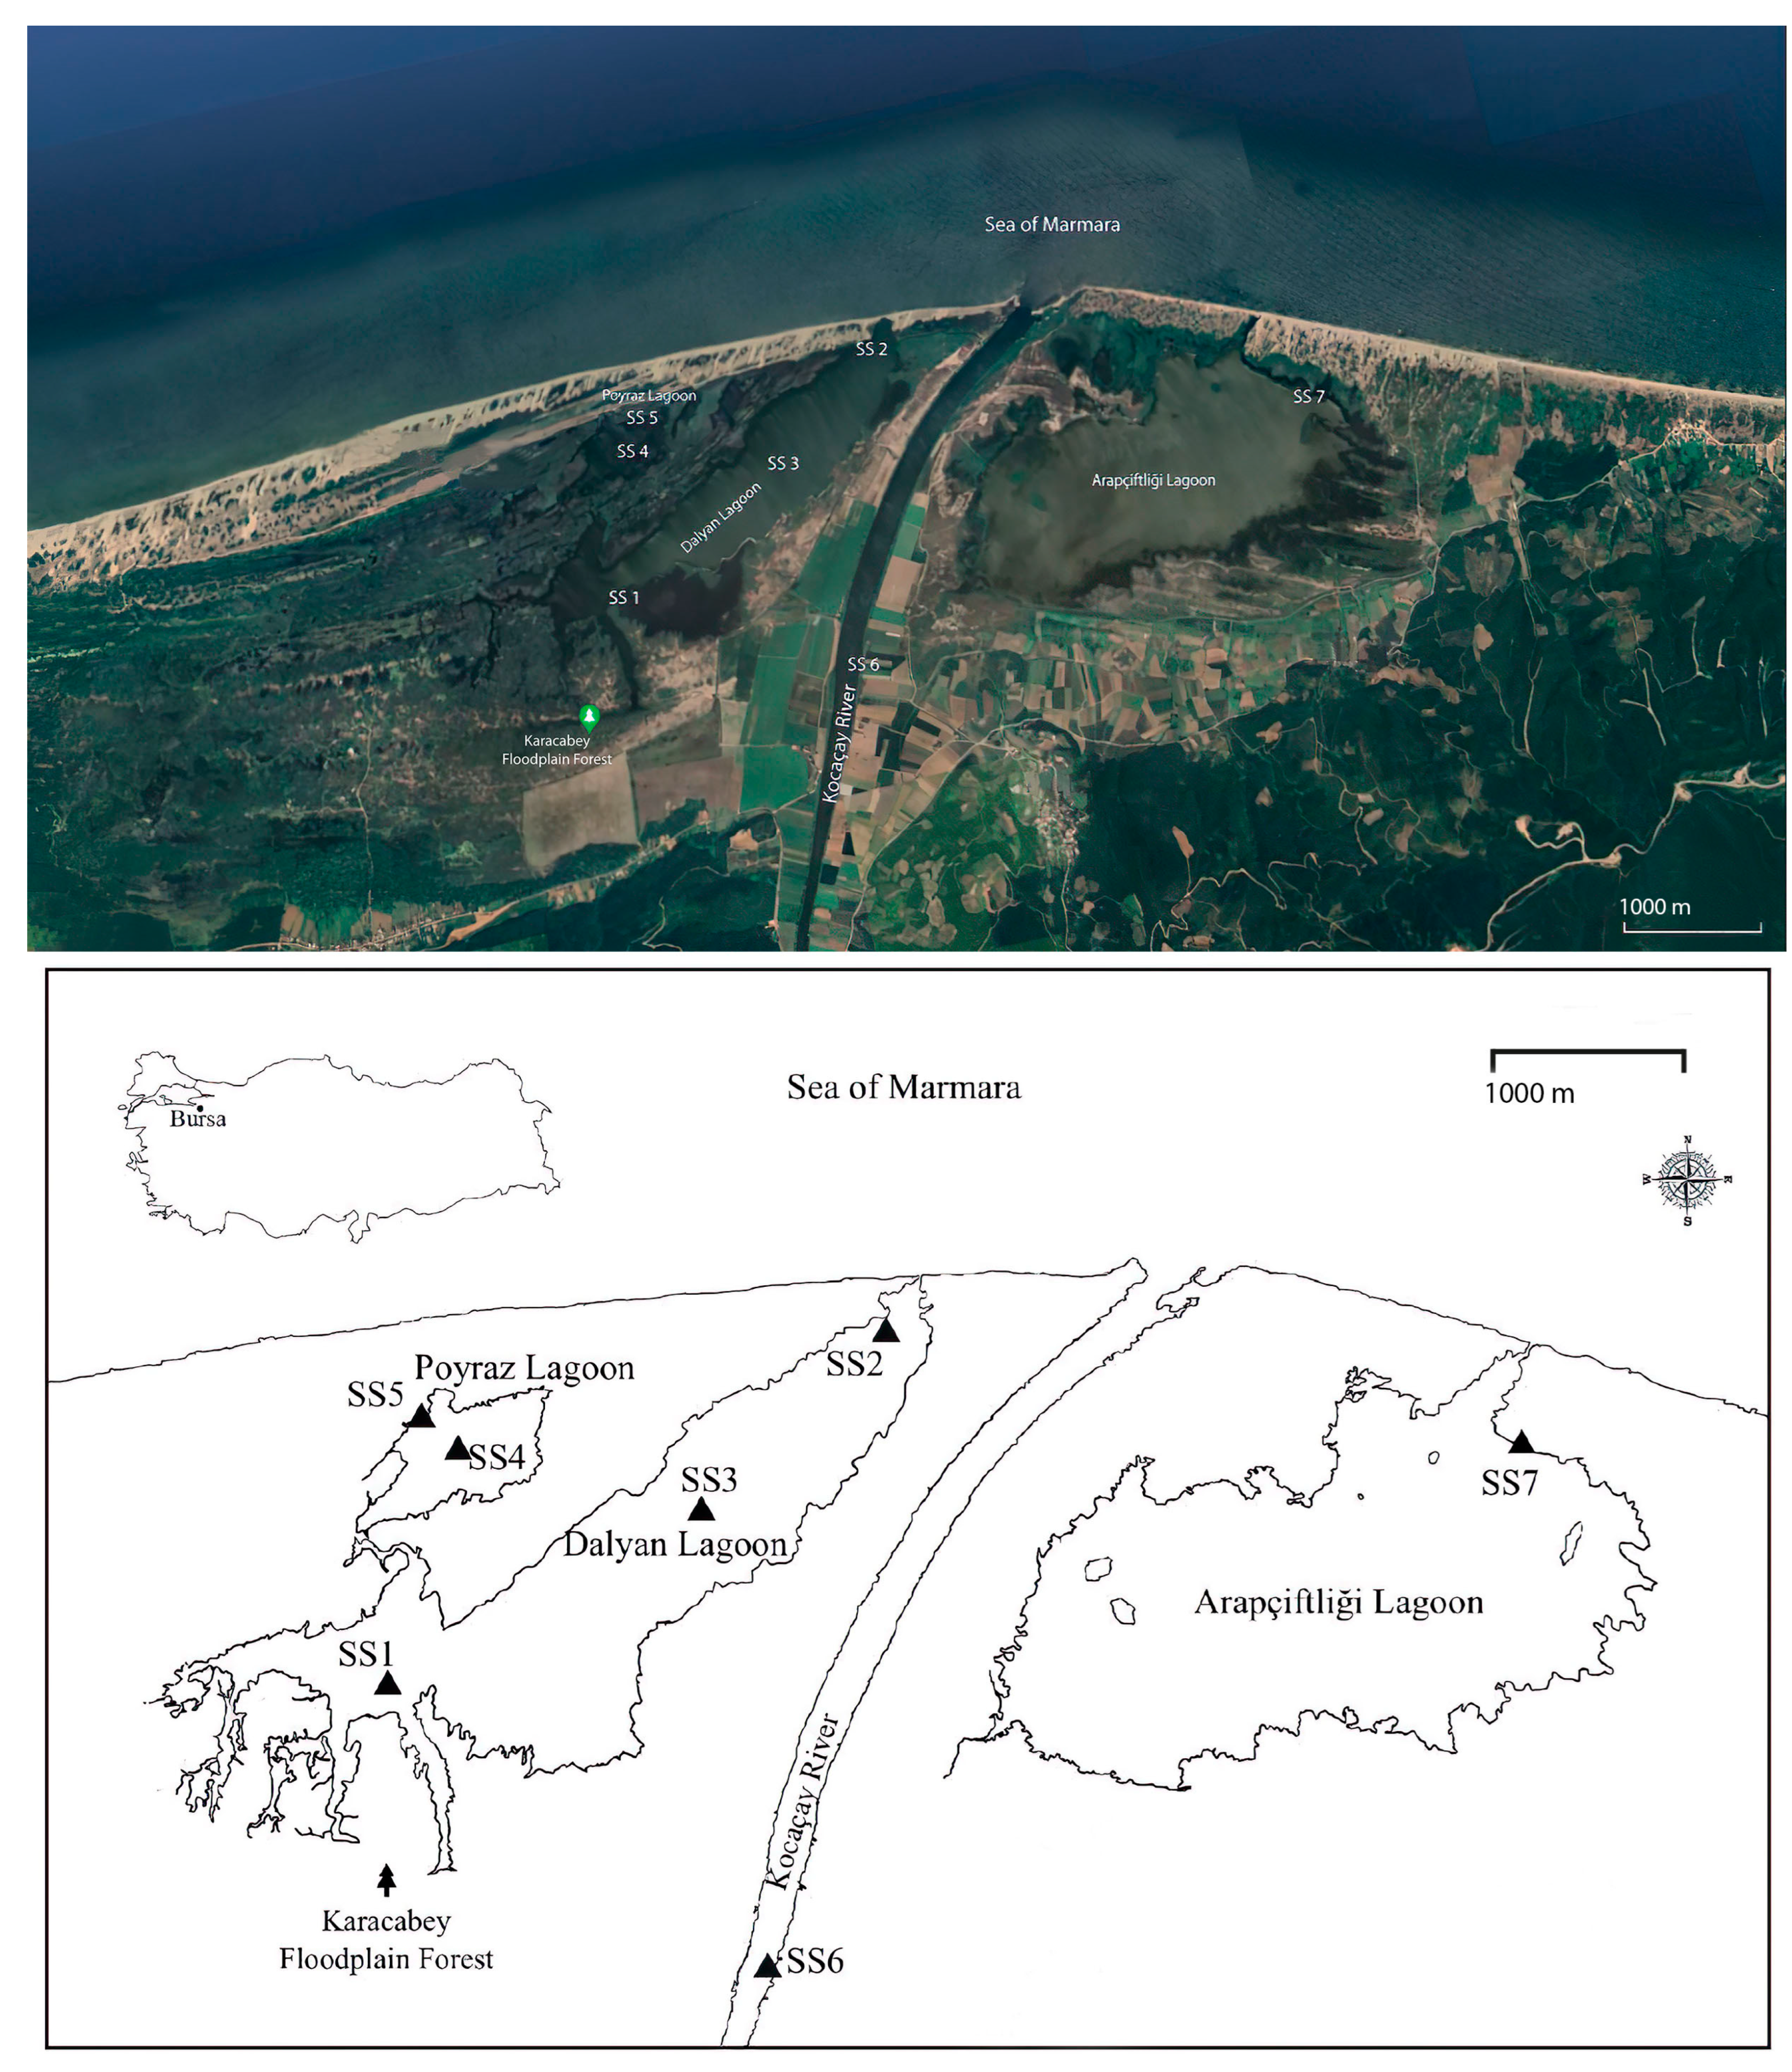
2.1. Study Area and Sampling Sites
2.2. Sampling, Enumeration, and Identification
2.3. Statistical Analysis
3. Results
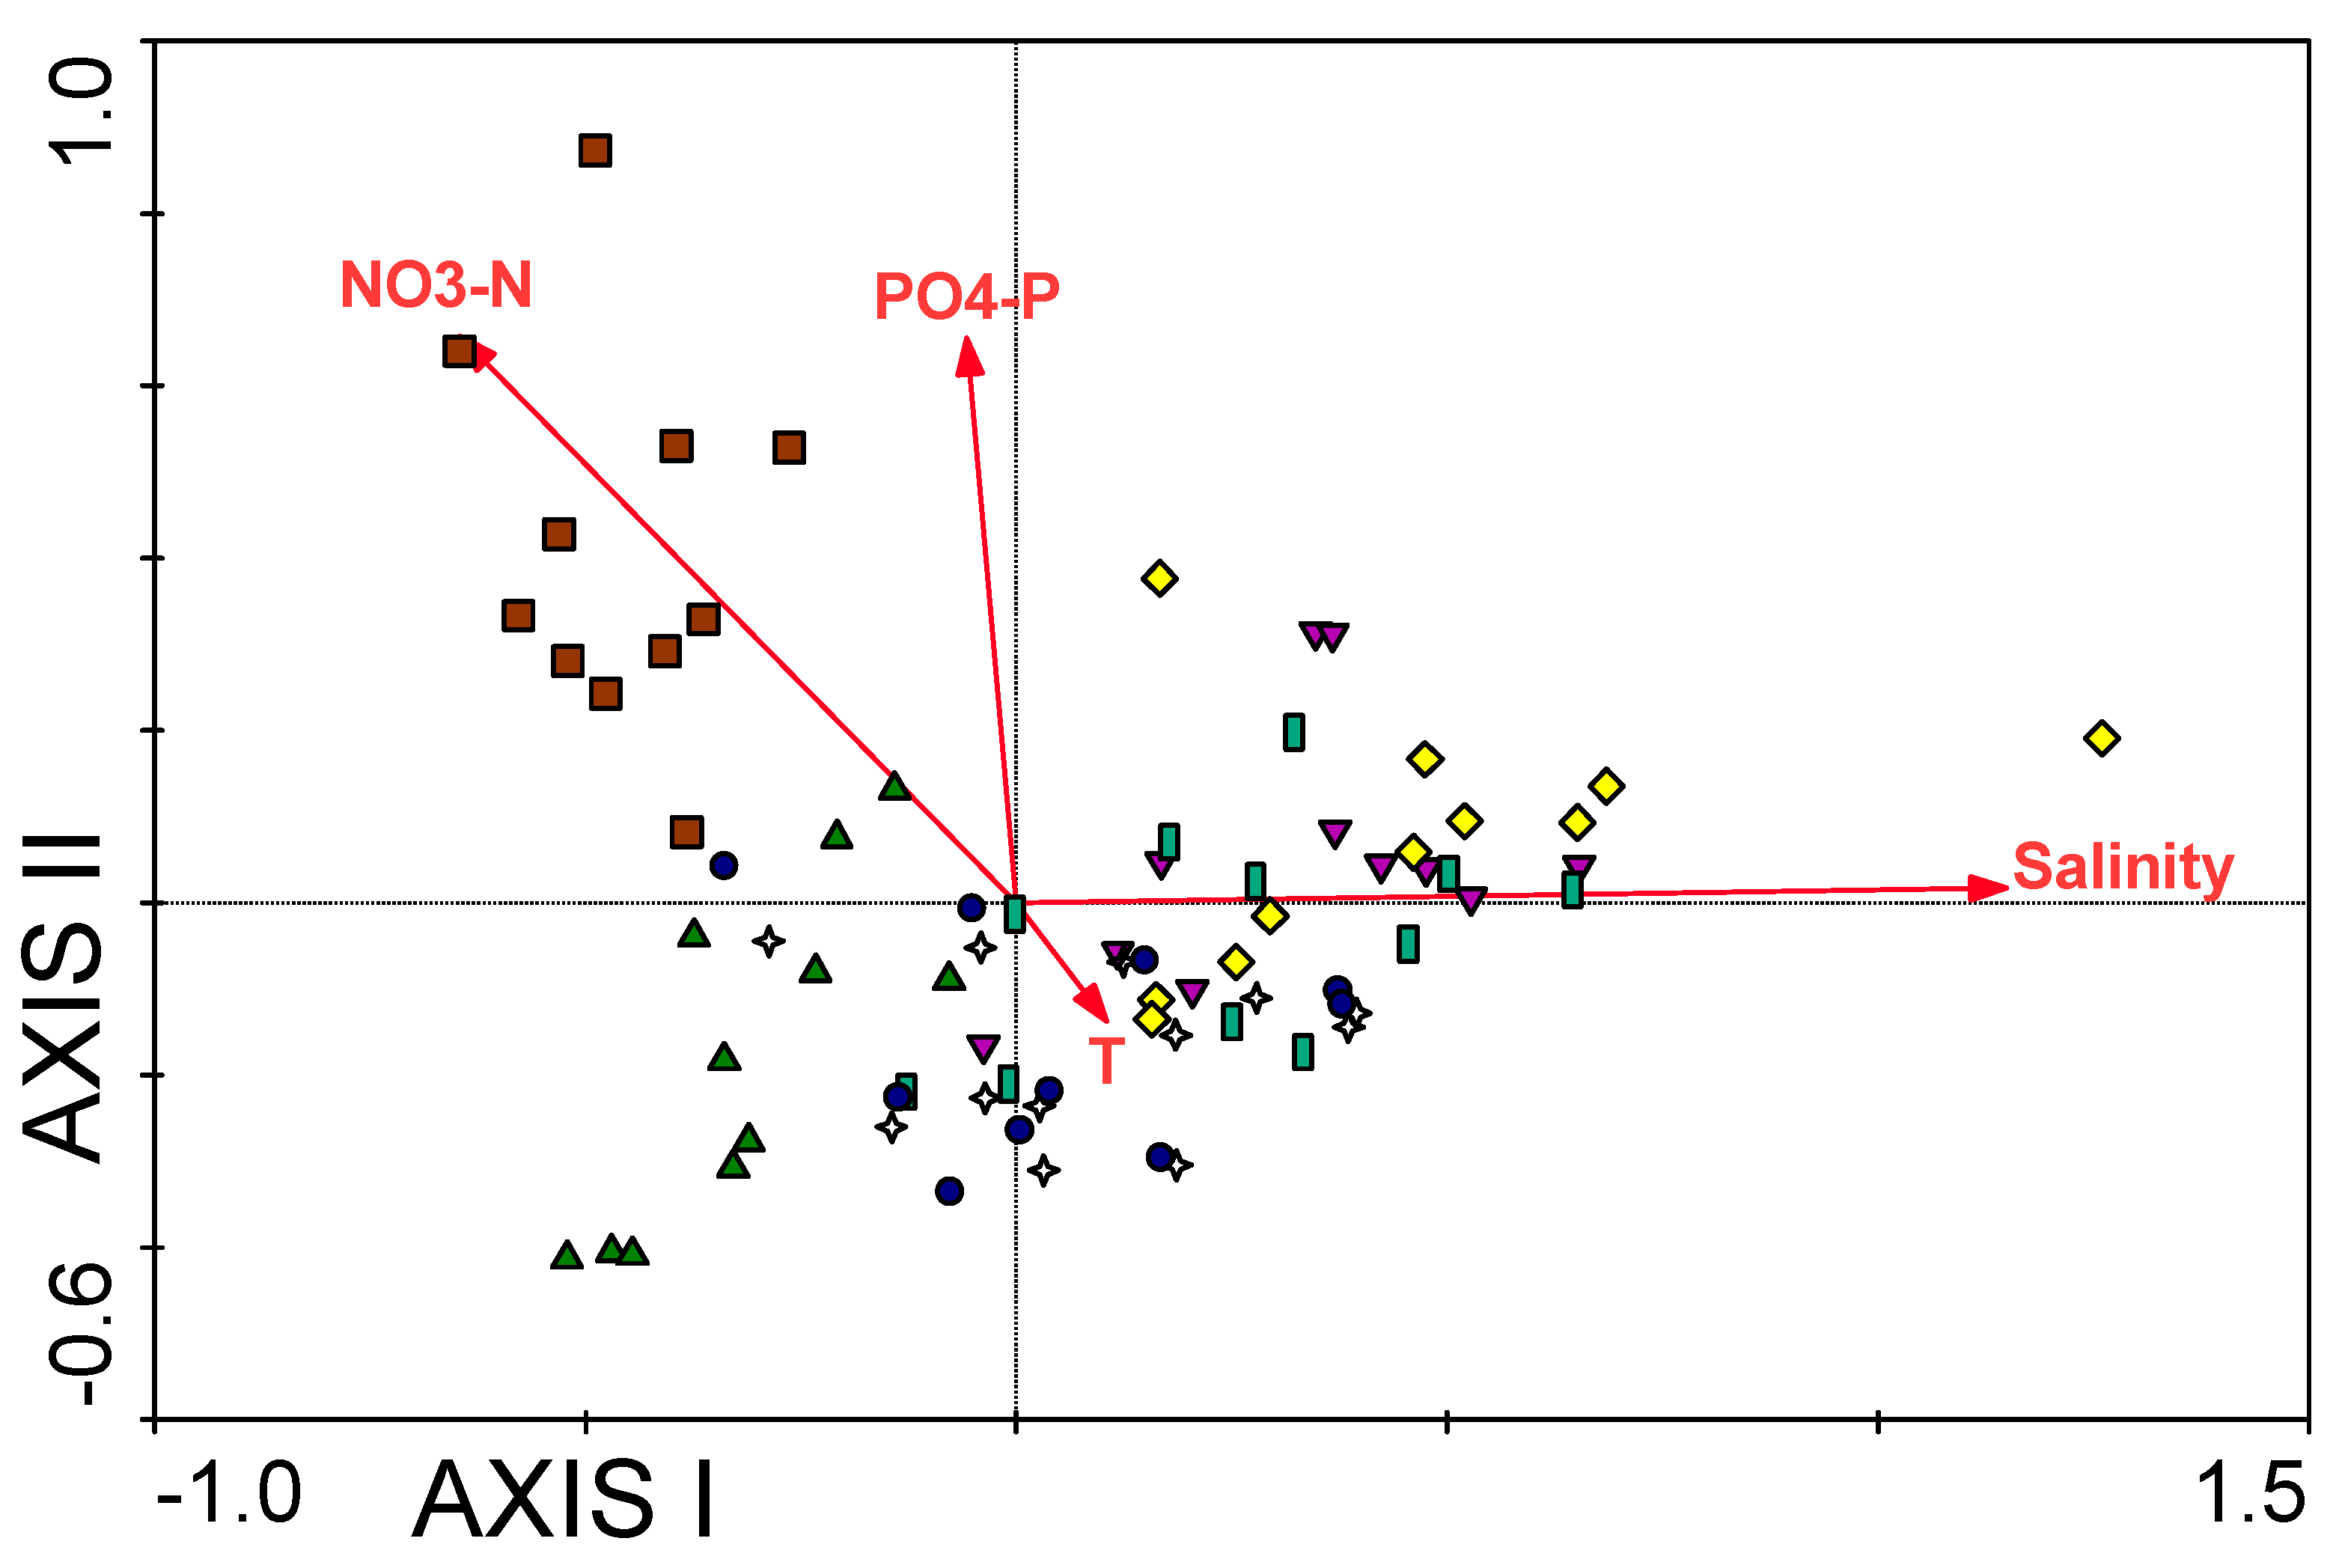
3.1. Water Chemistry
3.2. The Variation of Diatom Species Richness and Diversity

4. Discussion
5. Conclusions
Supplementary Materials
Author Contributions
Funding
Data Availability Statement
Acknowledgments
Conflicts of Interest
Appendix A

| Species | AlgaeBase | DiatomBase | Euryhalinity Class |
|---|---|---|---|
| Melosira varians C.Agardh | f | f | mark eury |
| Navicula cincta (Ehr.) Ralfs | f, m | b, f, t | mark eury |
| Ulnaria ulna (Nitzsch) P.Compère | f | f | some eury |
| Stephanocyclus meneghinianus (Kützing) Kulikovskiy, Genkal & Kociolek | f, m | f | mark eury |
| Halamphora coffeiformis (C.Agardh) Mereschkowsky | b | b | mark eury |
| Hyalodiscus scoticus (Kützing) Grunow | m | m | mark eury |
| Gomphonema parvulum (Kützing) Kützing | f | f, m | mark eury |
| Cocconeis placentula Ehrenberg | f | f, m | mark eury |
| Staurosirella pinnata (Ehrenberg) D.M.Williams & Round | f | f, m | mark eury |
| Campylodiscus echeneis Ehrenberg ex Kützing | m | m | mark eury |
| Hippodonta hungarica (Grunow) Lange-Bertalot, Metzeltin & Witkowski | f | f | some eury |
| Tabularia tabulata (C.Agardh) Snoeijs | f, m | f, b, m | NG |
| Cocconeis pediculus Ehrenberg | f | f | some eury |
| Rhoicosphenia abbreviata (C.Agardh) Lange-Bertalot | f | f, m | mark eury |
| Surirella striatula Turpin | m | f, b, m | mark eury |
| Aulacoseira granulata (Ehrenberg) Simonsen | f | f | some eury |
| Halamphora veneta (Kützing) Levkov | f | f | some eury |
| Nitzschia amphibia Grunow | f | f | mark eury |
| Nitzschia inconspicua Grunow | f | f | NG |
| Tabularia fasciculata (C.Agardh) D.M.Williams & Round | m | f, b, m | mark eury |
| Navicula veneta Kützing | b | f, b | mark eury |
| Achnanthidium minutissimum (Kützing) Czarnecki | f | f, t | mark eury |
| Mastogloia smithii Thwaites ex W.Smith | f, m | f, m | mark eury |
| Cocconeis placentula var. euglypta (Ehrenberg) Cleve | f | f | mark eury |
| Fragilaria capucina Desmazières | f, m | f | some eury |
| Navicula phyllepta Kützing | f, m | f, m | mark eury |
| Ulnaria biceps (Kützing) Compère | f | f | NG |
| Tryblionella compressa (Bailey) Poulin | m | m | mark eury |
| Cocconeis lineata Ehrenberg | f | f | mark eury |
| Nitzschia palea (Kützing) W.Smith | f | f | mark eury |
| Gogorevia exilis (Kützing) Kulikovskiy & Kociolek | f | f | some eury |
| Tryblionella apiculata W.Gregory | m | f | mark eury |
| Navicula tripunctata (O.F.Müller) Bory | f | f, m | mark eury |
| Bacillaria paxillifera (O.F.Müller) T.Marsson | b | f, m | mark eury |
| Fallacia pygmaea (Kützing) Stickle & D.G.Mann | f | f, b | mark eury |
| Navicula peregrina (Ehrenberg) Kützing | b | f, b, m | mark eury |
| Nitzschia microcephala Grunow | f | f | mark eury |
| Gomphonella olivacea (Hornemann) Rabenhorst | f | f | mark eury |
| Amphora pediculus (Kützing) Grunow | f | f | mark eury |
References
- Potapova, M. Patterns of diatom distribution in relation to salinity. In The Diatom World; Seckbach, J., Kociolek, P., Eds.; Springer: Berlin/Heidelberg, Germany, 2011; pp. 313–332. [Google Scholar] [CrossRef]
- Denys, L. A Check-List of the Diatoms in the Holocene Deposits of the Western Belgian Coastal Plain with a Survey of Their Apparent Ecological Requirements; Ministerie van Economische Zaken: Brussel, Belgium, 1991.
- Desianti, N.; Potapova, M.; Enache, M.; Belton, T.J.; Velinsky, D.J.; Thomas, R.; Mead, J. Sediment diatoms as environmental indicators in New Jersey coastal lagoons. J. Coast. Res. 2017, 78, 127–140. [Google Scholar] [CrossRef]
- Whittaker, R.H. Vegetation of the Siskiyou Mountains, Oregon and California. Ecol. Monogr. 1960, 30, 280–338. [Google Scholar] [CrossRef]
- Whittaker, R.H. Evolution and measurement of species diversity. Taxon 1972, 21, 213–251. [Google Scholar] [CrossRef]
- Legendre, P.; Borcard, D.; Peres-Neto, P.R. Analyzing beta diversity: Partitioning the spatial variation of community composition data. Ecol. Monogr. 2005, 75, 435–450. [Google Scholar] [CrossRef]
- Podani, J.; Schmera, D. A new conceptual and methodological framework for exploring and explaining pattern in presence-absence data. Oikos 2011, 120, 1625–1638. [Google Scholar] [CrossRef]
- Legendre, P.; De Cáceres, M. Beta diversity as the variance of community data: Dissimilarity coefficients and partitioning. Ecol. Lett. 2013, 16, 951–963. [Google Scholar] [CrossRef]
- Heino, J.; Grönroos, M. Exploring species and site contributions to beta diversity in stream insect assemblages. Oecologia 2017, 183, 151–160. [Google Scholar] [CrossRef]
- Ruhí, A.; Datry, T.; Sabo, J.L. Interpreting beta-diversity components over time to conserve metacommunities in highly dynamic ecosystems. Conserv. Biol. 2017, 31, 1459–1468. [Google Scholar] [CrossRef]
- Leboucher, T.; Budnick, W.R.; Passy, S.I.; Boutry, S.; Jamoneau, A.; Soininen, J.; Vyverman, W.; Tison-Rosebery, J. Diatom β-diversity in streams increases with spatial scale and decreases with nutrient enrichment across regional to sub-continental scales. J. Biogeogr. 2019, 46, 734–744. [Google Scholar] [CrossRef]
- Rogosch, J.S.; Olden, J.D. Dynamic contributions of intermittent and perennial streams to fish beta diversity in dryland rivers. J. Biogeogr. 2019, 46, 2311–2322. [Google Scholar] [CrossRef]
- Szabó, B.; Lengyel, E.; Padisák, J.; Stenger-Kovács, C. Benthic diatom metacommunity across small freshwater lakes: Driving mechanisms, β-diversity and ecological uniqueness. Hydrobiologia 2019, 828, 183–198. [Google Scholar] [CrossRef]
- Brittain, J.E.; Heino, J.; Friberg, N.; Aroviita, J.; Kahlert, M.; Karjalainen, S.M.; Keck, F.; Lento, J.; Liljaniemi, P.; Mykrä, H.; et al. Ecological correlates of riverine diatom and macroinvertebrate alpha and beta diversity across Arctic Fennoscandia. Freshw. Biol. 2022, 67, 49–63. [Google Scholar] [CrossRef]
- Valente-Neto, F.; da Silva, F.H.; Covich, A.P.; de Oliveira Roque, F. Streams dry and ecological uniqueness rise: Environmental selection drives aquatic insect patterns in a stream network prone to intermittence. Hydrobiologia 2020, 847, 617–628. [Google Scholar] [CrossRef]
- Seelen, L.M.; Teurlincx, S.; Bruinsma, J.; Huijsmans, T.M.; van Donk, E.; Lürling, M.; de Senerpont Domis, L.N. The value of novel ecosystems: Disclosing the ecological quality of quarry lakes. Sci. Total Environ. 2021, 769, 144294. [Google Scholar] [CrossRef] [PubMed]
- Camara, E.M.; de Andrade-Tubino, M.F.; Franco, T.P.; Neves, L.M.; dos Santos, L.N.; Araújo, F.G. Multiscale mechanisms underpin the ecological uniqueness of local fish assemblages in tropical coastal seascapes. Mar. Biol. 2022, 169, 17. [Google Scholar] [CrossRef]
- Atalay, İ.; Ekinci, D.; Bayrak, M. Ecological Problems Based on Anthropogenic Process of Some Coastal Wetlands in Turkey (in Turkish). In Proceedings of the National Geomorphology Symposium, Samsun, Turkey, 15–16 October 2015. [Google Scholar]
- Kaleli, A.; Akçaalan, R. Checklist of marine diatoms from the Turkish coastal waters with updated nomenclature. Aquat. Res. 2021, 4, 88–115. [Google Scholar] [CrossRef]
- Ministry of Agriculture and Forestry (MAF). Kocaçay Delta Wetland Sub-Basin Biodiversity Research Sub-Project; Ministry of Agriculture and Forestry: Ankara, Turkey, 2018. (In Turkish)
- Kazancı, N.; Emre, Ö.; Erkal, T.; İleri, Ö.; Engin, M.; Görür, N. Morphology and sedimentary facies of actual Kocasu and Gönen Çayı Deltas, Marmara Sea, Northwestern Anatolia. Bull. Miner. Res. Explor. 1999, 121, 1–18. [Google Scholar]
- American Public Health Association (APHA). Standard Methods for the Examination of Water and Wastewater, 20th ed.; United Book Press: Baltimore, MD, USA, 1998. [Google Scholar]
- Kelly, M.G.; Adams, C.; Graves, A.C.; Jamieson, J.; Krokowski, J.; Lycett, E.B.; Murray-Bligh, J.; Pritchard, S.; Wilkins, C. The Trophic Diatom Index: A User’s Manual; Technical report, E2/TR2; Environment Agency: Bristol, UK, 2001.
- Taylor, J.C.; Harding, W.R.; Archibald, C.G.M. A Methods Manual for the Collection, Preparation and Analysis of Diatom Samples; Version 1; Water Research Commission: Pretoria, South Africa, 2007. [Google Scholar]
- Schmidt, A. Atlas der Diatomaceen-Kunde; R. Reisland: Leipzig, Germany, 1874–1959; Volume 1–120. [Google Scholar]
- Desikachary, T.V. Atlas of Diatoms (Marine Diatoms of the Indian Ocean Region); Madras Science Foundation: Guduvancheri, India, 1988–1989; Volume V–VI. [Google Scholar]
- Krammer, K.; Lange-Bertalot, H. Süβwasserflora von Mitteleuropa Bacillariophyceae 3. Teil: Centrales, Fragilariaceae, Eunotiaceae; Gustav Fischer Verlag: Stuttgart, Germany, 1991. [Google Scholar]
- Krammer, K.; Lange-Bertalot, H. Süβwasserflora von Mitteleuropa Bacillariophyceae 4. Teil: Achnanthaceae, Kritische Ergänzungen zu Navicula (Lineolatae) und Gomphonema Gesamtliteraturverzeichnis; Gustav Fischer Verlag: Stuttgart, Germany, 1991. [Google Scholar]
- Krammer, K.; Lange-Bertalot, H. Süβwasserflora von Mitteleuropa Bacillariophyceae 1. Teil: Naviculaceae; Spektrum Akademischer Verlag: Berlin/Heidelberg, Germany, 1997. [Google Scholar]
- Krammer, K.; Lange-Bertalot, H. Süβwasserflora von Mitteleuropa Bacillariophyceae 2. Teil: Bacillariaceae, Epithemiaceae, Surirellaceae; Spektrum Akademischer Verlag: Berlin/Heidelberg, Germany, 1997. [Google Scholar]
- Hartley, B.; Barber, H.G.; Carter, J.R. An Atlas of British Diatoms; Biopress Ltd.: Bristol, UK, 1996. [Google Scholar]
- Witkowski, A.; Lange-Bertalot, H.; Metzeltin, D. Diatom Flora of Marine Coasts I; Koeltz Scientific Books: Glashütten, Germany, 2000. [Google Scholar]
- Guiry, M.D.; Guiry, G.M. AlgaeBase. World-Wide Electronic Publication, National University of Ireland, Galway. 2023. Available online: http://www.algaebase.org/ (accessed on 30 March 2023).
- Kociolek, J.P.; Blanco, S.; Coste, M.; Ector, L.; Liu, Y.; Karthick, B.; Kulikovskiy, M.; Lundholm, N.; Ludwig, T.; Potapova, M.; et al. DiatomBase. 2023. Available online: https://www.diatombase.org (accessed on 30 March 2023). [CrossRef]
- Seaby, R.M.; Henderson, P.A. Community Analyses Package; CAP 4.1.3; Pisces Conservation Ltd.: Lymington, UK, 2007. [Google Scholar]
- Nagendra, H. Opposite trends in response for the Shannon and Simpson indices of landscape diversity. Appl. Geogr. 2002, 22, 175–186. [Google Scholar] [CrossRef]
- Virta, L.; Soininen, J.; Norkko, A. Stable seasonal and annual alpha diversity of benthic diatom communities despite changing community composition. Front. Mar. Sci. 2020, 7, 88. [Google Scholar] [CrossRef]
- Seaby, R.M.; Henderson, P.A. Species Diversity and Richness Version 4; Pisces Conservation Ltd.: Lymington, UK, 2006. [Google Scholar]
- Legendre, P. Interpreting the replacement and richness difference components of beta diversity. Glob. Ecol. Biogeogr. 2014, 23, 1324–1334. [Google Scholar] [CrossRef]
- Dray, S.; Blanchet, G.; Borcard, D.; Guenard, G.; Jombart, T.; Larocque, G.; Legendre, P.; Madi, N.; Wagner, H.H. Adespatial: Multivariate Multiscale Spatial Analysis. R Package Version 0.3-16. 2022. Available online: https://CRAN.R-project.org/package=adespatial (accessed on 12 August 2022).
- Hällfors, G. Checklist of Baltic Sea Phytoplankton Species (Including Some Heterotrophic Protistan Groups); Helsinki Commission; Baltic Marine Environment Protection Commission: Helsinki, Finland, 2004. [Google Scholar]
- Feyzioğlu, A.M.; Seyhan, K. Phytoplankton composition of southeast Black Sea coast. J. Black Sea/Mediterr. Environ. 2007, 13, 61–71. [Google Scholar]
- Baytut, Ö.; Gönülol, A. Phytoplankton distribution and variation along a freshwater-marine transition zone (Kızılırmak River) in the Black Sea. Oceanol. Hydrobiol. Stud. 2016, 45, 453–465. [Google Scholar] [CrossRef]
- Kısa, D.; Pabuççu, K. Contributions to algae flora of Gerze coastline (Sinop, Turkey). Sinop Univ. J. Nat. Sci. 2016, 1, 36–45. [Google Scholar]
- Akcaalan, R.; Kaleli, A.; Köker, L. Distribution of marine benthic diatoms on the coasts of the sea of Marmara and their responses to environmental variables. J. Mar. Syst. 2022, 234, 103780. [Google Scholar] [CrossRef]
- Cumming, B.F.; Smol, J.P. Development of diatom-based salinity models for paleoclimatic research from lakes in British Columbia (Canada). In Proceedings of the Twelfth International Diatom Symposium, Renesse, The Netherlands, 30 August–5 September 1992; Springer: Dordrecht, The Netherlands, 1993; pp. 179–196. [Google Scholar]
- Wilson, S.E.; Cumming, B.F.; Smol, J.P. Diatom–salinity relationships in 111 lakes from the Interior Plateau of British Columbia, Canada: The development of diatom-based models for paleosalinity reconstructions. J. Paleolimnol. 1994, 12, 197–221. [Google Scholar] [CrossRef]
- Wilson, S.E.; Cumming, B.F.; Smol, J.P. Assessing the reliability of salinity inference models from diatom assemblages: An examination of a 219-lake data set from western North America. Can. J. Fish. Aquat. Sci. 1996, 53, 1580–1594. [Google Scholar] [CrossRef]
- Vartanian, M.; Descles, J.; Quinet, M.; Douady, S.; Lopez, P.J. Plasticity and robustness of pattern formation in the model diatom Phaeodactylum tricornutum. N. Phytol. 2009, 182, 429–442. [Google Scholar] [CrossRef]
- Vitug, L.V.D. Diatom plasticity: Trends, issues, and applications on modern and classical taxonomy, eco-evolutionary dynamics, and climate change. In Diatom Morphogenesis; Annenkov, V., Seckback, J., Gordon, R., Eds.; Scrivener Publishing: Beverly, MA, USA; Wiley: Hoboken, NJ, USA, 2021; pp. 261–268. [Google Scholar] [CrossRef]
- Bussard, A.; Corre, E.; Hubas, C.; Duvernois-Berthet, E.; Le Corguillé, G.; Jourdren, L.; Coulpier, F.; Claquin, P.; Lopez, P.J. Physiological adjustments and transcriptome reprogramming are involved in the acclimation to salinity gradients in diatoms. Environ. Microbiol. 2017, 19, 909–925. [Google Scholar] [CrossRef]
- Leterme, S.C.; Ellis, A.V.; Mitchell, J.G.; Buscot, M.J.; Pollet, T.; Schapira, M.; Seuront, L. Morphological flexibility of Cocconeis placentula (Bacillariophyceae) nanostructure to changing salinity levels 1. J. Phycol. 2010, 46, 715–719. [Google Scholar] [CrossRef]
- Yang, Y.; Hu, R.; Lin, Q.; Hou, J.; Liu, Y.; Han, B.P.; Naselli-Flores, L. Spatial structure and β-diversity of phytoplankton in Tibetan Plateau lakes: Nestedness or replacement? Hydrobiologia 2018, 808, 301–314. [Google Scholar] [CrossRef]
- Virta, L.; Gammal, J.; Järnström, M.; Bernard, G.; Norkko, J.; Norkko, A. The diversity of benthic diatoms affects ecosystem productivity in heterogeneous coastal environments. Ecology 2019, 100, e02765. [Google Scholar] [CrossRef]
- Wu, K.; Zhao, W.; Li, M.; Picazo, F.; Soininen, J.; Shen, J.; Zhu, L.; Cheng, X.; Wang, J. Taxonomic dependency of beta diversity components in benthic communities of bacteria, diatoms and chironomids along a water-depth gradient. Sci. Total Environ. 2020, 741, 140462. [Google Scholar] [CrossRef] [PubMed]
- Podani, J.; Ricotta, C.; Schmera, D. A general framework for analyzing beta diversity, nestedness and related community-level phenomena based on abundance data. Ecol. Complex. 2013, 15, 52–61. [Google Scholar] [CrossRef]
- Rodríguez-Alcalá, O.; Blanco, S.; García-Girón, J.; Jeppesen, E.; Irvine, K.; Nõges, P.; Nõges, T.; Gross, E.M.; Bécares, E. Large-scale geographical and environmental drivers of shallow lake diatom metacommunities across Europe. Sci. Total Environ. 2020, 707, 135887. [Google Scholar] [CrossRef] [PubMed]
- Algarte, V.M.; Dunck, B.; Leandrini, J.A.; Rodrigues, L. Periphytic diatom ecological guilds in floodplain: Ten years after dam. Ecol. Indic. 2016, 69, 407–414. [Google Scholar] [CrossRef]
- Schneck, F.; Lange, K.; Melo, A.S.; Townsend, C.R.; Matthaei, C.D. Effects of a natural flood disturbance on species richness and beta diversity of stream benthic diatom communities. Aquat. Ecol. 2017, 51, 557–569. [Google Scholar] [CrossRef]
- Soininen, J.; Heino, J.; Wang, J. A meta-analysis of nestedness and turnover components of beta diversity across organisms and ecosystems. Glob. Ecol. Biogeogr. 2018, 27, 96–109. [Google Scholar] [CrossRef]
- Szabó, B.; Lengyel, E.; Padisák, J.; Vass, M.; Stenger-Kovács, C. Structuring forces and β-diversity of benthic diatom metacommunities in soda pans of the Carpathian Basin. Eur. J. Phycol. 2018, 53, 219–229. [Google Scholar] [CrossRef]
- Stefanidou, N.; Katsiapi, M.; Tsianis, D.; Demertzioglou, M.; Michaloudi, E.; Moustaka-Gouni, M. Patterns in alpha and beta phytoplankton diversity along a conductivity gradient in coastal mediterranean lagoons. Diversity 2020, 12, 38. [Google Scholar] [CrossRef]
- Leprieur, F.; Tedesco, P.A.; Hugueny, B.; Beauchard, O.; Dürr, H.H.; Brosse, S.; Oberdorff, T. Partitioning global patterns of freshwater fish beta diversity reveals contrasting signatures of past climate changes. Ecol. Lett. 2011, 14, 325–334. [Google Scholar] [CrossRef]
- Facca, C.; Sfriso, A.; Socal, G. Temporal and spatial distribution of diatoms in the surface sediments of the Venice Lagoon. Bot. Mar. 2002, 45, 170–183. [Google Scholar] [CrossRef]
- Rzodkiewicz, M.; Gąbka, M.; Szpikowska, G.; Woszczyk, M. Diatom assemblages as indicators of salinity gradients: A case study from a coastal lake. Oceanol. Hydrobiol. Stud. 2017, 46, 325–339. [Google Scholar] [CrossRef]
- Zalat, A.A.; El-Sheekh, M.M.; Gaballa, M. Distribution pattern of diatom flora in the surface sediments of Bardawil Lagoon (North Sinai), Egypt. Thalass. Int. J. Mar. Sci. 2019, 35, 531–539. [Google Scholar] [CrossRef]
- Bernardi Aubry, F.; Acri, F.; Finotto, S.; Pugnetti, A. Phytoplankton dynamics and water quality in the Venice Lagoon. Water 2021, 13, 2780. [Google Scholar] [CrossRef]

| Mean ± SE | Min–Max | ||
|---|---|---|---|
| T | °C | 18.36 ± 0.85 | 4.55–34.0 |
| pH | 8.28 ± 0.05 | 6.92–9.03 | |
| EC | mS/cm | 10.76 ± 1.08 | 0.33–44.70 |
| Sal | ppt | 6.42 ± 0.67 | 0.16–28.89 |
| DO | mg/L | 7.17 ± 0.24 | 1.60–11.9 |
| NO3-N | mg/L | 0.26 ± 0.38 | 0.03–1.74 |
| PO4-P | mg/L | 0.08 ± 0.01 | 0.01–0.37 |
| TP | mg/L | 0.27 ± 0.04 | 0.05–2.83 |
| TN | mg/L | 4.01 ± 0.25 | 1.59–16.37 |
| Sampling Sites | Mean ± SE | Min–Max |
|---|---|---|
| SS1 | 0.352 ± 0.053 | 0.159–0.690 |
| SS2 | 9.647 ± 1.281 | 3.582–14.016 |
| SS3 | 8.662 ± 1.472 | 1.238–14.016 |
| SS4 | 6.701 ± 1.317 | 1.055–12.181 |
| SS5 | 6.638 ± 1.235 | 1.071–11.849 |
| SS6 | 0.348 ± 0.025 | 0.214–0.470 |
| SS7 | 12.59 ± 2.097 | 5.345–28.892 |
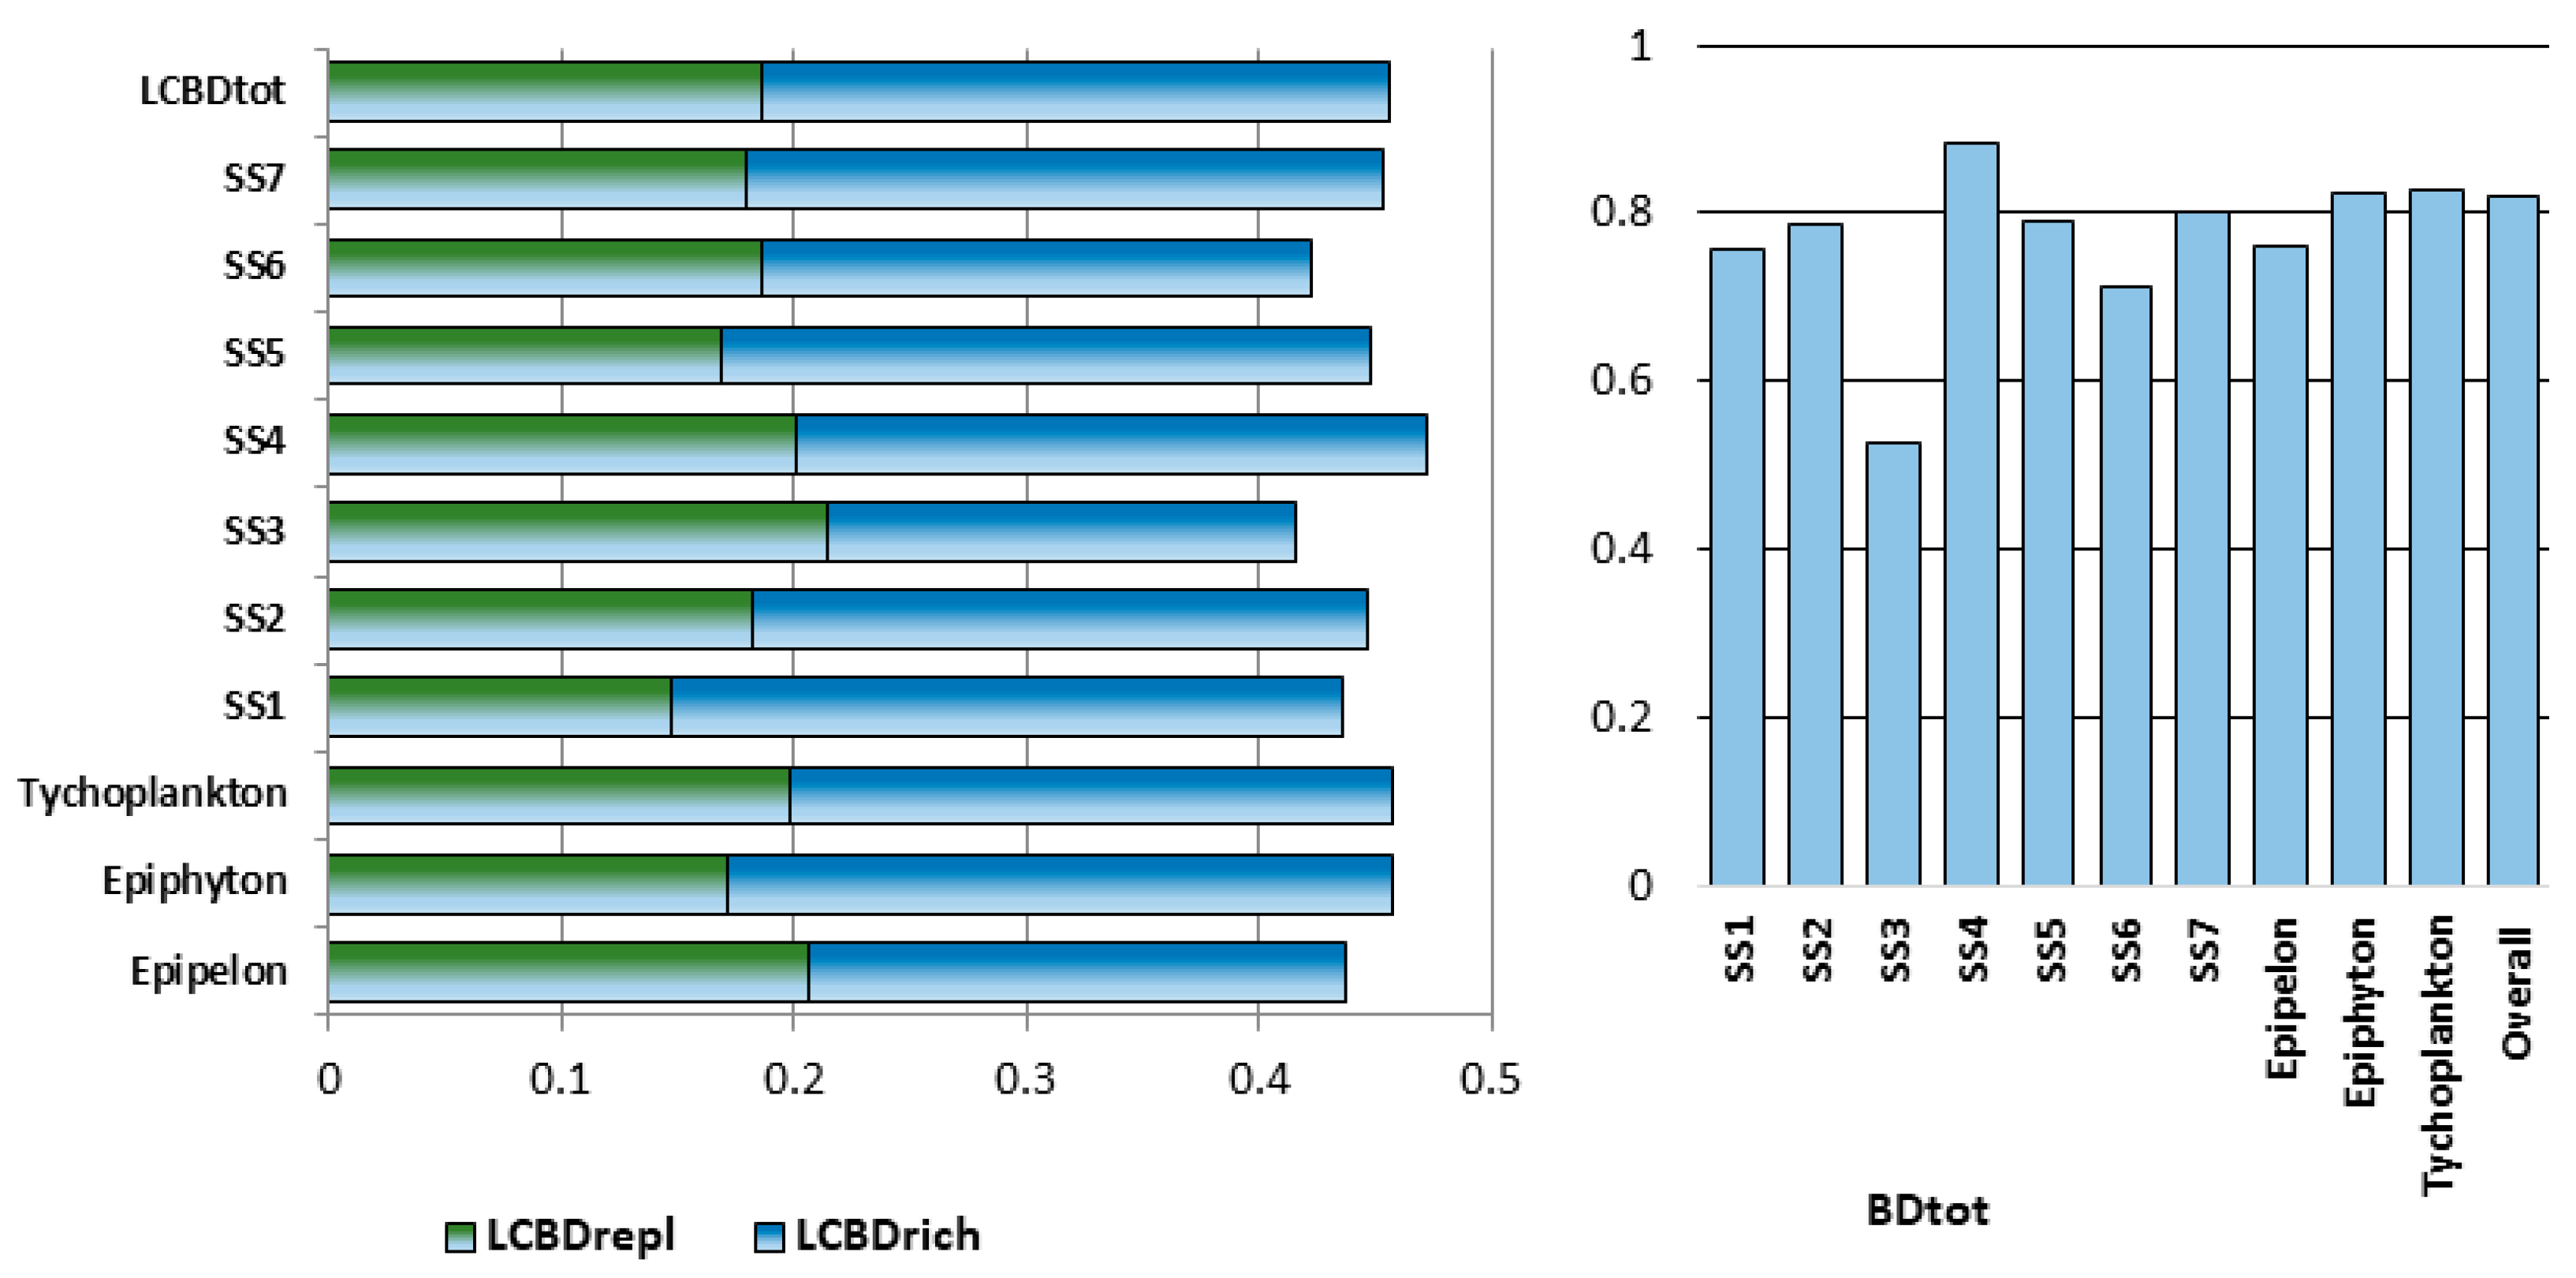
| Microhabitat Types | Species Richness | Alpha Diversity | Beta Diversity | SIMPER Within | |||||
|---|---|---|---|---|---|---|---|---|---|
| nsamp | ntaxa | Mean (Min–Max) | H’ ± Jackknife SE | LCBDrepl | LCBDrich | LCBDtot | BDtot | Average Sim (%) | |
| Epipelon | 49 | 291 | 35.27 (2–103) | 4.303 ± 0.184 | 0.206 | 0.231 | 0.437 | 0.76 | 11.653 |
| Epilithon | 6 | 110 | 25.667 (1–90) | 3.747 | |||||
| Epiphyton | 50 | 261 | 25.90 (1–92) | 4.225 ± 0.126 | 0.171 | 0.287 | 0.458 | 0.825 | 8.504 |
| Tychoplankton | 77 | 288 | 24.04 (1–151) | 4.439 ± 0.296 | 0.199 | 0.259 | 0.458 | 0.828 | 8.042 |
| Study Sites | |||||||||
| SS1 | 36 | 266 | 37.17 (1–151) | 4.482 ± 0.085 | 0.147 | 0.289 | 0.436 | 0.756 | 12.842 |
| SS2 | 29 | 203 | 27.62 (1–74) | 3.496 ± 0.138 | 0.182 | 0.265 | 0.447 | 0.788 | 9.859 |
| SS3 | 11 | 58 | 9.91 (2–16) | 3.148 ± 0.339 | 0.214 | 0.202 | 0.416 | 0.526 | 13.931 |
| SS4 | 11 | 68 | 10.00 (1–29) | 2.16 ± 1.289 | 0.201 | 0.271 | 0.472 | 0.884 | 7.267 |
| SS5 | 32 | 227 | 29.53 (1–85) | 4.078 ± 0.12 | 0.169 | 0.279 | 0.448 | 0.791 | 9.607 |
| SS6 | 32 | 210 | 31.03 (2–90) | 3.798 ± 0.086 | 0.186 | 0.237 | 0.423 | 0.713 | 16.167 |
| SS7 | 31 | 192 | 23.61 (2–73) | 3.885 ± 0.242 | 0.18 | 0.273 | 0.453 | 0.803 | 9.689 |
| All samp. indices: | 182 | 357 | 27.63 (1–151) | 4.604 ± 0.056 | 0.187 | 0.269 | 0.456 | 0.821 | 7.77 |
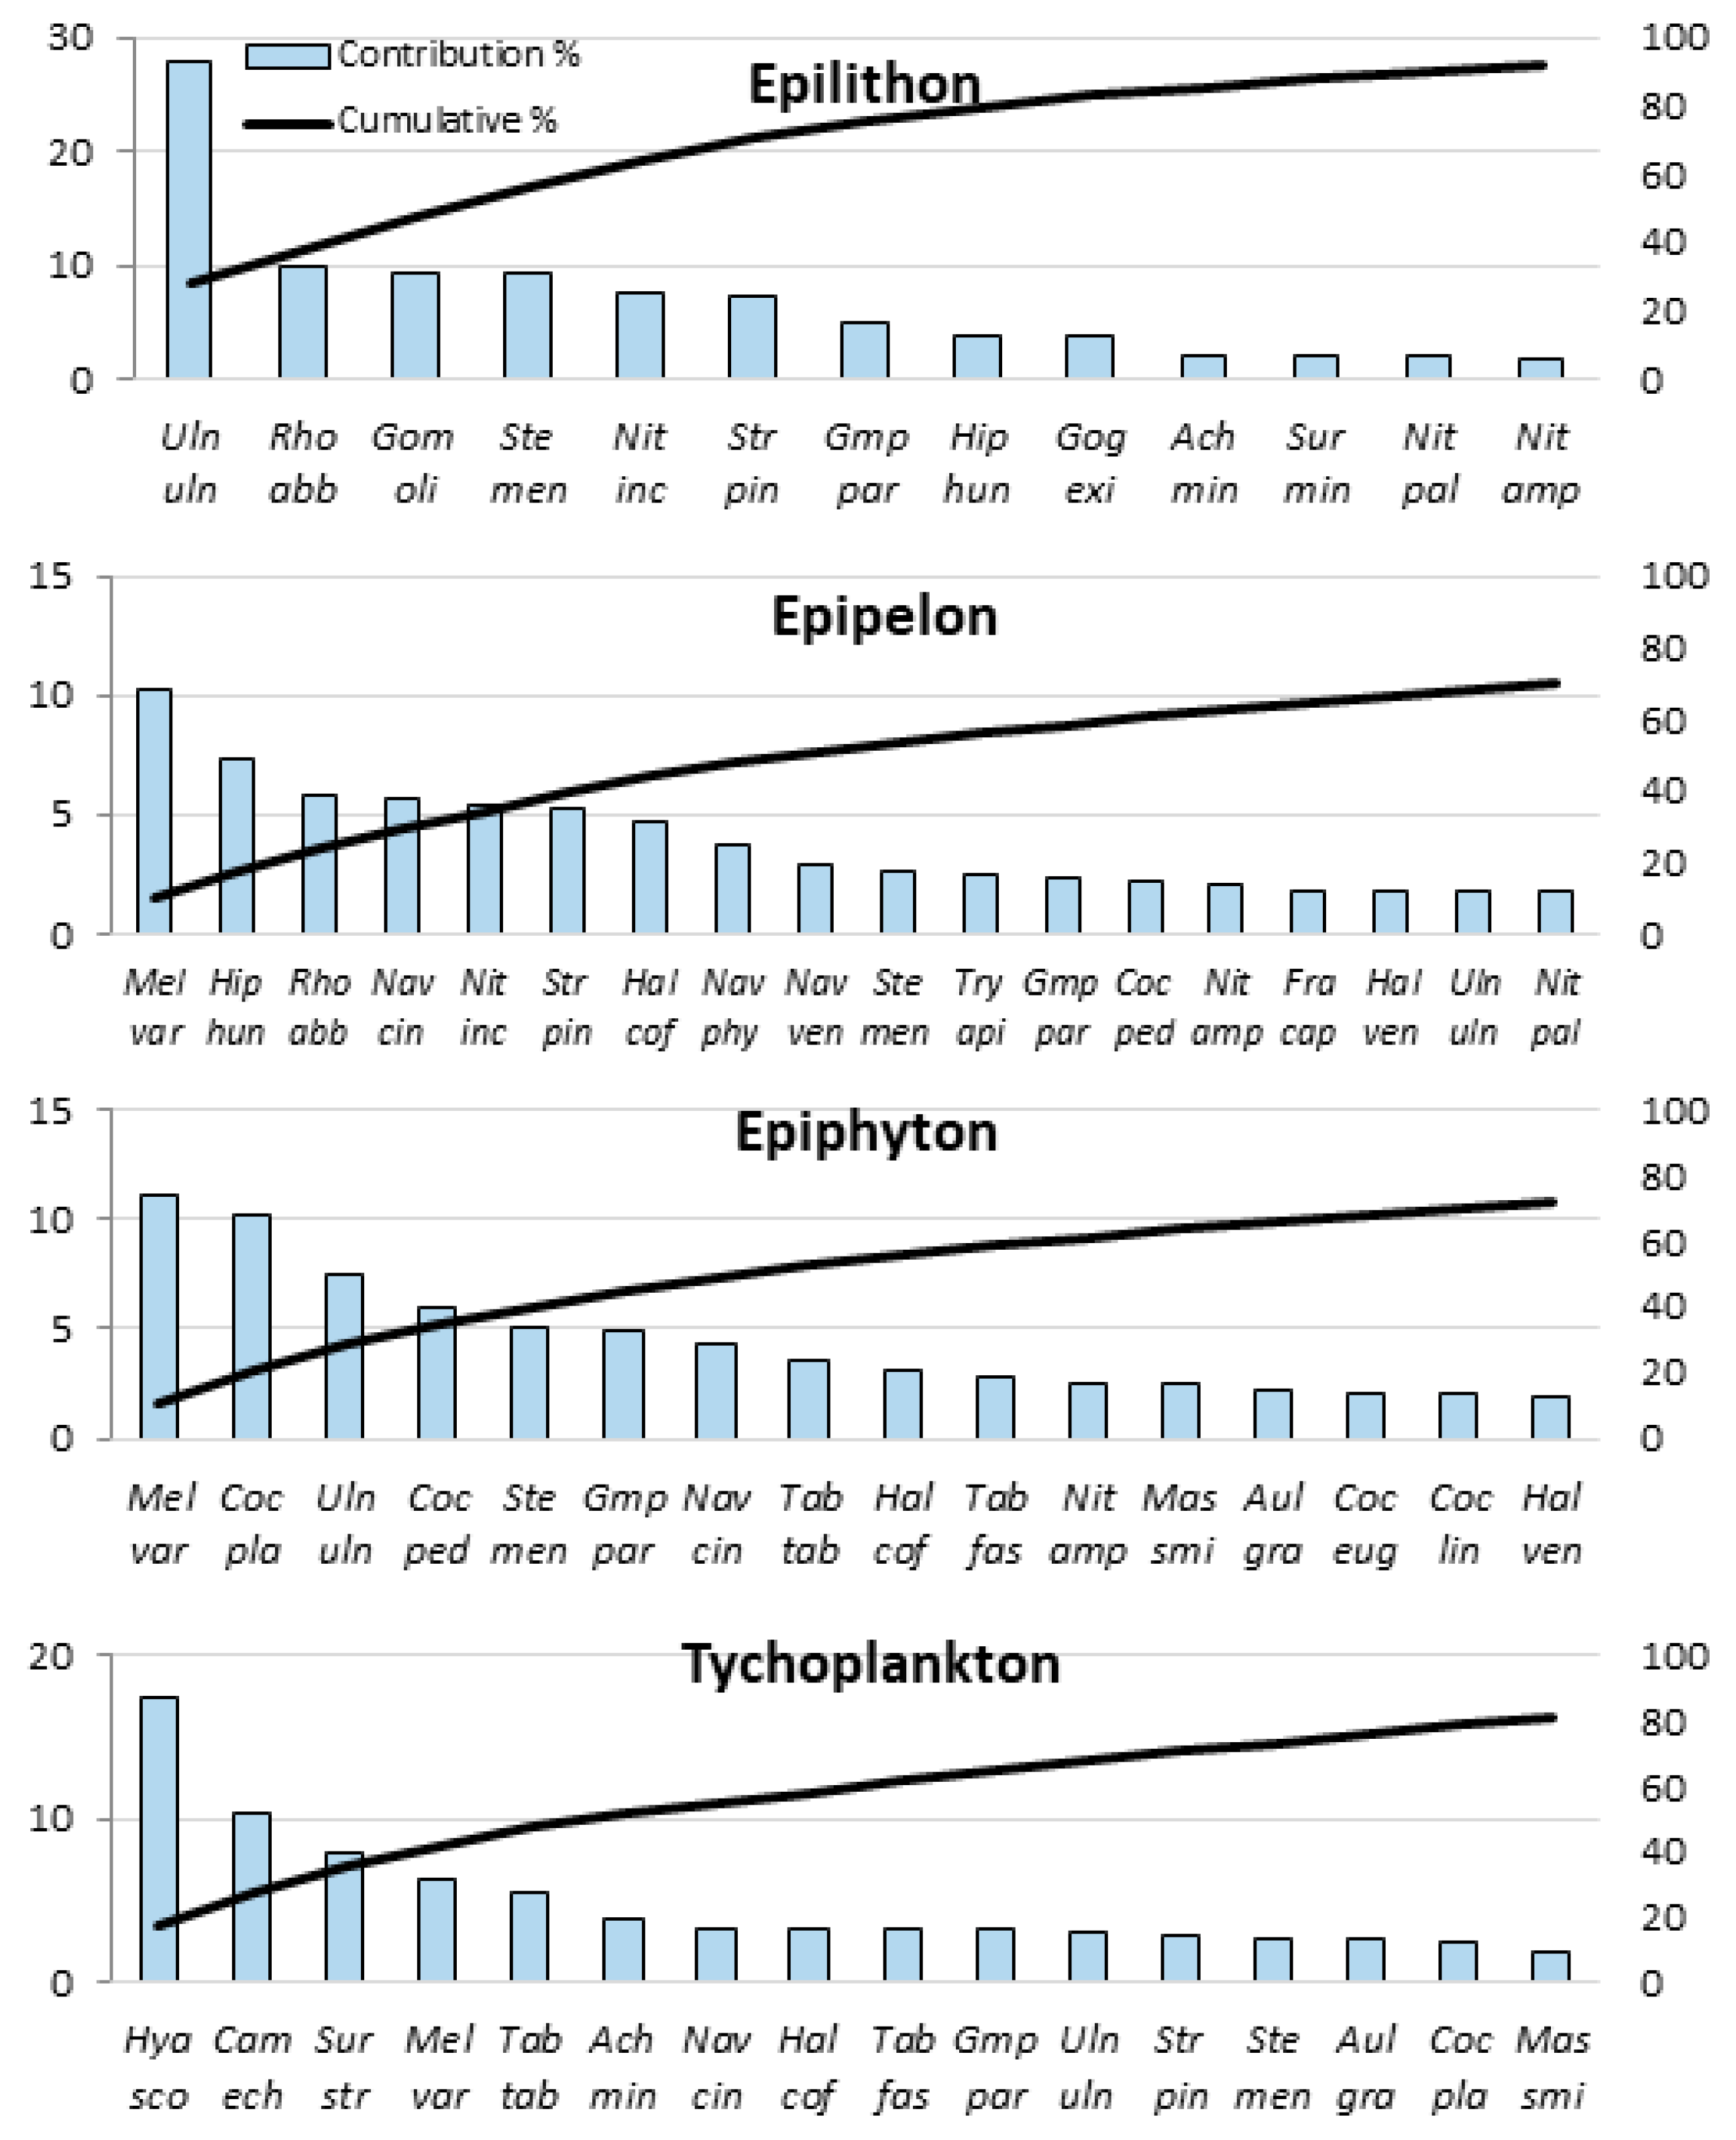
| SIMPER Analysis Results | Alpha D. | Beta D. | ||||||
|---|---|---|---|---|---|---|---|---|
| Species | Abrr. | Ocurr. | Ave. Ab. | Ave. Sim. | Cont. % | Cumul. % | Spec H’ | SCBDindex |
| Melosira varians | Mel var | 87 | 4.589 | 0.8 | 10.293 | 10.293 | 2.876 | 0.0242 |
| Navicula cincta | Nav cin | 76 | 3.575 | 0.394 | 5.076 | 15.369 | 2.713 | 0.0226 |
| Ulnaria ulna | Uln uln | 77 | 2.834 | 0.366 | 4.709 | 20.078 | 2.797 | 0.0176 |
| Stephanocyclus meneghinianus | Ste men | 79 | 2.252 | 0.322 | 4.14 | 24.218 | 1.971 | 0.0188 |
| Halamphora coffeiformis | Hal cof | 71 | 2.185 | 0.32 | 4.119 | 28.337 | 2.912 | 0.0144 |
| Hyalodiscus scoticus | Hya sco | 57 | 4.403 | 0.318 | 4.098 | 32.435 | 3.427 | 0.0222 |
| Gomphonema parvulum | Gmp par | 73 | 1.912 | 0.307 | 3.946 | 36.381 | 3.135 | 0.0122 |
| Cocconeis placentula | Coc pla | 59 | 3.09 | 0.295 | 3.791 | 40.172 | 2.95 | 0.0246 |
| Staurosirella pinnata | Str pin | 78 | 2.311 | 0.273 | 3.517 | 43.689 | 3.549 | 0.0148 |
| Campylodiscus echeneis | Cam ech | 55 | 3.379 | 0.258 | 3.319 | 47.007 | 3.304 | 0.0173 |
| Hippodonta hungarica | Hip hun | 77 | 2.242 | 0.244 | 3.136 | 50.143 | 2.842 | 0.013 |
| Tabularia tabulata | Tab tab | 61 | 1.998 | 0.233 | 2.996 | 53.139 | 1.987 | 0.0131 |
| Cocconeis pediculus | Coc ped | 66 | 2.263 | 0.193 | 2.481 | 55.62 | 2.616 | 0.0197 |
| Rhoicosphaenia abbreviata | Rho abb | 70 | 2.022 | 0.191 | 2.455 | 58.075 | 2.009 | 0.0161 |
| Surirella striatula | Sur str | 52 | 2.185 | 0.186 | 2.392 | 60.467 | 2.61 | 0.0121 |
| Aulacoseira granulata | Aul gra | 57 | 1.884 | 0.185 | 2.386 | 62.853 | 3.055 | 0.0121 |
| Halamphora veneta | Hal ven | 56 | 1.638 | 0.17 | 2.184 | 65.036 | 2.593 | 0.0123 |
| Nitzschia amphibia | Nit amp | 72 | 1.327 | 0.161 | 2.07 | 67.107 | 3.483 | 0.0123 |
| Nitzschia inconspicua | Nit inc | 69 | 1.039 | 0.161 | 2.07 | 69.176 | 3.33 | 0.009 |
| Tabularia fasciculata | Tab fas | 54 | 1.534 | 0.16 | 2.058 | 71.234 | 2.575 | 0.0099 |
| Navicula veneta | Nav ven | 61 | 1.124 | 0.14 | 1.797 | 73.032 | 3.278 | 0.0089 |
| Achnanthidium minutissimum | Ach min | 50 | 2.233 | 0.126 | 1.624 | 74.656 | 1.4 | 0.0111 |
| Mastogloia smithii | Mas smi | 51 | 1.74 | 0.124 | 1.592 | 76.248 | 2.234 | 0.0129 |
| Cocconeis placentula var. euglypta | Coc eug | 42 | 1.246 | 0.103 | 1.327 | 77.575 | 2.904 | 0.0099 |
| Fragilaria capucina | Fra cap | 57 | 1.573 | 0.096 | 1.236 | 78.811 | 2.594 | 0.0144 |
| Navicula phyllepta | Nav phy | 46 | 1.616 | 0.093 | 1.197 | 80.008 | 2.215 | 0.0075 |
| Ulnaria biceps | Uln bic | 55 | 0.871 | 0.09 | 1.153 | 81.161 | 3.035 | 0.0086 |
| Tryblionella compressa | Try com | 50 | 1.208 | 0.083 | 1.068 | 82.229 | 2.333 | 0.0133 |
| Cocconeis lineata | Coc lin | 48 | 0.923 | 0.081 | 1.046 | 83.275 | 2.417 | 0.0069 |
| Nitzschia palea | Nit pal | 52 | 0.606 | 0.069 | 0.884 | 84.158 | 3.3 | 0.0078 |
| Gogorevia exilis | Gog exi | 38 | 1.361 | 0.067 | 0.866 | 85.024 | 2.675 | 0.0103 |
| Tryblionella apiculata | Try api | 59 | 0.785 | 0.065 | 0.835 | 85.858 | 3.289 | 0.0082 |
| Navicula tripunctata | Nav tri | 47 | 0.759 | 0.057 | 0.733 | 86.591 | 2.845 | 0.0109 |
| Bacillaria paxillifera | Bac pax | 51 | 0.784 | 0.057 | 0.73 | 87.321 | 2.926 | 0.0077 |
| Fallacia pygmaea | Fal pyg | 41 | 0.891 | 0.051 | 0.655 | 87.976 | 2.722 | 0.008 |
| Navicula peregrina | Nav per | 41 | 0.775 | 0.047 | 0.601 | 88.577 | 2.378 | 0.009 |
| Nitzschia microcephala | Nit mic | 40 | 0.85 | 0.044 | 0.564 | 89.141 | 2.591 | 0.0088 |
| Gomphonella olivacea | Gom oli | 35 | 0.616 | 0.037 | 0.479 | 89.62 | 1.584 | 0.0062 |
| Amphora pediculus | Amp ped | 50 | 0.402 | 0.034 | 0.436 | 90.055 | 3.518 | 0.008 |
| BDtot Index | LCBDrep Index | LCBDrich Index | H’ Index | Sp. Rich. | |
|---|---|---|---|---|---|
| BDtot index | |||||
| LCBDrep index | 1 | ||||
| LCBDrich index | 0.345 ** | −0.926 ** | 1 | ||
| H’ index | −0.824 ** | 0.236 ** | −0.471 ** | 1 | |
| Sp. Rich. | −0.926 ** | −0.368 ** | 0.840 ** | 1 | |
| DO | 0.224 ** | −0.169 ** | −0.221 ** | ||
| T | −0.383 ** | 0.282 ** | 0.374 ** | ||
| PO4-P | −0.288 ** | 0.175 ** | −0.245 ** | 0.212 ** | 0.255 ** |
| TP | −0.235 ** | 0.166 ** | 0.196 ** | ||
| TN | −0.356 ** | 0.272 ** | 0.314 ** | ||
Disclaimer/Publisher’s Note: The statements, opinions and data contained in all publications are solely those of the individual author(s) and contributor(s) and not of MDPI and/or the editor(s). MDPI and/or the editor(s) disclaim responsibility for any injury to people or property resulting from any ideas, methods, instructions or products referred to in the content. |
© 2023 by the authors. Licensee MDPI, Basel, Switzerland. This article is an open access article distributed under the terms and conditions of the Creative Commons Attribution (CC BY) license (https://creativecommons.org/licenses/by/4.0/).
Share and Cite
Dalkıran, N.; Zünbülgil-Ünsal, B. Environmental Heterogeneity and Salinity Gradient Impacted the Alpha and Beta Diversities of Diatom Assemblages in a Coastal Delta Wetland. Water 2023, 15, 3414. https://doi.org/10.3390/w15193414
Dalkıran N, Zünbülgil-Ünsal B. Environmental Heterogeneity and Salinity Gradient Impacted the Alpha and Beta Diversities of Diatom Assemblages in a Coastal Delta Wetland. Water. 2023; 15(19):3414. https://doi.org/10.3390/w15193414
Chicago/Turabian StyleDalkıran, Nurhayat, and Burcu Zünbülgil-Ünsal. 2023. "Environmental Heterogeneity and Salinity Gradient Impacted the Alpha and Beta Diversities of Diatom Assemblages in a Coastal Delta Wetland" Water 15, no. 19: 3414. https://doi.org/10.3390/w15193414
APA StyleDalkıran, N., & Zünbülgil-Ünsal, B. (2023). Environmental Heterogeneity and Salinity Gradient Impacted the Alpha and Beta Diversities of Diatom Assemblages in a Coastal Delta Wetland. Water, 15(19), 3414. https://doi.org/10.3390/w15193414