Article

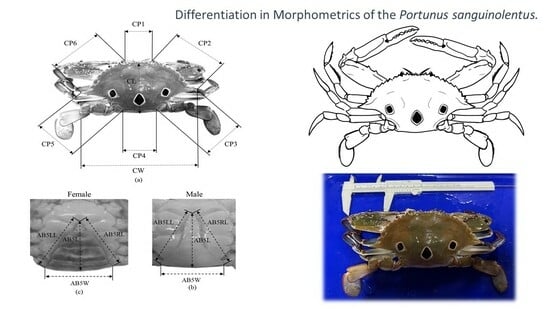
Morphometric Differentiation of the Swimming Crab Portunus sanguinolentus (Herbst, 1783) Populations in East Asia: Implications for Stock Identification and Management

1
Institute of Fisheries Science, National Taiwan University, Taipei 10617, Taiwan
2
Fisheries Research Institute, Ministry of Agriculture, Tainan 70153, Taiwan
3
Department of Leisure & Tourism Management, Shu-Te University, Kaohsiung 82445, Taiwan
4
School of Economics and Management, Sanming University, Sanming 365004, China
5
Department of Hospitality and Baking Management, Shu-Te University, Kaohsiung 82445, Taiwan
*
Authors to whom correspondence should be addressed.
These authors contributed equally to this work.
Water 2023, 15(19), 3335; https://doi.org/10.3390/w15193335
Submission received: 26 August 2023 / Revised: 17 September 2023 / Accepted: 21 September 2023 / Published: 22 September 2023
(This article belongs to the Special Issue Coastal Ecology and Fisheries Management)

Abstract

:
Morphometric disparities were employed to characterize the geographical variations in and elucidate the phylogeography of Portunus sanguinolentus in East Asia. In this study, a comprehensive assessment was undertaken based on measurements from 833 individual crabs. These crabs were sampled from eight distinct locations, namely Kyushu (KS), Fuzhou (FZ), Yilan (YL), Xiamen (XM), Tainan (TN), Hong Kong (HK), Vietnam (VN), and Singapore (SG). Twelve morphometric measurements were standardized based on size using the allometric method. A cluster analysis and a canonical variate analysis (CVA) were then conducted for a data analysis. Randomization tests were subsequently performed to validate the morphometric differences observed among the groups. The analytical results classified the eight sampled populations into at least two distinct clusters. The first cluster included three samples from China (specifically FZ, XM, and HK), while the second cluster consisted of samples from East Asia (including KS, YL, TN, VN, and SG). The CVA revealed a tripartite division into three groups: the mainland China group (FZ, XM, and HK), the Kuroshio group (KS, YL, and TN), and the Southeast Asia group (VN and SG). The observed morphometric variations between these broad groups were statistically significant for both genders. These differences may be attributed to evolutionary origins, geographical events, or environmental adaptations. This study highlights the effectiveness of morphometric techniques in providing comprehensive insights into species delimitation and philogeographic relationships.

Graphical Abstract

1. Introduction

In the management of fishery resources, it is imperative to delineate the population structure of exploited species [1]. Variations in morphological characteristics can serve as an analytical tool to investigate the distinctions among geographically disparate populations; this methodology has also been employed to ascribe various genetic configurations or environmental circumstances to individual geographic locales [2]. Prior investigations have evidenced that fluctuations in environmental conditions precipitate alterations in population organization, encompassing morphological heterogeneity [3,4,5,6,7,8,9,10,11]. From a historical standpoint, methodical observations have elucidated that geographical phenomena wield a more substantial impact on the dispersal patterns of marine species relative to their terrestrial analogs [12]. Scrutiny of the genetic architecture of marine biota has recurrently underscored that taxa possessing advanced dispersal properties evince confined genetic differentiation over extensive geographical expanses [13,14,15]. Such scholarly investigations advocate that the genesis of morphological incongruities can be attributed to the interplay of gene flow between discrete populations. The morphological attributes of organisms do not function in isolation; alterations in various facets of form are interconnected and synchronized [16]. Consequently, unless there’s a clear genetic basis for a particular morphometric measure, using multivariate methods is recommended to accurately represent morphology [17]. A substantial proportion of the fluctuation within a collection of multivariate indicators is attributable to size [18,19,20]. Hence, shape analyses should be conducted independently of size to circumvent a potential misapprehension of findings [21]. A gamut of univariate and multivariate techniques, encompassing regression analysis and multiple group principal component analysis (MGPCA), may be engaged to negate the influence of size. Such allometric methodologies have been proven competent in facilitating the bifurcation of size and shape, thereby maintaining the integrity of statistical postulations [22].
The species Portunus sanguinolentus (Herbst, 1783), belonging to the family of swimming crabs, exhibits a substantial range across the Indo-West Pacific region, encompassing territories such as East Africa, Madagascar, the Red Sea, India, China, Japan, the Philippines, Thailand, Malaysia, Singapore, Indonesia, and Australia [23,24]. A multitude of previous investigations have delved into the population biology of swimming crabs [25,26,27,28]. Notwithstanding, within the domain of swimming crabs, the studies specifically focusing on P. sanguinolentus remain relatively scant [29,30].
Some research has explored various aspects of P. sanguinolentus, encompassing the areas of classification [23,24,31], maturation phases [32], reproductive biology [33,34], and embryogenesis [35]. The understanding of P. sanguinolentus populations in East Asian marine environments [36,37,38,39], nevertheless, remains insufficient. Furthermore, a decrease in the harvests of this economically significant crab has been observed in recent periods [40].
P. sanguinolentus, a relatively expansive portunid crab, has been found in varying sizes across different regions. This species plays a vital role in the trophic dynamics and biodiversity of coastal ecosystems, as well as in the livelihoods and food security of local communities that depend on its fisheries. However, despite its ecological and economic importance, comprehensive studies on P. sanguinolentus are scarce, especially in East and South Asia, where its populations have been declining due to overexploitation, habitat degradation, and climate change. Understanding the morphological variation and population structure of P. sanguinolentus in this region is crucial for developing effective conservation and management strategies that account for its genetic diversity and adaptive potential. However, morphological variation can be influenced by both genetic and environmental factors, making it challenging to infer population boundaries and evolutionary relationships based solely on morphometric measurements. Therefore, multivariate statistical techniques that can separate size and shape effects, as well as account for spatial and temporal variations, are needed to provide reliable insights into the population differentiation of this species. Such variations in sex ratios may be ascribed to disparities in mortality rates, sex-differentiated habitat preference, or potential unisexual migration [41,42,43,44,45,46]. The depth and specific physical characteristics of the sampling location could also affect the sex distribution of captured P. sanguinolentus, leading to the documented discrepancies in sex ratios. In alignment with other marine portunid species, female P. sanguinolentus are found to favor higher salinity environments compared to males and are frequently located in more profound depths [33]. During the reproductive season, egg-bearing females may also migrate to more shallow waters in pursuit of sandy terrain conducive to the egg extrusion process. Demographic attributes, inclusive of growth and mortality parameters, are imperative to the formulation of efficacious management strategies. Thus, the objective of the present research endeavor is to undertake a comparative analysis of size-independent morphological forms of distinct geographical populations of swimming crabs in the East China Sea and the South China Sea. The utilization of multivariate statistical methodologies will facilitate the explication of the population architecture of this particular species.

2. Materials and Methods

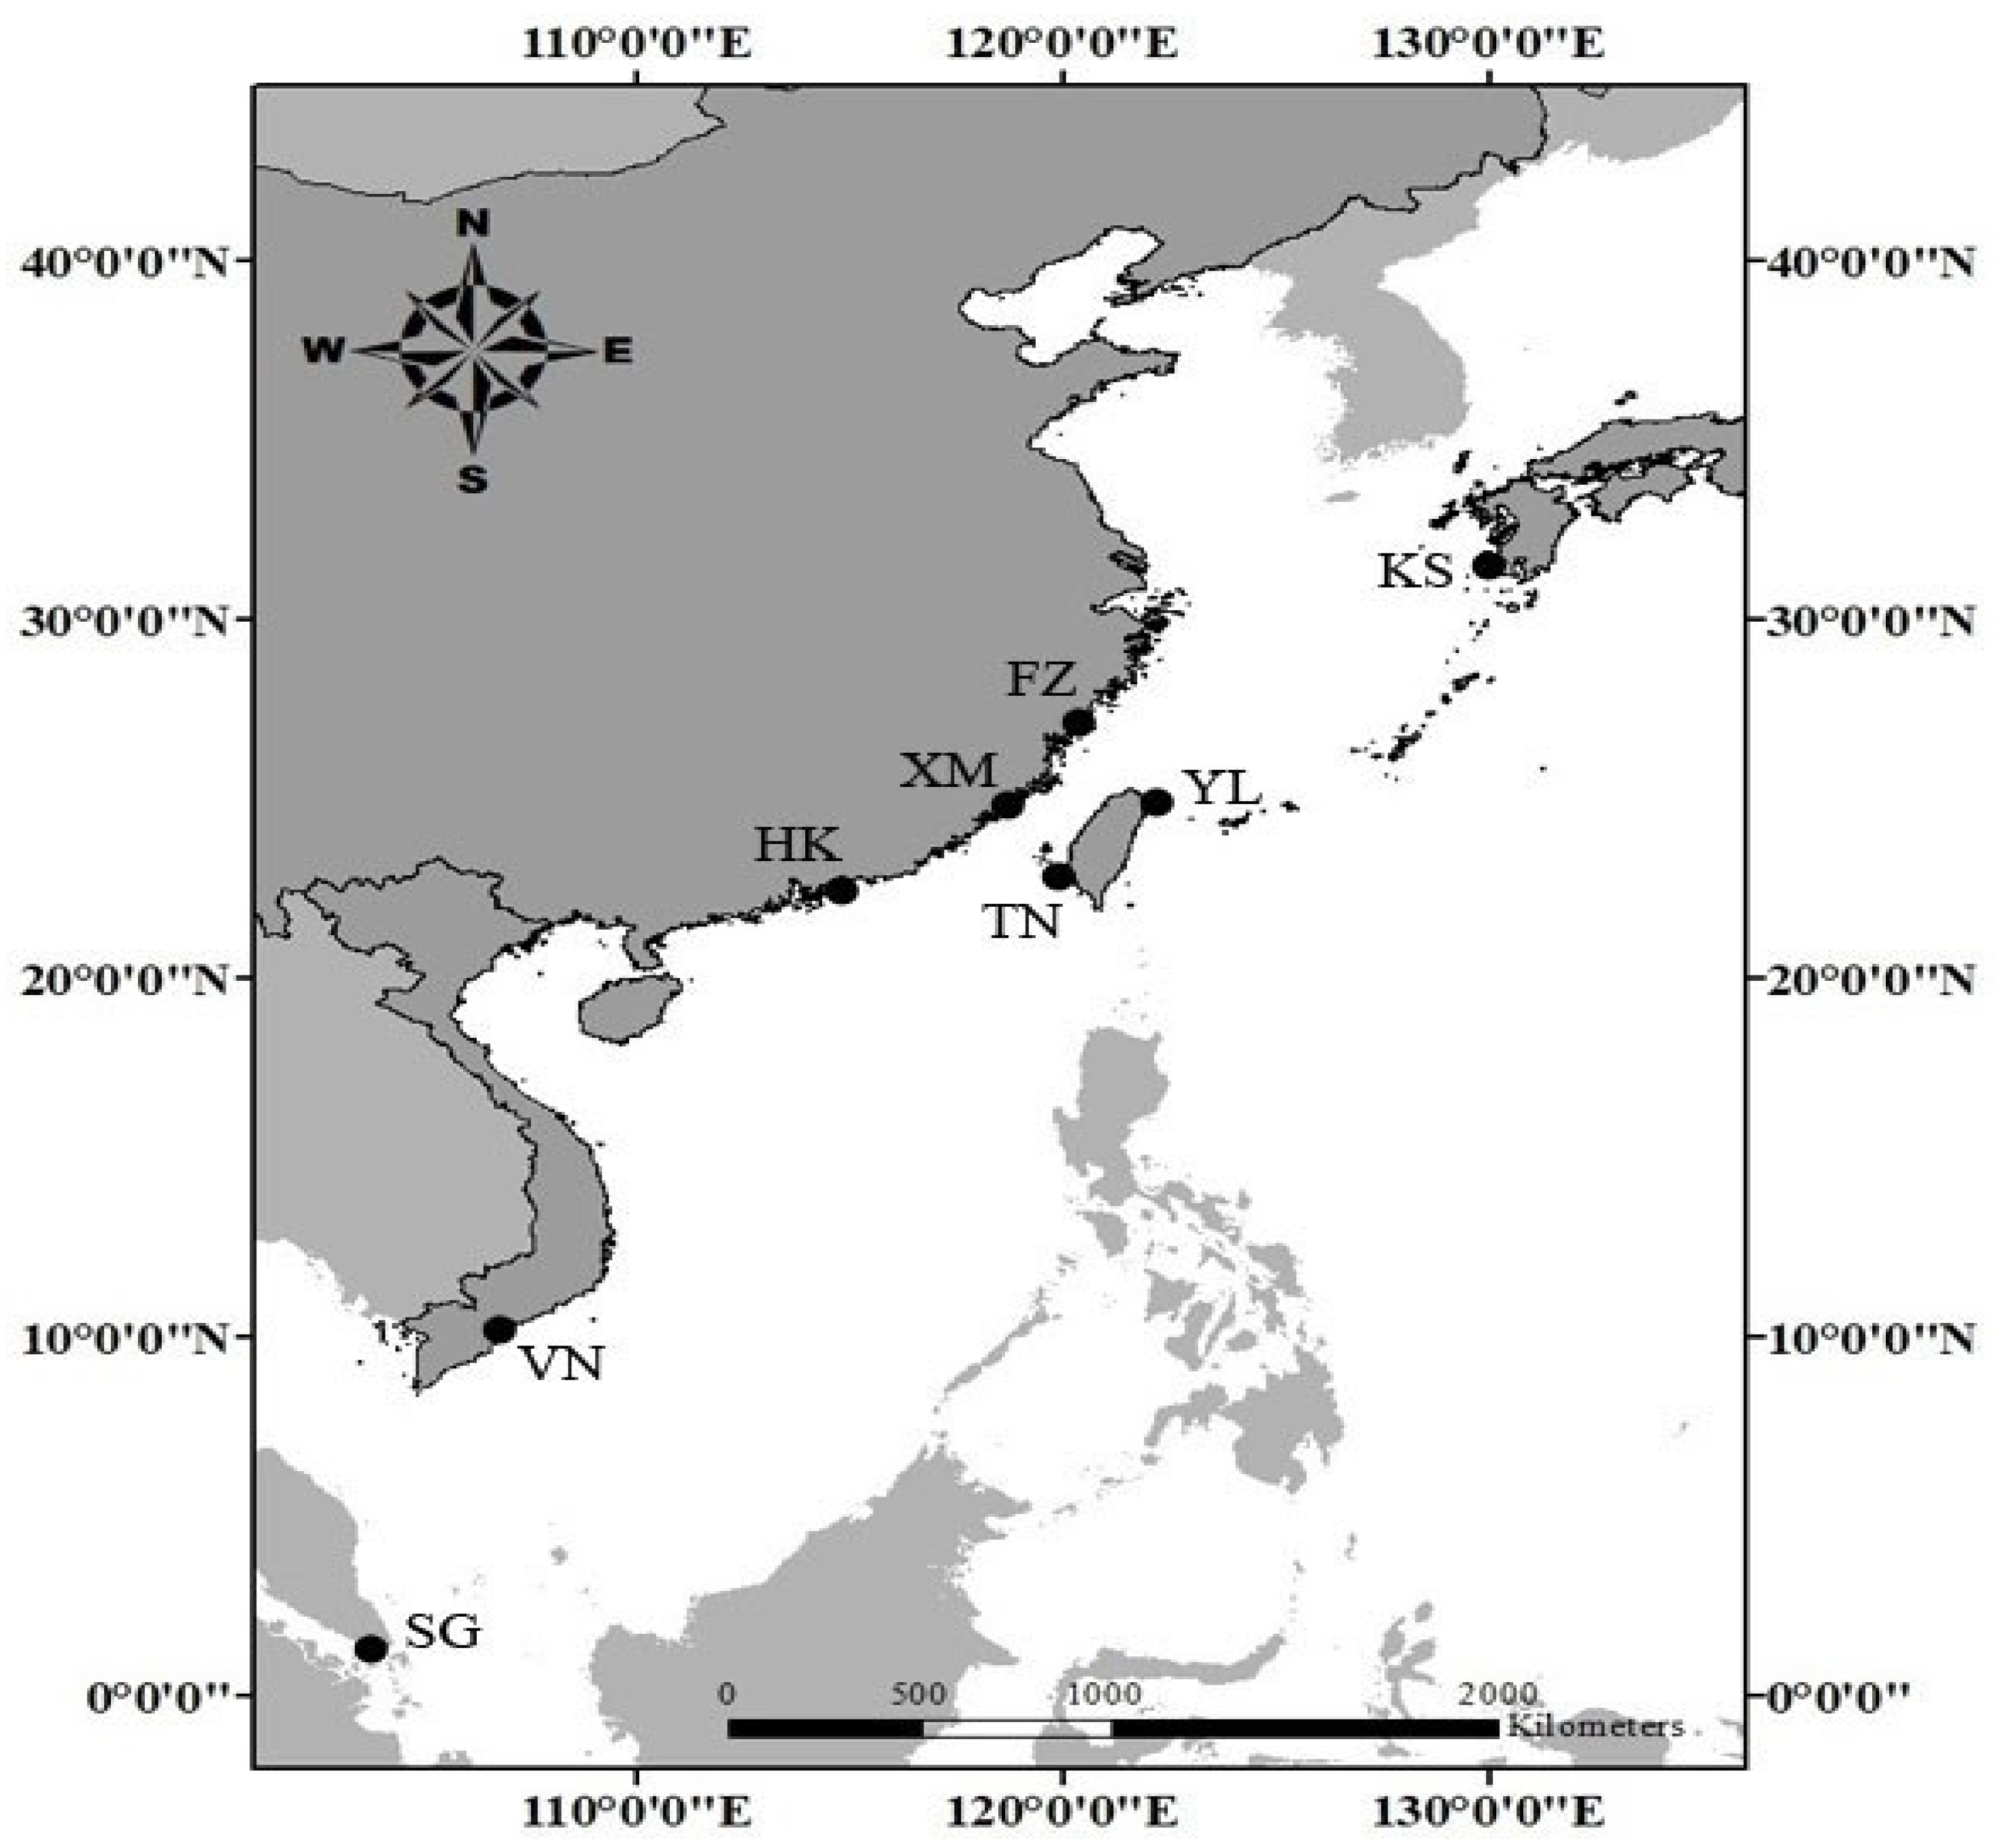
2.1. Sample Collection

Eight distinct samples were procured from varied geographical regions, encompassing Kyushu in Japan (KS), Fuzhou (FZ), Xiamen (XM), and Hong Kong (HK) in China, Yilan (YL) and Tainan (TN) in Taiwan, Hanoi in Vietnam (VN), and Singapore (SG), within the time frame extending from April 2020 to February 2022 (refer to Figure 1). The crab specimens were captured utilizing specialized cage traps, and subsequent to the retrieval, the sex of each specimen was meticulously ascertained, leading to the appropriate segregation of the individuals. All measurements were conducted under fresh conditions, maintaining the integrity of the specimens.
In the context of the present study, the ranges of carapace widths for the sampled specimens were confined to designated length classifications. An encompassing summary, detailing the sample size, designated sampling area codes, and the mean and range of the carapace lengths, is articulated in Table 1. Overall, this study involved precise measurements of 833 individual crabs, with each measurement rounded to the nearest 0.01 mm for accuracy.
A total of twelve morphometric parameters were systematically assessed for every individual crab (as illustrated in Figure 2). These parameters included the carapace width (CW), carapace length (CL), frontal teeth (CP1), right anterolateral margin (CP2), right posterolateral margin (CP3), posterior margin (CP4), left posterolateral margin (CP5), left anterolateral margin (CP6), the length of the 5th pleomere (AB3L), the right-side length of the 5th pleomere (AB3RL), the left-side length of the 5th pleomere (AB3LL), and the width of the 5th pleomere (AB3W) [47,48].

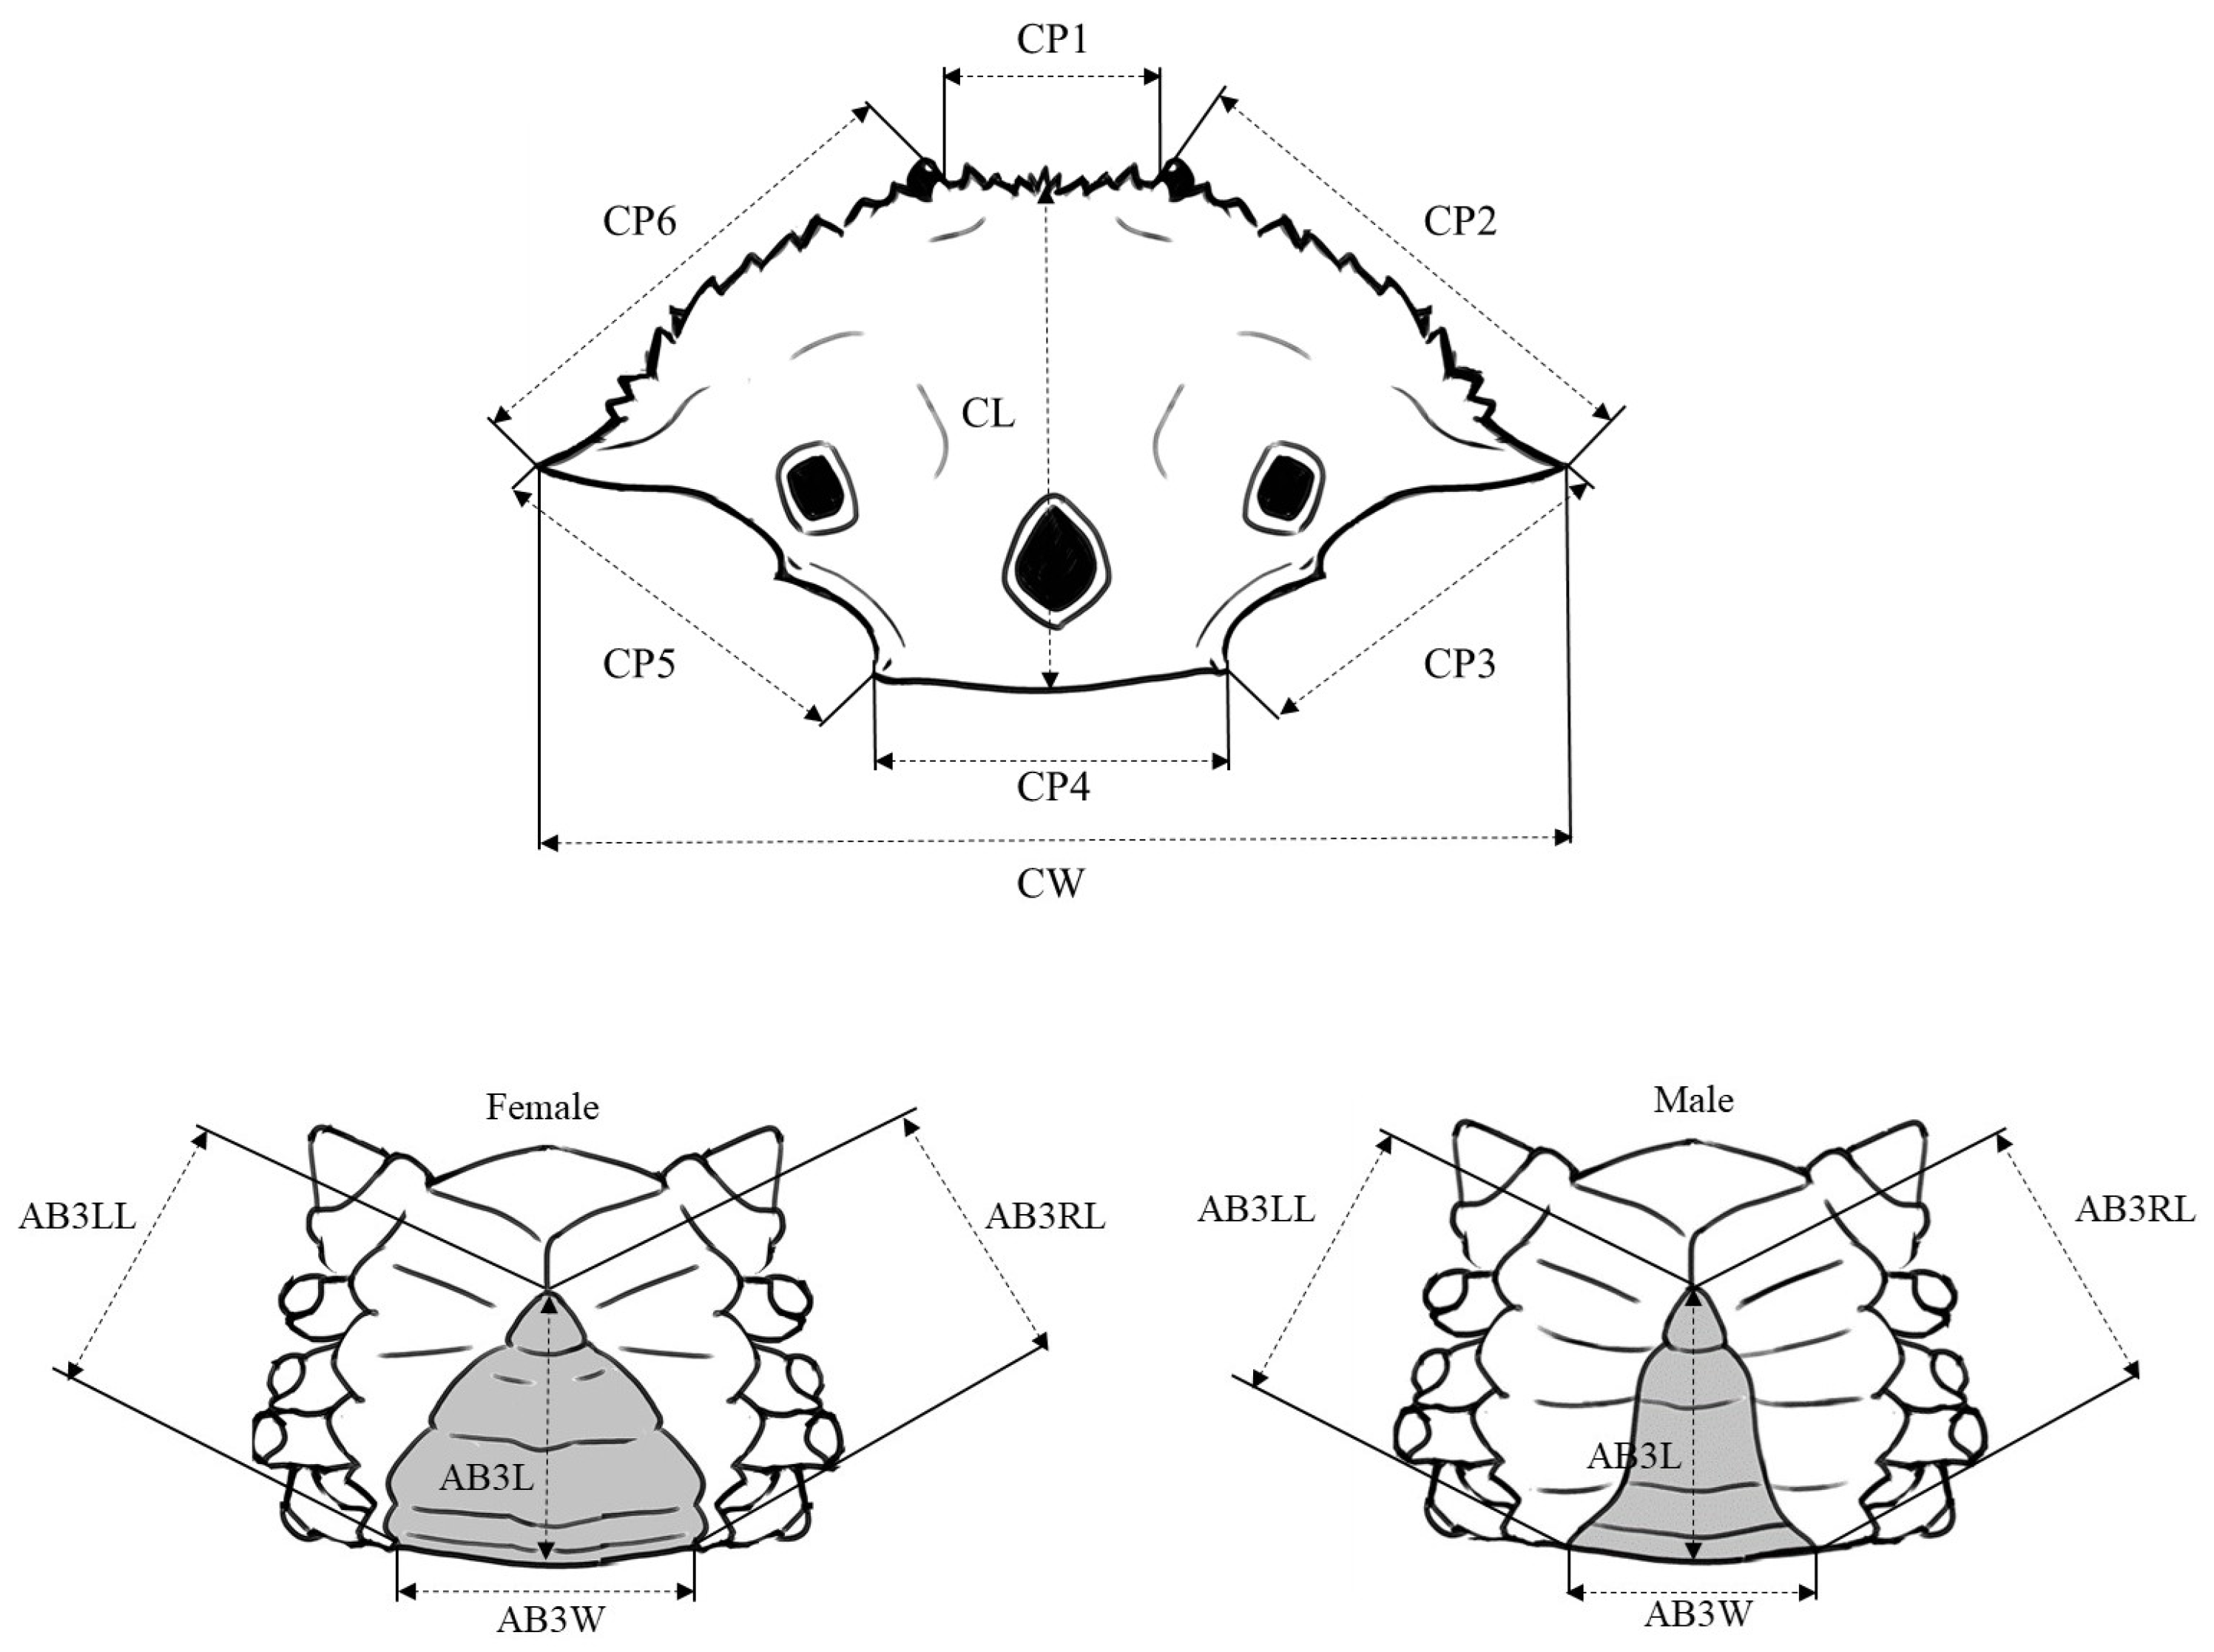
2.2. Morphometric Variation Analyses
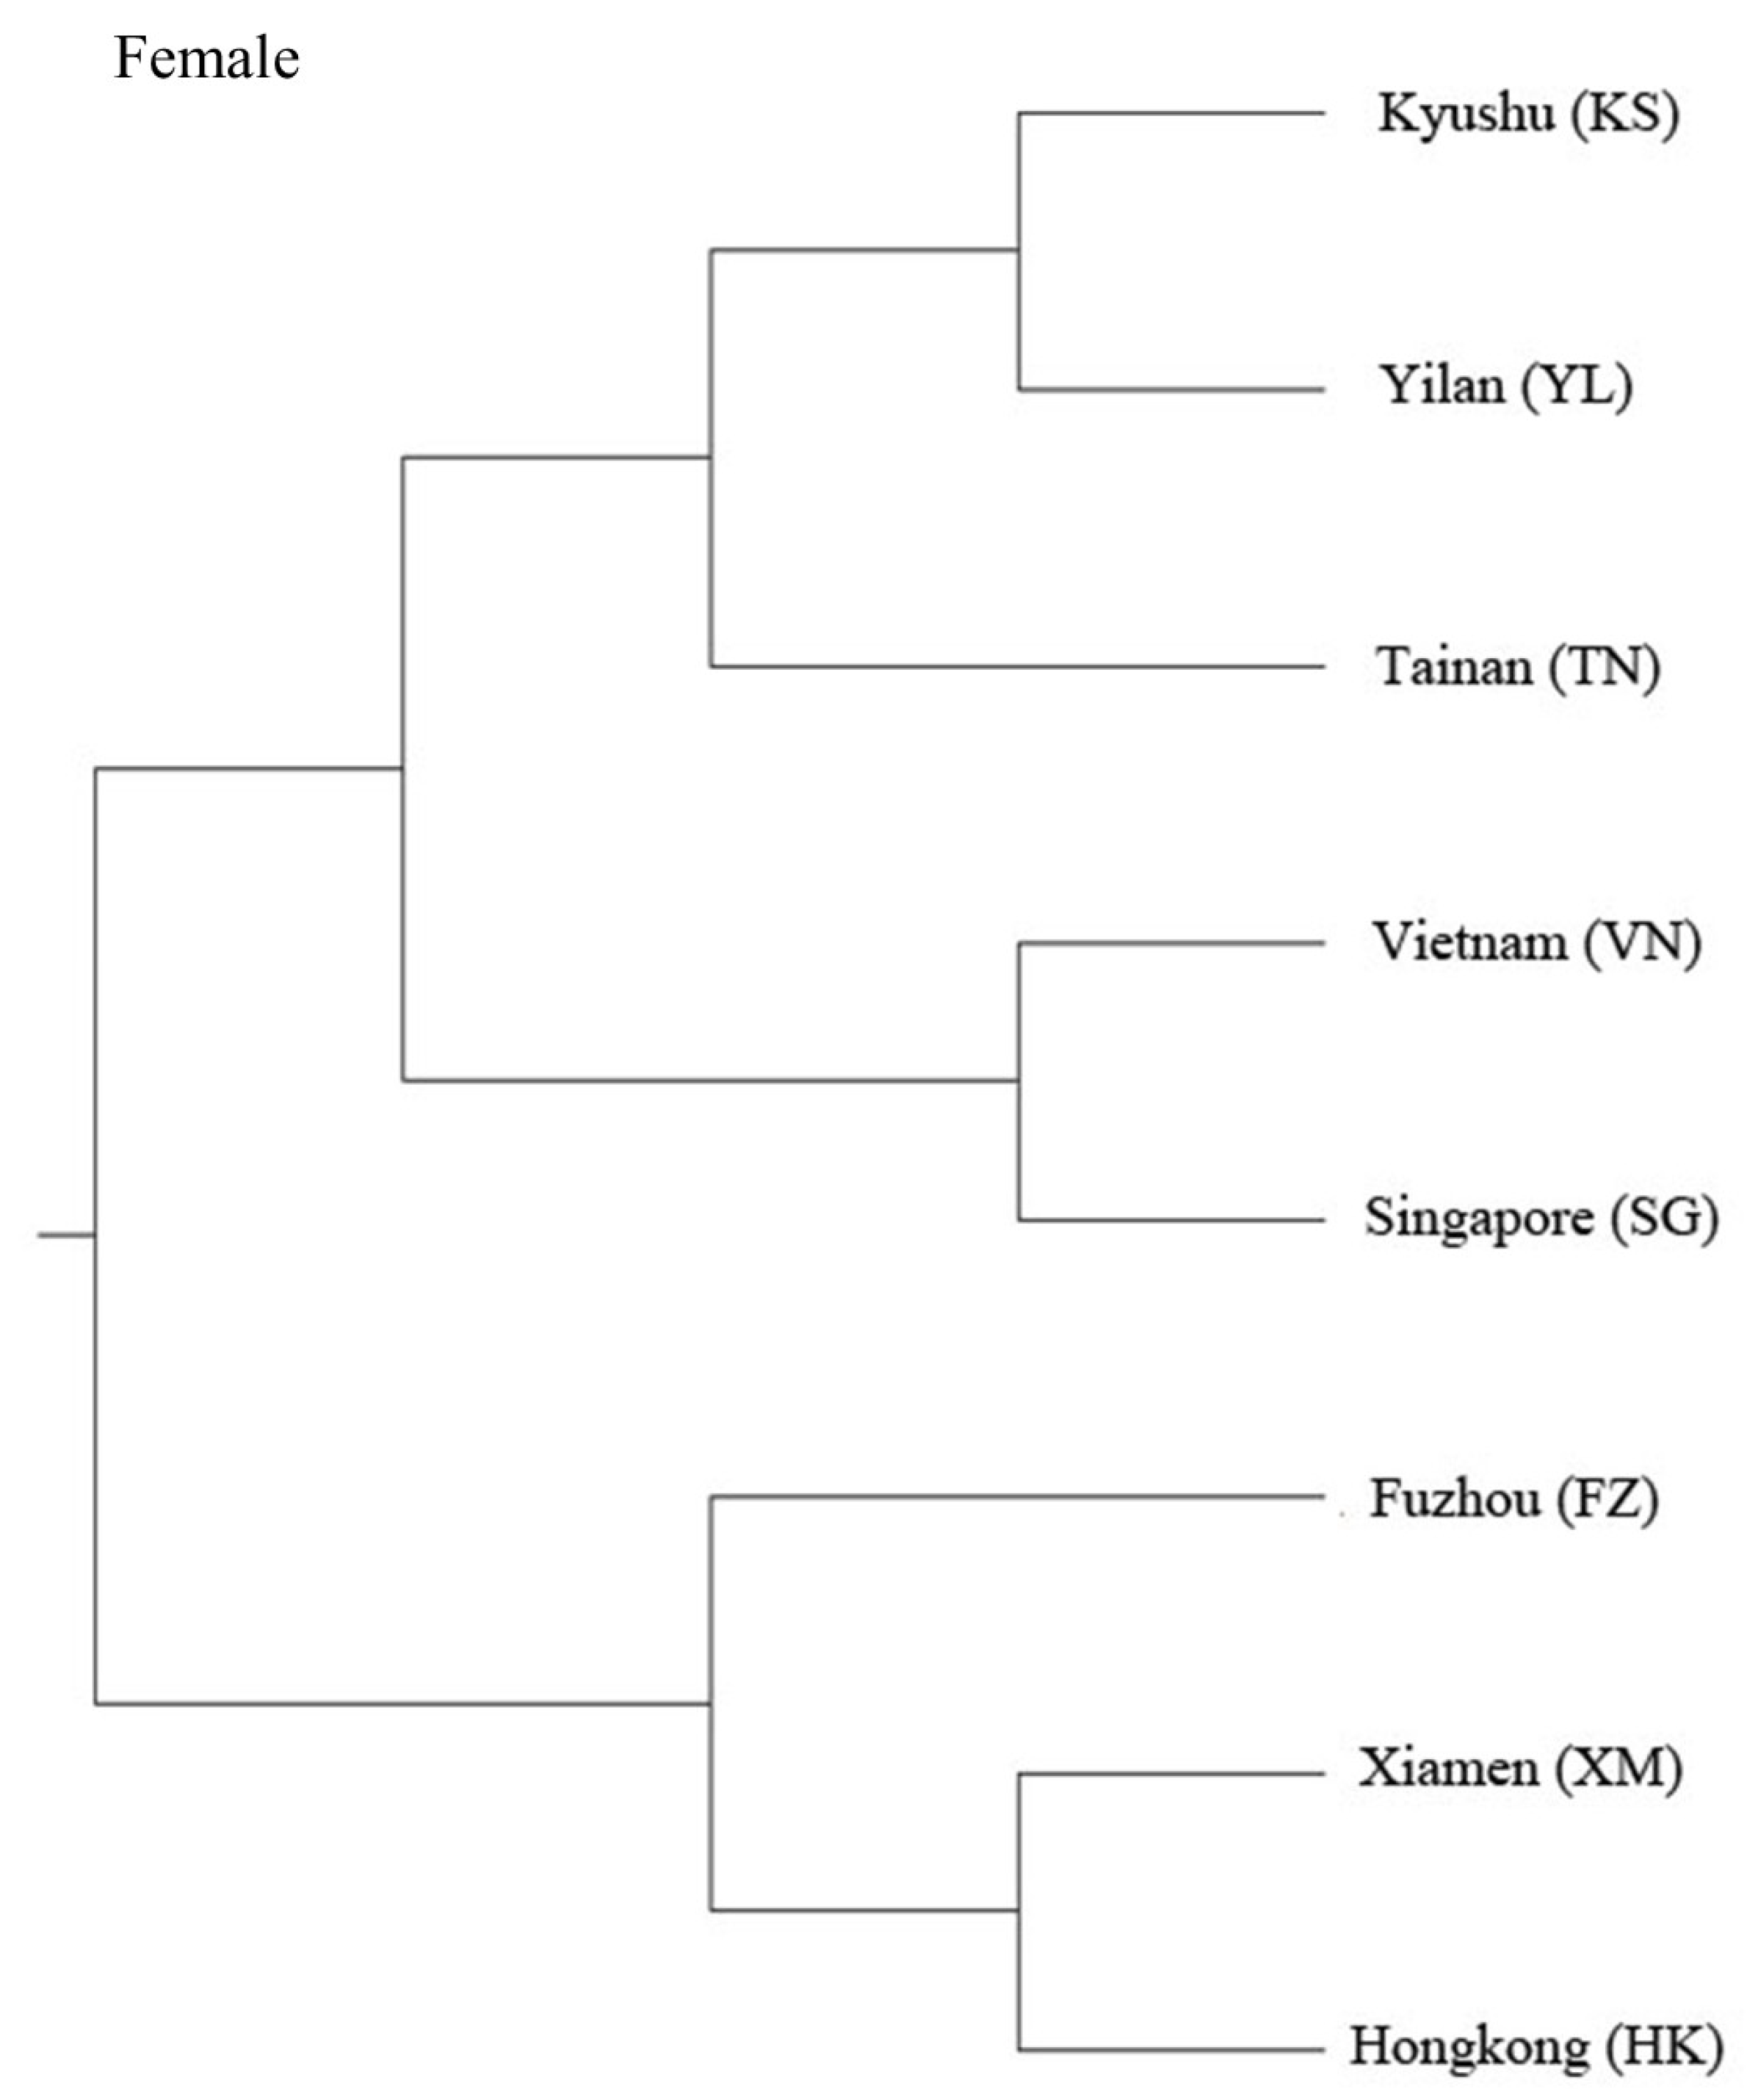
The allometric relationship, denoted by the equation Y = aXb, was employed to neutralize the influence of variations in carapace length (X) on the corresponding characteristic length (Y) within each individual sample [4,14,15,22,49,50]. In this equation, Y is the dependent variable, X is the independent variable (CW), a is the intercept on the y axis, and b is the regression coefficient (slope), which indicates the growth rate of the body part analyzed. This mathematical formulation serves to standardize all pertinent characteristics in accordance with Equation (1):
Y i * = Y i X i X ¯ b
where Y i * represents the standardized measured length of the ith specimen; Y i denotes the measured length of the ith specimen. Xi refers to the measured carapace length of the ith specimen, and X i ¯ represents the average value of the carapace lengths observed in the specimens analyzed. The correlation coefficients between each respective pair of characteristics were examined both prior and subsequent to the elimination of the size effect. In such a scenario, it is anticipated that the magnitude of the correlation coefficients would exhibit a reduction following the removal of the size effect [51]. Subsequent analyses employed both a canonical variate analysis (CVA) and the unweighted pair-group method with arithmetic means (UPGMA) on the resultant measurements. A hierarchical clustering analysis, culminating in a dendrogram encompassing eight specific samples, was meticulously executed employing the UPGMA. This approach incorporated the application of Mahalanobis distances ascertained between the centroids of various populations to facilitate a comprehensive evaluation of the similarity metrics underlying the samples in question [10,11,14,15,20,52,53]. The preference for the Mahalanobis distance as the metric of choice was justified by its inherent property of invariance with respect to discrepancies in variable scaling [54].
Furthermore, the canonical variate analysis (CVA)—a sophisticated linear ordination methodology—was systematically employed to enable distinction amongst the samples. The determination of the canonical vectors was predicated on the formulation of linear coefficients, ascertained through the maximization of the ratio juxtaposing inter-group to intra-group variance [10,11,14,15,20,55]. Subsequent to the execution of the CVA, a graphical representation was constructed by plotting the primary pair of canonical scores. This plot was further complemented with the illustration of 95% confidence ellipses, circumscribing the mean of each individual sample, thereby providing a visual affirmation of the confidence levels associated with the observed samples [3,4,55,56]. In order to assess the statistical significance pertaining to the morphometric disparities observed between different groups, elucidated through the application of the cluster analysis and canonical variate analysis (CVA), a methodical randomization test was conducted [6,56,57]. Within this process, all specimens were stochastically assigned to one of two distinctive groups. Subsequently, the newly constituted dataset was subjected to rigorous scrutiny utilizing a multivariate discriminant analysis, resulting in the estimation of the cross-validation estimator (Pc) [57]. This specific estimator quantifies the proportion of individuals that have been misclassified.
Resampling was executed iteratively, 5000 times in total, with each instance incorporating a unique random permutation in the analysis. The randomization test’s efficacy in evaluating the statistical significance of the misclassification rate was hinged on juxtaposing the proportion of misclassified individuals (Po) in the original dataset with the corresponding proportion (Pc) in each randomized dataset. The cumulative proportion (P) reflecting the observed Pc that was less than or equal to Po was subsequently computed. The resulting p-value offers interpretative alignment with conventional significance testing paradigms: a p-value less than 5% provides indicative evidence of significant morphometric differentiation between the two groups, while a p-value less than 1% furnishes robust evidence underscoring the statistical significance of the observed morphometric differences [57]. All analytical procedures encompassed within the present study were meticulously performed utilizing Statistical Analysis System software by SAS 9.4 [58].

3. Results

The intercorrelations existing between specific features, both prior and subsequent to the neutralization of size effects, are detailed in Table 2. The majority of these correlation coefficients manifested as highly significant prior to the attenuation of size effects, undergoing a marked reduction in significance following said removal. Consequently, it could be inferred that the dataset employed in subsequent analyses remained largely unimpacted by the aforementioned size effects. Hierarchical clustering representations, delineated by dendrograms for both female and male categories across the eight samples, are depicted in Figure 3 and Figure 4. The clustering patterns elucidated for females and males were found to be strikingly congruent. Specifically, the clustering process culminated in the bifurcation of the eight samples into two distinct clusters. The first cluster encapsulated all the samples originating from the Kuroshio groups, denoted as KS, YL, TN, VN, and SG. Conversely, the second cluster comprised samples from the China groups, namely, FZ, XM, and HK. Further subdivision within the Kuroshio groups revealed the emergence of subgroups, notably including VN and SG. This analytical framework, therefore, enabled the identification of no fewer than two distinct clusters amongst the eight sampled groups. Regarding the canonical variate analysis (CVA) for each gender, the primary and secondary eigenvectors, along with the corresponding proportions of total variance elucidated by the first two eigenvalues, are systematically tabulated in Table 3. The abdomen growth rates (slope = b) differed among females of the two populations. The results of this study show that, in East Asia populations, the abdomen growth rates of the females in the Kuroshio groups (b = 1.76) and mainland China groups (b = 1.59) were greater than those of the males; among the Kuroshio groups, the rate observed in the Kuroshio subgroup was b = 1.71 for adult females (p < 0.001).
An overwhelming majority of the total variance was attributable to the first two canonical variables for both the females and males. Specifically, the initial eigenvalue elucidated 60% and 53% of the cumulative variance for the females and males, respectively, while the subsequent eigenvalue accounted for 22% and 27% of the total variance for the respective genders. Measurements of paramount importance in the first and second eigenvectors were characterized by CP1 (0.94) and AB3RL (0.94), and AB3W (0.96) and AB3LL (0.92) for the females and males, respectively.
A graphical representation delineating 95% confidence ellipses encircling the means of the first two canonical scores for both genders is presented in Figure 5. The analytical outcomes for both the females and males were markedly analogous, leading to the clustering of the eight samples into no fewer than two distinct groups. The Kuroshio group incorporated five samples, specifically KS, YL, TN, VN, and SG, while the China group encompassed three samples, namely FZ, XM, and HK. Subsequent to the comprehensive cluster analysis and CVA, the specimens originating from the KS, YL, TN, VN, and SG samples (collectively referred to as the Kuroshio group, KG) and those from the FZ, XM, and HK samples (collectively designated as the mainland China group, MCG) were separately aggregated into two discrete datasets for each gender. This synthesis facilitated a more granular exploration of the underlying patterns and relationships within the data.
The Po values between the mainland China groups and the Kuroshio groups, and between the mainland China groups and the Southeast Asia groups for females were 0.11 and 0.16, respectively (Figure 6a–c). The Po values between the mainland China groups and the Kuroshio groups, and between the mainland China groups and the Southeast Asia groups for males were 0.01 and 0.05, respectively (Figure 6d–f). The results of the randomization tests all yielded a significant outcome (p = 0), suggesting that the exceptionally low misclassification rates were unlikely to be solely attributed to chance. Furthermore, the observed morphometric differences among the three groups were found to be significant.

4. Discussion

In this research, the first eigenvalues explained a diverse variance. This significant proportion of variance accounted for by the first eigenvalues emphasizes the compatibility of the multivariate allometry model with our dataset, referencing [59]. While allometric analyses shed light on evolutionary alterations in growth trajectories and character covariation patterns [60], their capacity to discern genetic variations among populations is perceived as less potent than shape analyses [61]. Nonetheless, allometry’s heritability is comparable to shape [62], suggesting that insights from allometric and shape analyses might be congruent. Such comparisons can, therefore, offer additional perspectives on population structure. However, one must be cautious, given that both genetic and environmental elements influence growth [63], making it challenging to attribute allometric patterns exclusively to heterochronic processes [60]. Morphometric research offers valuable perspectives into marine stock differentiation [2]. Yet, morphometric variations can stem from both genetic and environmental factors [53], potentially indicating genetic divergences between stocks or environmental discrepancies across sites. While [64] contends that genetic evidence should validate stock identification based on morphometrics, ref. [65] advocates for morphometric-based discrimination in fisheries management, even in the absence of genetic underpinnings. The randomization test outcomes firmly reject the proposition that the notably low misclassification rate in the initial dataset arose purely from stochastic anomalies. These results underscore the improbability of such a rate emerging randomly, unveiling pronounced morphological disparities among three identified groups. Historically, populations within species have been gauged through morphological metrics [7,8,9,10,66]. Aligning with this principle, our findings strongly indicate the existence of three distinct P. sanguinolentus populations in East and South Asia, distinguished morphologically.
In marine population assessments, morphological evaluations are instrumental in discerning between groups. Yet, challenges such as sexual dimorphism, sampling intervals, and allometric growth can introduce complexities [2,7,8,9,10,11]. This investigation took rigorous measures to address these variabilities, standardizing size, synchronizing sample collections, and introducing gender-based statistical assessments. While the emphasis on specific length ranges could potentially neglect intrinsic variations [67], the consistent carapace lengths across samples rendered this limitation inconsequential. It’s imperative to adjust for size dependencies in morphological studies, ensuring accurate conclusions [6,10,14,66,67,68,69]. While this research adeptly addressed size discrepancies through allometric transformations, enhancing the credibility of our findings, it is imperative to acknowledge certain limitations. Notably, the study lacked molecular analyses, and samples were procured during a single sampling event for each locality, among other potential constraints.
Lastly, marine currents play a cardinal role in species distribution [70]. Specifically, the Kuroshio Current, with its branches permeating the Taiwan Strait and flowing towards Japan, dictates the aquatic environment in sampled areas. These regions bear the signature of the interplay between Kuroshio and South China Sea water masses, emphasizing the intricate factors governing marine species distribution and diversification in these locales. The mixing of distinct water masses likely creates environmental heterogeneity that could drive localized adaptation. Elucidating genetic connectivity and barriers between populations inhabiting areas influenced by different currents could reveal key insights into how marine dynamics shape genetic structure. Furthermore, examining morphological variation along current-mediated environmental gradients could uncover patterns linked to selection pressures. A detailed understanding of how circulation features like the Kuroshio Current impact population differentiation will be integral to unraveling the drivers of biodiversity across this species’ range.

5. Conclusions

The exploration into the morphometric variations in P. sanguinolentus has indeed unraveled intricate details about its stock structure in the East Asia region. The multi-variate statistical techniques employed have unearthed layers of differentiation, leading to the identification of diverse stocks and subgroups. This variation suggests that, over time, distinct ecological niches, coupled with evolutionary pressures, have given rise to the present-day morphological divergences. A striking takeaway from this research is the undeniable influence of marine currents in the shaping and maintenance of these variations, acting as barriers to or facilitators of genetic flow. The marked distinction between the Kuroshio (KG) and mainland China (MCG) samples underlines the importance of understanding regional marine dynamics in species distribution studies. Furthermore, the pronounced disparities within the Kuroshio groups, especially between SG and VN specimens, raise queries about possible micro-environmental adaptations or historically separated lineages. The profound differences highlighted between subgroups could also suggest a response to local environmental pressures, such as specific prey availability, predator evasion tactics, or reproductive strategies tailored to different habitat niches. Therefore, while this study has illuminated a portion of the intricate tapestry of P. sanguinolentus’ population structure, it inevitably raises additional questions regarding the multifaceted interactions of genetics, environment, and evolution. In light of these findings, future research should delve deeper into the genomic landscape of these populations, employing cutting-edge molecular techniques. This endeavor will not only refine the intricacies of morphological variations but will also offer insights into adaptive strategies, enhancing conservation and sustainable management efforts for P. sanguinolentus in the region. Further studies could examine gene flow between populations and reconstruct phylogenetic relationships to better understand the evolutionary history of this species across its range. Analyses of genetic diversity within and between populations could reveal patterns related to environmental adaptation and connectivity.

Author Contributions

Conceptualization, W.-C.K., P.-H.C., C.-H.S., P.-C.C., T.-D.T., Y.-S.H. and Y.-M.L.; methodology, W.-C.K., C.-H.S., P.-C.C. and T.-D.T.; software, W.-C.K., C.-H.S. and P.-C.C.; validation, W.-C.K., C.-H.S., P.-C.C., Y.-S.H. and T.-D.T.; formal analysis, W.-C.K., C.-H.S., P.-C.C., Y.-S.H. and T.-D.T.; investigation, W.-C.K., C.-H.S., P.-C.C. and Y.-S.H.; resources, W.-C.K., C.-H.S. and P.-C.C.; data curation, W.-C.K., C.-H.S. and P.-C.C.; writing—original draft preparation, W.-C.K., C.-H.S. and P.-C.C.; writing—review and editing, W.-C.K., C.-H.S. and Y.-S.H.; visualization, W.-C.K., C.-H.S. and P.-C.C.; supervision, W.-C.K., C.-H.S., P.-C.C. and T.-D.T.; project administration, W.-C.K., C.-H.S., P.-C.C. and T.-D.T.; funding acquisition, W.-C.K., C.-H.S., P.-C.C. and T.-D.T. All authors have read and agreed to the published version of the manuscript.

Funding

This work was supported by the National Science and Technology Council: NSTC 107-2221-E-236-002, and MOST 111-2313-B-002-016-MY3. The funders had no role in study design, data collection and analysis, decision to publish, or preparation of the manuscript.

Data Availability Statement

Not applicable.

Acknowledgments

We thank the Global Institute for Green Tourism, University of California, Berkeley, for supporting the cruises of the biological survey. We would also like to thank the anonymous reviewers, whose useful suggestions were incorporated into the manuscript.

Conflicts of Interest

The authors declare no conflict of interest.

References

  1. Grimes, C.B.; Johnson, A.G.; Fable, W.A. Delineation of king mackerel (Scomberomorus cavalla) stocks along the US east coast and in the Gulf of Mexico. In Proceedings of the Stock Identification Workshop, Panama City Beach, FL, USA, 5–7 November 1985; Kumpf, H.E., Vaught, R.N., Grimes, C.B., Johnson, A.G., Nakamura, E.L., Eds.; NOAA Technical Memorandum NMFS-SEFC-199; United States Government Printing Office: Hartford, CT, USA, 1987; pp. 186–187. [Google Scholar]
  2. Kinsey, S.T.; Orsoy, T.; Bert, T.M.; Mahmoudi, B. Population structure of the Spanish sardine Sardinella aurita: Natural morphological variation in a genetically homogenous population. Mar. Biol. 1994, 118, 309–317. [Google Scholar] [CrossRef]
  3. Tzeng, C.S. Distribution of the freshwater fishes of Taiwan. J. Taiwan Mus. 1986, 39, 127–146. [Google Scholar]
  4. Tzeng, T.D.; Chiu, C.S.; Yeh, S.Y. Comparison of multivariate allometric coefficients in red-spot prawn (Metapenosis barbata) from adjacent waters off Taiwan. J. Taiwan Mus. 1998, 25, 85–92. [Google Scholar]
  5. Begg, G.A.; Friedland, K.D.; Pearce, J.B. Stock identification and its role in stock assessment and fisheries management: An overview. Fish. Res. 1999, 43, 1–8. [Google Scholar] [CrossRef]
  6. Tzeng, T.D.; Yeh, S.Y. Permutation tests for difference between two multivariate allometric patterns. Zool. Stud. 1999, 38, 10–18. [Google Scholar]
  7. Giri, F.; Collins, P.A. A geometric morphometric analysis of two sympatric species of the family Aeglidae (Crustacea, Decapoda, Anomura) from the La Plata basin. J. Zool. 2004, 71, 85–88. [Google Scholar] [CrossRef]
  8. Collins, P.A.; Williner, V.; Giri, F. Littoral communities: Macrocrustaceans. In The Middle Parana River, Limnology of a Subtropical Wetland; Iriondo, M.H., Paggi, J.C., Parma, M.J., Eds.; Springer: Berlin, Germany, 2007; pp. 277–302. [Google Scholar]
  9. Giri, F.; Loy, A. Size and shape variation of two freshwater crabs in Argentinean Patagonia: The influence of sexual dimorphism, habitat, and species interactions. J. Crustac. Biol. 2008, 28, 37–45. [Google Scholar] [CrossRef]
  10. Torres, M.V.; Giri, F.; Collins, P.A. Geometric morphometric analysis of the freshwater prawn Macrobrachium borellii (Decapoda: Palaemonidae) at a microgeographical scale in a floodplain system. Ecol. Res. 2014, 29, 959–968. [Google Scholar] [CrossRef]
  11. Pacheco, C.; Cusba, J.; Paramo, J.; Queirolo, D.; Pérez, D. Spatial structure and morphometric relationships of the deep-sea shrimp Solenocera acuminata (Decapoda, Solenoceridae) in the Colombian Caribbean. ZooKeys 2021, 1040, 1–24. [Google Scholar] [CrossRef]
  12. Kotlik, P.; Berrebi, P. Phylogeography of the barbel (Barbus barbus) assessed by mitochondrial DNA variation. Mol. Ecol. 2001, 10, 2177–2185. [Google Scholar] [CrossRef]
  13. Hellberg, M.E. Dependence of gene flow on geographic distance in two solitary corals with different larval dispersal capabilities. Evolution 1996, 50, 1167–1175. [Google Scholar] [CrossRef] [PubMed]
  14. Tzeng, T.D. Stock identification of sword prawn Parapenaeopsis hardwickii in the East China Sea and Taiwan Strait inferred by morphometric variation. Fish. Sci. 2004, 70, 758–764. [Google Scholar] [CrossRef]
  15. Chen, P.C.; Tzeng, T.D.; Shih, C.H.; Chu, T.J.; Lee, Y.C. Morphometric variation of the oriental river prawn (Macrobrachium nipponense) in Taiwan. Limnologica 2015, 52, 51–58. [Google Scholar] [CrossRef]
  16. Zelditch, M.L.; Bookstein, F.L.; Lundrigan, B.L. Ontogeny of integrated skull growth in the cotton rat Sigmodon fulviventer. Evolution 1992, 46, 1164–1180. [Google Scholar] [CrossRef]
  17. Thorpe, R.S.; Leamy, L. Morphometric studies in inbred and hybrid House Mice (Mus sp.): Multivariate analysis of size and shape. J. Zool. 1983, 199, 421–432. [Google Scholar] [CrossRef]
  18. Junquera, S.; Perez-Gandaras, G. Population diversity in Bay of Biscay anchovy (Engraulis encrasicolus L. 1785) as revealed by multivariate analysis of morphometric and meristic characters. ICES J. Mar. Sci. 1993, 50, 383–391. [Google Scholar] [CrossRef]
  19. Anastasiadou, C.; Liasko, R.; Leonardos, I.D. Biometric analysis of lacustrine and river inepopulations of Palemonetes antennarius (H. Milne-Edwards, 1837) (Crustacea, Decapoda, Palaemonidae) from north-western Greece. Limnologica 2009, 39, 244–254. [Google Scholar] [CrossRef]
  20. De Barros, M.S.F.; de Oliveira, C.D.L.; Pinto, T.K.; da Mata-Oliveira, I.; Fabré, N.N.; da Silva Batista, V. Assessment of the stock status of two penaeid shrimps in the Northeastern Brazil Marine Ecoregion and implications for their management. Reg. Stud. Mar. Sci. 2021, 48, 102046. [Google Scholar] [CrossRef]
  21. Strauss, R.E. Evolutionary allometry and variation in hody form in the South American catfish genus Cotydoras (Callichthyidae). Syst. Zool. 1985, 34, 381–396. [Google Scholar] [CrossRef]
  22. Reist, J. An empirical evaluation of several univariate methods that adjust for size variation in morphometric data. Can. J. Zool. 1985, 63, 1429–1439. [Google Scholar] [CrossRef]
  23. Stephenson, W.; Campbell, B. The Australian portunids (Crustacea: Portunidae). III. The genus Portunus. Mar. Freshw. Res. 1959, 10, 84–123. [Google Scholar] [CrossRef]
  24. Dai, A.Y.; Yang, S.L. Crabs of the China Seas; China Ocean Press: Beijing, China, 1991; pp. 4–682. [Google Scholar]
  25. Zafar, M.; Amin, S.M.N.; Rahman, M.M. Population dynamics of mud crab (Scylla serrata) in the Southern coastal region of Bangladesh. Asian Fish. Sci. 2006, 19, 43–50. [Google Scholar]
  26. Josileen, J.; Menon, N.G. Fishery and growth parameters of the blue swimmer crab Portunus pelagicus (Linnaeus, 1758) along the Mandapam coast, India. J. Mar. Biol. Assoc. India 2007, 49, 159–165. [Google Scholar]
  27. Sara, L.; Ingles, J.A.; Aguilar, R.O.; Laureta, L.V.; Baldevarona, R.B.; Watanabe, S. Abundance and Distribution Patterns of Scylla spp. Larvae in the Lewele Bay, Southeast Sulawesi, Indonesia. Asian Fish. Sci. 2006, 19, 331. [Google Scholar]
  28. Türeli, C.; Miller, T.J.; Gündogdu, S.; Yesilyurt, I.N. Growth and mortality of blue crab (Callinectes sapidus) in the North-Eastern Mediterranean Sea. J. FisheriesSciences.com 2016, 10, 55–62. [Google Scholar]
  29. Mantelatto, F.L.M.; Garcia, R.B. Biological aspects of the nonindigenous portunid crab Charybdis hellerii in the western tropical south Atlantic. Bull. Mar. Sci. 2001, 68, 469–477. [Google Scholar]
  30. Yeşilyurt, İ.N.; Türeli, C.; Gündoğdu, S. Growth parameters of the invasive blue swimming crab Portunus segnis (Forskål, 1775) (Crustacean) in the North-Eastern Mediterranean, Türkiye. Aquat. Res. 2022, 5, 285–294. [Google Scholar] [CrossRef]
  31. Chhapgar, B.F. On the marine crabs (Decapoda: Brachyura) of Bombay state. J. Bombay Nat. Hist. Soc. 1957, 54, 399–439. [Google Scholar]
  32. Sumpton, W.D.; Smith, G.S.; Potter, M.A. Notes on the biology of the portunid crab, Portunus sanguinolentus (Herbst), in subtropical queensland waters. Mar. Freshw. Res. 1989, 40, 711–717. [Google Scholar] [CrossRef]
  33. Campbell, G.R.; Fielder, D.R. Size at sexual maturity band occurrence of ovigerous females in three species of commercially exploited portunid crabs in S.E. Qld. Proc. R. Soc. Qld. 1986, 97, 79–87. [Google Scholar]
  34. Rasheed, S.; Mustaquim, J. Size at sexual maturity, breeding season and fecundity of three-spot swimming crab Portunus sanguinolentus (Herbst, 1783) (Decapoda, Brachyura, Portunidae) occurring in the coastal waters of Karachi, Pakistan. Fish. Res. 2010, 103, 56–62. [Google Scholar] [CrossRef]
  35. Samuel, N.J.; Soundarapandian, P. Embryonic development of commercially important portunid crab Portuns sanguinolentus (Herbst). Int. J. Anim. Vet. Adv. 2009, 1, 32–38. [Google Scholar]
  36. Huang, R.F. Studies on the Taxonomy and Distribution of the Portunid Crabs (Crustacea: Decapoda: Brachyura) in Taiwan. Ph.D. Dissertation, National Taiwan Ocean University, Keelung, Taiwan, 1993; p. 235. (In Chinese). [Google Scholar]
  37. Ye, S.Z. Fisheries biology of red spot swimming crab, Portunus sanguinolentus, on the Minnan-Taiwan bank fishing ground. Mar. Fish. 1998, 20, 60–63. (In Chinese) [Google Scholar]
  38. Hsu, C.C.; Chang, H.C.; Liu, H.C. Sex-variant morphometrics of the swimming crab, Portunus sanguinolentus (Herbst), from the waters off Northern Taiwan. J. Taiwan Fish. Res. 2000, 27, 175–185. [Google Scholar]
  39. Lee, H.H.; Hsu, C.C. Population biology of the swimming crab Portunus sanguinolentus in the waters off northern Taiwan. J. Crust. Biol. 2003, 23, 691–699. [Google Scholar] [CrossRef]
  40. Soundarapandian, P.; Varadharajan, D.; Boopathi, A. Reproductive biology of the commercially important portunid crab, Portunus sanguinolentus (Herbst). J. Mar. Sci. Res. Dev. 2013, 3, 2–9. [Google Scholar]
  41. Yang, C.P.; Li, H.X.; Li, L.; Xu, J.; Yan, Y. Population Structure, Morphometric Analysis and Reproductive Biology of Portunus Sanguinolentus (Decapoda: Brachyura: Portunidae) in Honghai Bay, South China Sea. J. Crustac. Biol. 2014, 34, 722–730. [Google Scholar] [CrossRef]
  42. Wimalasiri, H.B.U.G.M.; Dissanayake, D.C.T. Reproductive biology of the three-spot swimming crab (Portunus sanguinolentus) from the west coast of Sri Lanka with a novel approach to determine the maturity stage of male gonads. Invertebr. Reprod. Dev. 2016, 60, 243–253. [Google Scholar] [CrossRef]
  43. Wenner, A.M. Sex ratio as a function of size in marine Crustacea. Am. Nat. 1972, 106, 32–50. [Google Scholar] [CrossRef]
  44. Dineshbabu, A.P.; Sreedhara, B.; Muniyappa, Y. Fishery and stock assessment of Portunus sanguinolentus (Herbst) from south Karnataka coast, India. J. Mar. Biol. Assoc. India 2007, 49, 134–140. [Google Scholar]
  45. Sarada, P.T. Crab fishery of the Calicut coast with some aspects of the population characteristics of Portunus sanguinolentus, P. pelagicus and Charybdis cruciata. Indian J. Fish. 1998, 45, 375–386. [Google Scholar]
  46. Pillai, S.L.; Thirumilu, P. Fishery, biology and yield estimates of Portunus sanguinolentus off Chennai. J. Mar. Biol. Assess. 2012, 54, 73–76. [Google Scholar]
  47. Sumpton, W.D. Morphometric growth and fisheries biology of the crab, Charybdis natator (Herbst) in Moreton Bay, Australia (Decapoda, Brachyura). Crustaceana 1990, 59, 113–120. [Google Scholar] [CrossRef]
  48. Ya, Y.S. Morphometric Studies on Stock Discrimination of Swimming Crab (Charybdis feriatus) in the Offshore Areas of Taiwan. Master’s Thesis, Institute of Oceanography, National Taiwan University, Taipei, Taiwan, 2003; p. 56. (In Chinese). [Google Scholar]
  49. Tudela, S. Morphological variability in a Mediterranean, genetically homogeneous population of the European anchovy, Engraulis encrasicolus. Fish. Res. 1999, 42, 229–243. [Google Scholar] [CrossRef]
  50. Paramo, J.; Saint-Paul, U. Morphological differentiation of southern pink shrimp Farfantepenaeus notialis in Colombian Caribbean Sea. Aquat. Living Resour. 2010, 23, 95–101. [Google Scholar] [CrossRef]
  51. Murta, A.G. Morphological variation of horse mackerel (Trachurus trachurus) in the Iberian and North African Atlantic: Implications for stock identification. ICES J. Mar. Sci. 2000, 57, 1240–1248. [Google Scholar] [CrossRef]
  52. Sneath, P.H.A.; Sokal, R.R. Numerical Taxonomy, 1st ed.; Freeman: San Francisco, CA, USA, 1973; pp. 7–88. [Google Scholar]
  53. Rohlf, F.J. Tps Series; Department of Ecology and Evolution, State University of New York at Stony Brook: New York, NY, USA, 2007; pp. 7–20. [Google Scholar]
  54. Dryden, I.L.; Mardia, K.V. Statistical Shape Analysis; Wiley Inc.: Chichester, UK, 1998; pp. 34–56. [Google Scholar]
  55. Owen, J.G.; Chmielewski, M.A. On canonical variates analysis and the construction of confidence ellipses in systematic studies. Syst. Zool. 1985, 34, 366–374. [Google Scholar] [CrossRef]
  56. Tzeng, T.D.; Yeh, S.Y. Multivariate allometric comparisons for kuruma shrimp (Penaeus japonicus) off Taiwan. Fish. Res. 2002, 59, 279–288. [Google Scholar] [CrossRef]
  57. Björklund, M. Phenotypic variation of growth trajectories in finches. Evolution 1993, 47, 1506–1514. [Google Scholar] [CrossRef]
  58. Klingenberg, C.P.; Spence, J.R. Heterochrony and allometry: Lessons from the water strider genus Limnoporus. Evolution 1993, 47, 1834–1853. [Google Scholar] [CrossRef]
  59. Wiig, Ø. Multivariate variation in feral American mink (Mustela vison) from southern Norway. J. Zool. 1985, 206, 441–452. [Google Scholar] [CrossRef]
  60. Atchley, W.R. Some Genetic Aspects of Morphometric Variation. Numerical Taxonomy; Springer: Berlin/Heidelberg, Germany, 1983; pp. 346–363. [Google Scholar]
  61. Cock, A.G. Genetical aspects of metrical growth and form in animals. Q. Rev. Biophys. 1966, 41, 131–190. [Google Scholar] [CrossRef] [PubMed]
  62. Pepin, P.; Carr, S.M. Morphological, meristic, and genetic analysis of stock structure in juvenile Atlantic cod (Gadus morhua) from the Newfoundland shelf. Can. J. Fish. Aquat. Sci. 1993, 50, 1924–1933. [Google Scholar] [CrossRef]
  63. Lowe, S.A.; Van Doornik, D.M.; Winans, G.A. Geographic variation in genetic and growth patterns of Atka mackerel, Pleurogrammus monopterygius (Hexagrammidae), in the Aleutian archipelago. Fish. Bull. 1998, 96, 502–515. [Google Scholar]
  64. Solow, A.R. A randomization test for misclassification probability in discriminant analysis. Ecology 1990, 71, 2379–2382. [Google Scholar] [CrossRef]
  65. SAS. SAS User’s Guide, Statistics; SAS Institute, Inc.: Cary, NC, USA, 2014; pp. 5–33. [Google Scholar]
  66. Waldman, J.R.; Grossfield, J.; Wrigin, I. Review of stock discrimination techniques for striped bass. N. Am. J. Fish. Manag. 1988, 8, 410–425. [Google Scholar] [CrossRef]
  67. Bookstein, F.L.; Chernoff, B.; Elder, R.L.; Humphries, J.M.; Smith, G.R.; Strauss, R.E. Morphometrics in Evolutionary Biology: The Geometry of Size and Shape Change with Examples from Fishes, 15th ed.; Academy of National Sciences: Philadelphia, PA, USA, 1985; pp. 20–45. [Google Scholar]
  68. Sajina, A.M.; Chakraborty, S.K.; Jaiswar, A.K.; Pazhayamadam, D.G.; Sudheesan, D. Stock structure analysis of Megalaspis cordyla (Linnaeus, 1758) along the Indian coast based on truss network analysis. Fish. Res. 2011, 108, 100–105. [Google Scholar] [CrossRef]
  69. Anvarifar, H.; Khyabani, A.; Farahmand, H.; Vatandoust, S.; Anvarifar, H.; Jahageerdar, S. Detection of morphometric differentiation between isolated up- and downstream populations of Siah Mahi (Capoeta capoeta gracilis) (Pisces: Cyprinidae) in the Tajan River (Iran). Hydrobiologia 2011, 673, 41–52. [Google Scholar] [CrossRef]
  70. Wu, S.C.; Tang, H.C. Preliminary biological study of Macrobrachium nipponense. Bull. Taiwan Fish. Res. Inst. 1990, 48, 121–126. [Google Scholar]
Figure 1. Sampling localities of Portunus sanguinolentus in East Asia.
Water 15 03335 g001
Figure 2. Diagram of Portunus sanguinolentus showing the body parts measured. This study independently created the morphological diagrams of crabs.
Water 15 03335 g002
Figure 3. Dendrogram for eight sampling areas for female data set, Kuroshio groups (KG), mainland China groups (MCG), and Kuroshio subgroups (KSG).
Water 15 03335 g003
Figure 4. Dendrogram for eight sampling areas for male data set, Kuroshio groups (KG), mainland China groups (MCG), and Kuroshio subgroups (KSG).
Water 15 03335 g004
Figure 5. Plot of 95% confidence ellipses around sample from (A) female and (B) male distributions and group means of first three canonical scores of the Kuroshio groups (KG), mainland China groups (MCG), and Kuroshio subgroups (KSG).
Water 15 03335 g005
Figure 6. Frequency distribution of 1000 misclassification rate (Pc) estimated from (a) the Kuroshio groups (KG) for females, (b) the mainland China groups (MCG) for females, (c) the Kuroshio subgroups (KSG) for females, (d) the Kuroshio groups (KG) for males, (e) the mainland China groups (MCG) for males, (f) the Kuroshio subgroups (KSG) for males. P, proportion of Pc < Po among 1000 permutations; Po, misclassification rate estimated from the original dataset.
Water 15 03335 g006
Table 1. Sampling station codes for male and female Portunus sanguinolentus specimens collected in Taiwan.
Area CodeSampling StationnSexSampling DateCW (mm)
Mean (SD)Range
KSKyushu58FOctober 2021102.44 (11.17)83.23–119.47
55M109.96 (10.99)78.61–127.14
FZFuzhou55FOctober 2021101.86 (7.88)89.15–122.86
45M105.91 (10.16)81.86–125.69
YLYilan53FJanuary 2022108.37 (11.61)89.15–127.97
52M116.22 (11.86)84.21–136.19
XMXiamen50FJanuary 2022102.67 (11.69)89.15–141.36
50M109.61 (10.50)84.21–129.30
TNTainan53FJanuary 2022113.74 (5.82)103.17–127.65
49M111.57 (7.35)95.43–131.16
VNVietnam50FJanuary 2022112.59 (9.64)134.92–97.23
46M109.96 (8.14)96.46–130.62
HKHongkong56FDecember 2021107.72 (9.25)80.79–122.69
56M110.34 (13.20)92.49–145.48
SGSingapore55FJanuary 2022119.53 (10.31)89.76–136.31
50M120.50 (14.30)100.75–158.47
Table 2. Correlation coefficients between characteristics, before and after the removal of the size effect, are respectively shown below and above the diagonal.
(A) Female
VariableCLCP1CP2CP3CP4CP5CP6AB3LAB3RLAB3LLAB3W
CL −0.8480.5550.728−0.644−0.7860.931−0.2530.205 **−0.164 **−0.849 **
CP1−0.692 ** −0.803 **−0.786 **0.686 **0.662 **−0.9510.520.166 **0.492 **0.769 **
CP20.638 **−0.539 ** 0.628 **−0.378 **−0.378 **0.758−0.443−0.277 **−0.496 **0.041
CP30.780 **−0.514 **0.766 ** −0.092−0.529 **0.807−0.394−0.635 **−0.398 **−0.603 **
CP4−0.140 **0.604 **0.127 **−0.005 0.682 **−0.660.5270.231 **0.496 **0.724 **
CP5−0.136 **0.553 **0.231 **0.201 **0.773 ** 0.0210.408−0.706 **0.333 **0.858 **
CP60.929 **−0.745 **0.834 **0.862 **−0.114 *−0.020 −0.36−0.441 **−0.330 **−0.789 **
AB3L0.243 **0.406 **0.226 **0.285 **0.721 **0.708 **0.207 ** 0.823 **0.897 **0.509 **
AB3RL0.541 **0.136 **0.365 **0.501 **0.558 **0.562 **0.474 **0.917 ** 0.866 **0.081
AB3LL0.319 **0.359 **0.225 **0.316 **0.694 **0.678 **0.252 **0.954 **0.943 ** 0.416 **
AB3W−0.461 **0.760 **−0.033−0.135 **0.770 **0.836 **−0.359 **0.609 **0.351 **0.549 **
(B) Male
CL −0.870 **0.641 **0.467 **−0.547 **0.0470.902 **−0.036−0.115 *−0.753 **−0.907 **
CP1−0.730 ** −0.742 **−0.555 **0.577 **0.631 **−0.949 **0.463 **0.051−0.0930.862 **
CP20.742 **−0.482 ** 0.524 **−0.299 **−0.259 **0.767 **0.261 **−0.102 *0.385 **−0.561 **
CP30.621 **−0.370 **0.745 ** −0.308 **−0.189 **0.567 **−0.540 **0.216 **0.292 **−0.375 **
CP4−0.0570.519 **0.230 **0.167 ** 0.544 **0.0010.527 **0.319 **0.277 **0.600 **
CP5−0.0400.470 **0.426 **0.415 **0.704 ** −0.600 **0.674 **0.401 **0.304 **0.761 **
CP60.909 **−0.705 **0.878 **0.755 **0.0250.183 ** −0.433 **−0.541 **0.151 **−0.858 **
AB3L−0.0310.402 **0.416 **0.413 **0.636 **0.822 **0.162 ** 0.851 **0.710 **0.745 **
AB3RL0.340 **0.0740.683 **0.636 **0.549 **0.750 **0.511 **0.905 ** 0.860 **0.391 **
AB3LL0.427 **−0.0200.737 **0.668 **0.537 **0.713 **0.583 **0.836 **0.944 ** 0.205 **
AB3W−0.668 **0.853 **−0.238 **−0.111 *0.536 **0.630 **−0.512 **0.686 **0.389 **0.275 **
Note: * value significant at 95%; ** value significant at 99%.
Table 3. The first two eigenvectors and percentages of total variance explained by the first two eigenvalues obtained from canonical variate analysis.
(A) Female
VariableFirst EigenvectorSecond Eigenvector
CL−0.850.48
CP10.94−0.11
CP2−0.73−0.07
CP3−0.810.15
CP40.800.01
CP50.79−0.22
CP6−0.920.32
AB3L0.660.69
AB3RL0.280.94
AB3LL0.620.75
AB3W0.87−0.17
Eigenvalue1.340.58
Percentage variance60%22%
(B) Male
CL−0.930.16
CP10.92−0.27
CP2−0.640.58
CP3−0.500.50
CP40.700.18
CP50.790.27
CP6−0.910.32
AB3L0.700.67
AB3RL0.310.90
AB3LL0.150.92
AB3W0.960.09
Eigenvalue3.180.42
Percentage variance53%27%
Disclaimer/Publisher’s Note: The statements, opinions and data contained in all publications are solely those of the individual author(s) and contributor(s) and not of MDPI and/or the editor(s). MDPI and/or the editor(s) disclaim responsibility for any injury to people or property resulting from any ideas, methods, instructions or products referred to in the content.

