
Groundwater Quality Evaluation of Fractured Aquifers Using Machine Learning Models and Hydrogeochemical Approaches to Sustainable Water-Irrigation Security in Arid Climate (Central Tunisia)

 ,
,  ,
,  ,
,
Abstract
:1. Introduction
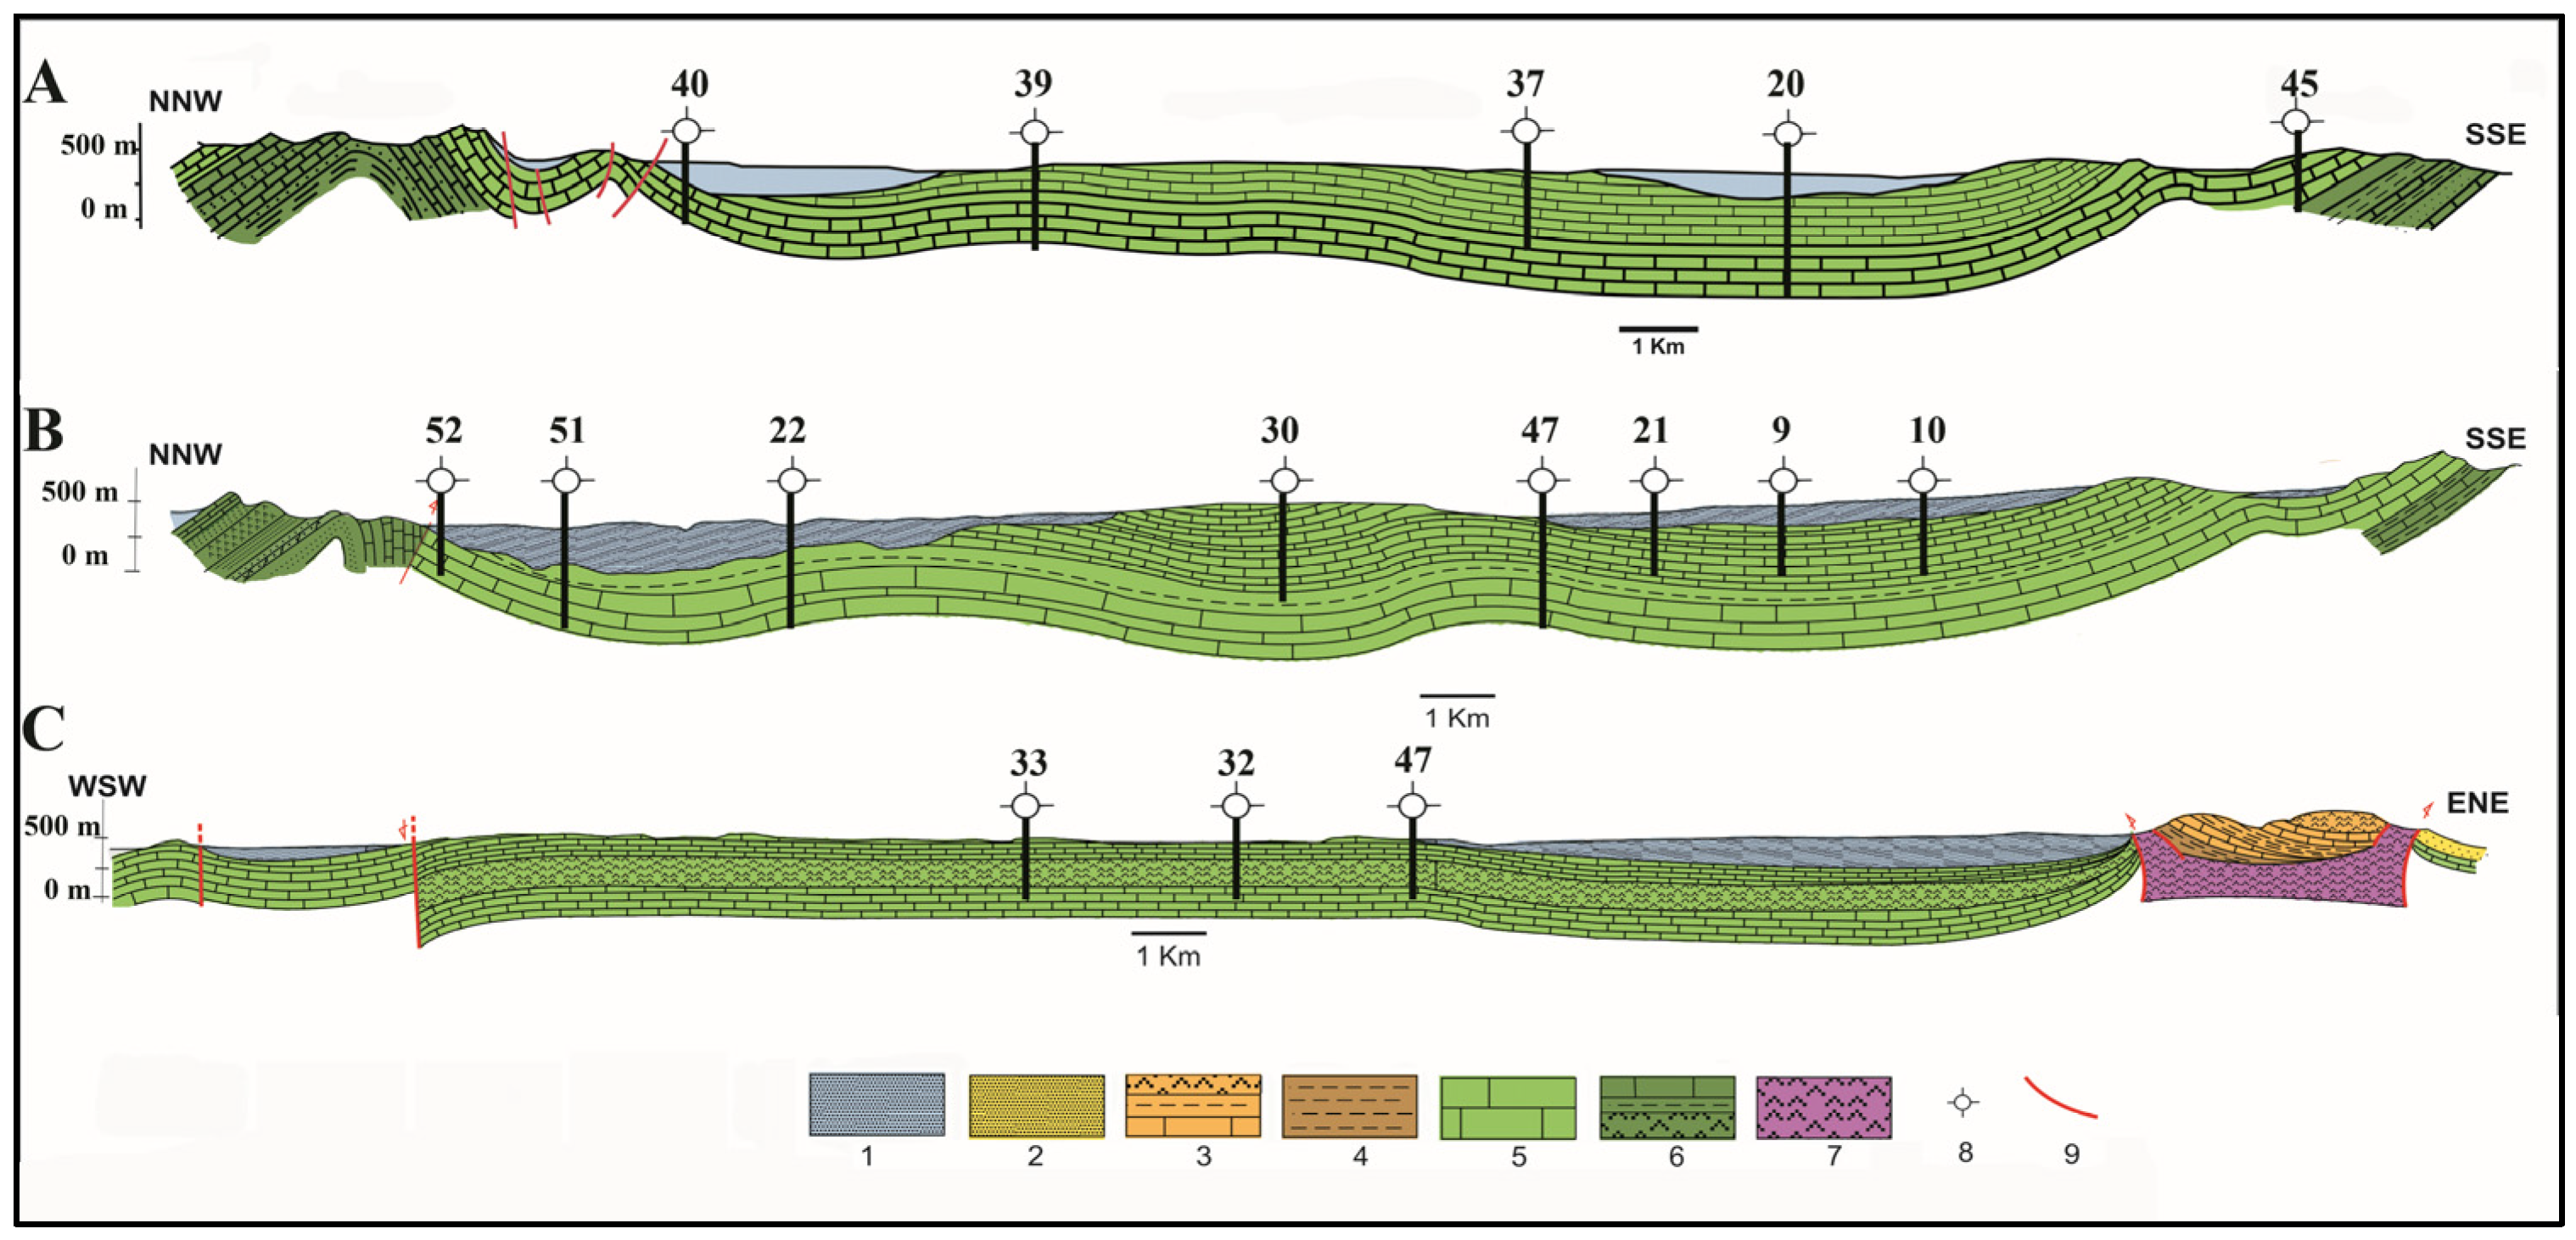
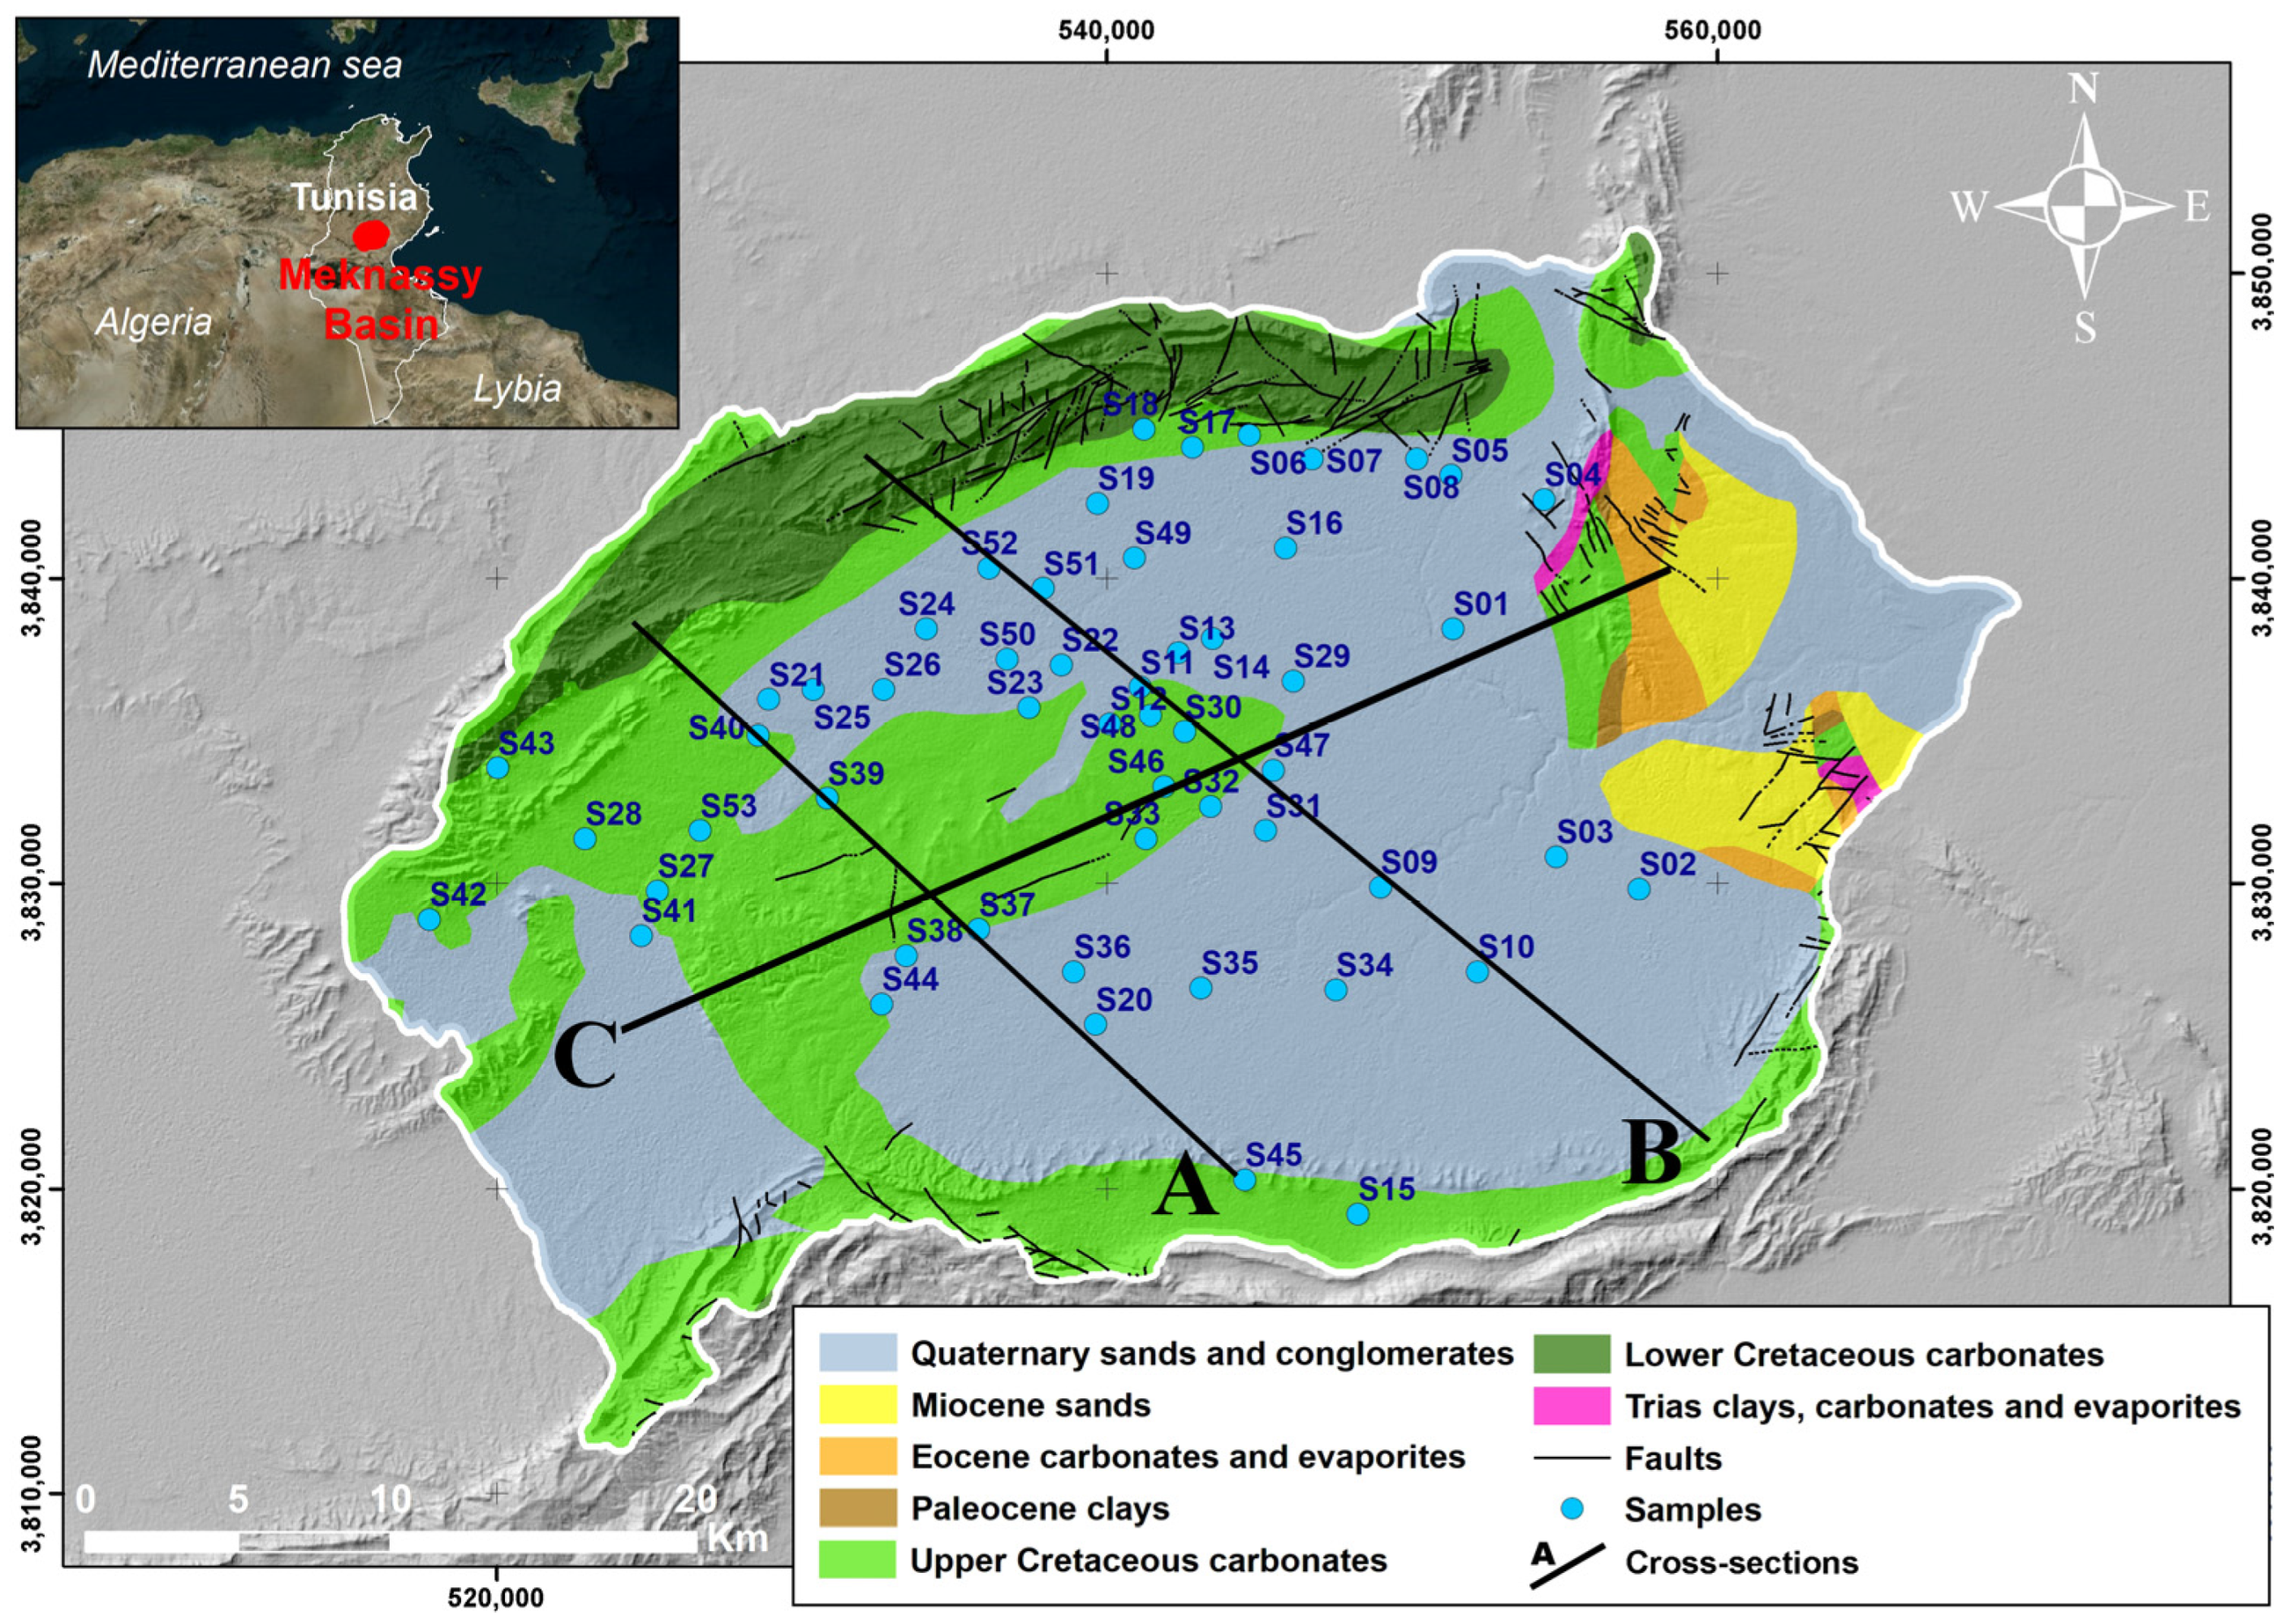
2. Study Area
3. Compilation of a Hydrogeochemical Dataset
3.1. Groundwater Sampling, Gathering, and Analytical Assessment
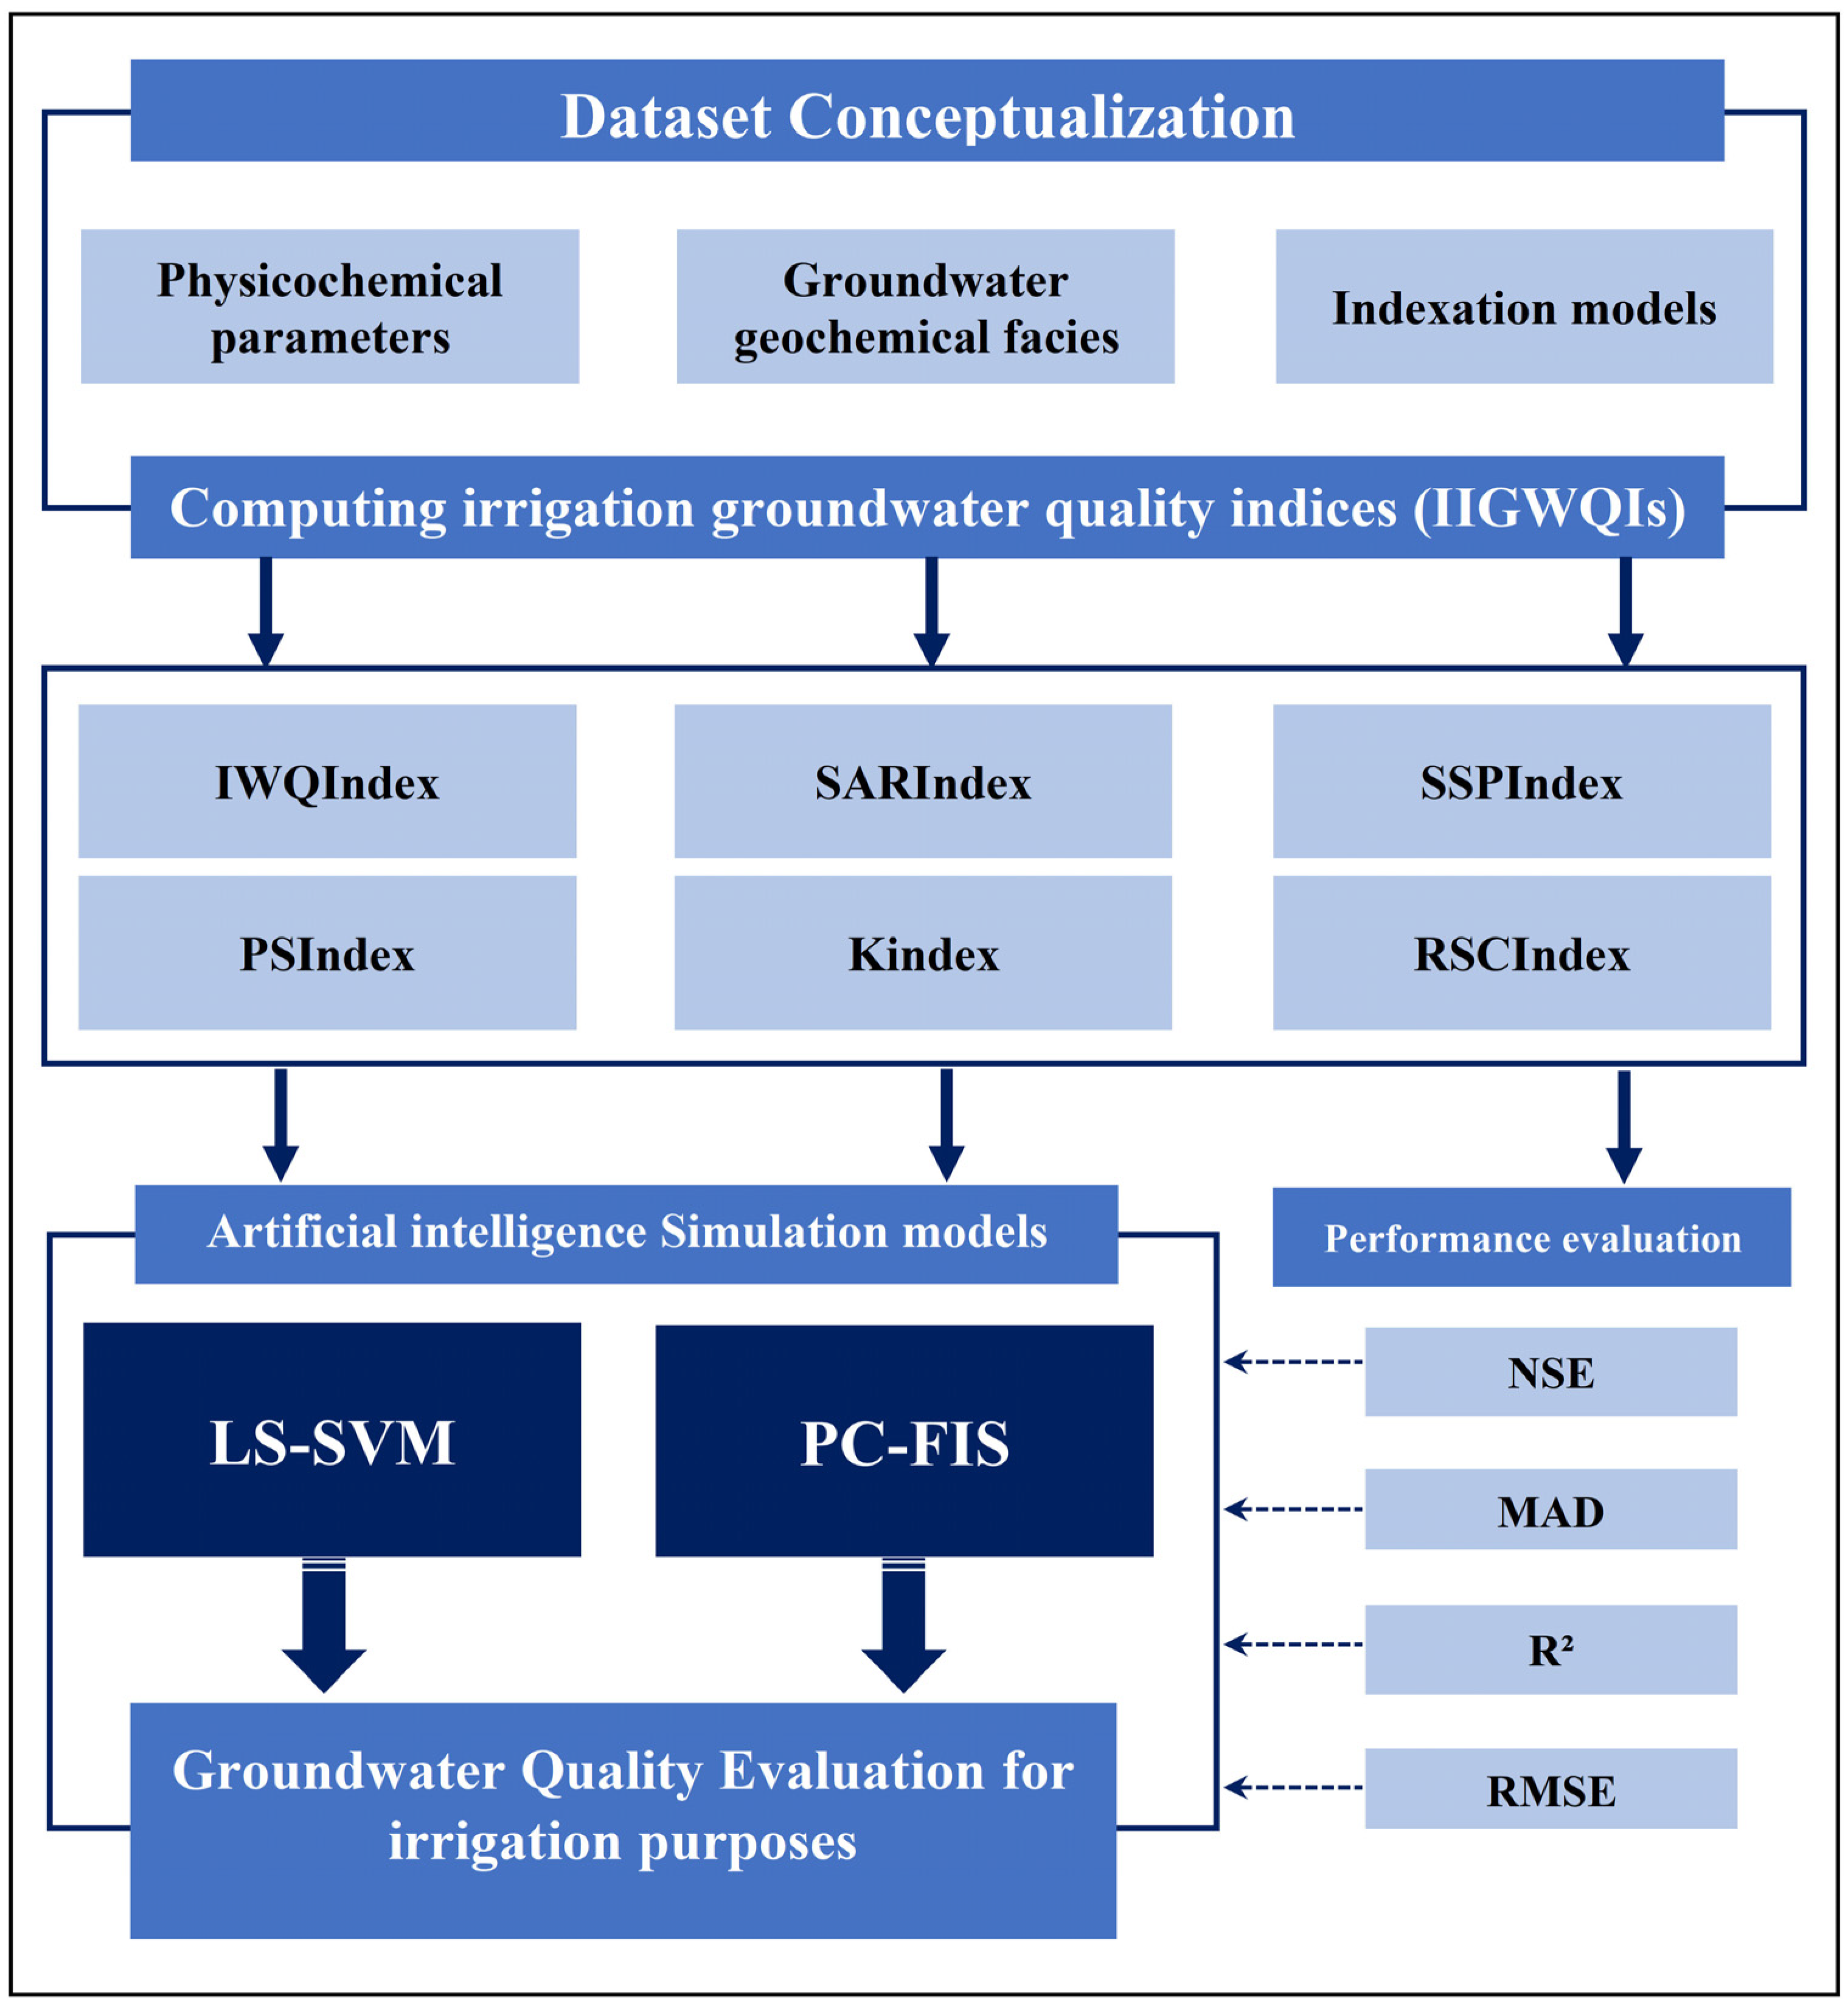
3.2. The Indexing Method for Integrated Irrigation Groundwater Quality (IIGWQIs)
3.2.1. Irrigation Water Quality Index (IWQIndex)
3.2.2. Sodium Adsorption Ratio Index (SARIndex)
3.2.3. Soluble Sodium Percentage Index (SSPIndex)
3.2.4. Potential Salinity Index (PSIndex)
3.2.5. Kelley Index (KIndex)
3.2.6. Residual Sodium Carbonate Index (RSCIndex)
4. Machine Learning Simulation Models
4.1. Least-Squares Support Vector Machines (LS-SVM) Model
4.2. Pearson Correlation Fuzzy Inference-Based System (PC-FIS)
4.3. Assessment of Simulation Model Performance
4.3.1. NSE: Nash-Sutcliffe-Efficiency-Coefficient
4.3.2. MAD: Mean-Absolute-Error
4.3.3. R2: Absolute-Variance-Fraction
4.3.4. RMSE: Root-Mean-Square-Error
5. Results and Discussions
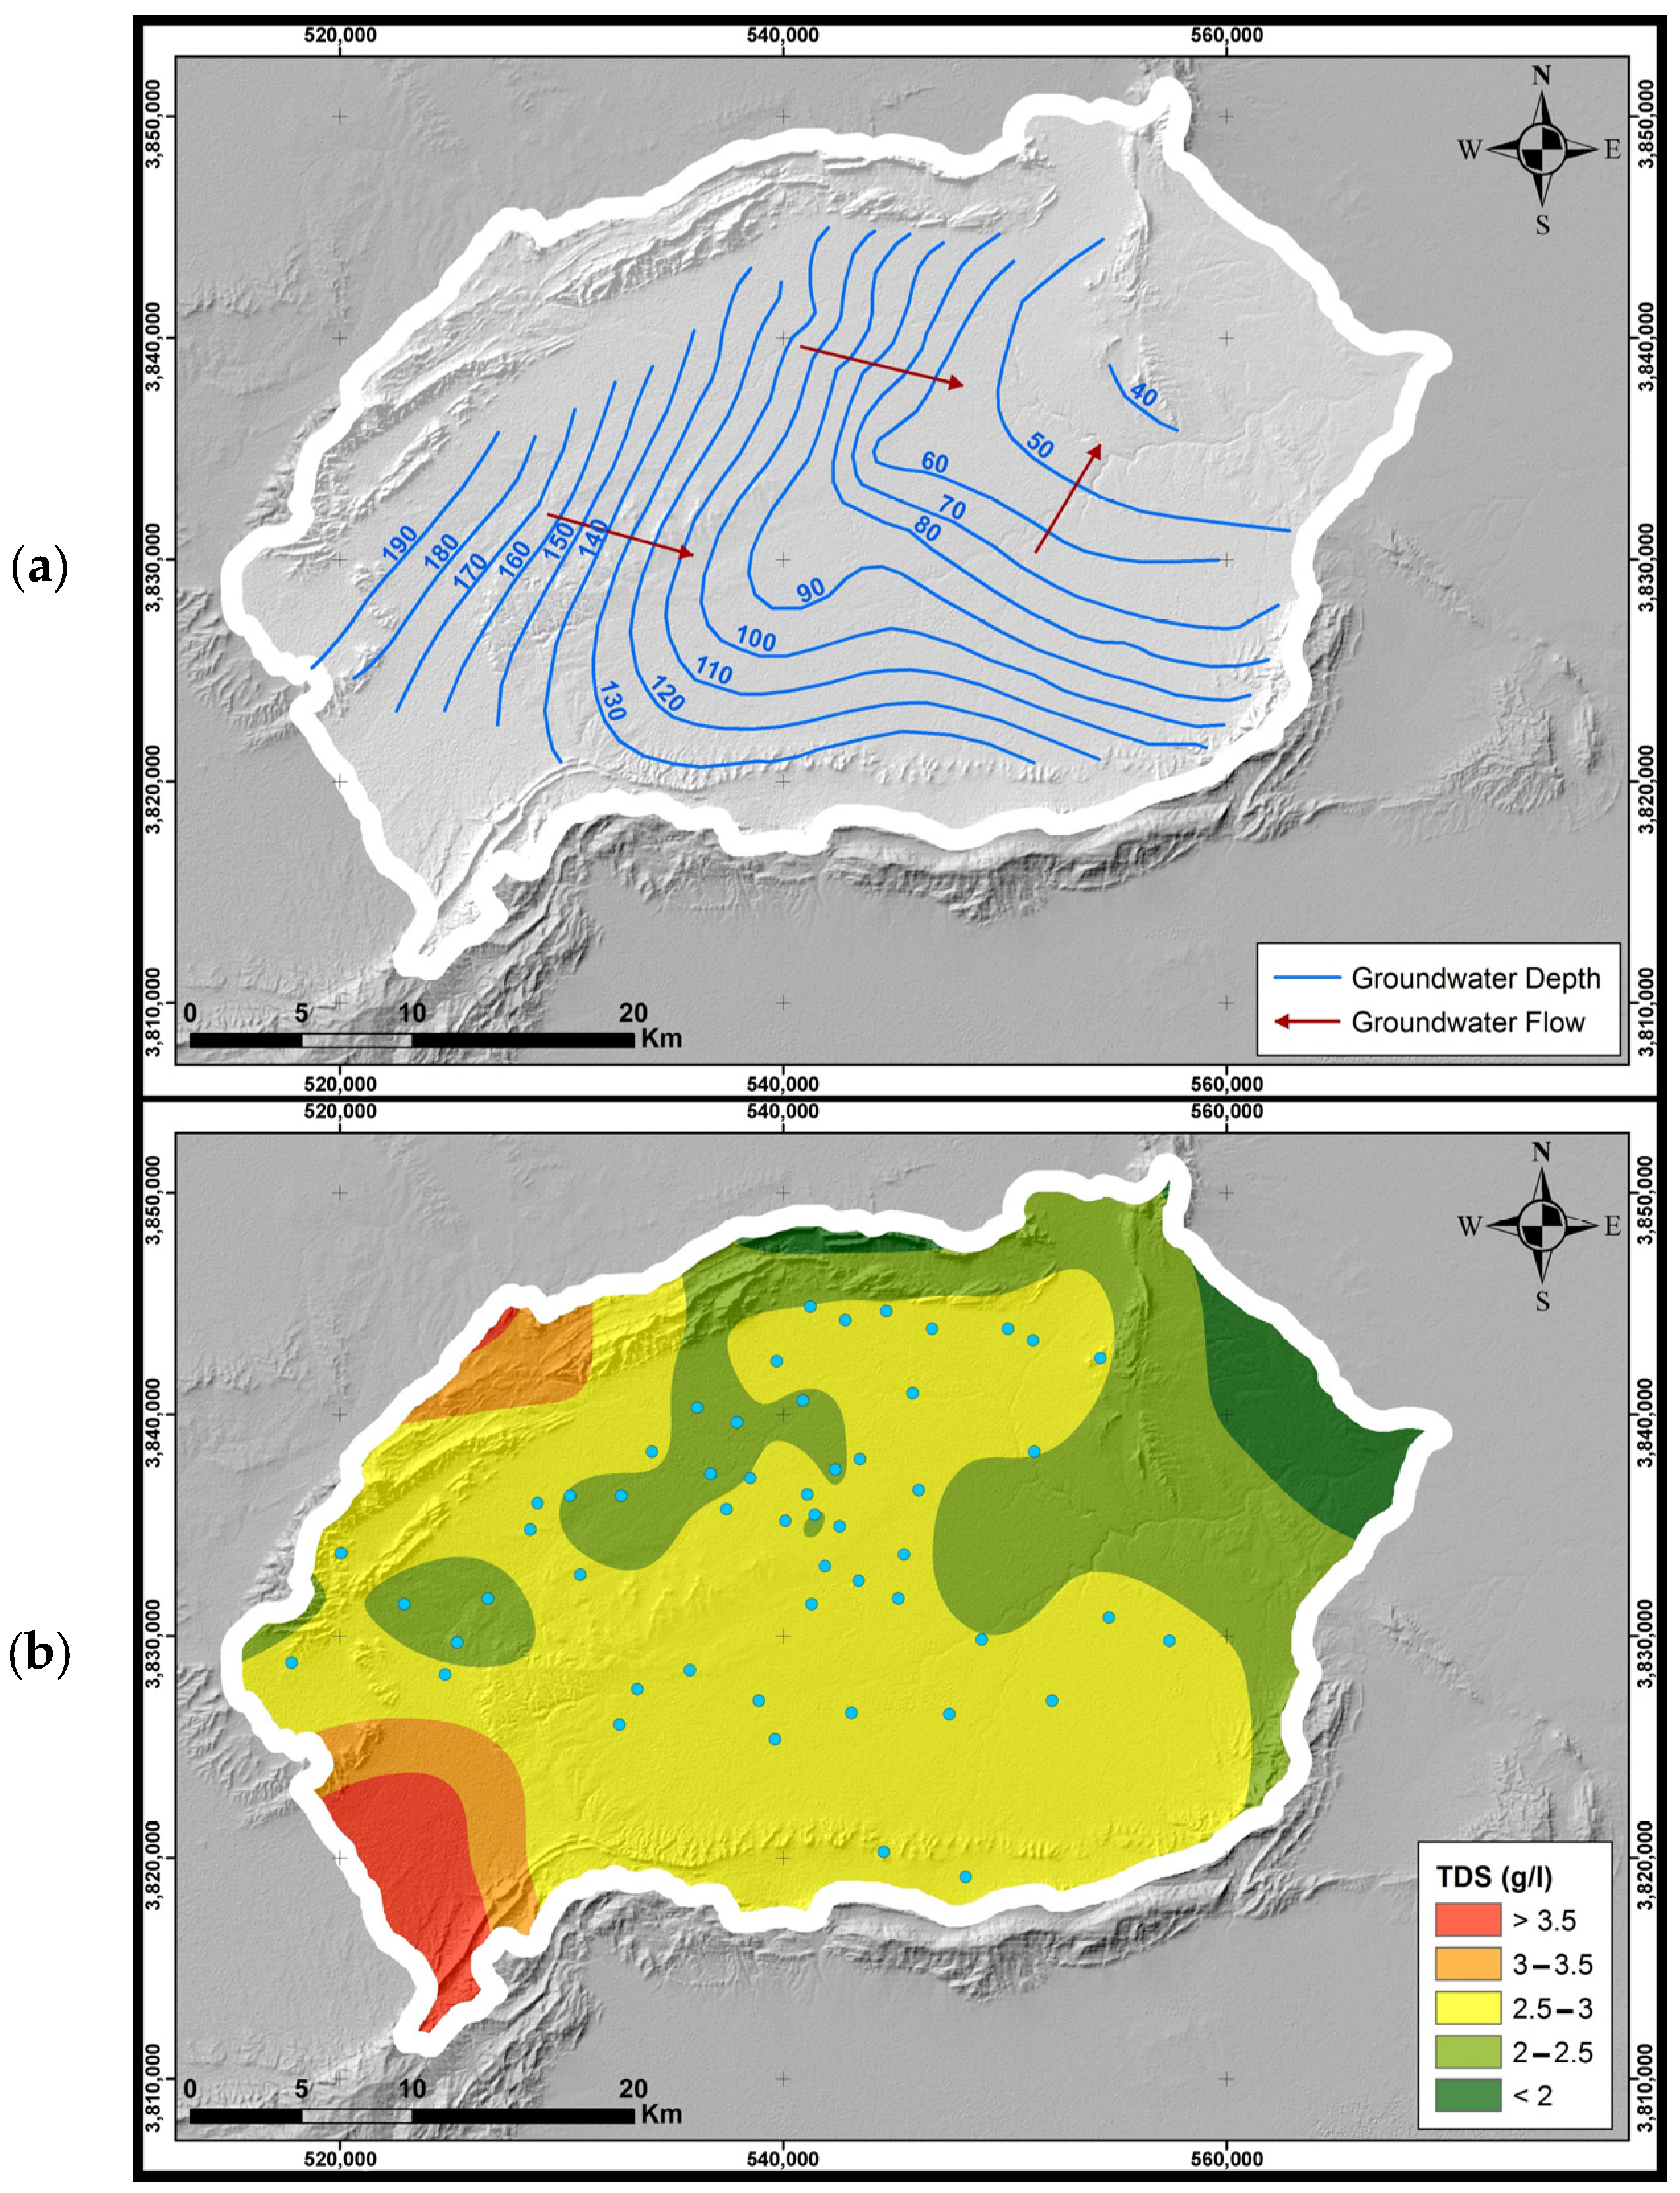
5.1. Groundwater Physicochemical Attributes
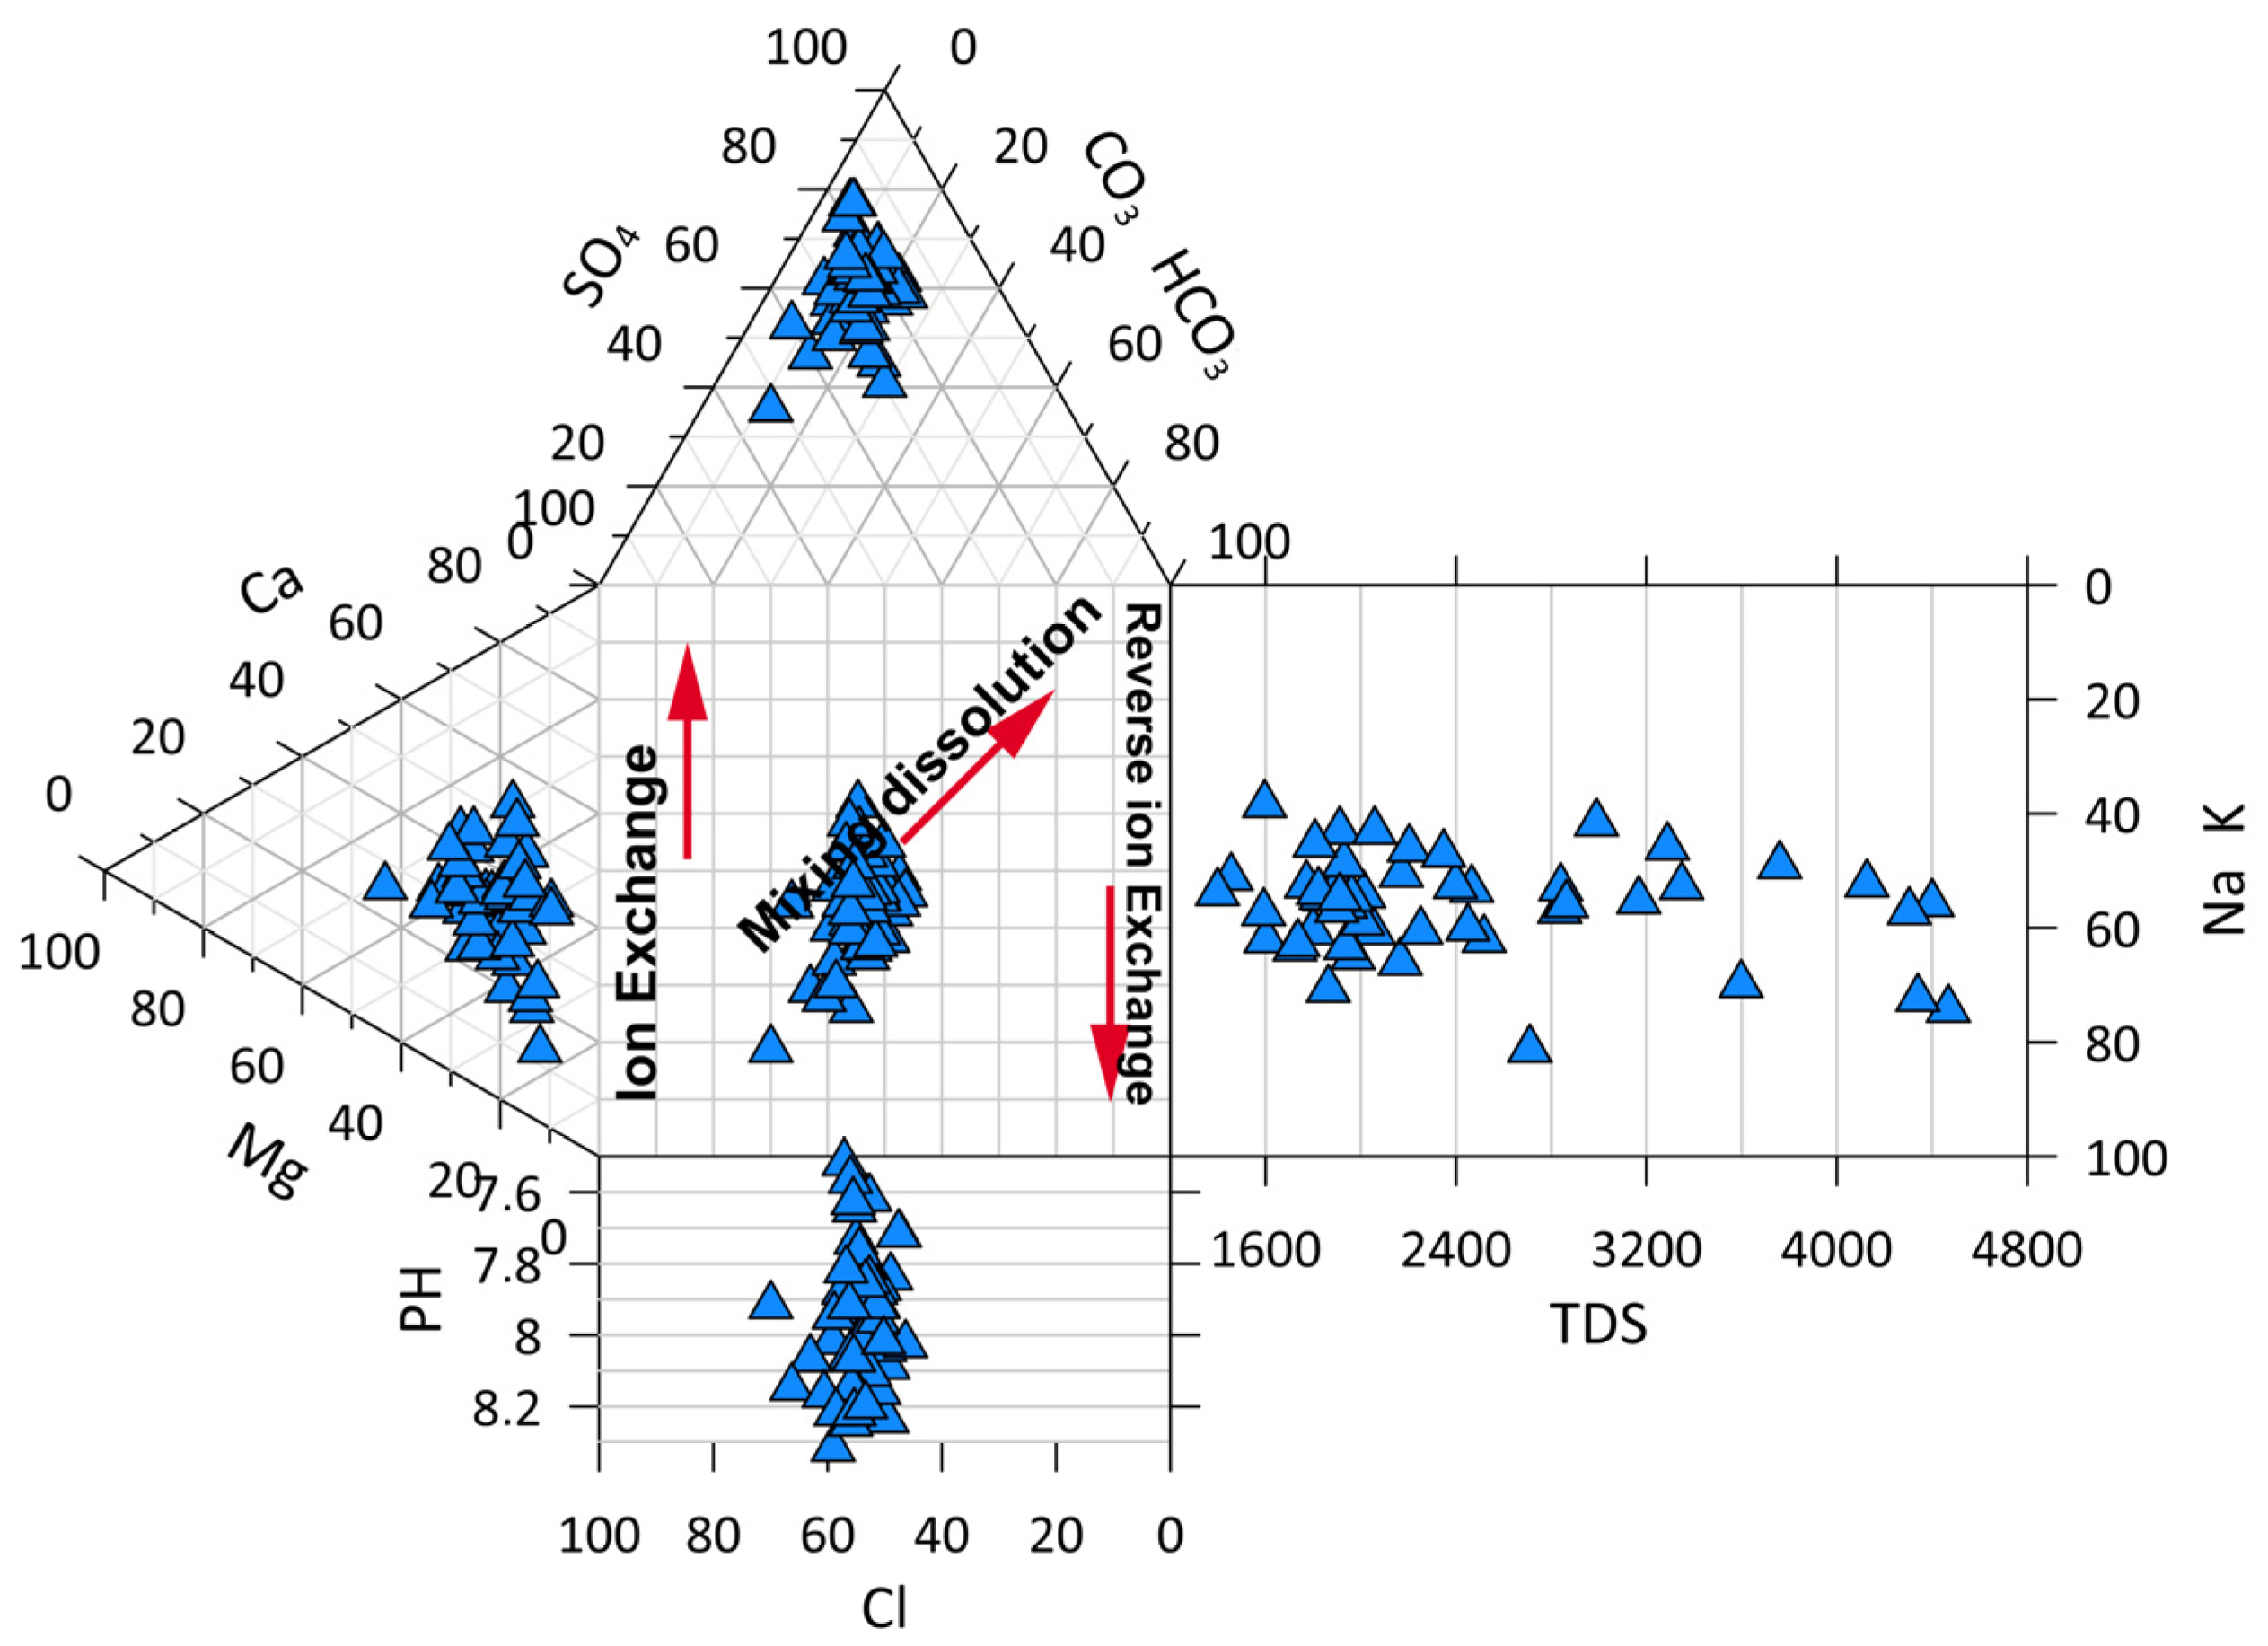
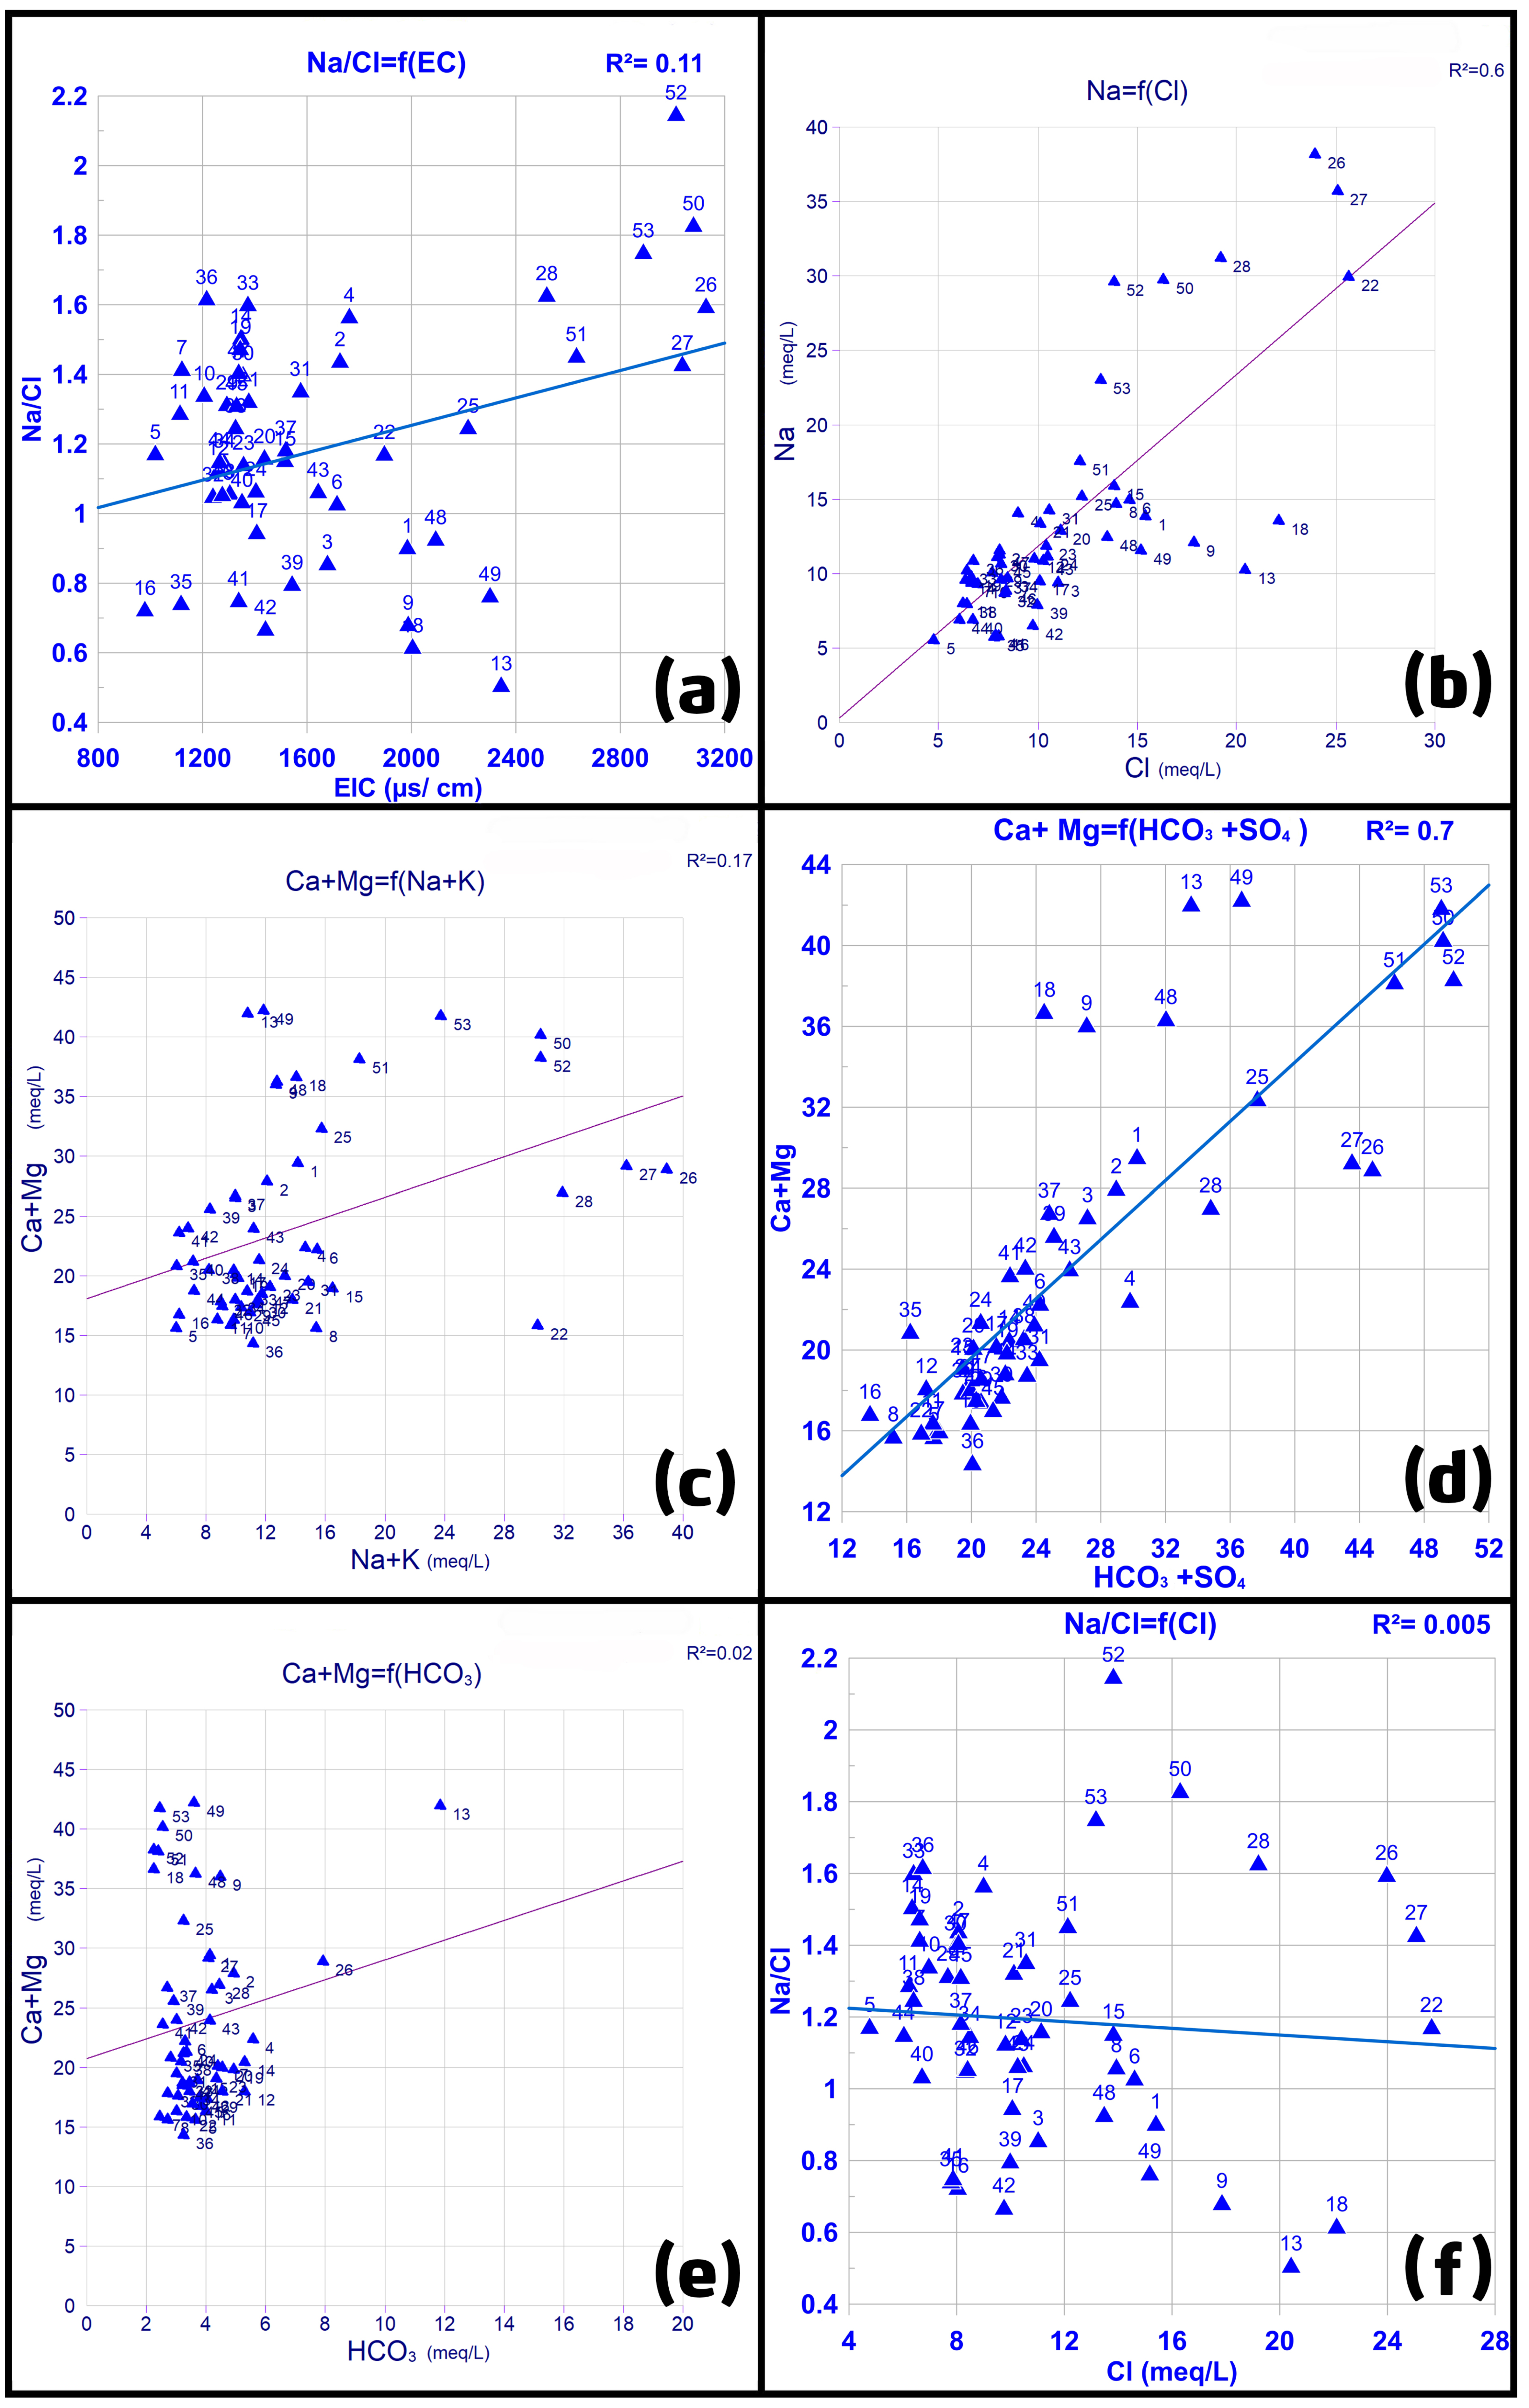
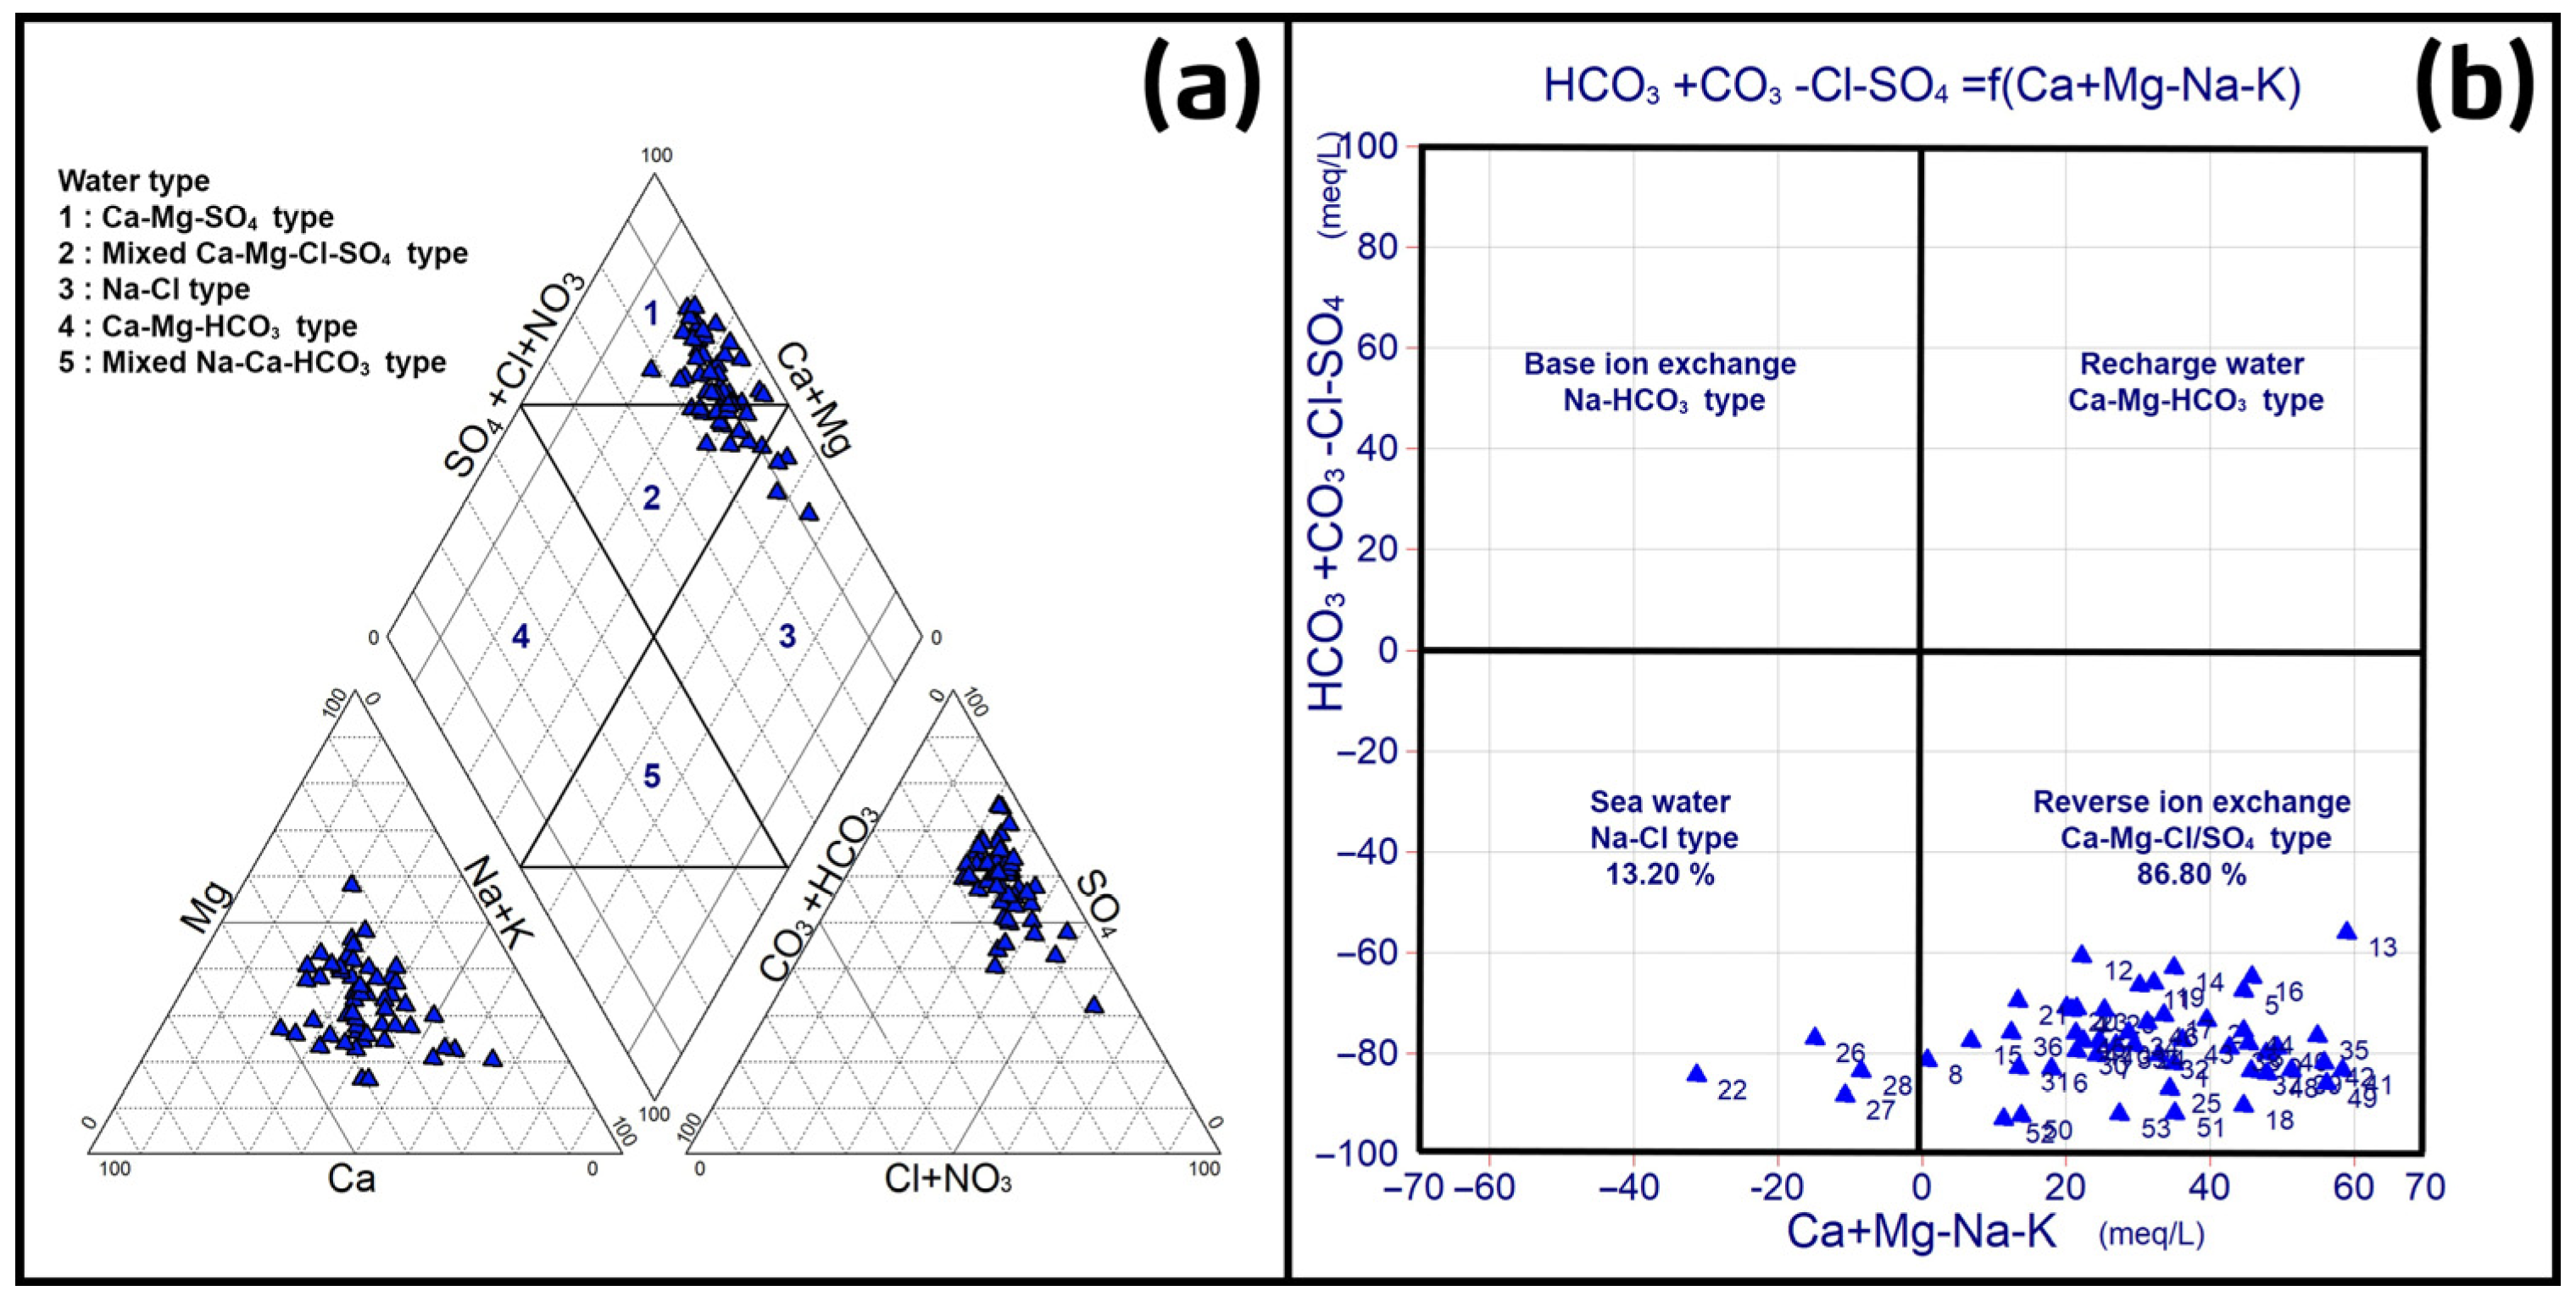
5.2. Hydrogeochemical Facies
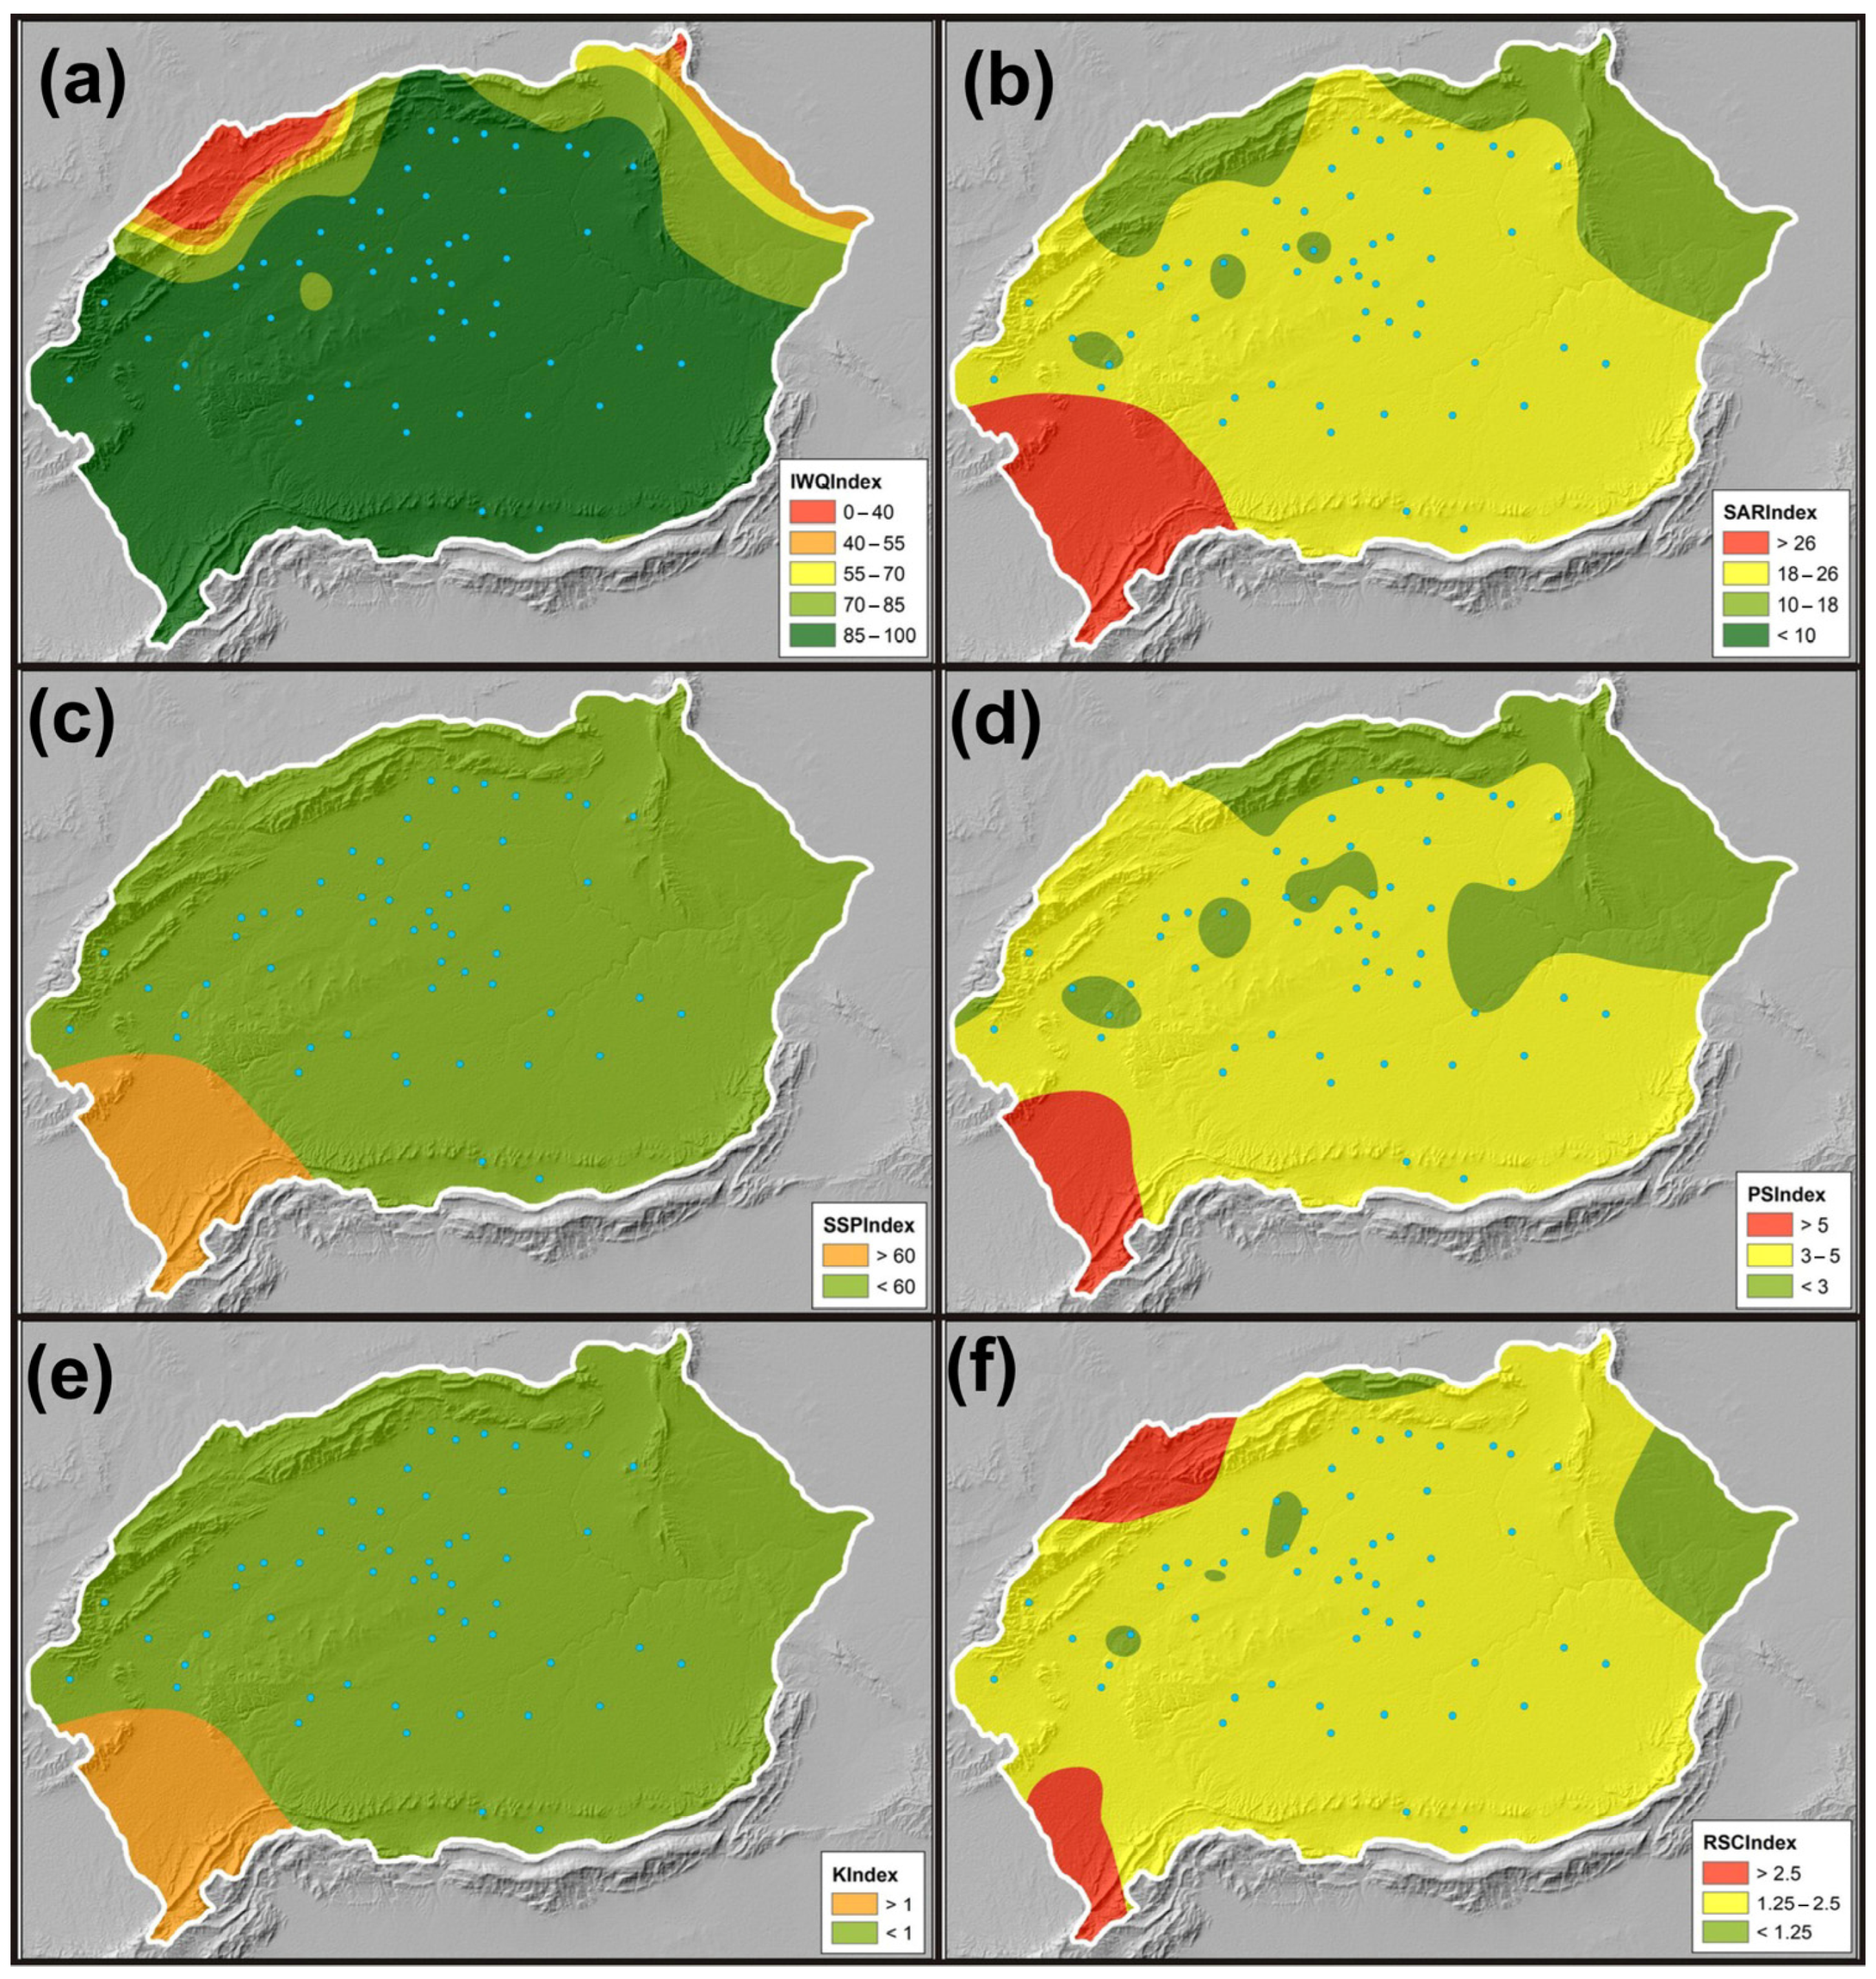
5.3. Integrated Irrigation Groundwater Quality Indices (IIGWQIs) for Agricultural Implication
5.3.1. IWQIndex: Irrigation Water Quality Index
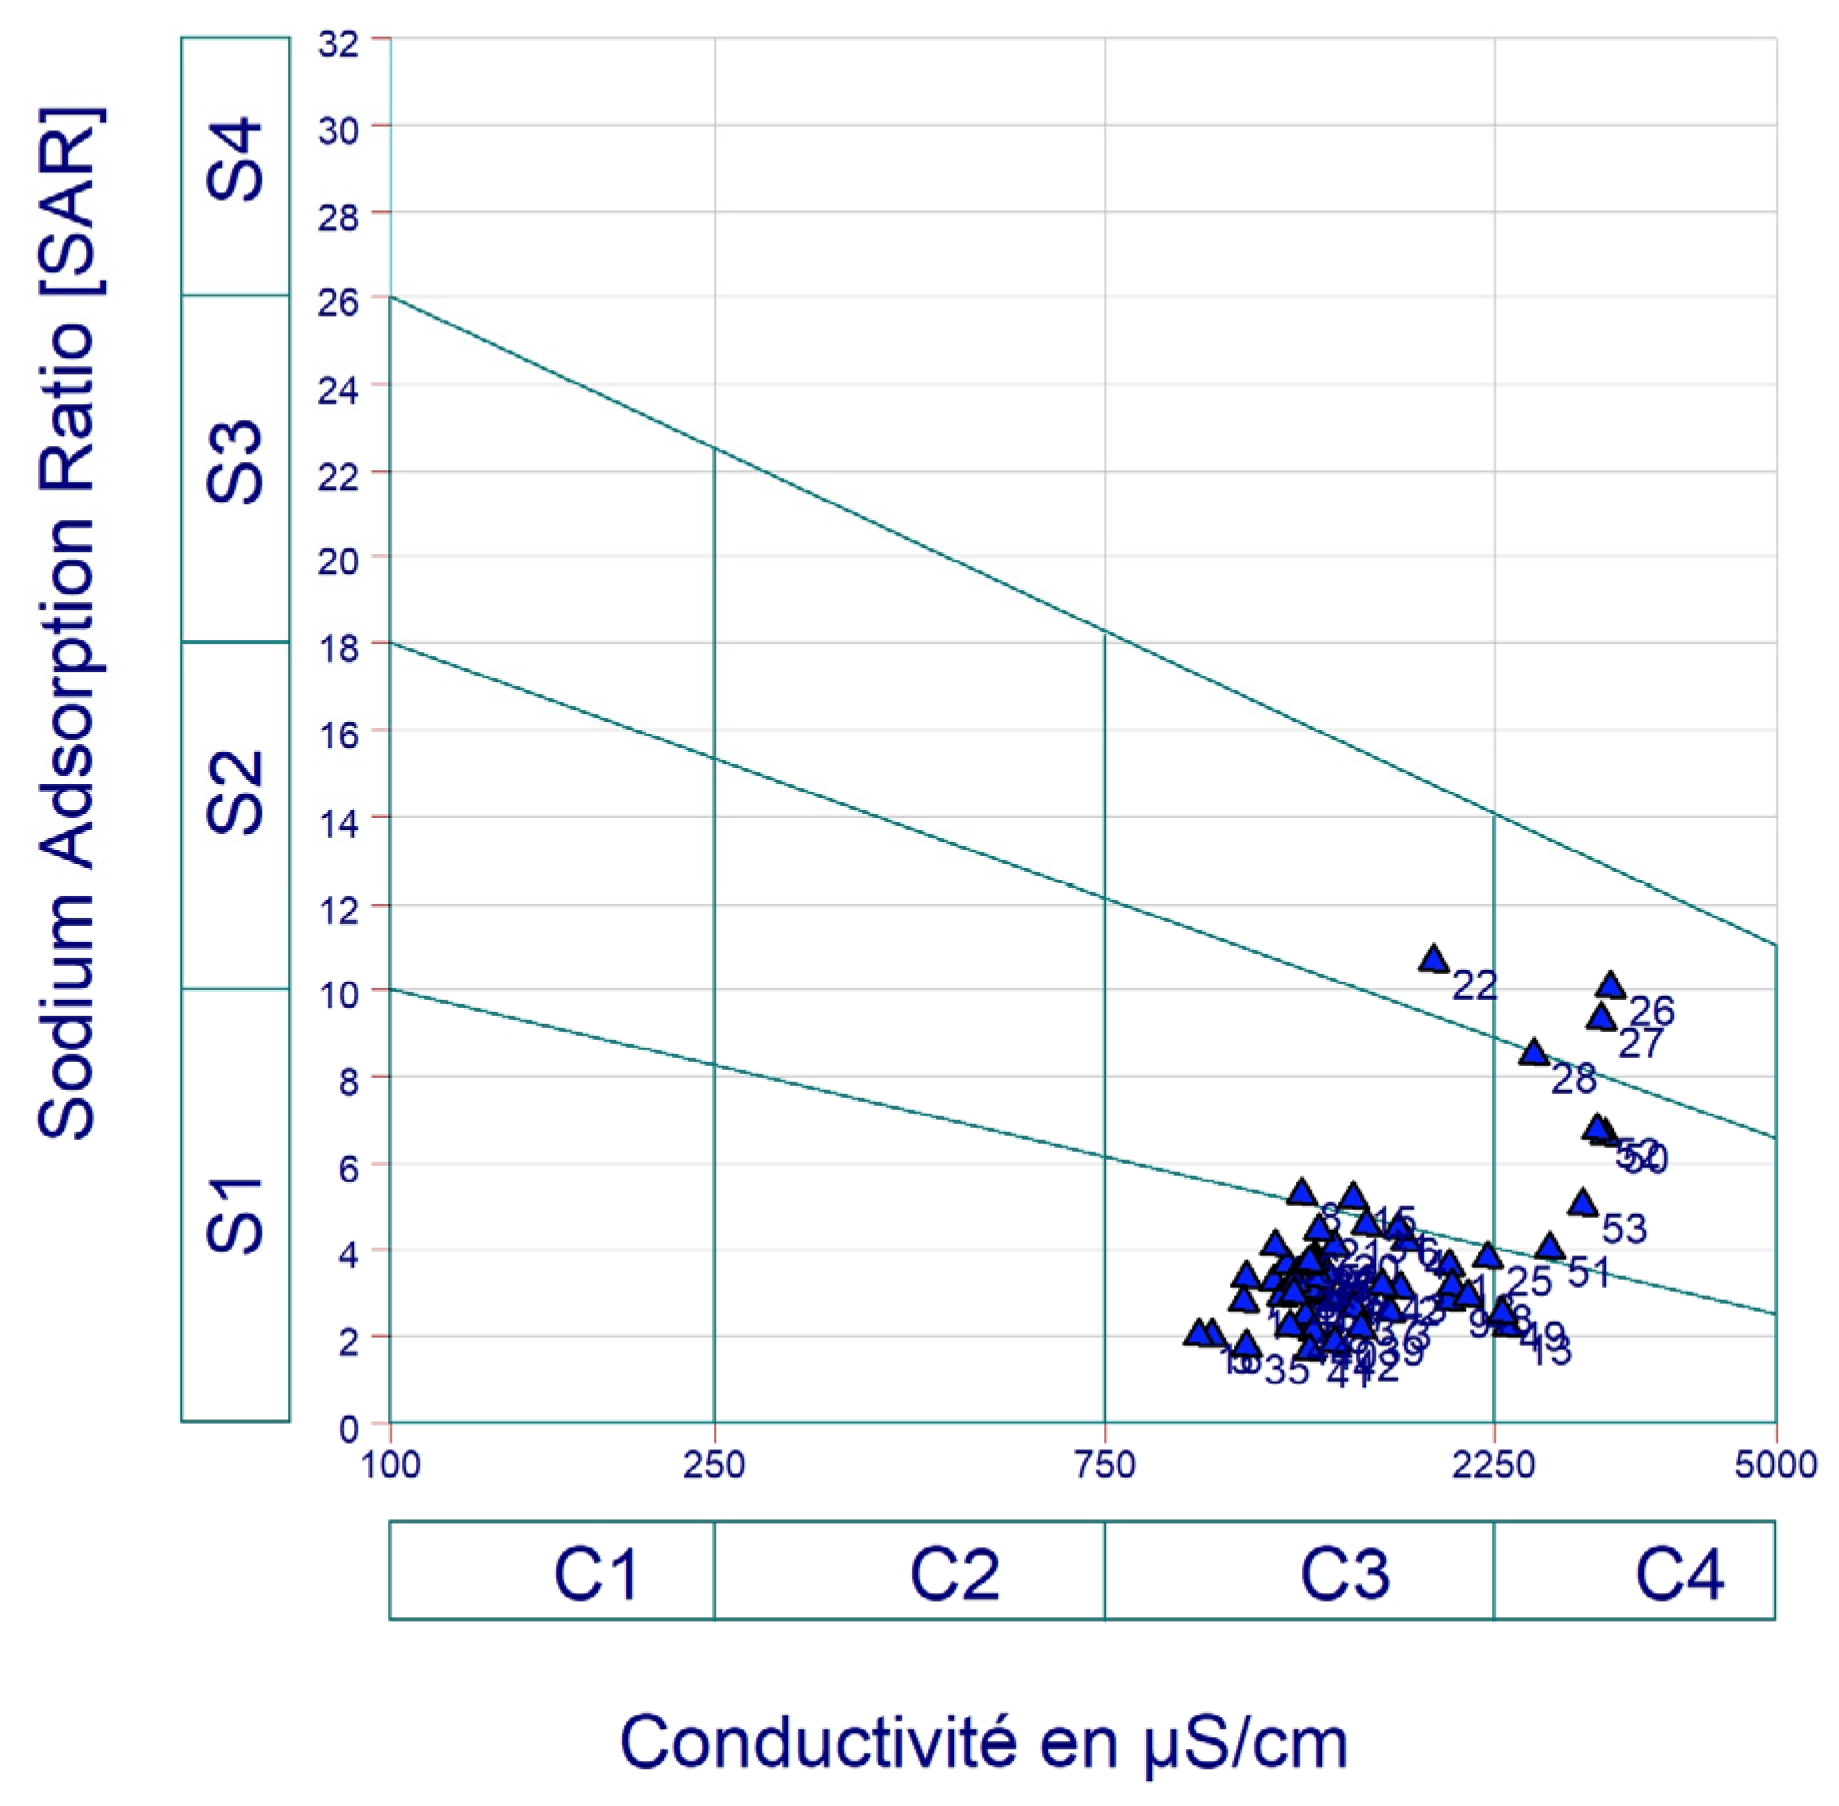
5.3.2. SARIndex: Sodium Adsorption Ratio Index
5.3.3. SSPIndex: Soluble Sodium Percentage Index
5.3.4. PSIndex: Potential Salinity Index
5.3.5. KIndex: Kelley Index
5.3.6. RSCIndex: Residual Sodium Carbonate Index
5.4. Models’ Simulation
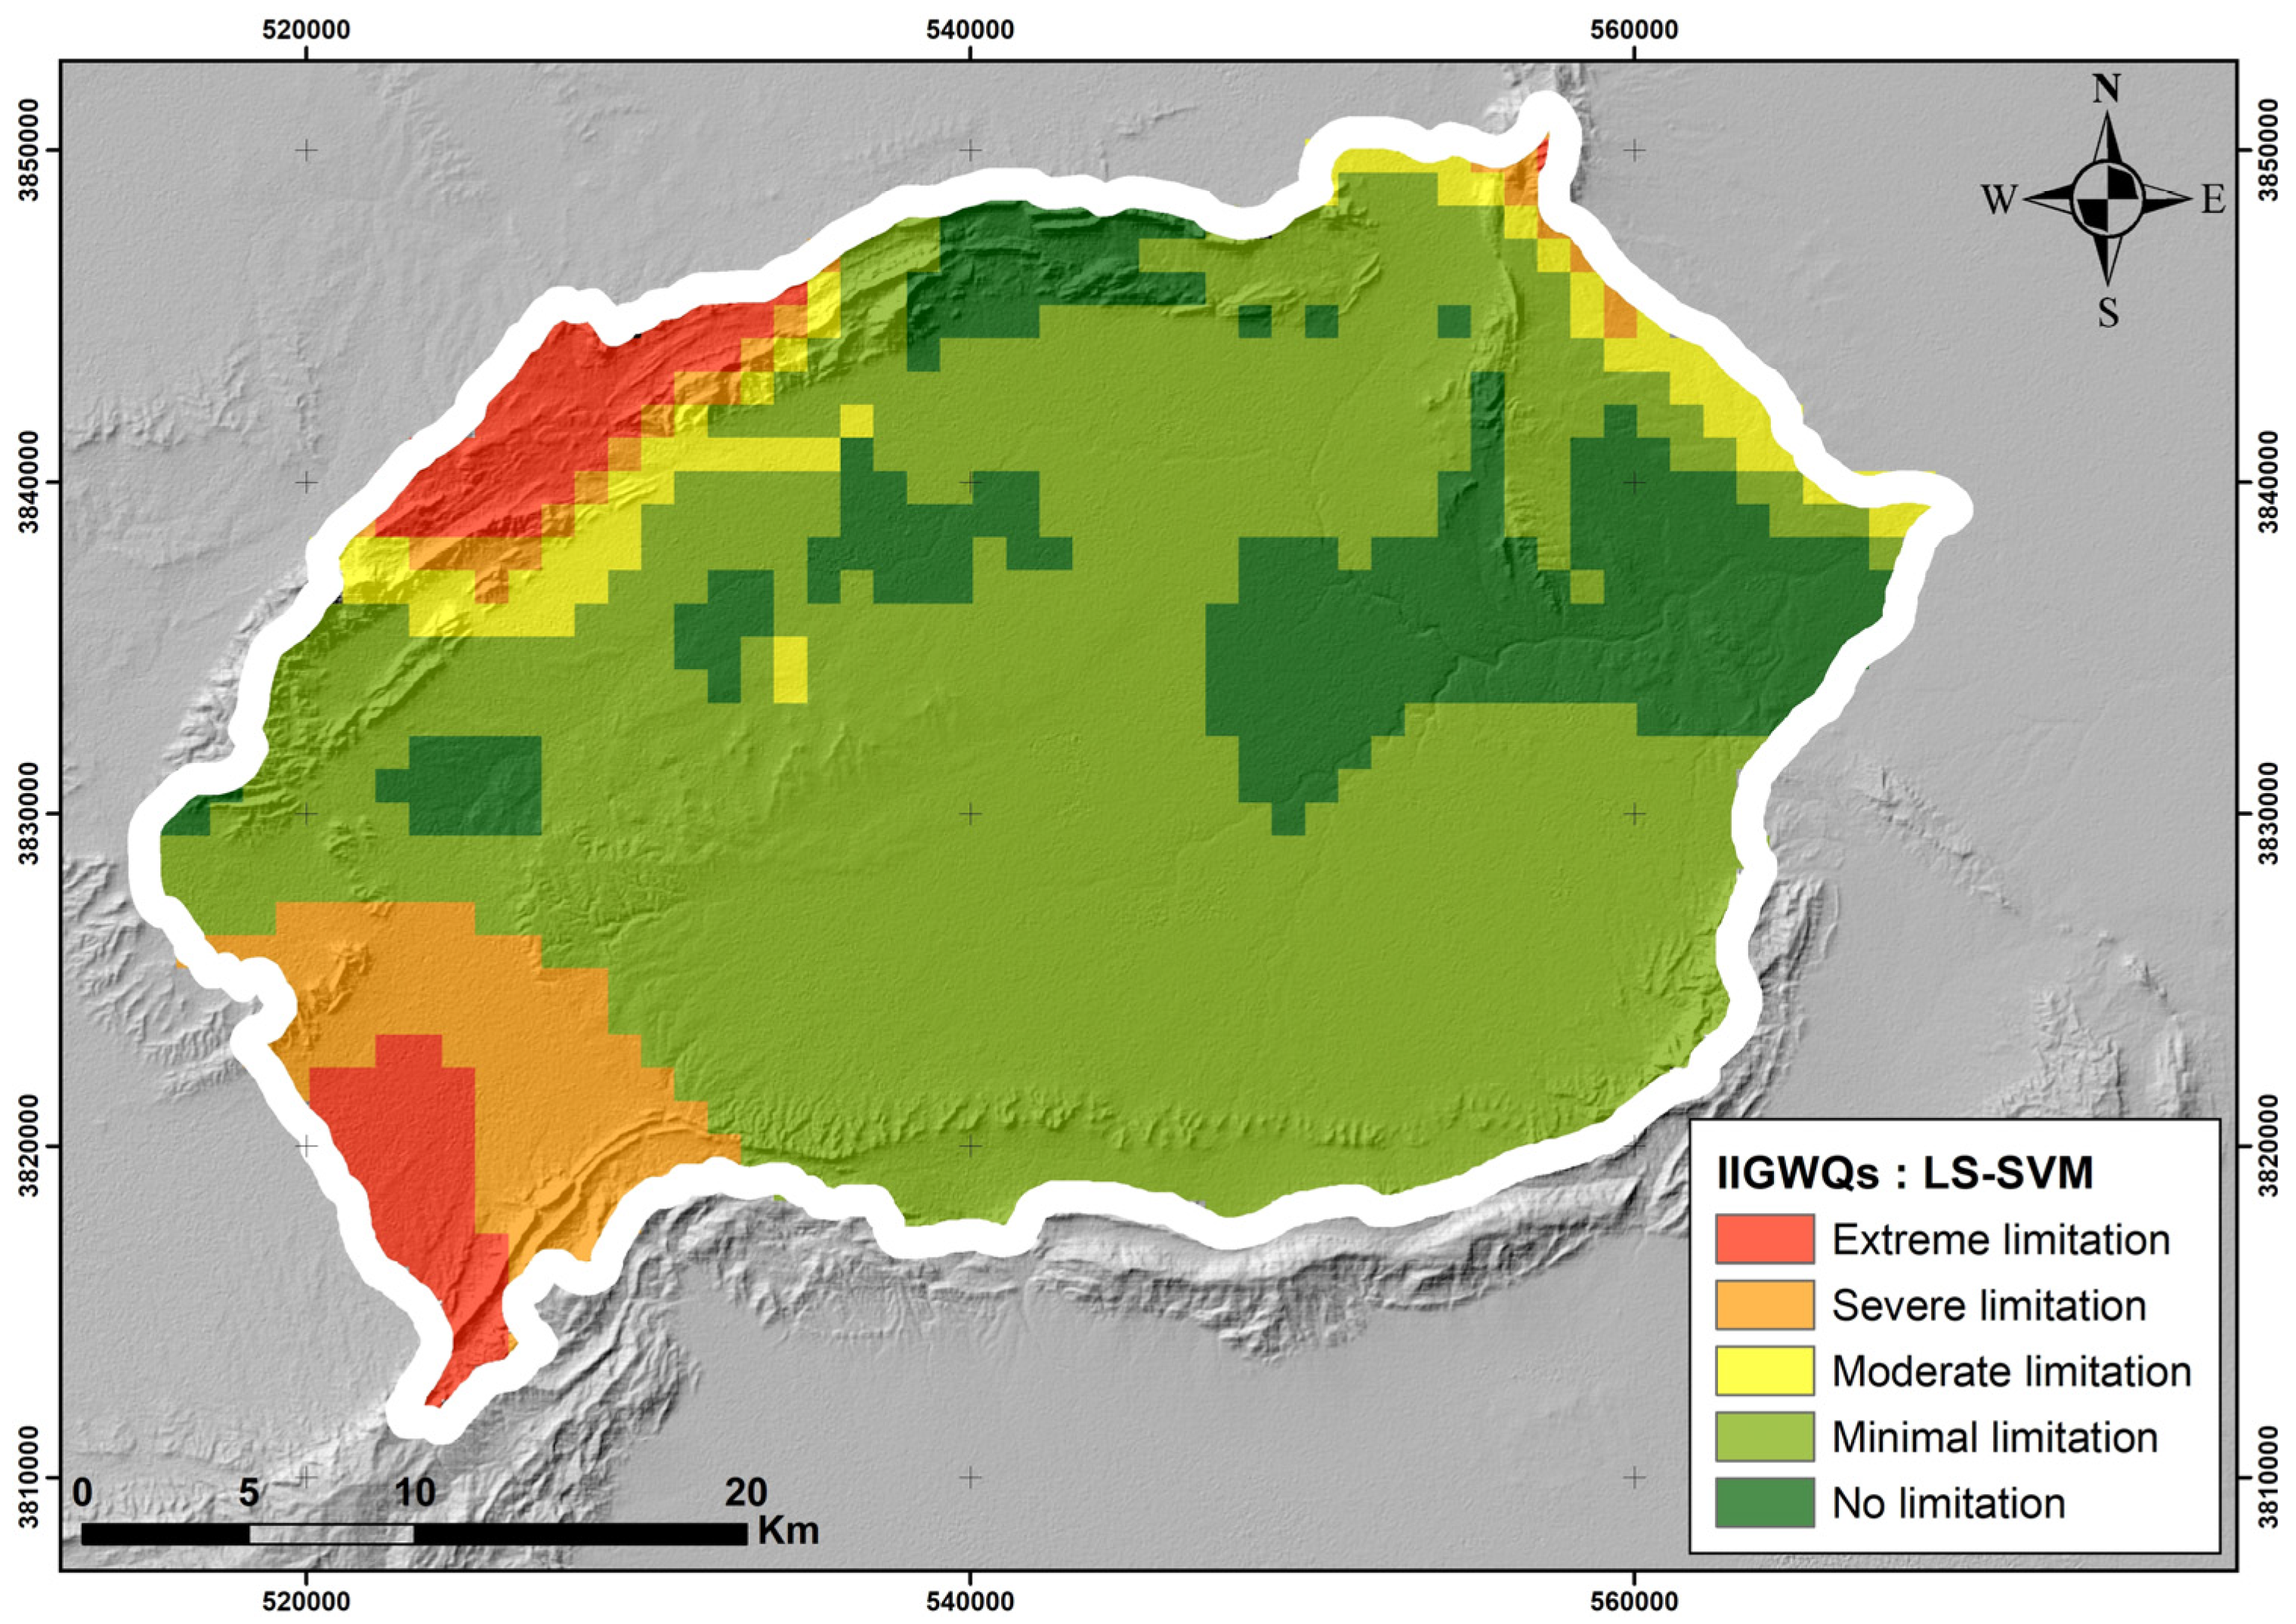
5.4.1. LS-SVM Model
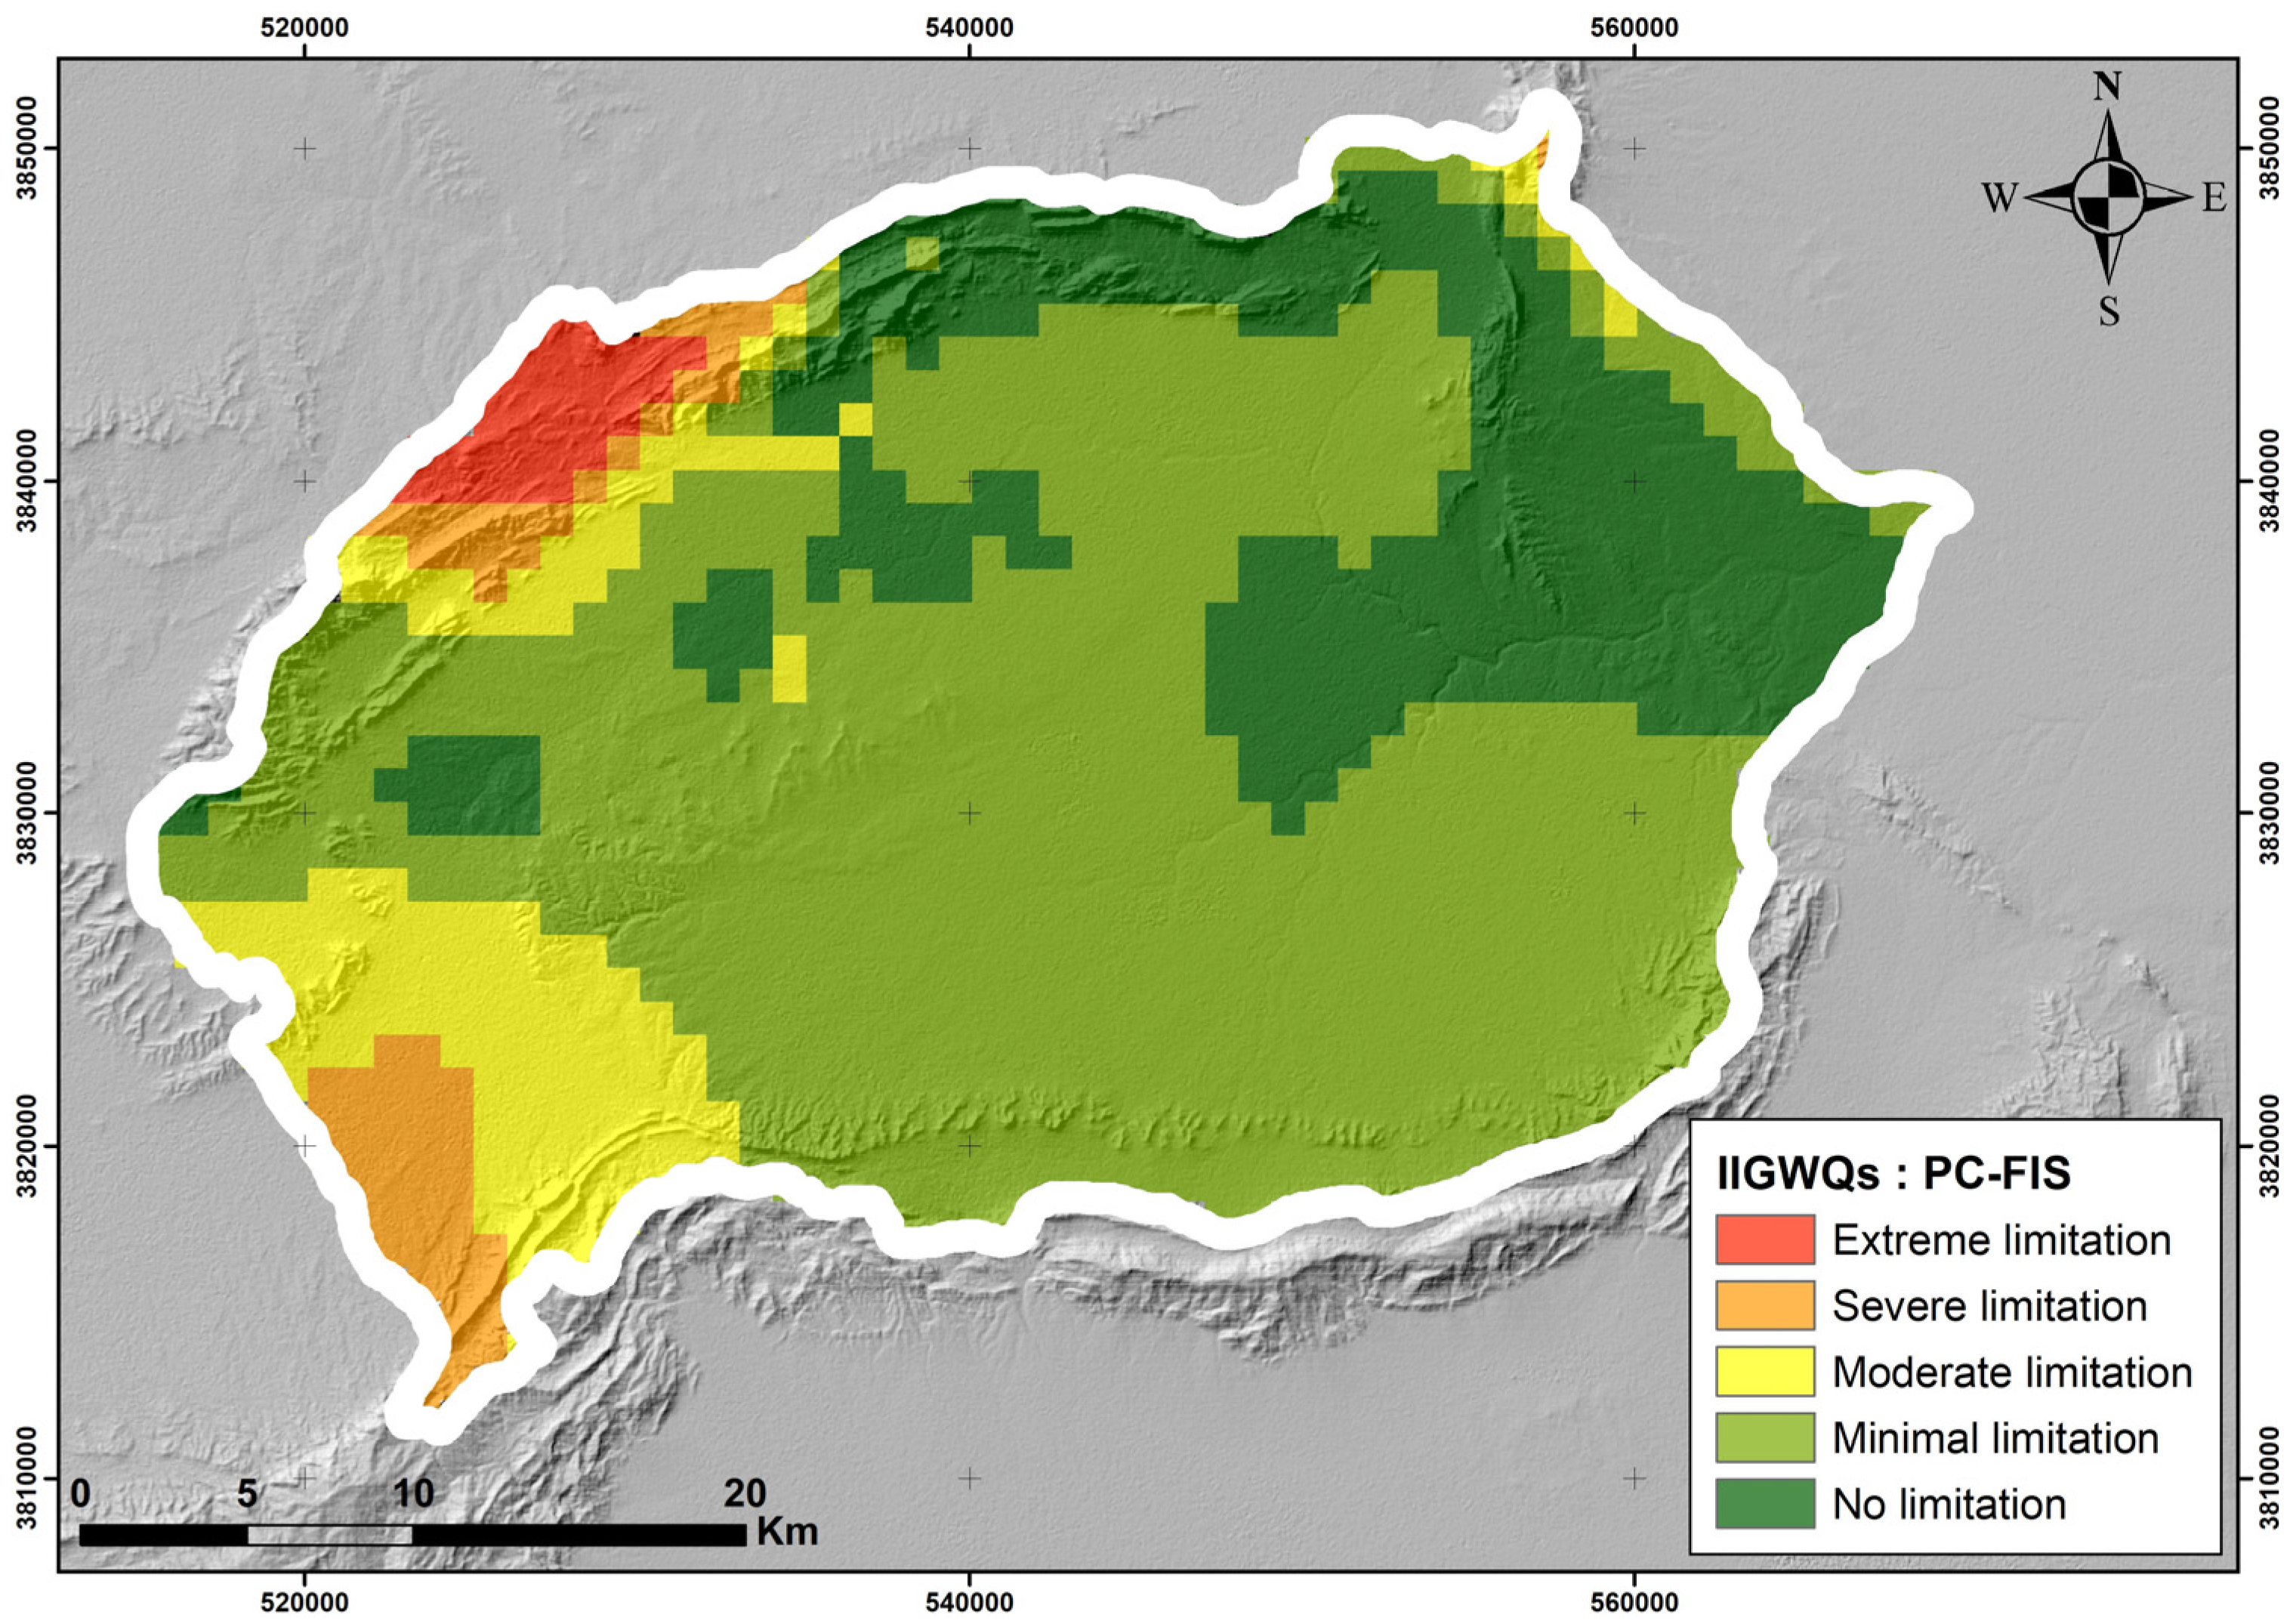
5.4.2. PC-FIS Model
5.4.3. The Relevance of Theory and Practice
6. Conclusions
Author Contributions
Funding
Data Availability Statement
Acknowledgments
Conflicts of Interest
References
- Velasco-Muñoz, J.F.; Aznar-Sánchez, J.A.; Belmonte-Ureña, L.J.; Román-Sánchez, I.M. Sustainable Water Use in Agriculture: A Review of Worldwide Research. Sustainability 2018, 10, 1084. [Google Scholar] [CrossRef]
- Mirzaei, A.; Saghafian, B.; Mirchi, A.; Madani, K. The Groundwater—Energy—Food Nexus in Iran’s Agricultural Sector: Implications for Water Security. Water 2019, 11, 1835. [Google Scholar] [CrossRef]
- Mancosu, N.; Snyder, R.L.; Kyriakakis, G.; Spano, D. Water Scarcity and Future Challenges for Food Production. Water 2015, 7, 975–992. [Google Scholar] [CrossRef]
- Msaddek, M.H.; Souissi, D.; Moumni, Y.; Chenini, I.; Bouaziz, N.; Dlala, M. Groundwater Potentiality Assessment in an Arid Zone Using a Statistical Approach and Multi-Criteria Evaluation, Southwestern Tunisia. Geol. Q. 2019, 63, 10. [Google Scholar] [CrossRef]
- Chenini, I.; Zghibi, A.; Msaddek, M.H.; Dlala, M. Groundwater Vulnerability Mapping in Urbanized Hydrological System Using Modified Drastic Model and Sensitivity Analysis. Environ. Eng. Geosci. 2018, 24, 293–304. [Google Scholar] [CrossRef]
- Ait Lemkademe, A.; El Ghorfi, M.; Zouhri, L.; Heddoun, O.; Khalil, A.; Maacha, L. Origin and Salinization Processes of Groundwater in the Semi-Arid Area of Zagora Graben, Southeast Morocco. Water 2023, 15, 2172. [Google Scholar] [CrossRef]
- El Amari, K.; Zouhri, L.; Benkaddour, A.; Toughzaoui, S.; Hibti, M.; Essarraj, S. Mineralization of water resources of Roc-Blanc watershed (Morocco) et al. Mineralization of water resources of Roc-Blanc watershed (Morocco). Environ. Earth Sci. 2021, 80, 479. [Google Scholar] [CrossRef]
- Zouhri, L.; El Amari, K.; Marier, D.; Benkaddour, A.; Hibti, M. Bacteriological and geochemical features of the groundwater resources: Kettara abandoned mine (Morocco). Environ. Pollut. 2019, 252, 1698–1708. [Google Scholar] [CrossRef]
- Moyé, J.; Picard-Lesteven, T.; Zouhri, L.; El Amari, K.; Hibti, M.; Benkaddour, A. Groundwater assessment and environmental impact in the abandoned mine of Kettara (Morocco). Environ. Pollut 2017, 231, 899–907. [Google Scholar] [CrossRef]
- Sebei, A.; Slama, T.; Helali, M.A. Hydrochemical Characterization and Geospatial Analysis of Groundwater Quality in Cap Bon Region, Northeastern Tunisia. Environ. Earth Sci. 2018, 77, 557. [Google Scholar] [CrossRef]
- Sattari, M.T.; Feizi, H.; Colak, M.S.; Ozturk, A.; Ozturk, F.; Apaydin, H. Surface water quality classification using data mining approaches: Irrigation along the Aladag River. Irrig. Drain. 2021, 70, 1227–1246. [Google Scholar] [CrossRef]
- Farid, H.U.; Ayub, H.U.; Khan, Z.M.; Ahmad, I.; Anjum, M.N.; Kanwar, R.M.A.; Mubeen, M.; Sakinder, P. Groundwater quality risk assessment using hydro-chemical and geospatial analysis. Environ. Dev Sustain. 2023, 25, 8343–8365. [Google Scholar] [CrossRef]
- Giri, A.; Bharti, V.K.; Kalia, S.; Kumar, K.; Khansu, M. Hydrochemical and quality assessment of irrigation water at the trans-himalayan high-altitude regions of Leh, Ladakh, India. Appl. Water Sci. 2022, 12, 197. [Google Scholar] [CrossRef]
- Laonamsai, J.; Pawana, V.; Chipthamlong, P.; Chomcheawchan, P.; Kamdee, K.; Kimmany, B.; Julphunthong, P. Groundwater Quality Variations in Multiple Aquifers: A Comprehensive Evaluation for Public Health and Agricultural Use. Geosciences 2023, 13, 195. [Google Scholar] [CrossRef]
- Ibrahim, H.; Yaseen, Z.M.; Scholz, M.; Ali, M.; Gad, M.; Elsayed, S.; Khadr, M.; Hussein, H.; Ibrahim, H.H.; Eid, M.H.; et al. Evaluation and Prediction of Groundwater Quality for Irrigation Using an Integrated Water Quality Indices, Machine Learning Models and GIS Approaches: A Representative Case Study. Water 2023, 15, 694. [Google Scholar] [CrossRef]
- Tziritis, E.; Sachsamanoglou, E.; Aschonitis, V. Assessing Groundwater Evolution with a Combined Approach of Hydrogeochemical Modelling and Data Analysis: Application to the Rhodope Coastal Aquifer (NE Greece). Water 2023, 15, 230. [Google Scholar] [CrossRef]
- Wang, Y.; Li, R.; Wu, X.; Yan, Y.; Wei, C.; Luo, M.; Xiao, Y.; Zhang, Y. Evaluation of Groundwater Quality for Drinking and Irrigation Purposes Using GIS-Based IWQI, EWQI and HHR Model. Water 2023, 15, 2233. [Google Scholar] [CrossRef]
- Li, P.; Wu, J.; Qian, H. Assessment of groundwater quality for irrigation purposes and identification of hydrogeochemical evolution mechanisms in Pengyang County, China. Environ. Earth Sci. 2013, 69, 2211–2225. [Google Scholar] [CrossRef]
- Asadi, E.; Isazadeh, M.; Samadianfard, S.; Ramli, M.F.; Mosavi, A.; Nabipour, N.; Shamshirband, S.; Hajnal, E.; Chau, K.-W. Groundwater Quality Assessment for Sustainable Drinking and Irrigation. Sustainability 2020, 12, 177. [Google Scholar] [CrossRef]
- Egbueri, J.C.; Agbasi, J.C. Performances of MLR, RBF-NN, and MLP-NN in the evaluation and prediction of water resources quality for irrigation purposes under two modeling scenarios. Geocarto Int. 2022, 37, 14399–14431. [Google Scholar] [CrossRef]
- Mukherjee, I.; Singh, U.K.; Chakma, S. Evaluation of groundwater quality for irrigation water supply using multi-criteria decision-making techniques and GIS in an agroeconomic tract of Lower Ganga basin, India. J. Environ. Manag. 2022, 309, 114691. [Google Scholar] [CrossRef] [PubMed]
- Al-Mashreki, M.H.; Eid, M.H.; Saeed, O.; Székács, A.; Szűcs, P.; Gad, M.; Abukhadra, M.R.; AlHammadi, A.A.; Alrakhami, M.S.; Alshabibi, M.A.; et al. Integration of Geochemical Modeling, Multivariate Analysis, and Irrigation Indices for Assessing Groundwater Quality in the Al-Jawf Basin, Yemen. Water 2023, 15, 1496. [Google Scholar] [CrossRef]
- Ahmed, M.T.; Hasan, M.Y.; Monir, M.U.; Samad, M.A.; Rahman, M.M.; Rifat, M.S.I.; Islam, M.N.; Khan, A.A.; Biswas, P.K.; Jamil, A.N. Evaluation of hydrochemical properties and groundwater suitability for irrigation uses in southwestern zones of Jashore, Bangladesh. Groundw. Sustain. Dev. 2020, 11, 100441. [Google Scholar] [CrossRef]
- Kouadri, S.; Pande, C.B.; Panneerselvam, B.; Moharir, K.N.; Elbeltagi, A. Prediction of irrigation groundwater quality parameters using ANN, LSTM, and MLR models. Environ. Sci. Pollut. Res. 2022, 29, 21067–21091. [Google Scholar] [CrossRef] [PubMed]
- Islam, M.S.; Mostafa, M.G. Development of an integrated irrigation water quality index (IIWQIndex) model. Water Supply 2022, 22, 2322–2337. [Google Scholar] [CrossRef]
- Khoshneviszadeh, M.; Sakhteman, A. Exploring quantitative structure–activity relationship (QSAR) models for some biologically active catechol structures using PC-LS-SVM and PC-ANFIS. Appl. Biol. Chem. 2016, 59, 433–441. [Google Scholar] [CrossRef]
- Msaddek, M.H.; Moumni, Y.; Ayari, A.; El May, M.; Chenini, I. Artificial intelligence modelling framework for mapping groundwater vulnerability of fractured aquifer. Geocarto Int. 2022, 37, 10480–10510. [Google Scholar] [CrossRef]
- Singha, S.; Pasupuleti, S.; Singha, S.S.; Singh, R.; Kumar, S. Prediction of groundwater quality using efficient machine learning technique. Chemosphere 2021, 276, 130265. [Google Scholar] [CrossRef]
- Lap, B.Q.; Du Nguyen, H.; Hang, P.T.; Phi, N.Q.; Hoang, V.T.; Linh, P.G.; Hang, B.T.T. Predicting water quality index (WQI) by feature selection and machine learning: A case study of An Kim Hai irrigation system. Ecol. Inform. 2023, 74, 101991. [Google Scholar] [CrossRef]
- El Bilali, A.; Taleb, A.; Brouziyne, Y. Groundwater quality forecasting using machine learning algorithms for irrigation purposes. Agricultural Water Manag. 2021, 245, 106625. [Google Scholar] [CrossRef]
- Ben Alaya, M.; Saidi, S.; Zemni, T.; Zargouni, F. Suitability assessment of deep groundwater for drinking and irrigation use in the Djeffara aquifers (Northern Gabes, south-eastern Tunisia). Environ. Earth Sci. 2014, 71, 3387–3421. [Google Scholar] [CrossRef]
- Ayari, I.; Ben Alaya, M.; Zammouri, M. Hydrogeochemical characterization and suitability of groundwater for drinking and irrigation in Menzel Bourguiba aquifers (Northeastern Tunisia). Environ. Monit. Assess. 2022, 194, 524. [Google Scholar] [CrossRef] [PubMed]
- Najwa Mohd Rizal, N.; Hayder, G.; Mnzool, M.; Elnaim, B.M.E.; Mohammed, A.O.Y.; Khayyat, M.M. Comparison between Regression Models, Support Vector Machine (SVM), and Artificial Neural Network (ANN) in River Water Quality Prediction. Processes 2022, 10, 1652. [Google Scholar] [CrossRef]
- Haghiabi, A.H.; Nasrolahi, A.H.; Parsaie, A. Water quality prediction using machine learning methods. Water Qual. Res. J. 2018, 53, 3–13. [Google Scholar] [CrossRef]
- Nadiri, A.A.; Barzegar, R.; Sadeghfam, S.; Rostami, A.A. Developing a Data-Fused Water Quality Index Based on Artificial Intelligence Models to Mitigate Conflicts between GQI and GWQI. Water 2022, 14, 3185. [Google Scholar] [CrossRef]
- Berhanu, K.G.; Hatiye, S.D.; Lohani, T.K. Coupling support vector machine and the irrigation water quality index to assess groundwater quality suitability for irrigation practices in the Tana sub-basin, Ethiopia. Water Pract. Technol. 2023, 18, 884–900. [Google Scholar] [CrossRef]
- Chenini, I.; Farhat, B.; Ben Mammou, A. Identification of major sources controlling groundwater chemistry from a multilayered aquifer system. Chem. Speciat. Bioavailab. 2010, 22, 183–189. [Google Scholar] [CrossRef]
- Ncibi, K.; Mastrocicco, M.; Colombani, N.; Busico, G.; Hadji, R.; Hamed, Y.; Shuhab, K. Differentiating Nitrate Origins and Fate in a Semi-Arid Basin (Tunisia) via Geostatistical Analyses and Groundwater Modelling. Water 2022, 14, 4124. [Google Scholar] [CrossRef]
- Haji, T.; Zouaghi, T.; Boukadi, N. The role of inherited structures in the evolution of the Meknassy Basin, Central Tunisia, based on geological–geophysical transects. J. Afr. Earth Sci. 2014, 96, 51–59. [Google Scholar] [CrossRef]
- Msaddek, M.H.; Moumni, Y.; Chenini, I.; Mercier, E.; Dlala, M. Fractures network analysis and interpretation in car-bonate rocks using a multi-criteria statistical approach. Case study of Jebal Chamsi and Jebal Belkhir, South-western part of Tunisia. J. Afr. Earth Sci. 2016, 123, 99–109. [Google Scholar] [CrossRef]
- Ahmadi, R.; El May, M.; Dlala, M. Ultimate slope design in open pit phosphate mine using geological and geomechanical analysis: Case study of Jebel Jebbeus. Arab. J. Geosci. 2019, 12, 280. [Google Scholar] [CrossRef]
- Haji, T.A.; Moumni, Y.; Msaddek, M.H. Fault-style analysis and seismic interpretation: Implications for the structural issues of the South-eastern Atlas in Tunisia. J. Afr. Earth Sci. 2020, 172, 103962. [Google Scholar] [CrossRef]
- Meireles, A.C.M.; Andrade, E.M.D.; Chaves, L.C.G.; Frischkorn, H.; Crisostomo, L.A. A new proposal of the classification of irrigation water. Rev. Ciência Agronômica 2010, 41, 349–357. [Google Scholar] [CrossRef]
- Abbasnia, A.; Yousefi, N.; Mahvi, A.H.; Nabizadeh, R.; Radfard, M.; Yousefi, M.; Alimohammadi, M. Evaluation of groundwater quality using water quality index and its suitability for assessing water for drinking and irrigation purposes: Case study of Sistan and Baluchistan province (Iran). Hum. Ecol. Risk Assess. Int. J. 2019, 25, 988–1005. [Google Scholar] [CrossRef]
- Leong, W.C.; Bahadori, A.; Zhang, J.; Ahmad, Z. Prediction of water quality index (WQI) using support vector machine (SVM) and least square-support vector machine (LS-SVM). Int. J. River Basin Manag. 2021, 19, 149–156. [Google Scholar] [CrossRef]
- Tabaraki, R.; Khodabakhshi, M.; Fatahi, G. Quantitative structure-critical micelle concentration modeling of anionic gemini surfactants, comparison of MLR, PLS, WNN, and ANFIS models with eigenvalue and correlation ranking methods. J. Iran. Chem. Soc. 2021, 18, 2703–2711. [Google Scholar] [CrossRef]


| GWQi | ElC (µs/cm) | SARIndex | Na | Cl | HCO3 |
|---|---|---|---|---|---|
| 0–35 | ElC < 200 or ElC ≥ 3000 | SARIndex > 2 or SARIndex ≥ 12 | Na < 2 or SARIndex ≥ 9 | Cl < 1 or Cl ≥ 10 | HCO3 < 1 or HCO3 ≥ 8.5 |
| 35–60 | 1500 ≤ ElC < 3000 | 6 ≤ SAR < 12 | 6 ≤ Na < 9 | 7 ≤ Cl < 10 | 4.5 ≤ HCO3 < 8.5 |
| 60–85 | 750 ≤ ElC < 1500 | 3 ≤ SAR < 6 | 3 ≤ Na < 6 | 4 ≤ Cl < 7 | 1.5 ≤ HCO3 < 4.5 |
| 85–100 | 200 ≤ ElC < 750 | 2 ≤ SAR < 3 | 2 ≤ Na < 3 | 1 ≤ Cl < 4 | 1 ≤ HCO3 < 1.5 |
| TDS (mg/L) | T° (°C) | pH | Ca (mg/L) | Mg (mg/L) | Na (mg/L) | K (mg/L) | HCO3 (mg/L) | Cl (mg/L) | SO4 (mg/L) | ElC (µs/cm) | |
|---|---|---|---|---|---|---|---|---|---|---|---|
| Meknassy Basin (53 Samples) | |||||||||||
| Min. | 1398 | 18.7 | 7.50 | 116.00 | 83.00 | 128.00 | 10.00 | 137.00 | 169.00 | 475.00 | 978.60 |
| Max. | 4469 | 39.8 | 8.30 | 578.00 | 371.00 | 877.00 | 33.00 | 723.00 | 909.00 | 2284.00 | 3128.30 |
| Mean | 2399.4 | 24.2 | 7.92 | 239.62 | 145.04 | 305.94 | 17.74 | 232.70 | 399.92 | 1058.43 | 1679.58 |
| Standard Deviation | 826.92 | 4.36 | 0.19 | 105.91 | 58.32 | 176.30 | 6.24 | 92.40 | 182.27 | 444.70 | 578.84 |
| TDS | T° | pH | ElC | Ca | Mg | Na | K | HCO3 | Cl | SO4 | |
|---|---|---|---|---|---|---|---|---|---|---|---|
| TDS | 1 | ||||||||||
| T° | 0.28 | 1 | |||||||||
| pH | −0.03 | −0.63 | 1 | ||||||||
| ElC | 0.99 | 0.21 | 0.02 | 1 | |||||||
| Ca | 0.78 | 0.69 | −0.30 | 0.7 | 1 | ||||||
| Mg | 0.53 | −0.15 | 0.28 | 0.5 | 0.28 | 1 | |||||
| Na | 0.83 | 0.08 | 0.00 | 0.9 | 0.48 | 0.16 | 1 | ||||
| K | 0.60 | 0.09 | 0.04 | 0.6 | 0.42 | 0.27 | 0.57 | 1 | |||
| HCO3 | 0.17 | −0.49 | 0.30 | 0.2 | −0.16 | 0.44 | 0.1 | 0.14 | 1 | ||
| Cl | 0.75 | −0.16 | 0.26 | 0.8 | 0.32 | 0.57 | 0.77 | 0.41 | 0.29 | 1 | |
| SO4 | 0.92 | 0.52 | −0.19 | 0.9 | 0.89 | 0.4 | 0.68 | 0.53 | −0.07 | 0.46 | 1 |
| IWQIndex | SARIndex | SSPIndex | PSIndex | KIndex | RSCIndex | |
|---|---|---|---|---|---|---|
| Min. | 29.73 | 0.19 | 3.87 | −0.78 | 0.11 | −9.89 |
| Max. | 99.62 | 8.37 | 66.46 | 12.18 | 2.05 | 2.68 |
| Mean | 80.46 | 3.12 | 48.61 | 3.48 | 1.10 | −2.32 |
| Standard Deviation | 22.90 | 2.05 | 10.47 | 3.21 | 0.48 | 2.52 |
| IIGWQIs | Class | Water Category | Number of Samples | Percentage of Samples (%) |
|---|---|---|---|---|
| IWQIndex | 0–40 | Extreme limitation | 8 | 15.09 |
| 40–55 | Severe limitation | 3 | 5.66 | |
| 55–70 | Moderate limitation | 1 | 1.89 | |
| 70–85 | Minimal limitation | 6 | 11.32 | |
| 85–100 | No limitation | 35 | 66.04 | |
| SARIndex | >26 | Unfavorable | 29 | 54.72 |
| 18–26 | Suspicious | 16 | 30.19 | |
| 10–18 | Favorable | 8 | 15.09 | |
| <10 | Excellent | 0 | 0.00 | |
| SSPIndex | >60 | Insecure | 4 | 7.55 |
| <60 | Secure | 49 | 92.45 | |
| PSIndex | >5 | Suspicious | 18 | 33.96 |
| 3–5 | Favorable | 24 | 45.28 | |
| <3 | Excellent | 11 | 20.76 | |
| KIndex | >1 | Unfavorable | 10 | 18.87 |
| <1 | Favorable | 43 | 81.13 | |
| RSCIndex | >2.5 | Insecure | 6 | 11.32 |
| 1.25–2.5 | Average | 37 | 69.81 | |
| <1.25 | Secure | 10 | 18.87 |
| IIGWQI Indexes | Simulation Models | Performance Criteria | ||||
|---|---|---|---|---|---|---|
| NSE | MAD | R2 | RMSE | |||
| Training sequences | IWQIndex | LS-SVM | 0.96 | 0.59 | 0.96 | 1.50 |
| PC-FIS | 0.97 | 1.83 | 0.98 | 2.51 | ||
| SARIndex | LS-SVM | 0.89 | 0.23 | 0.92 | 0.50 | |
| PC-FIS | 0.93 | 0.14 | 0.94 | 0.37 | ||
| SSPIndex | LS-SVM | 0.15 | 7.01 | 0.67 | 9.12 | |
| PC-FIS | 0.68 | 4.00 | 0.69 | 5.70 | ||
| PSIndex | LS-SVM | 0.95 | 0.23 | 0.97 | 0.51 | |
| PC-FIS | 0.97 | 0.02 | 0.98 | 0.23 | ||
| KIndex | LS-SVM | 0.24 | 0.14 | 0.49 | 0.37 | |
| PC-FIS | 0.42 | 0.08 | 0.47 | 0.29 | ||
| RSCIndex | LS-SVM | 0.97 | 0.00 | 0.98 | 0.15 | |
| PC-FIS | 0.94 | 0.20 | 0.95 | 0.45 | ||
| Testing sequences | IWQIndex | LS-SVM | 0.68 | 8.43 | 0.75 | 12.38 |
| PC-FIS | 0.94 | 3.04 | 0.96 | 4.47 | ||
| SARIndex | LS-SVM | 0.18 | 1.43 | 0.35 | 2.16 | |
| PC-FIS | 0.92 | 0.20 | 0.93 | 0.39 | ||
| SSPIndex | LS-SVM | −0.02 | 8.85 | 0.52 | 10.92 | |
| PC-FIS | 0.61 | 4.49 | 0.67 | 5.89 | ||
| PSIndex | LS-SVM | 0.57 | 1.33 | 0.71 | 1.86 | |
| PC-FIS | 0.98 | 0.03 | 0.99 | 0.05 | ||
| KIndex | LS-SVM | −0.07 | 0.26 | 0.48 | 0.33 | |
| PC-FIS | 0.66 | 0.08 | 0.68 | 0.16 | ||
| RSCIndex | LS-SVM | −0.18 | 1.88 | 0.60 | 2.56 | |
| PC-FIS | 0.96 | 0.17 | 0.97 | 0.27 | ||
Disclaimer/Publisher’s Note: The statements, opinions and data contained in all publications are solely those of the individual author(s) and contributor(s) and not of MDPI and/or the editor(s). MDPI and/or the editor(s) disclaim responsibility for any injury to people or property resulting from any ideas, methods, instructions or products referred to in the content. |
© 2023 by the authors. Licensee MDPI, Basel, Switzerland. This article is an open access article distributed under the terms and conditions of the Creative Commons Attribution (CC BY) license (https://creativecommons.org/licenses/by/4.0/).
Share and Cite
Msaddek, M.H.; Moumni, Y.; Zouhri, L.; Chenini, I.; Zghibi, A. Groundwater Quality Evaluation of Fractured Aquifers Using Machine Learning Models and Hydrogeochemical Approaches to Sustainable Water-Irrigation Security in Arid Climate (Central Tunisia). Water 2023, 15, 3332. https://doi.org/10.3390/w15193332
Msaddek MH, Moumni Y, Zouhri L, Chenini I, Zghibi A. Groundwater Quality Evaluation of Fractured Aquifers Using Machine Learning Models and Hydrogeochemical Approaches to Sustainable Water-Irrigation Security in Arid Climate (Central Tunisia). Water. 2023; 15(19):3332. https://doi.org/10.3390/w15193332
Chicago/Turabian StyleMsaddek, Mohamed Haythem, Yahya Moumni, Lahcen Zouhri, Ismail Chenini, and Adel Zghibi. 2023. "Groundwater Quality Evaluation of Fractured Aquifers Using Machine Learning Models and Hydrogeochemical Approaches to Sustainable Water-Irrigation Security in Arid Climate (Central Tunisia)" Water 15, no. 19: 3332. https://doi.org/10.3390/w15193332
APA StyleMsaddek, M. H., Moumni, Y., Zouhri, L., Chenini, I., & Zghibi, A. (2023). Groundwater Quality Evaluation of Fractured Aquifers Using Machine Learning Models and Hydrogeochemical Approaches to Sustainable Water-Irrigation Security in Arid Climate (Central Tunisia). Water, 15(19), 3332. https://doi.org/10.3390/w15193332