Article

Origin and Salinization Processes of Groundwater in the Semi-Arid Area of Zagora Graben, Southeast Morocco

1
Geology and Sustainable Mining Institute, Mohammed VI Polytechnic University, Benguerir 43150, Morocco
2
Lab Géoressources (L3G), Cadi Ayyad University, Marrakech 40000, Morocco
3
AGHYLE, Institut Polytechnique UniLaSalle Beauvais, 19 Rue Pierre Waguet, 60000 Beauvais, France
4
Resources Valorization, Environment and Sustainable Development Research Team (RVESD), Department of Mines, Mines School of Rabat, Ave Hadj Ahmed Cherkaoui, BP 753, Agdal, Rabat 10090, Morocco
5
Managem Group, Twin Center, Boulevard Zerktouni, Casablanca 20000, Morocco
*
Author to whom correspondence should be addressed.
Water 2023, 15(12), 2172; https://doi.org/10.3390/w15122172
Submission received: 21 April 2023 / Revised: 27 May 2023 / Accepted: 5 June 2023 / Published: 8 June 2023
(This article belongs to the Special Issue Impact of Mining Activities on the Groundwater Resources)

Abstract

:
Located in the southeastern region of Morocco, the Zagora area mainly relies on groundwater as a source of water supply. However, this groundwater is often of concern, due to the limited recharge and unfavorable geological conditions for the development of the aquifer. Despite this, private wells in the Zagora ditch reveal relatively rich water resources. Geochemical and isotopic studies were conducted in the area to understand the origin of the groundwater and its salinity, aiding in informed water management strategies to assist in better planning and regulation of well construction, as well as in mitigating the impacts of high salinity on local water supply and agricultural systems. The results show that the water quality varies, with some wells having conductivity values in excess of 5 mS/cm. Most groundwater samples have high salinity and low pH due to the CO2 dissolved in groundwater. Geochemical analysis indicated two chemical facies: chloride–sulfate calcic/magnesic and bicarbonate calcic/magnesic. The presence of Na+ and Cl indicated that the origin of these two elements in these waters was the dissolution of halite, with some samples showing an enrichment of Na+ compared to Cl. This could be attributed to cation exchange. The concentration of Ca2+ and HCO3 suggested that their origin is the dissolution of calcite and the weathering of calcium silicate minerals such as plagioclase. The isotopic analysis showed that the δ18O values ranged from −10.98‰ to −8.54‰, and δ2H values ranged from −75.9‰ to −62.3‰. This indicated that the groundwater originated from the High Atlas with a recharge altitude between 2600 m and 2800 m. The groundwater flows into the graben through fissures and regional fault networks.

1. Introduction

Access to clean and safe drinking water is a basic necessity for human survival but, unfortunately, it is not always available in many arid and semi-arid regions [1]. These regions are particularly vulnerable to the variability induced by climate change [2,3,4,5], including long periods of drought and the reduction and salinization of water resources [6,7]. An example of a region that is facing challenges with their water resources in an arid climate is southeastern Morocco [8,9,10]. Indeed, climatic models and current trends in rainfall predict a significant decrease in precipitation in the region [11,12,13], placing enormous pressure on the already-scarce water resources. This situation is further exacerbated by the significant increase in population and sustained economic growth.
The region of Zagora is known for its agricultural and mining potential, with an abundance of mineralized veins (such as Cu, Ba and Pb) [14,15] and intensive agriculture, such as watermelon farming [16,17]. However, despite the scarcity of water resources in the region, agriculture and mining activities heavily rely on water availability, which conflicts with the local population’s demands for drinking and irrigation water. As a result, groundwater levels have severely dropped, and water quality has deteriorated [17,18]. The hydrogeological context of the study area is poorly understood. Nevertheless, it has been discovered through some recently drilled boreholes by private proprietors that groundwater flows are abundant in the faults within the graben Zagora. These groundwaters are characterized by high salinity and the presence of dissolved CO2. The origin of the groundwater and its mineralization are still unknown.
Saline groundwater is present in several areas of Morocco. It has been associated with marine sedimentary rocks and Triassic formations in central Morocco [8,19,20]. Recent studies have shown that the composition of the Messinian formation in the northeastern region of Morocco is a major contributor to groundwater salinity [21,22]. Similar problems have been identified in other regions of Morocco, including the Souss–Massa plain [23], Haouzia [24], and the eastern Haouz plain [25]. In arid regions, the main sources of dissolved substances in groundwater are typically mineral weathering in the soil and the surrounding geological structures [26,27,28,29].
This study aims to understand water resources in the graben of Zagora, focusing on identifying the origin of the groundwater, its mineralization processes, and its recharge mode, using geochemical and isotopic tools in conjunction with local geological and structural aspects.

2. Geological Framework

The Zagora graben is located in the eastern Anti-Atlas (Figure 1). It is oriented NE–SW, with a length of about 120 km from Zagora to rich Merzoug localities.
The eastern Anti-Atlas comprises a Precambrian basement and a Paleozoic cover, giving rise to two inliers known as Saghro and Ougnat. These inliers are geographically separated from the High Atlas by Cretaceous basins. The surrounding areas of the Saghro-Ougnat axis have thick sedimentary layers of Paleozoic age that extend over 4–5 km, forming the Maider and Tafilalet basins on the eastern and southern sides, respectively.
The tectonic history of the eastern Anti-Atlas is characterized by two major events that resulted in oriented structures trending in the Anti-Atlasic E–W and Ougartien NW–SE directions. These events affected the Tazzarine, Maider, and Tafilalet basins. During the Variscan orogeny, the Precambrian basement experienced a compression resulting in the folding of the overlying Paleozoic cover. The Adoudounian event resulted in disharmony, leading to the formation of a plastic layer that facilitated detachment folds. Subsequently, the Alpine orogeny led to sporadic refolding of the folds. Similar to the High Atlas, the Anti-Atlas foreland belt experienced uplift due to the N–S-trending Alpine compression [14,15,30]. The Paleozoic sedimentary layers were formed in a trifling depth basin and consist of Lower Cambrian shales and conglomerates, followed by alternating shales and sandstone from the Middle Cambrian, Ordovician, and Silurian periods. This uniform sequence of terrestrial deposits is covered by a Devonian carbonate platform that includes a carboniferous layer of eroded material. These layers were subjected to stretching during the Middle Devonian to the Upper Devonian era, according to [14], and later deformed by Variscan compression. This compression was primarily directed northeast to southwest and indicates the reactivation of normal faults [31].
The study area is located in the western region of the Maider basin, situated southeast of Jbel Saghro. It falls within the Maider and Tafilalet mineral-rich regions, consisting of Lower and Upper Paleozoic strata. The Paleozoic layers are mostly level, but they have been disrupted by numerous faults and are characterized by extensive folded structures situated along fault lines. Additionally, the terrain has been intruded upon by a series of basic dikes, which are oriented in three distinct directions: E–W, NE–SW, and NW–SE [15].

2.1. Field Investigations and Synthetic Map Analysis

Field mapping in the area of the Zagora graben has highlighted a precise structural map. This map shows two major structural directions (Figure 1):
  • The E–W system, developed exclusively in the northeastern part of the study area. This system of fractures affects mainly the sandstone and the pyelitic facies of the second Jbel Bani.
  • The NE–SW system, which is remarkably pronounced within the graben of Zagora. These fractures are characterized with a thickness ranging from 0.5 m to 2 m and are usually filled with quartz-carbonates and, occasionally, with iron oxides.
Field findings showed that the study area is mainly affected by 70° N to 115° N striking faults. Dipping at 45° to 72° southwards, these faults show a dextral strike–slip movement. The relative chronology of these two families of fracture confirms that the NE–SW-trending fractures appeared to be the most recent, as they intersected the longest and oldest E–W fractures.

2.2. Litho-Structural Mapping

Fieldwork enabled the identification of lithological units, including the second Bani sandstones and the pelitic facies in the southeastern part of the Zagora graben and the Lower Devonian marly limestones and sandstones and the Upper Visean shales in the northeastern of the study area; the black pyritic black schist and the gray pelitic rocks of a Silurian age are exposed in the northwestern and northeastern parts of the area. Doleritic dykes of the Jurassic age, located in the northeastern part of the area, are oriented E–W and are more than 250 m long and about 6 m thick. They are hosted in the second J. Bani sandstones. Examination of samples showed that these dykes are characterized by the presence of centimetric enclaves with quartz filling, feldspars, and calcite with a micro-grained texture. A dissemination of pyrite is very abundant in these dolerites, with traces of chalcopyrite. These doleritic dykes show an advanced alteration materialized by a total sericitization of the plagioclases and a chloritization of the biotite; the clinopyroxenes are totally transformed to clinochlore and sericite minerals, which are easily identifiable by the naked eye. However, the E–W-oriented structures contain lenticular-type veins that reach about 5 km in length, with dips ranging from 43° to 72° to the south and north-northwest (Figure 1). These major faults generally have a vertical throw of up to more than 250 m in depth, as shown in (Figure 2), locally placing Ordovician sandstones from the second Bani formation, which is overlain by the pelitic facies. These faults host, generally, copper and lead ore in a barite and quarzo–carbonate gangue with a lenticular form.

3. Materials and Methods

Hydrogeochemical and isotopic methods are commonly utilized by hydrogeologists to gain insights into the recharge sources and the relationships between different components of an aquifer system. For this study, 17 groundwater samples were collected using an SP16 water sampler and their physico–chemical parameters, such as pH, conductivity, and temperature, were measured in the field using an HI98494 Multiparamètre portatif pH/EC/LDO (Figure 3). The cation and trace element analyses were conducted using an ICP-MS Thermo Scientific Neoma Multicollector ICP-MS, while an ion chromatography Dionex Integrion HPIC was utilized for anions. To ensure the accuracy of the results, the samples were analyzed twice, and the values were cross-checked against the standards. The geochemical data were then converted into their equivalent or milli equivalence units to facilitate interpretation. To calculate the charge balance error, the difference between the sum of major cations (Σ cation) and anions (Σ anions) was determined and divided by the sum of all major ions. The acceptable percentage of error for water analysis typically ranges from ±1% to ±10%. Table 1 presents the results of the groundwater analysis.
The stable isotope composition of water was analyzed using a Finnigan Delta+ mass spectrometer coupled with a Finnigan equilibration unit (CO2, H2) to determine the online O and H isotopic composition. The results were reported in d-notation, which represents the per mil deviation of the measured isotopic ratio relative to the Vienna Standard Mean Ocean Water (V-SMOW) international standard. The uncertainty for δ18O was better than 0.2%, while the uncertainty for δ2H was better than 2%.

4. Results and Discussion

4.1. Hydrochemical Facies

The hydrochemical facies refer to distinct groundwater bodies within an aquifer that vary in their geochemical properties [32]. This variation is influenced by several factors, such as how quickly substances dissolve in water, the interaction between rocks and water, the geological conditions affecting water movement, and the sources of contamination. A commonly utilized tool in the investigation of groundwater quality and its geochemical features is the Piper diagram [19,33]. This graphical representation is renowned for its effectiveness in aiding the understanding of the characteristics of groundwater.
The Piper diagram shown in Figure 4 displays two chemical facies, chloride–sulfate calcic/magnesic and bicarbonate calcic/magnesic, with a tendency toward both chloride and bicarbonates in the anions subtriangle and a tendency toward sodium potassium in the cations subtriangle.

4.2. Principal Component Analysis

A principal component analysis was performed using nine parameters: conductivity, pH, Cl, Mg2+, Ca2+, Na+, SO42−, K+, and HCO3 [34,35]. The results (Figure 5a) showed that the first two axes, F1 and F2, explained 80.94% of the overall variance in the water samples. The first axis accounted for 57.17%, while the second axis explained 23.79%. The first axis (F1) is predominantly characterized by seven parameters that exhibited a strong positive correlation, including conductivity, Cl, Mg2+, Na+, SO42−, and K+. Furthermore, this axis showed an increasing value gradient of these parameters from the left side to the right side. On the other hand, the second axis (F2) was characterized by a positive loading of pH and NO3 and a negative loading for Ca2+, HCO3. Figure 4 also shows a strong correlation between Ca2+ and HCO3.
The factorial diagram F1 – F2 (Figure 5b), which plots the individuals in the dataset, displays a degree of variation in the water samples. However, the analysis was able to identify two main groups within the dataset despite this dispersion: The first group consisted of less mineralized waters, with an average electric conductivity of 1330 µS/cm, while the second group comprised saline groundwater, with an average electric conductivity of 2850 µS/cm. This indicated that even though the dataset was spread out, there were still clear patterns and clusters within it that could be identified through analysis. It is worth mentioning that two water samples, BH8 and BH11, exhibited distinctive features that differed from the two previously identified groups. BH8 displayed intermediary characteristics between the two groups, whereas BH11 stood out completely, due to its remarkably high salinity level and conductivity, exceeding 5 mS/cm.

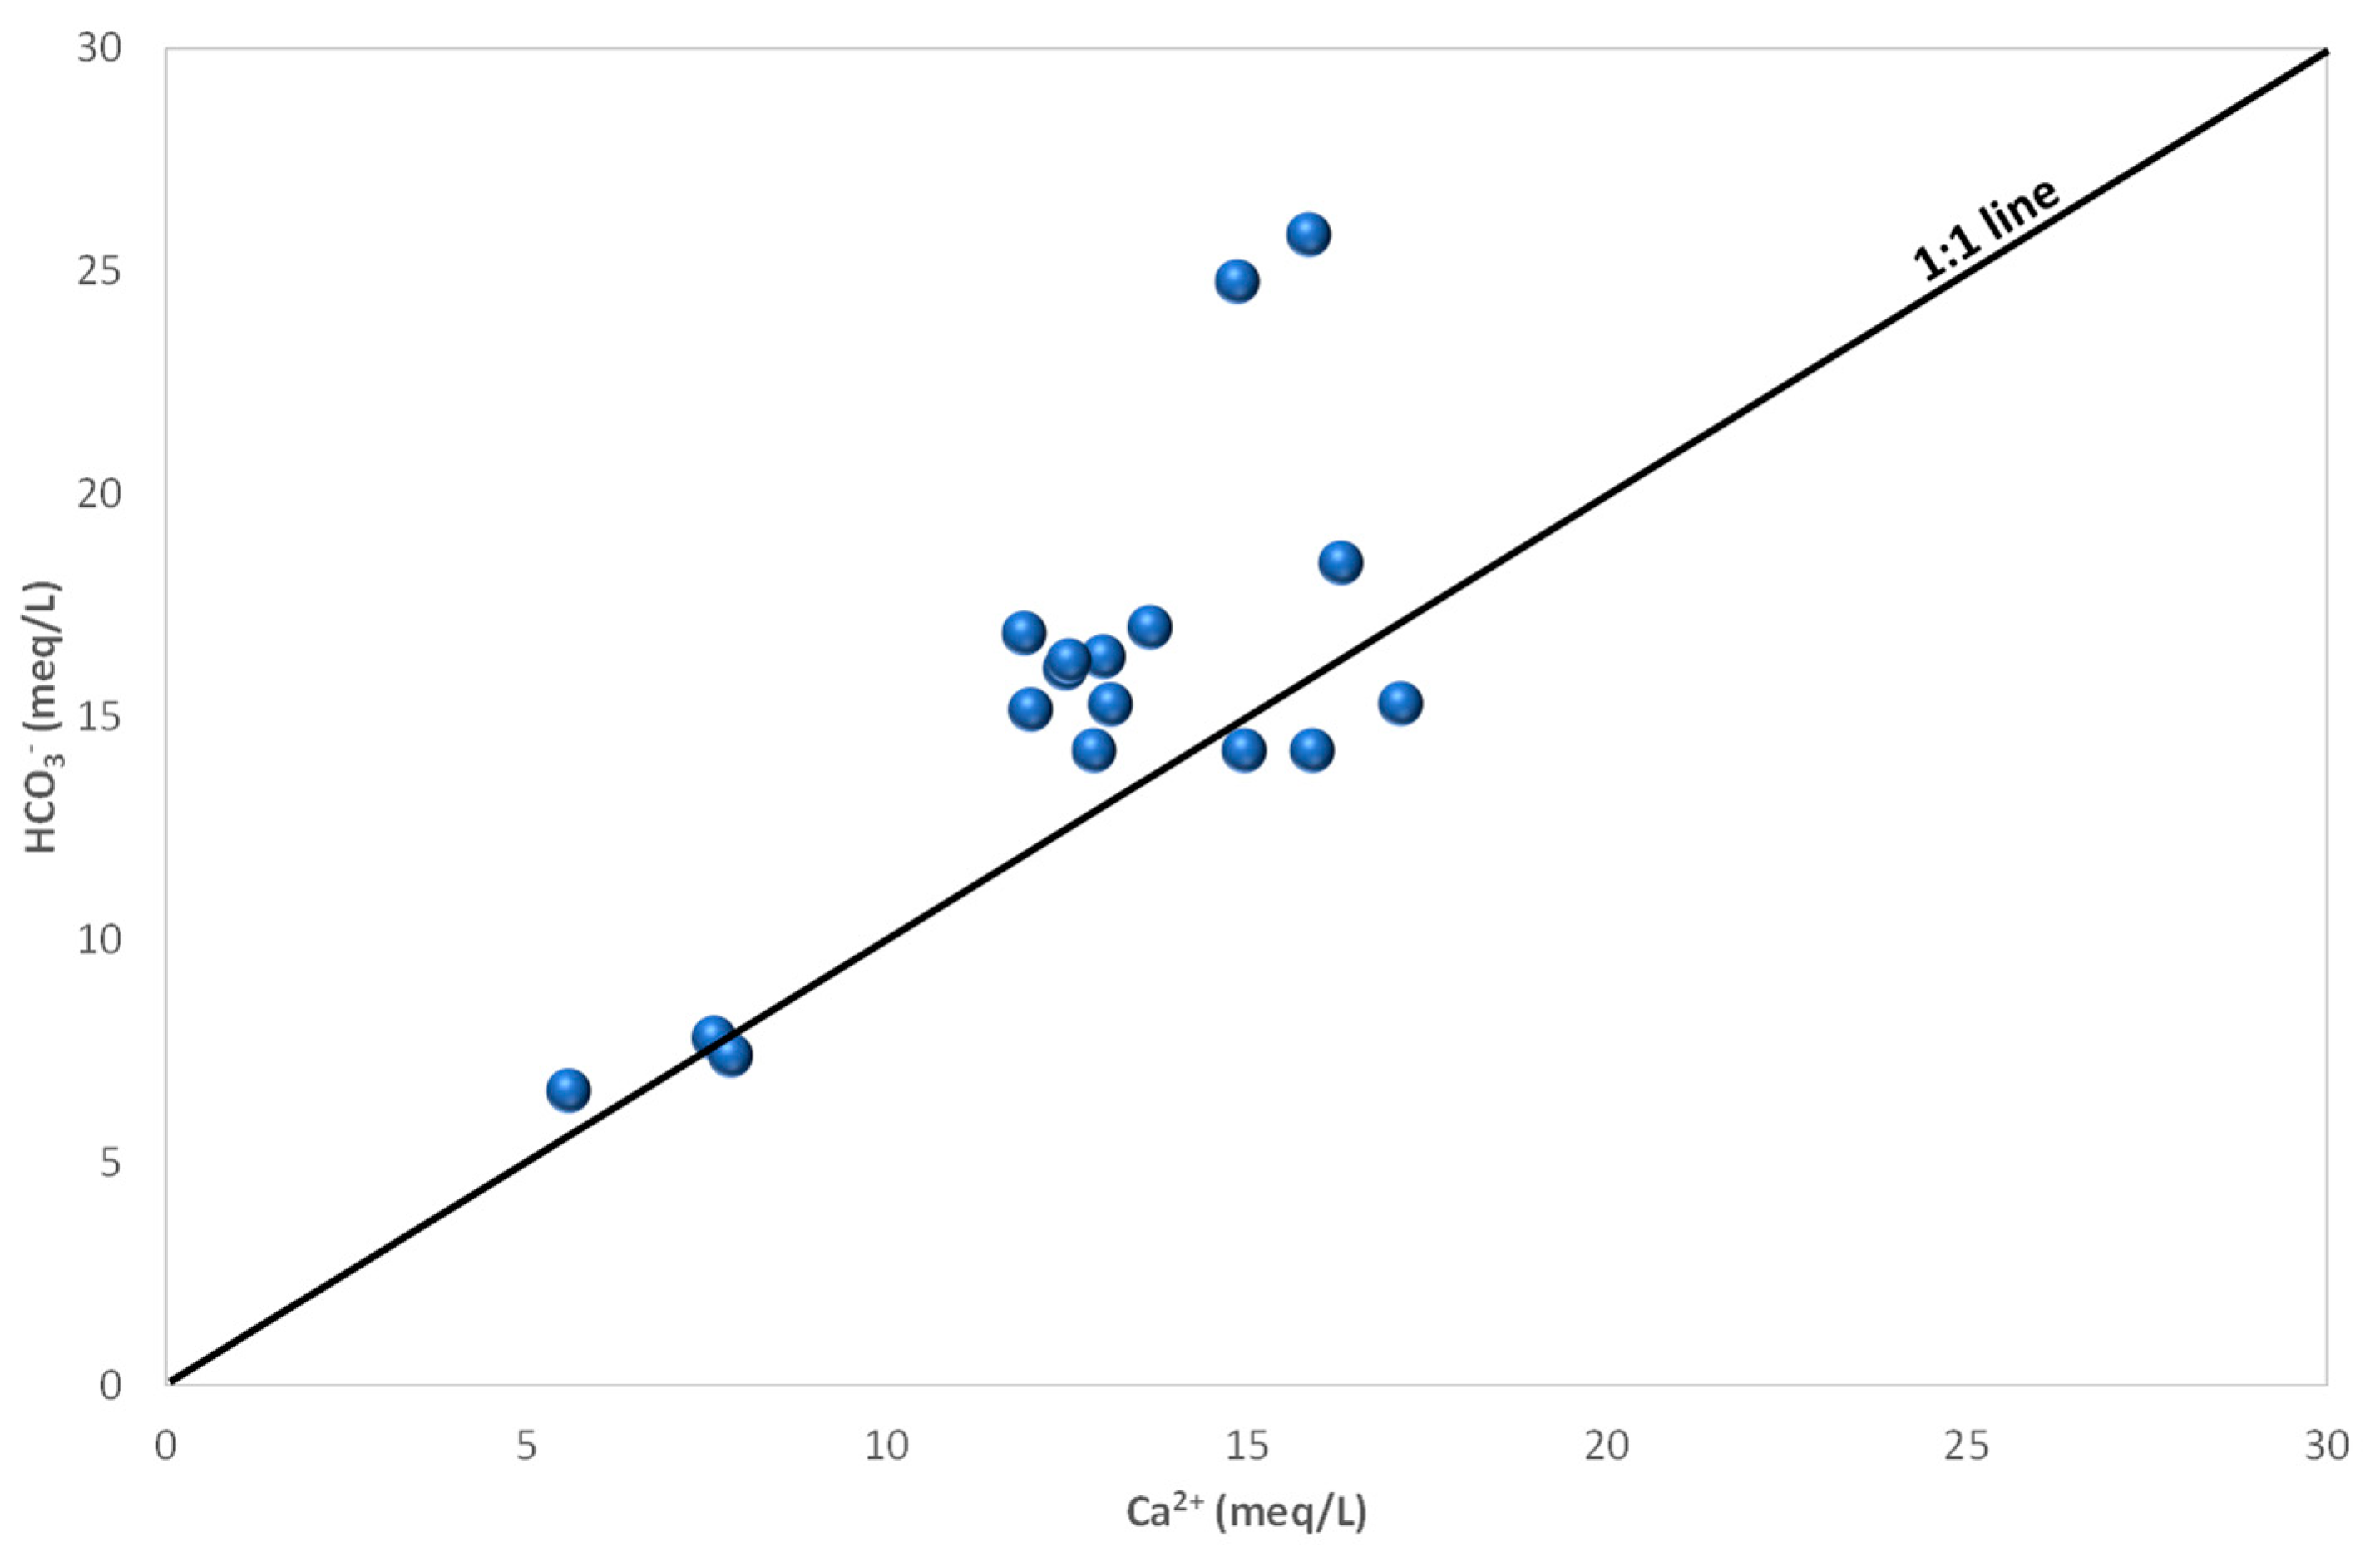
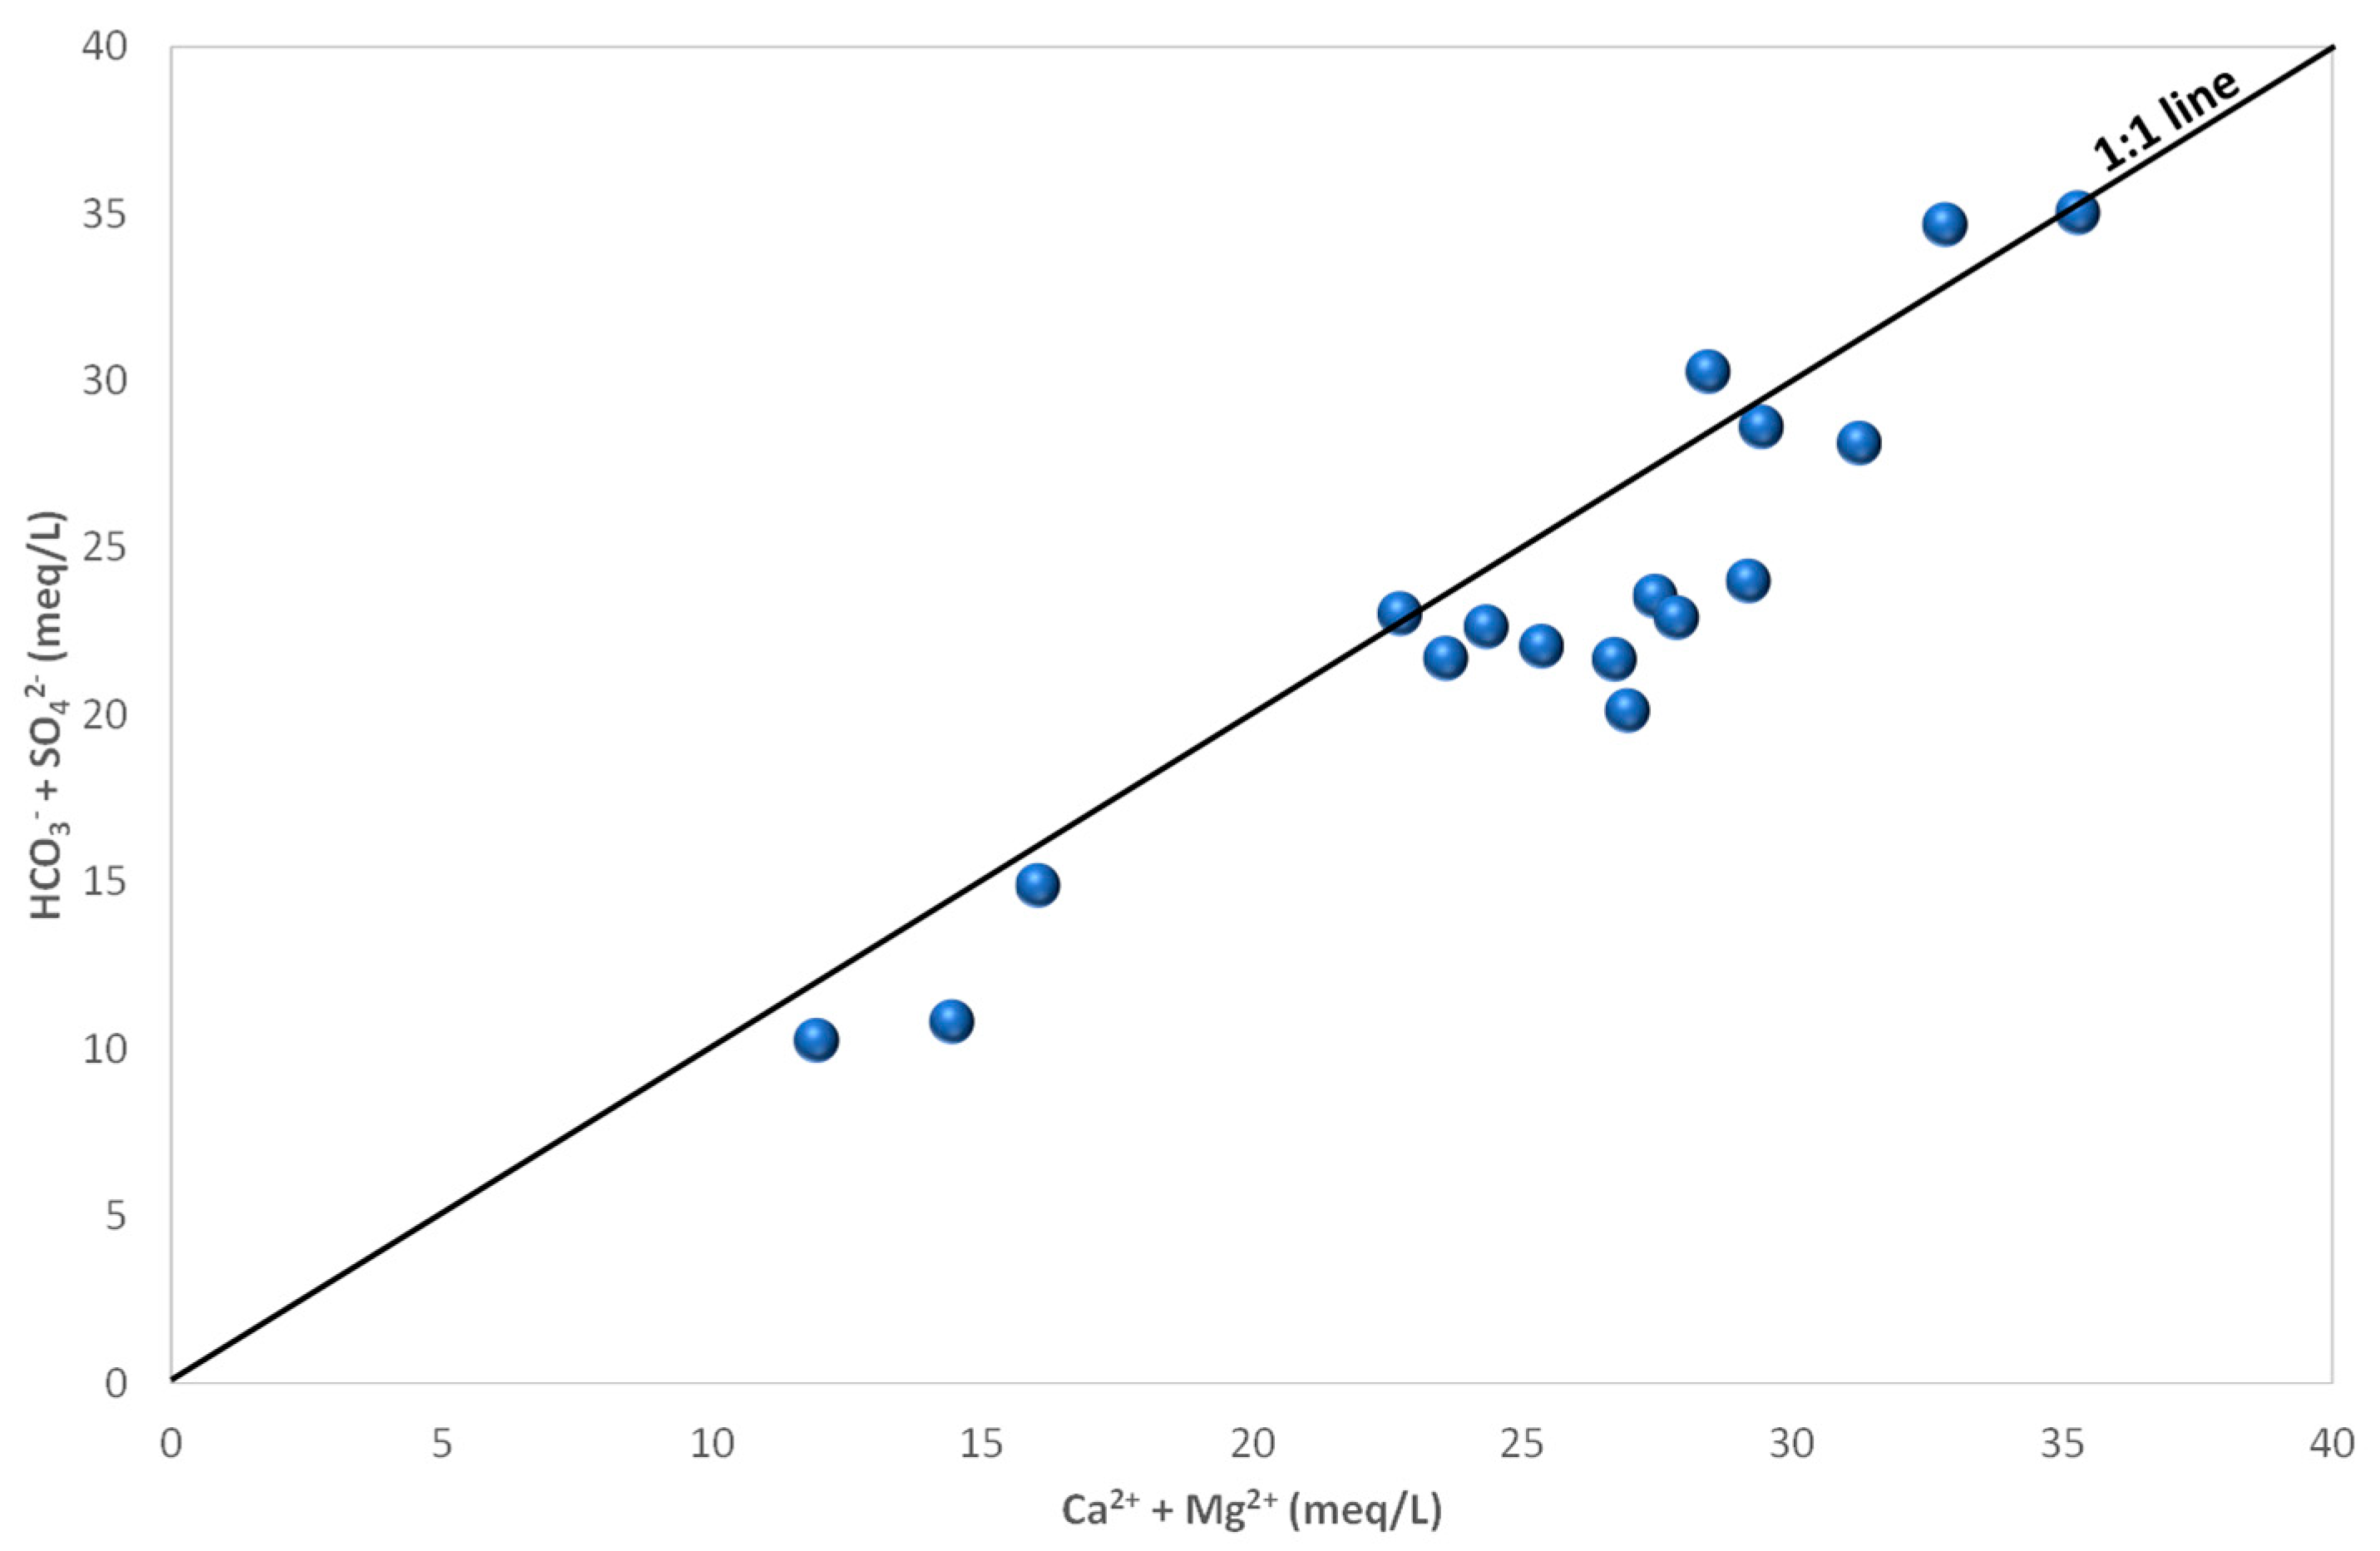
4.3. Groundwater Hydrochemistry and Mineralization Processes

The spatial variability of water temperature and pH was limited, with temperatures consistently ranging between 25 °C and 27 °C, and pH values showing a narrow range of 5.9 to 6.96. It should be noted that the pH levels are on the acidic side, with a minimum value of 5.9. The electrical conductivity (EC) of water is a useful parameter to assess its mineralization level [33,36]. In this study, the measured EC values ranged from 1071 μS/cm to 5660 μS/cm, with an average of 2753 μS/cm ± 0.4 μS/cm. These values indicated a significant variation in water chemistry, with the lowest value recorded in Borehole 14 and the highest value recorded in Borehole 11. As shown in the boxplot (Figure 6), sodium and calcium were the dominant cations in the water, with concentrations ranging from 128 to 852 mg/L and 112 to 343 mg/L, respectively. Magnesium concentrations varied from 79 to 279 mg/L, while potassium concentrations were generally low, ranging from 8 to 51 mg/L. The most prevalent anions in the water were bicarbonate, chloride, and sulfate, with concentrations ranging from 403 to 1511 mg/L, 104 to 1277 mg/L, and 150 to 897 mg/L, respectively. Some samples from areas near small farms showed relatively high nitrate concentrations, possibly due to the use of fertilizers.
A useful way to determine the source of groundwater mineralization is examining the relationship between chemical concentrations and conductivity [37,38]. The depictions of water samples (Figure 7) demonstrate a strong positive correlation between conductivity and major ions other than HCO3 and SO42−. This supports the fact that the salinity of groundwater is largely influenced by the dissolution of minerals containing Ca2+, Mg2+, Na+, Cl, and K+.
Water–rock interactions are a crucial factor in understanding the changes in groundwater quality and can aid in determining the origin of groundwater [39,40]. To analyze the concentration and interrelationship of various major elements, the ratio of groundwater components is frequently employed. This technique facilitates the illustration and comprehension of hydrogeochemical processes and the chemical composition’s genesis [41,42,43]. During the process of water–rock interactions, there is a transfer of rock materials into groundwater, which results in the partial loss of soluble ions and introduces new elements into the groundwater.
The concentration of Na+ and Cl (Figure 8) shows that most of the groundwater samples were projected, more or less, on the 1:1 slope line, indicating that the origin of these two elements in these waters was the dissolution of halite. However, four samples were located below this line, indicating an enrichment in Na+ compared to Cl. This enrichment could be attributed to cation exchange and the alteration of aluminosilicates [44].
The plot of Ca2+ versus HCO3 (Figure 9) displays three main groups, indicating that both elements are influenced by various processes. The first group exhibits samples projected on or close to the 1:1 line, suggesting that the origin of Ca2+ and HCO3 in these groundwater samples is the dissolution of calcite. The second group consists of samples displaying an excess of Ca2+ compared to HCO3, which could be attributed to the weathering of calcium silicate minerals such as plagioclase [45].
Conversely, the third group is characterized by an excess of HCO3 compared to Ca2+. This excess may be the result of feldspar weathering, where water and carbon dioxide react with feldspar to produce dissolved silica, potassium ions, and bicarbonate ions [32,45].
When the ratio of (Ca2+ + Mg2+) to (HCO3 + SO42−) is close to 1:1, the dissolution of calcite, dolomite, and gypsum are the dominant reactions in the system. However, if the plot of (Ca2+ + Mg2+) versus (HCO3 + SO42−) falls above the 1:1 line, this indicates that the other phenomenon and reactions are happening, such as silicate minerals weathering or a reverse cation exchange [46]. In this case, as can be observed in Figure 10, most of the water samples fall below the 1:1 line. This confirm that the dissolution of calcite, dolomite, and gypsum is not the only source of Ca2+, Mg2+, SO42−, and HCO3 in the groundwater. Weathering of aluminosilicate minerals and cation exchange are also significant factors contributing to the concentrations of these ions. Figure 10 also shows the differentiation of groundwater into three groups, based on varying degrees of mineralization. This could be attributed to the fact that groundwater follows different flow paths because of the fractured nature of the aquifer and, as a result, it may not undergo mineralization in the same way, even if it experiences the same phenomena overall.
The primary process of altering primary minerals is through silicate hydrolysis. The mineralogical composition of rocks has a greater impact on water/rock interactions than their chemical composition. The aggressiveness of CO2-rich water plays a significant role in these interactions [47,48,49]. The presence of dissolved CO2 in groundwater from deep aquifers allows it to alter aluminosilicate minerals present in the aquifer rocks. The reactions between water and silicate rocks can be expressed by the following reactions:
Plagioclase weathering:
CaAl2Si2O8 + 2H2O + CO2 → Ca2+ + 2HCO3 + Al2Si2O5(OH)4
Feldspar weathering:
KAlSi3O8 + 4H2O + 6CO2 → H4SiO4 + 2K+ + 4HCO3 + Al2Si2O5(OH)4
Albite weathering:
NaAlSi3O8 + 2CO2 + 3H2O → Na+ + 2HCO3 + 2SiO2 + Al2Si2O5(OH)4
Amphibole hydrolysis:
Ca2Mg5Si8O22(OH)2 + 12H2O + 6CO2 → 2Ca2+ + 5Mg2+ + 8Si(OH)4 + 6HCO3
Biotite hydrolysis:
K(Mg,Fe)3(AlSi3O10)(OH)2 + 14H2O + 4CO2 → K+ + 3Mg2+ + Fe2+ +3Al(OH)3 + 3Si(OH)4 + 4HCO3
As the silicate alteration reaction progresse, the composition of the groundwater changes, leading to an increase in cation HCO3 content. This suggests that changes in major cation abundance may be partly attributed to the alteration of aluminosilicates, as indicated by the equations above. The concentration of bicarbonate in groundwater can be used to determine the extent of alteration that has occurred. Chemical analyses indicated that water-rock interaction plays a crucial role in this process, as demonstrated by the high levels of HCO3 present in the groundwater. Additionally, the acidic nature of the groundwater from this aquifer provides further support for the significance of water–rock interaction.

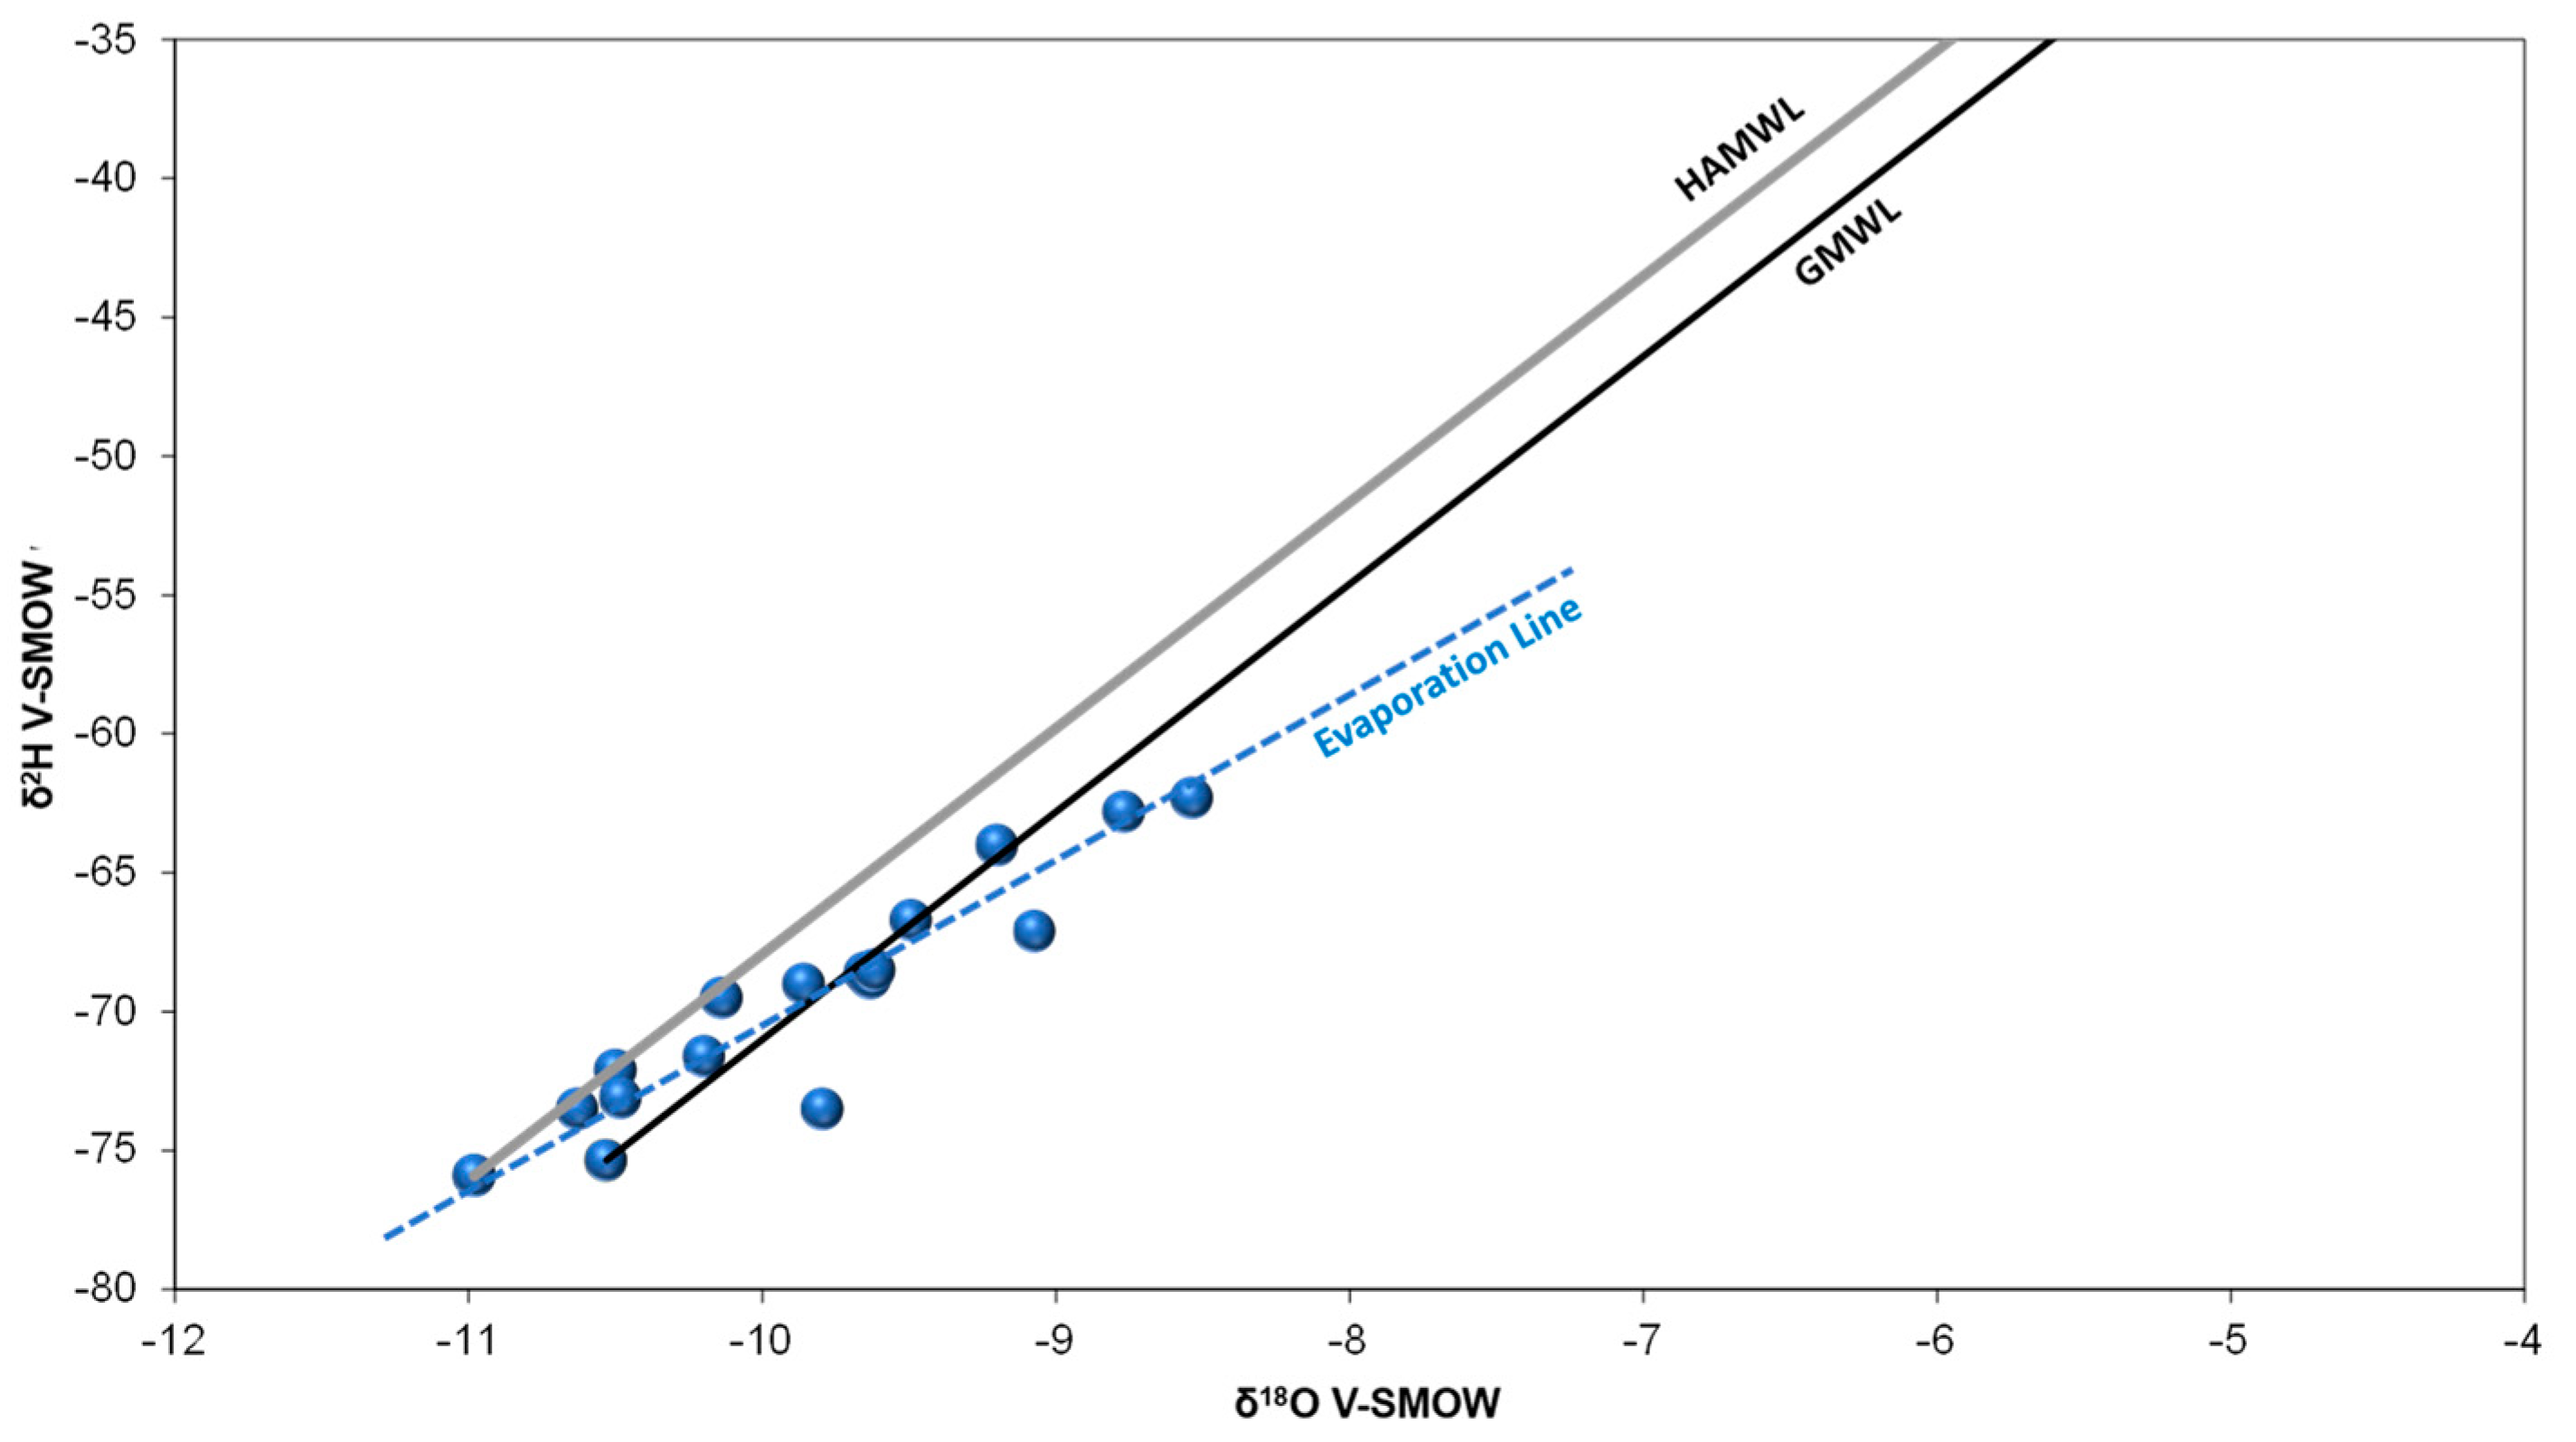
4.4. Isotopic Analysis and Origin of Groundwater

Isotopic compositions of groundwater and surface water, particularly δ18O and δ2H, are commonly employed to investigate hydrogeological processes, such as groundwater recharge, interactions between surface water and groundwater, and hydrological basin modeling, by considering precipitation as an isotopic input The conventional method for isotopic characterization entails comparing the acquired isotope values with the global meteoric water line (GMWL), characterized by the mean annual isotopic composition of precipitation across various global regions, and the local meteoric water line (LMWL).
Table 2 presents stable isotope ratios (δ18O and δ2H) of groundwater samples collected from the 17 different boreholes (BH1 to BH17). The isotopic ratios are expressed in delta notation (δ) in per mil (‰) relative to the V-SMOW for oxygen and hydrogen isotopes. The δ18O values ranged from −10.98‰ (BH8) to −8.54‰ (BH11) and the δ2H values ranged from −75.9‰ (BH8) to −62.3‰ (BH11). This indicated that there is some variation in the isotopic composition of the groundwater between different boreholes, suggesting possible differences in recharge sources or hydrological processes. BH1, BH5, BH11, and BH14 had relatively higher δ18O and δ2H values than other boreholes, suggesting a potential commonality in their recharge sources or processes. Boreholes with lower δ18O and δ2H values, such as BH7, BH8, and BH17, may indicate recharge from higher elevations or colder temperatures, as lower isotope values are associated with such conditions.
To better interpret the data and understand the origin of the groundwater, it was helpful to create a scatter plot of δ18O versus δ2H and compare it with the local meteoric water line (LMWL) of the study area. Figure 11 illustrates that some water points align with the local meteoric line corresponding to the High Atlas [50]. However, most of the points are projected to the right of this line. These points display a relatively strong correlation (R2 = 0.87) and form a line indicating an enrichment in heavy isotopes due to evaporation. The evaporation line has the following equation: δ2H = 5.6 δ18O − 14.2% SMOW. Some water points are significantly shifted to the right and end up outside the evaporation line. This shift could be explained by a slight water/rock geothermal exchange at depth and high temperature.
The recharge altitudes were determined using the local altitude gradient equation (18O ‰ = −0.0039 × Altitude + 2.2), as calculated by [50]. This method relies solely on the 18O content of water samples that align with the meteoric water line of the High Atlas, considering that the original 18O content of other water samples may have been altered due to evaporation or geothermal exchange. The altitude of recharge was calculated only for samples from the High Atlas Meteoric Water Line, as it was assumed that they kept their original isotopic signature. The samples were from boreholes BH6, BH8, BH14, and BH13. The results of the calculations, presented in Table 3, indicated that the altitude of recharge ranges between 2600 m and 2800 m.

5. Conclusions

In summary, the Zagora region, located in southeastern Morocco, relies heavily on groundwater as its primary water supply. However, the limited aquifer recharge capacity and the challenging geological conditions make sustainable water management a complex task. Interestingly, private wells in the Zagora ditch evidence an abundance of water resources, despite these issues. To shed light on the origins of the groundwater and its salinity, comprehensive geochemical and isotopic studies were conducted in the region. This crucial information assists in formulating robust water management strategies, which are instrumental for improved well-construction planning and regulation and the alleviation of high salinity’s impacts on the local water supply and agriculture systems. Our findings indicated a varying water quality, with certain wells demonstrating conductivity values beyond 5 mS/cm. The majority of groundwater samples exhibited high salinity and low pH, which were attributed to the dissolved CO2. Geochemical evaluation uncovered two chemical facies: chloride–sulfate calcic/magnesic and bicarbonate calcic/magnesic. We observed that the presence of Na+ and Cl likely resulted from the dissolution of halite. In some samples, an overrepresentation of Na+ compared to Cl was found, which was possibly due to cation exchange. Furthermore, the concentration of Ca2+ and HCO3 hinted that their origin may be the dissolution of calcite and the weathering of calcium silicate minerals, such as plagioclase. Isotopic analysis revealed that the groundwater originated from the High Atlas, with a recharge altitude between 2600 m and 2800 m. This groundwater then infiltrates the graben through fissures and regional fault networks. Overall, these findings offer valuable insights into the groundwater dynamics in the Zagora region and underscore the importance of sustainable management practices for its conservation.

Author Contributions

Conceptualization, A.A.L. and M.E.G.; Methodology, A.A.L. and M.E.G.; Formal analysis, A.A.L.; Investigation, A.A.L. and M.E.G.; Writing—original draft, A.A.L., M.E.G. and O.H.; Writing—review & editing, A.A.L., L.Z., A.K. and L.M.; Visualization, A.A.L. and O.H. All authors have read and agreed to the published version of the manuscript.

Funding

This research received no external funding.

Data Availability Statement

Not applicable.

Conflicts of Interest

The authors declare no conflict of interest.

References

  1. Mays, L.W. Groundwater Resources Sustainability: Past, Present, and Future. Water Resour. Manag. 2013, 27, 4409–4424. [Google Scholar] [CrossRef]
  2. Born, K.; Fink, A.H.; Paeth, H. Dry and Wet Periods in the Northwestern Maghreb for Present Day and Future Climate Conditions. Meteorol. Z. 2008, 17, 533–551. [Google Scholar] [CrossRef]
  3. Lgourna, Z.; Warner, N.; Bouchaou, L.; Boutaleb, S.; Hssaisoune, M.; Tagma, T.; Ettayfi, N.; Vengosh, A. Elucidating the Sources and Mechanisms of Groundwater Salinization in the Ziz Basin of Southeastern Morocco. Environ. Earth Sci. 2015, 73, 77–93. [Google Scholar] [CrossRef]
  4. Hssaisoune, M.; Bouchaou, L.; Sifeddine, A.; Bouimetarhan, I.; Chehbouni, A. Moroccan Groundwater Resources and Evolution with Global Climate Changes. Geosciences 2020, 10, 81. [Google Scholar] [CrossRef] [Green Version]
  5. Benjmel, K.; Amraoui, F.; Boutaleb, S.; Ouchchen, M.; Tahiri, A.; Touab, A. Mapping of Groundwater Potential Zones in Crystalline Terrain Using Remote Sensing, GIS Techniques, and Multicriteria Data Analysis (Case of the Ighrem Region, Western Anti-Atlas, Morocco). Water 2020, 12, 471. [Google Scholar] [CrossRef] [Green Version]
  6. Vengosh, A.; Gieskes, J.; Mahn, C. New Evidence for the Origin of Hypersaline Pore Fluids in the Mediterranean Basin. Chem. Geol. 2000, 163, 287–298. [Google Scholar] [CrossRef]
  7. Hsissou, Y.; Bouchaou, L.; Mudry, J.; Mania, J. Use of Chemical Tracing to Study Acquisition Modalities of the Mineralization and Behaviour of Unconfined Groundwaters under a Semi-Arid Climate: The Case of the Souss Plain (Morocco). Environ. Geol. 2002, 42, 672–680. [Google Scholar] [CrossRef]
  8. Bouchaou, L.; Michelot, J.L.; Vengosh, A.; Hsissou, Y.; Qurtobi, M.; Gaye, C.B.; Bullen, T.D.; Zuppi, G.M. Application of Multiple Isotopic and Geochemical Tracers for Investigation of Recharge, Salinization, and Residence Time of Water in the Souss–Massa Aquifer, Southwest of Morocco. J. Hydrol. 2008, 352, 267–287. [Google Scholar] [CrossRef]
  9. Ettayfi, N.; Bouchaou, L.; Michelot, J.L.; Tagma, T.; Warner, N.; Boutaleb, S.; Massault, M.; Lgourna, Z.; Vengosh, A. Geochemical and Isotopic (Oxygen, Hydrogen, Carbon, Strontium) Constraints for the Origin, Salinity, and Residence Time of Groundwater from a Carbonate Aquifer in the Western Anti-Atlas Mountains, Morocco. J. Hydrol. 2012, 438–439, 97–111. [Google Scholar] [CrossRef]
  10. Warner, N.; Lgourna, Z.; Bouchaou, L.; Boutaleb, S.; Tagma, T.; Hsaissoune, M.; Vengosh, A. Integration of Geochemical and Isotopic Tracers for Elucidating Water Sources and Salinization of Shallow Aquifers in the Sub-Saharan Drâa Basin, Morocco. Appl. Geochem. 2013, 34, 140–151. [Google Scholar] [CrossRef]
  11. Huebener, H.; Kerschgens, M. Downscaling of Current and Future Rainfall Climatologies for Southern Morocco. Part II: Climate Change Signals. Int. J. Climatol. 2007, 27, 1065–1073. [Google Scholar] [CrossRef]
  12. Driouech, F.; Déqué, M.; Sánchez-Gómez, E. Weather Regimes—Moroccan Precipitation Link in a Regional Climate Change Simulation. Glob. Planet. Chang. 2010, 72, 1–10. [Google Scholar] [CrossRef]
  13. Driouech, F.; Stafi, H.; Khouakhi, A.; Moutia, S.; Badi, W.; ElRhaz, K.; Chehbouni, A. Recent Observed Country-Wide Climate Trends in Morocco. Int. J. Climatol. 2021, 41, E855–E874. [Google Scholar] [CrossRef]
  14. Baidder, L.; Raddi, Y.; Tahiri, M.; Michard, A. Devonian Extension of the Pan-African Crust North of the West African Craton, and Its Bearing on the Variscan Forelanddeformation: Evidence from Eastern Anti-Atlas (Morocco). Geol. Soc. Lond. Spéc. Publ. 2008, 297, 453–465. [Google Scholar] [CrossRef]
  15. Boissavy, C. Etude Structurale et Métallogénique Des Filons Cuprifères Du Maider Occidental (Anti–Atlas Marocain). Ph.D. Thesis, Université Pierre et Marie Curie (Paris VI), Paris, France, 1979. [Google Scholar]
  16. Moumane, A.; El Ghazali, F.E.; Al Karkouri, J.; Delorme, J.; Batchi, M.; Chafiki, D.; Karmaoui, A. Monitoring Spatiotemporal Variation of Groundwater Level and Salinity under Land Use Change Using Integrated Field Measurements, GIS, Geostatistical, and Remote-Sensing Approach: Case Study of the Feija Aquifer, Middle Draa Watershed, Moroccan Sahara. Environ. Monit. Assess 2021, 193, 769. [Google Scholar] [CrossRef] [PubMed]
  17. Bossenbroek, L.; Ftouhi, H.; Kadiri, Z.; Kuper, M. Watermelons in the Desert in Morocco: Struggles Around a Groundwater Commons-in-the-Making. Water Altern. 2023, 16, 87–107. [Google Scholar]
  18. Karmaoui, A.; Ifaadassan, I.; Babqiqi, A.; Messouli, M.; Khebiza, M. Analysis of the Water Supply-Demand Relationship in the Middle Draa Valley, Morocco, under Climate Change and Socio-Economic Scenarios. JSRR 2016, 9, 1–10. [Google Scholar] [CrossRef]
  19. El Mandour, A.; El Yaouti, F.; Fakir, Y.; Zarhloule, Y.; Benavente, J. Evolution of Groundwater Salinity in the Unconfined Aquifer of Bou-Areg, Northeastern Mediterranean Coast, Morocco. Environ. Geol. 2008, 54, 491–503. [Google Scholar] [CrossRef]
  20. Yaouti, F.E.; Mandour, A.E.; Khattach, D.; Benavente, J.; Kaufmann, O. Salinization Processes in the Unconfined Aquifer of Bou-Areg (NE Morocco): A Geostatistical, Geochemical, and Tomographic Study. Appl. Geochem. 2009, 24, 16–31. [Google Scholar] [CrossRef]
  21. Elgettafi, M.; Himi, M.; Casas, A.; Elmandour, A. Hydrochemistry Caracterisation of Groundwater Salinity in Kert Aquifer, NE Morocco. Geogr. Tech. 2011, 2, 15–22. [Google Scholar]
  22. Elgettafi, M.; Elmandour, A.; Himi, M.; Casas, A. The Use of Environmental Markers to Identify Groundwater Salinization Sources in a Neogene Basin, Kert Aquifer Case, NE Morocco. Int. J. Environ. Sci. Technol. 2013, 10, 719–728. [Google Scholar] [CrossRef] [Green Version]
  23. Krimissa, S.; Michelot, J.-L.; Bouchaou, L.; Mudry, J.; Hsissou, Y. Sur l’origine Par Altération Du Substratum Schisteux de La Minéralisation Chlorurée Des Eaux d’une Nappe Côtière Sous Climat Semi-Aride (Chtouka-Massa, Maroc). Comptes Rendus Geosci. 2004, 336, 1363–1369. [Google Scholar] [CrossRef]
  24. Mdiker, N.; ElAchheb, A.; El Mandour, A.; Younsi, A.; El Maliki, S. Description Quantitative de La Salinisation Des Eaux Souterraines Côtières (Sahel El Haouzia, Maroc). Afr. Geosci. Rev. 2008, 15, 261–278. [Google Scholar]
  25. Rochdane, S.; Reddy, D.; El Mandour, A. Hydrochemical and Isotopic Characterisation of Eastern Haouz Plain Groundwater, Morocco. Environ. Earth Sci. 2015, 73, 3487–3500. [Google Scholar] [CrossRef]
  26. Bucher, K.; Stober, I. Fluids in the Upper Continental Crust. Geofluids 2010, 10, 241–253. [Google Scholar]
  27. Cartwright, I.; Weaver, T.R.; Cendón, D.I.; Fifield, L.K.; Tweed, S.O.; Petrides, B.; Swane, I. Constraining Groundwater Flow, Residence Times, Inter-Aquifer Mixing, and Aquifer Properties Using Environmental Isotopes in the Southeast Murray Basin, Australia. Appl. Geochem. 2012, 27, 1698–1709. [Google Scholar] [CrossRef]
  28. Dogramaci, S.; Skrzypek, G.; Dodson, W.; Grierson, P.F. Stable Isotope and Hydrochemical Evolution of Groundwater in the Semi-Arid Hamersley Basin of Subtropical Northwest Australia. J. Hydrol. 2012, 475, 281–293. [Google Scholar] [CrossRef]
  29. Siebert, C.; Rödiger, T.; Mallast, U.; Gräbe, A.; Guttman, J.; Laronne, J.B.; Storz-Peretz, Y.; Greenman, A.; Salameh, E.; Al-Raggad, M.; et al. Challenges to Estimate Surface- and Groundwater Flow in Arid Regions: The Dead Sea Catchment. Sci. Total Environ. 2014, 485–486, 828–841. [Google Scholar] [CrossRef]
  30. Robert–Charrue, C. Géologie Structurale de l’Anti–Atlas Oriental, Maroc; Université de Neuchâtel: Neuchâtel, Switzerland, 2006. [Google Scholar]
  31. Baidder, L.; Michard, A.; Soulaimani, A.; Fekkak, A.; Eddebbi, A.; Rjimati, E.-C.; Raddi, Y. Fold Interference Pattern in Thick-Skinned Tectonics; a Case Study from the External Variscan Belt of Eastern Anti-Atlas, Morocco. J. Afr. Earth Sci. 2016, 119, 204–225. [Google Scholar] [CrossRef]
  32. Yang, Q.; Li, Z.; Ma, H.; Wang, L.; Martín, J.D. Identification of the Hydrogeochemical Processes and Assessment of Groundwater Quality Using Classic Integrated Geochemical Methods in the Southeastern Part of Ordos Basin, China. Environ. Pollut. 2016, 218, 879–888. [Google Scholar] [CrossRef]
  33. Chang, J.; Wang, G. Major Ions Chemistry of Groundwater in the Arid Region of Zhangye Basin, Northwestern China. Environ. Earth Sci. 2010, 61, 539–547. [Google Scholar] [CrossRef]
  34. Al-Mashreki, M.H.; Eid, M.H.; Saeed, O.; Székács, A.; Szűcs, P.; Gad, M.; Abukhadra, M.R.; AlHammadi, A.A.; Alrakhami, M.S.; Alshabibi, M.A.; et al. Integration of Geochemical Modeling, Multivariate Analysis, and Irrigation Indices for Assessing Groundwater Quality in the Al-Jawf Basin, Yemen. Water 2023, 15, 1496. [Google Scholar] [CrossRef]
  35. Gad, M.; Gaagai, A.; Eid, M.H.; Szűcs, P.; Hussein, H.; Elsherbiny, O.; Elsayed, S.; Khalifa, M.M.; Moghanm, F.S.; Moustapha, M.E.; et al. Groundwater Quality and Health Risk Assessment Using Indexing Approaches, Multivariate Statistical Analysis, Artificial Neural Networks, and GIS Techniques in El Kharga Oasis, Egypt. Water 2023, 15, 1216. [Google Scholar] [CrossRef]
  36. Farid, I.; Zouari, K.; Rigane, A.; Beji, R. Origin of the Groundwater Salinity and Geochemical Processes in Detrital and Carbonate Aquifers: Case of Chougafiya Basin (Central Tunisia). J. Hydrol. 2015, 530, 508–532. [Google Scholar] [CrossRef]
  37. Ben Moussa, A.; Zouari, K.; Oueslati, N. Geochemical Study of Groundwater Mineralization in the Grombalia Shallow Aquifer, North-Eastern Tunisia: Implication of Irrigation and Industrial Waste Water Accounting. Environ. Geol. 2009, 58, 555–566. [Google Scholar] [CrossRef]
  38. John, B.; Das, S. Role of Electrical Conductivity on Salinity and Mineralization Due to Groundwater Level Fluctuations in Kolkata City. IOP Conf. Ser. Earth Environ. Sci. 2020, 505, 012021. [Google Scholar] [CrossRef]
  39. Elango, L.; Kannan, R. Chapter 11 Rock–Water Interaction and Its Control on Chemical Composition of Groundwater. In Concepts and Applications in Environmental Geochemistry; Sarkar, D., Datta, R., Hannigan, R., Eds.; Developments in Environmental Science; Elsevier: Amsterdam, The Netherlands, 2007; Volume 5, pp. 229–243. [Google Scholar]
  40. Medjani, F.; Djidel, M.; Labar, S.; Bouchagoura, L.; Rezzag Bara, C. Groundwater Physico-Chemical Properties and Water Quality Changes in Shallow Aquifers in Arid Saline Wetlands, Ouargla, Algeria. Appl. Water Sci 2021, 11, 82. [Google Scholar] [CrossRef]
  41. Ravikumar, P.; Somashekar, R.K. Principal Component Analysis and Hydrochemical Facies Characterization to Evaluate Groundwater Quality in Varahi River Basin, Karnataka State, India. Appl. Water Sci 2017, 7, 745–755. [Google Scholar] [CrossRef] [Green Version]
  42. Ait Lemkademe, A.; Michelot, J.-L.; Benkaddour, A.; Hanich, L.; Maliki, A. Isotopic and Hydrochemical Approach to the Functioning of an Aquifer System in the Region of Marrakech (Morocco): Isotopic and Hydrochemical Approach to the Functioning of an Aquifer. Rapid Commun. Mass Spectrom. 2011, 25, 2785–2792. [Google Scholar] [CrossRef]
  43. Ait Lemkademe, A.; Michelot, J.-L.; Benkaddour, A.; Hanich, L.; Heddoun, O. Origin of Groundwater Salinity in the Draa Sfar Polymetallic Mine Area Using Conservative Elements (Morocco). Water 2022, 15, 82. [Google Scholar] [CrossRef]
  44. Henderson, T. Geochemistry of Ground-Water in Two Sandstone Aquifer Systems in the Northern Great Plains in Parts of Montana and Wyoming, North Dakota, and South Dakota; Professional Paper; United States Government Printing Office: Reston, VA, USA, 1985. [Google Scholar]
  45. Madrigal-Solís, H.; Jiménez-Gavilán, P.; Vadillo-Pérez, I.; Fonseca-Sánchez, A.; Calderón-Sánchez, H.; Quesada-Hernández, L.; Gómez-Cruz, A. Discriminant Model and Hydrogeochemical Processes for Characterizing Preferential Flow Paths in Four Interconnected Volcanic Aquifers in Costa Rica. Hydrogeol. J. 2022, 30, 2315–2340. [Google Scholar] [CrossRef]
  46. Su, Y. A Study of Shallow Groundwater Quality Distribution in the Ordos Cretaceous Artisan Basin Based on GIS. Hydrogeol. Eng. Geol. J. 2009, 36, 24–29. [Google Scholar]
  47. Herczeg, A.L.; Edmunds, W.M. Inorganic Ions as Tracers. In Environmental Tracers in Subsurface Hydrology; Springer: Boston, MA, USA, 2000; pp. 31–77. [Google Scholar]
  48. Choi, B.-Y.; Yun, S.-T.; Kim, K.-H.; Choi, H.-S.; Chae, G.-T.; Lee, P.-K. Geochemical Modeling of CO2–Water–Rock Interactions for Two Different Hydrochemical Types of CO2-Rich Springs in Kangwon District, Korea. J. Geochem. Explor. 2014, 144, 49–62. [Google Scholar] [CrossRef]
  49. Koh, Y.-K.; Choi, B.-Y.; Yun, S.-T.; Choi, H.-S.; Mayer, B.; Ryoo, S.-W. Origin and Evolution of Two Contrasting Thermal Groundwaters (CO2-Rich and Alkaline) in the Jungwon Area, South Korea: Hydrochemical and Isotopic Evidence. J. Volcanol. Geotherm. Res. 2008, 178, 777–786. [Google Scholar] [CrossRef]
  50. Raibi, F.; Benkaddour, A.; Hanich, L.; Chehbouni, A. Caractérisation Hydrogéochimique et Isotopique Des Eaux de Surface et Des Eaux Souterraines Du Bassin Versant de Tensift. In Proceedings of the Gestion Intégrée des Ressources en Eaux et Défis du Développement Dura-ble (GIRE3D), Marrakesh, Marocco, 23–25 May 2006. [Google Scholar]
Figure 1. Litho-structural map of the Zagora graben area.
Water 15 02172 g001
Figure 2. Geological cross section showing the relationship of lithology and structural structures in Zagora graben area.
Water 15 02172 g002
Figure 3. Location of sampled boreholes.
Water 15 02172 g003
Figure 4. Piper diagram showing water types.
Water 15 02172 g004
Figure 5. (a) Principal component analysis; (b) factorial diagram F1–F2.
Water 15 02172 g005
Figure 6. Boxplot showing the distributions of the groundwater analysis results.
Water 15 02172 g006
Figure 7. Conductivity (µS/cm) versus major elements concentrations (mg/L) of groundwater.
Water 15 02172 g007
Figure 8. Plot of sodium versus chloride of groundwater samples from the graben.
Water 15 02172 g008
Figure 9. Plot of calcium versus bicarbonate of groundwater samples from the graben.
Water 15 02172 g009
Figure 10. Plot of (Ca2+ + Mg2+) versus (HCO3 + SO42−) of groundwater samples.
Water 15 02172 g010
Figure 11. Scatter plot of δ18O versus δ2H compared to the local meteoric water line (LMWL) and the global meteoric water line (GMWL).
Water 15 02172 g011
Table 1. Physicochemical parameters and chemical analysis of groundwater.
NameEC (µS/cm)pHT °CCa2+ (mg/L)K+ (mg/L)Mg2+ (mg/L)Na+ (mg/L)NO3 (mg/L)Cl (mg/L)SO42− (mg/L)HCO3 (mg/L)
BH132705.7027318251663610490469869
BH234205.8426343271764063536616933
BH317996.10251521310626610213341475
BH411186.682611287916618131175403
BH527105.7427299251562650346447869
BH628506.76263173215728303572141575
BH724705.86262392213526603672961029
BH829706.2625258241553350452375869
BH924905.8327240211452760367314925
BH1024305.8327249221482610329315981
BH1156606.682526051279852451171897997
BH1226005.98272732016625403781501037
BH1310716.182615711831280104164451
BH1437205.92273262520748514317791126
BH1526306.0826251241772636354260992
BH1627505.9826262251842868389366932
BH1728406.09262982618230902661851511
Table 2. δ18O and δ2H of groundwater samples.
Nameδ18O ‰δ2H ‰
BH1−9.5−66.7
BH2−9.65−68.6
BH3−9.63−68.8
BH4−9.62−68.5
BH5−8.77−62.8
BH6−10.14−69.5
BH7−10.53−75.35
BH8−10.98−75.9
BH9−9.8−73.5
BH10−10.2−71.6
BH11−8.54−62.3
BH12−9.2−64
BH13−10.63−73.5
BH14−10.5−72.1
BH15−9.86−69
BH16−9.07−67.1
BH17−10.48−73.1
Table 3. Altitude of recharge of groundwater.
Nameδ18O ‰ Altitude of Recharge
BH6−10.142598
BH8−10.982813
BH13−10.632723
BH14−10.522695
Disclaimer/Publisher’s Note: The statements, opinions and data contained in all publications are solely those of the individual author(s) and contributor(s) and not of MDPI and/or the editor(s). MDPI and/or the editor(s) disclaim responsibility for any injury to people or property resulting from any ideas, methods, instructions or products referred to in the content.

