Article

Residual Saturation Effects on CO2 Migration and Caprock Sealing: A Study of Permeability and Capillary Pressure Models

1
Key Laboratory of Shale Gas and Geoengineering, Institute of Geology and Geophysics, Chinese Academy of Sciences, Beijing 100029, China
2
University of Chinese Academy of Sciences, Beijing 100049, China
3
Key Laboratory of Groundwater Resources and Environment, Ministry of Education, Jilin University, Changchun 130021, China
4
School of Environmental Science and Engineering, Southern University of Science and Technology, Shenzhen 518055, China
*
Author to whom correspondence should be addressed.
Water 2023, 15(18), 3316; https://doi.org/10.3390/w15183316
Submission received: 15 August 2023 / Revised: 13 September 2023 / Accepted: 18 September 2023 / Published: 20 September 2023
(This article belongs to the Section Hydrogeology)

Abstract

:
In CO2 geological storage, multiphase flow plays a vital role in the movement and distribution of CO2. However, due to the limitations of fluid buoyancy and capillary forces, CO2 encounters challenges in penetrating the caprock, and the potential for leakage remains a concern due to variations in injection conditions. The migration and distribution of CO2 in the process of CO2 geological storage in saline formations are determined by relative permeability and capillary pressure, which are key factors. Consequently, this study focuses on two essential models: relative permeability and capillary pressure models. A two-dimensional isothermal reservoir–caprock model was constructed, utilizing data from the Shenhua CCS demonstration project. The analysis indicates that the core parameters in the model are residual gas saturation and residual water saturation. Specifically, residual gas saturation governs the diffusion distance of CO2 within the reservoir–caprock system, while its combined effect with residual water saturation affects the permeation rate of CO2. Through the application of the Analytic Hierarchy Process (AHP) to analyze the impact of different models on caprock integrity, it was determined that when selecting caprock models and optimizing parameters, precedence should be given to models with lower residual saturation and caprocks that offer sufficient capillary pressure for optimal sealing effects. These research findings can serve as references for practical CO2 storage projects, providing guidance on activities such as adjusting water injection strategies and controlling gas injection pressures to optimize geological storage efficiency.

1. Introduction

With the rapid growth of the economy and the excessive consumption of fossil fuels, the negative impacts of greenhouse gas emissions (mainly carbon dioxide) have become increasingly serious. There is an urgent need for a green, clean, and efficient decarbonization method to achieve the carbon neutral development strategy [1,2].
Carbon Capture and Storage (CCS) has been widely recognized as an effective and necessary means of reducing anthropogenic CO2 emissions and has been proposed as an innovative approach for efficient decarbonization and mitigation of global climate change [3]. This approach offers the possibility of reducing atmospheric CO2 while simultaneously continuing to use fossil fuels [4]. CO2 sequestration is the final step in the entire CCS process, which is mainly accomplished by geological and ocean storage, as well as mineral carbonation [5,6,7]. Among them, geological storage, such as deep saline aquifers (DSAs), depleted oil and gas reservoirs, unmineable coal seams, gas hydrate storage, and enhanced geothermal systems, is considered to be the most viable solution for reducing CO2 emissions [3,6,8,9,10]. Deep saline aquifers (DSAs) are widely distributed, have good sealing capabilities, and provide the most promising and feasible geological reservoir for carbon dioxide storage due to their vast storage capacity [11,12].
Considerable research progress has been made in studying the migration characteristics, potential assessment, and storage mechanisms of CO2 in deep saline aquifers. However, this method still faces various challenges, such as leakage detection, capacity assessment, the impact of heterogeneity on CO2 migration in the subsurface, and pressure buildup caused by CO2 injection. It has been proposed to store CO2 in deep saline aquifers in a supercritical state [5,13,14]. Supercritical CO2 exhibits physical properties that lie in between gas and liquid phases, with lower viscosity and better flowability compared to the liquid phase, as well as higher density compared to the gas phase. The higher density enables greater storage within the same volume, with supercritical CO2 having a density of approximately 0.6–0.7 g/cm3 in saline aquifers, which is lower than the density of formation water [15]. Due to buoyancy effects, CO2 rises to the top of geological structures and is hindered from penetrating the caprock by fluid weight and capillary forces. Despite this, there still remains a potential risk of leakage, which not only leads to atmospheric pollution, but also poses a serious threat to groundwater and human safety [16,17]. Therefore, studying the risks of CO2 leakage in geologic storage systems is of the utmost importance. In the process of CO2 storage in deep saline aquifers, multiphase flow is inevitable due to the inherent differences in properties between the injected phase and the existing formation fluids [1,18]. This introduces the effects of relative permeability and capillary pressure, in contrast to the single-phase flow of traditional groundwater. Many empirical parameters in models for relative permeability and capillary pressure lack clear physical meanings [19]. Additionally, uncertainties may arise from changes in pore morphology due to pressure release, even when core samples are measured from the reservoir [20]. Various parameters have a significant impact on the distribution, migration, and sealing effectiveness of CO2 in models [21], some of which are determined by actual geological conditions and others by engineering injection strategies. Therefore, studying the effects of these parameters in the models can help adjust and optimize CO2 geologic storage strategies.
The Shenhua Erdos Basin CCS Demonstration Project is China’s first Carbon Capture and Storage (CCS) project. It serves as a comprehensive CO2 capture and geological storage project in deep saline aquifers. Specifically, it is located in the northeastern part of the Yimeng Uplift in the Erdos Basin. This region boasts a wide distribution of deep saline aquifers with multiple sets of suitable reservoir and caprock combinations for CO2 geological storage [22]. As a result, it has the potential to store billions of tons of CO2. With its well-documented CO2 storage data [23], the project provides valuable background information for this study. Therefore, this study uses the Erdos Shenhua CCS demonstration project as a case study and establishes a numerical model for CO2 geologic storage based on TOUGH [24]. The analysis focuses on the CO2 gas saturation distribution and assesses the impact of each parameter in the models for relative permeability and capillary pressure on the migration and distribution of CO2. Moreover, the study employs the Analytic Hierarchy Process (AHP) [25], a systematic and quantitative approach, to evaluate the influence of different models on the sealing effectiveness of CO2 storage reservoirs. The findings from this research offer relevant theoretical support for the advancement of carbon dioxide geologic storage technology.

2. The Relative Permeability and Capillary Pressure Models

In the numerical simulation of CO2 geological storage in saline aquifers, the sequestration of CO2 is accomplished through its flow and diffusion in the formation’s pores. The size and distribution range of pores in the formation resemble those found in soil and rocks. The van Genuchten model [26] can be utilized to describe the permeability and capillary pressure characteristics of pores in rocks or soil, particularly for pore scales ranging from tens of micrometers to millimeters. Therefore, the van Genuchten model is employed in the models of liquid-phase relative permeability and capillary pressure. When the residual gas saturation is greater than zero, the model proposed by Corey is utilized to determine the relative permeability of the gas phase, leading to more accurate results [27].
The calculation model for liquid-phase relative permeability adopts the van Genuchten-Mualem (van Genuchten, 1980) model:
k r l = S * 1 1 S * 1 λ λ 2 ,
where
S * = S l S l r S l s S l r .
λ —parameters obtained through experiments are related to the pore structure of the medium;
S l —liquid-phase saturation;
S l r —liquid residual saturation;
S l s —liquid saturation, typically taken as 1.0.
The relative permeability model for gas is adopted from the Corey (1954) model:
k r g = ( 1 S ^ ) 2 1 S ^ 2 ,
where
S ^ = S l S l r 1 S l r S g r .
S g r —gas residual saturation.
The calculation of capillary pressure in this study is based on the van Genuchten (1980) computational model:
P cap   = P 0 S * 1 λ 1 1 λ ,
S * = S l S l r S l s S l r .
P 0 —capillary displacement pressure, which refers to the minimum pressure difference required for gaseous CO2 to displace from the reservoir into the caprock, and it is determined based on the specific site conditions of the sequestration field.
P m a x —maximum capillary pressure.
Equations (2), (4) and (6) suggest that residual water saturation and residual gas saturation play crucial roles as key parameters in the model, whereas the remaining parameters are determined experimentally using geological variables, including pore size distribution and medium properties. By adjusting the values of the residual water and gas saturation parameters, alterations in the relative permeability and capillary pressure curves become apparent.
The curves shown in Figure 1 illustrate the trends of relative permeability for the liquid and gas phases, along with the variations in capillary pressure with changes in water saturation. Specifically, the relative permeability of the liquid phase decreases as the residual water saturation increases, while it increases with increasing residual gas saturation. On the other hand, the relative permeability of the gas phase (CO2) demonstrates an inverse relationship: it increases with increasing residual water saturation and decreases with increasing residual gas saturation. This indicates that when more pore spaces are occupied by residual gas, the flowability is affected.

3. Project Overview

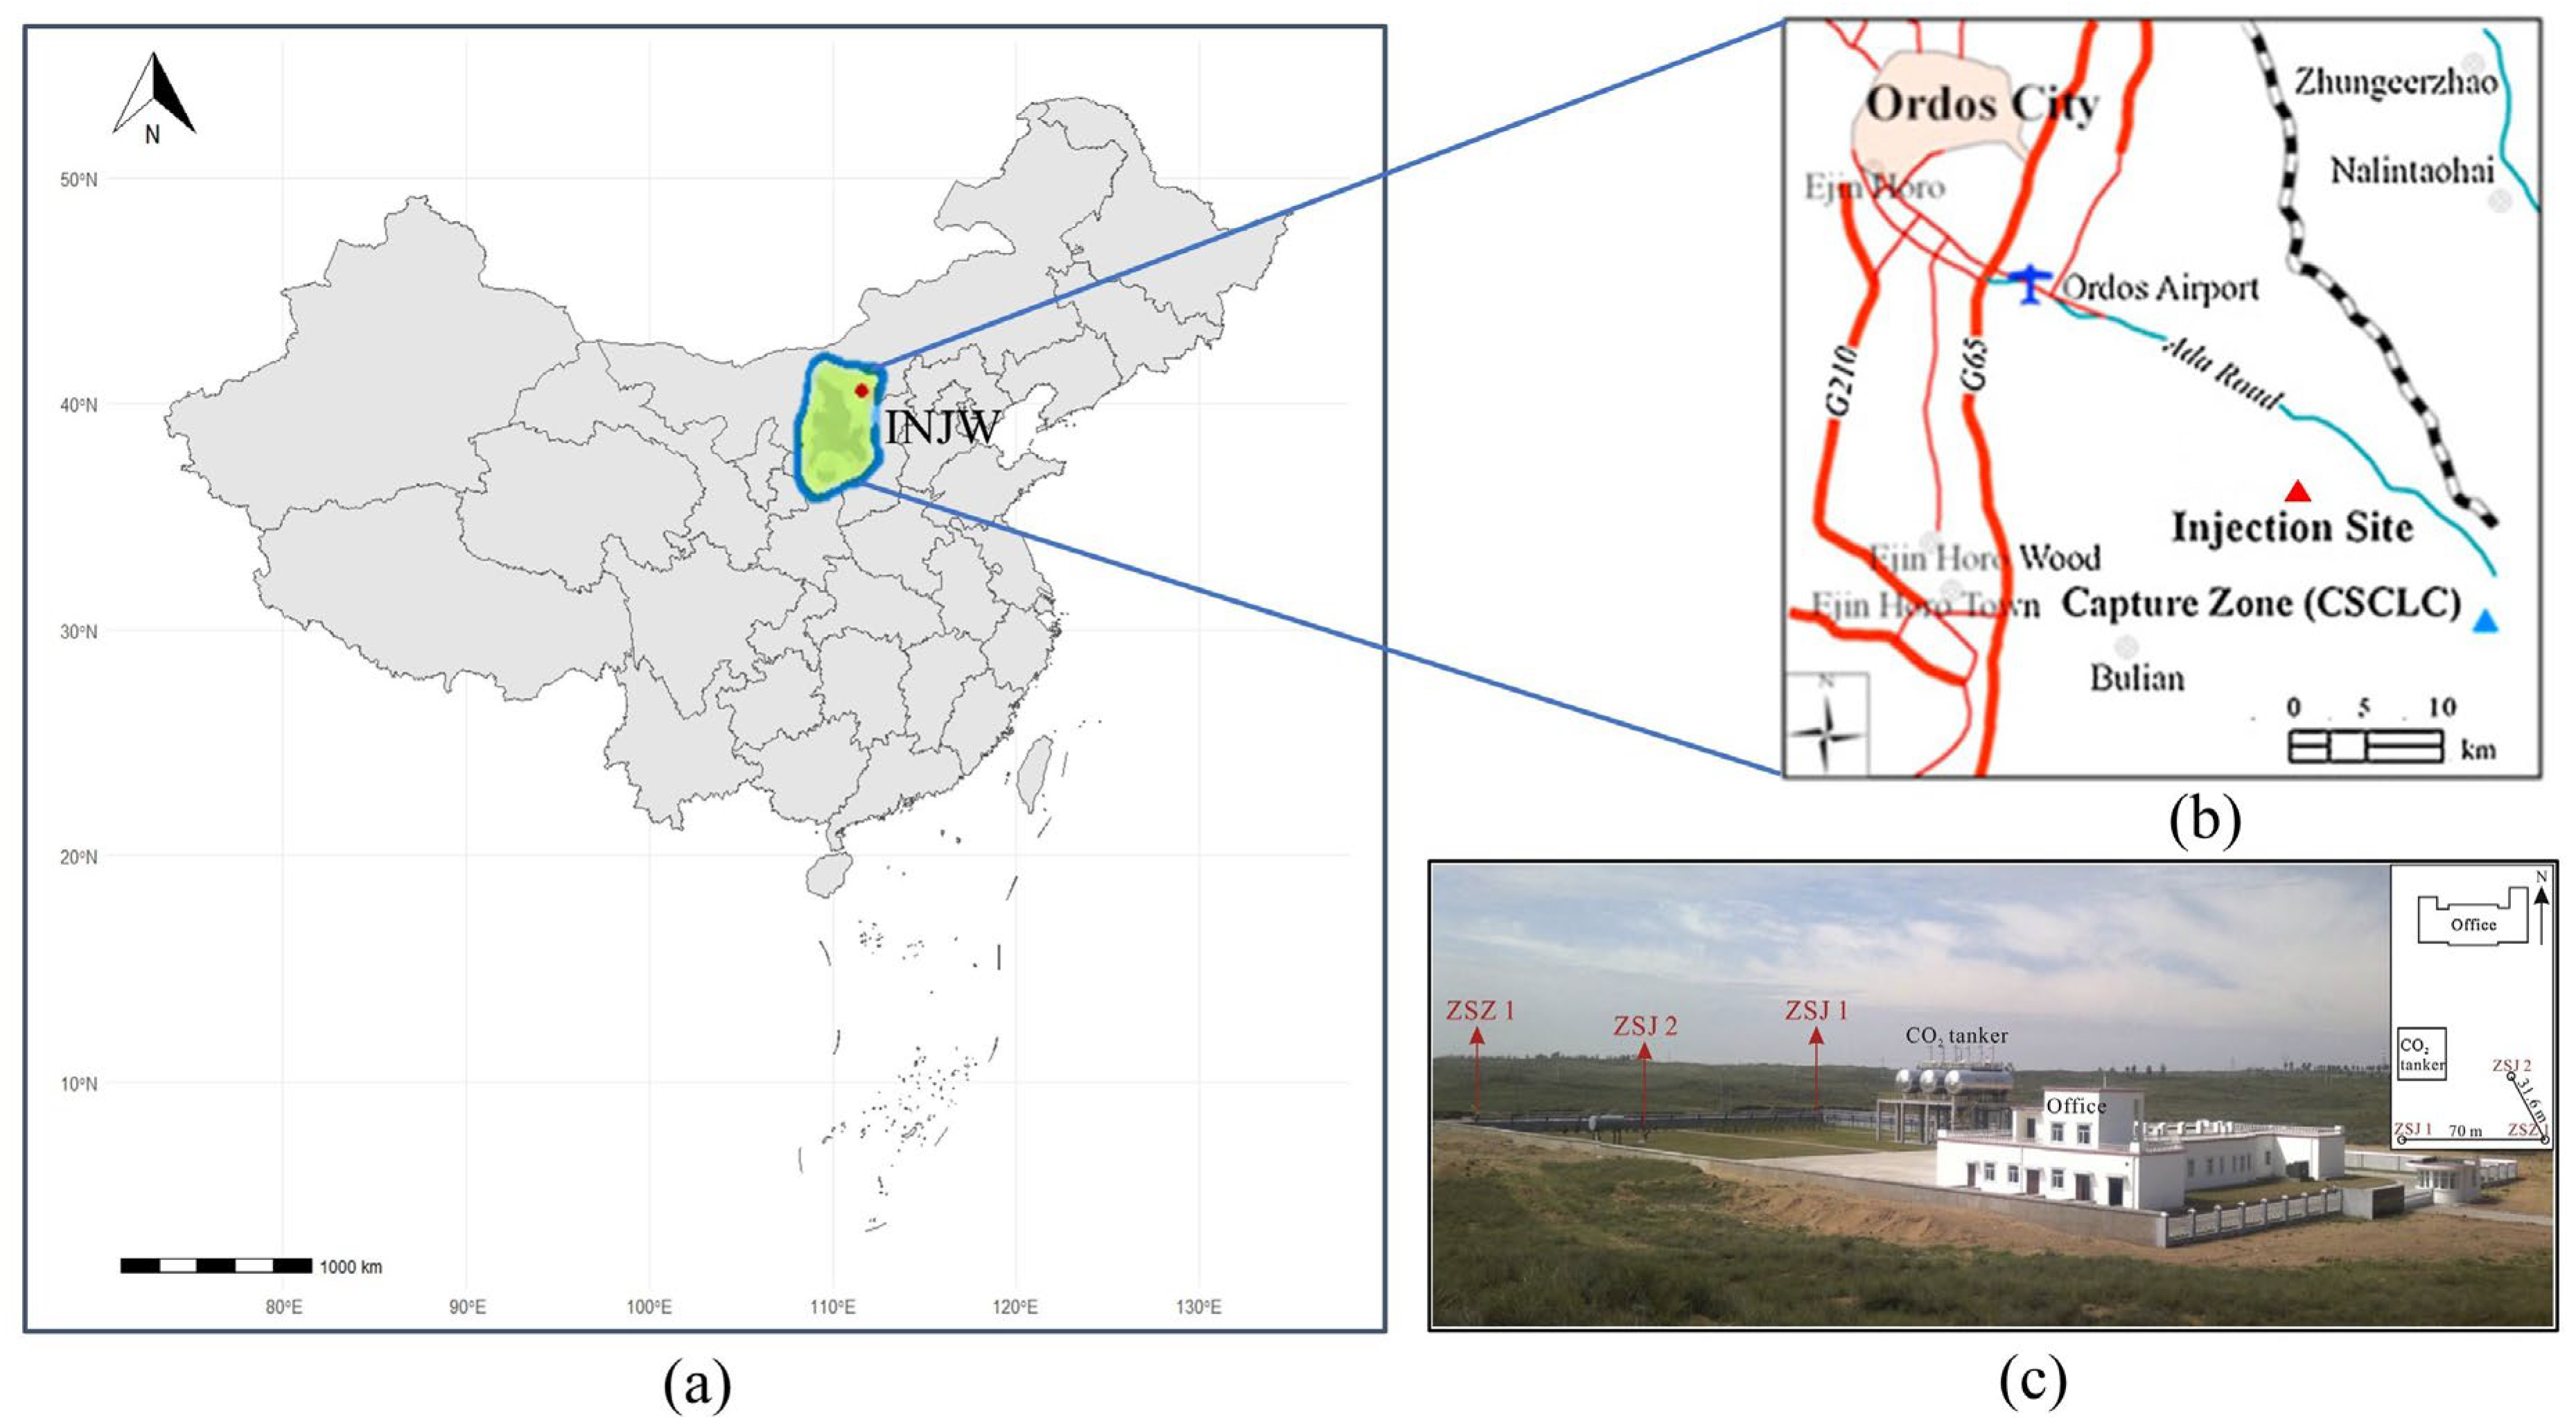
The Shenhua Ordos CCS project is situated in the northeastern part of the Ordos Basin in China (see Figure 2) [22]. The Ordos Basin, located above the Proterozoic metamorphic basement, is a craton basin characterized by layered sedimentary sequences. This geological setting offers suitable reservoir and seal formations in the Triassic and Permian strata, making it conducive for CO2 sequestration. This represents China’s inaugural pilot-scale, full-chain demonstration initiative for the deep saline aquifer storage of CO2. Spanning an area of 11,200 m2, the storage site incorporates one injection well and two monitoring wells. Monitoring well 1 is situated at a distance of 70 m from the injection well, while Monitoring well 2 is situated 31.61 m away (refer to Figure 2c). Real-time transmission of monitoring data, encompassing parameters such as pressure and temperature, is realized within both the injection and monitoring wells. The injection well has a depth of 2826 m and includes casing with a radius exceeding 1500 m, featuring an inner diameter of 30 mm. Below the 1500 m threshold, the well transitions into an open hole with a radius of 62 mm. Four reservoir–caprock combinations have been identified, namely the Majiagou, Shanxi, Shihezi, and Shiqaingfeng Formations.
Subject to stringent assessments [28,29], the project’s objective is the sequestration of 300,000 tons of CO2, which is sourced from direct coal liquefaction facilities, into saline aquifers characterized by low permeability. The carbon dioxide is intended to be stored at subsurface depths ranging between 1600 and 2500 m, within an anticipated timespan of three years. Contrary to these projections, the actual injection phase spanned an extended timeframe, commencing in May 2011 and concluding in April 2015 [15]. By analyzing actual monitoring data, it was revealed that over 80% of the CO2 is absorbed by the Liujiagou Formation and the Shiqaingfeng Formation, with the upper reservoir exhibiting a higher production coefficient and the most substantial effective pressure gradient [23].
Figure 2. Shenhua CCS Project Location (adapted from Xie et al. [30]). Geographic location of the site in the Ordos basin (a,b), and the relative location of the monitoring wells to the injection well (c).
Water 15 03316 g002

4. Model Establishment

4.1. Modeling Approach and Modeling Tools

The objective of this study is to simulate the injection of CO2 as a supercritical fluid into a saline aquifer. The primary focus is on modeling the flow of multiphase fluids (H2O-CO2-NaCl) in porous media. To achieve this, we employ the TOUGH (ECO2N) module which is tailored for CO2 geological storage in saline aquifers [31]. ECO2N, a fluid property module for the TOUGH2 simulator (Version 2.0), includes a comprehensive description of the thermodynamics and thermophysical properties of H2O-NaCl-CO2 mixtures. These properties accurately replicate fluid behavior under the temperature, pressure, and salinity conditions of interest (283.15 K ≤ T ≤ 383.15 K; P ≤ 600 bar; salinity up to full halite saturation). In this modeling approach, water (brine) acts as the wetting phase, while CO2 is considered a non-wetting fluid. The flow process takes place within a fully saturated porous region filled with water (brine), and it can be simulated under both isothermal and non-isothermal conditions [32]. We develop a two-dimensional isothermal model to analyze the distribution and migration behavior of carbon dioxide (CO2) in the reservoir–caprock. The simulation processes were exclusively performed using TOUGH (ECO2N), with the controlling equations specified in Table 1 and a comprehensive nomenclature presented at the conclusion of this research paper.

4.2. Spatial Discretization and Model Parameters

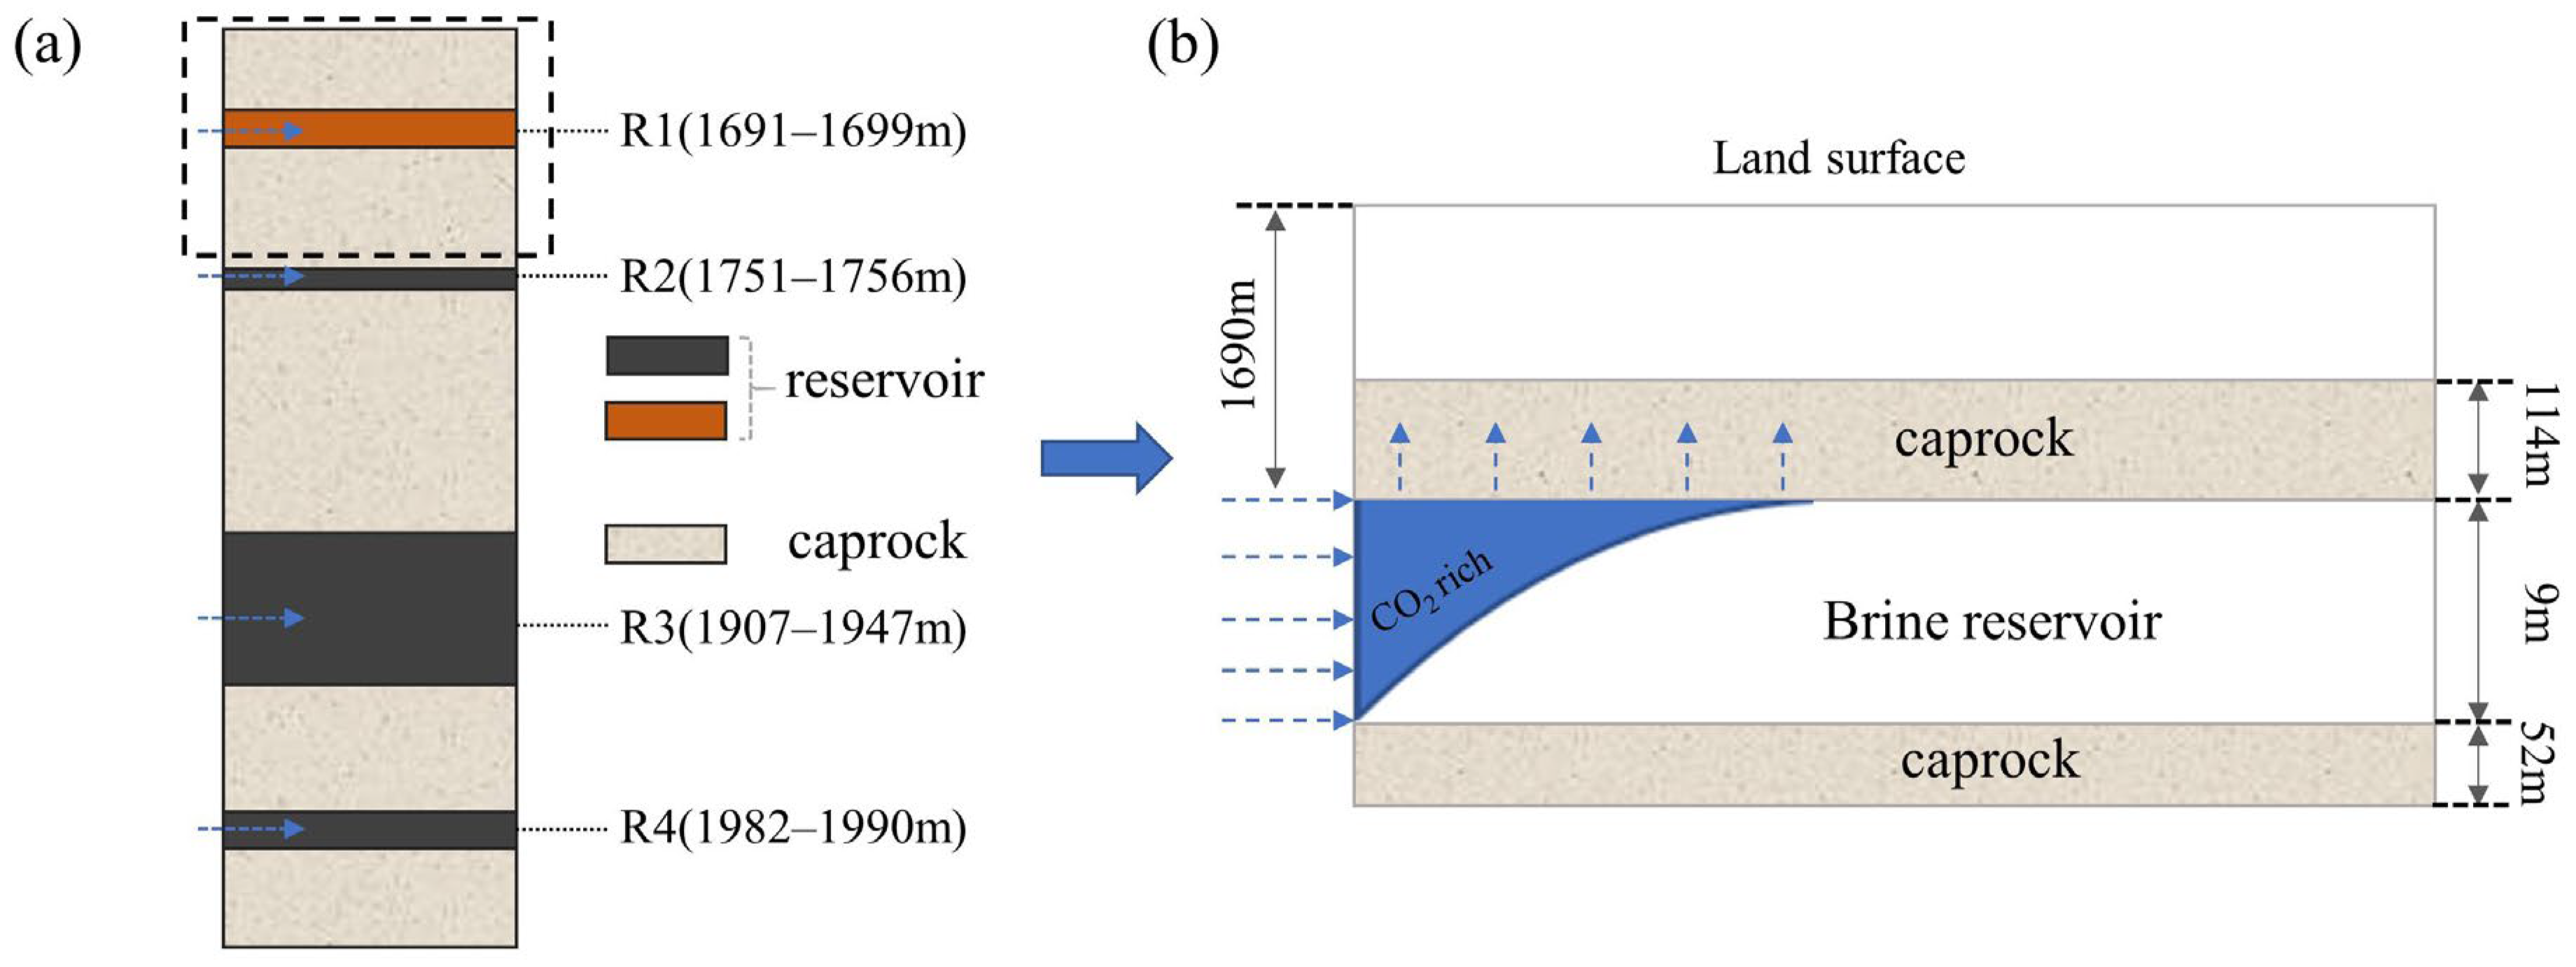
The geological conditions of the Shenhua CCS Demonstration Project site were simplified, and the resulting formation parameters, as shown in Table 2, were determined. Utilizing the available data, we developed a two-dimensional isothermal model to examine the interaction between the reservoir and the caprock. Figure 3 presents a schematic diagram of the fundamental model, covering a depth range of 1576 m to 2105 m with a total thickness of 529 m. The model comprises four distinct reservoir–caprock combinations. Importantly, this study focuses on the reservoir formation of the Liujiagou formation (as indicated in Figure 3b), as well as the upper and lower caprock layers, because of their high carbon dioxide absorption capacity within the storage zone. The Liujiagou formation extends from a depth of 1576 m to 1699 m, with an injection thickness of 9 m. It is divided into 22 layers, with varying grid thicknesses ranging from 2 m to 14 m, while the column widths exponentially increase from 0.75 m to 10,000 m. Overall, the model consists of 2200 grids (22 × 100).
The key parameters of the model are presented in Table 3. The VG model (van Genuchten, 1980) is employed to characterize the relative permeability and capillary pressure models of the reservoir–caprock system. Within the ECO2N module, subcritical and supercritical CO2 are unified as a non-wetting phase referred to as “gas”, while the potential occurrence of salt precipitation is not accounted for in this study.

4.3. Initial Conditions and Boundary Conditions

The horizontal boundaries of the model are defined as the first boundary, which employs large-volume boundary cells to maintain temperature and pressure at the edges of the model [33]. A constant hydrostatic pressure value model is used. The upper and lower boundaries of the model are considered to be zero-flux boundaries due to the presence of thick overlying layers. The initial salinity is determined based on actual water sample test results, and it is set at 0.03, measured in terms of mass fraction. The initial gas saturation of CO2 in the original formation is assumed to be 0. The initial temperature and pressure conditions are established in accordance with the equations specified in Table 3 [34].
The fixed parameters for the relative permeability model and capillary pressure model in this study are established according to Table 3. As mentioned in Section 2, the residual water saturation and residual gas saturation play pivotal roles in determining the relative permeability model and capillary pressure model. Thus, this study adopts various relative permeability models and capillary pressure models by altering the parameters of residual water saturation and residual gas saturation, as illustrated in Table 4 (note: abbreviation RP stands for Relative Permeability model, CP stands for Capillary Pressure model; CP (0.0) is equivalent to RP (0.4–0.05)). The simulation employs an injection mass rate of 1.8 kg/s, with continuous injection for one year, followed by a 1.2 kg/s injection for another year. The initial temperature and pressure conditions for injection, as well as the rock properties at the injection point, are uniform. The analysis of the effects of different relative permeability and capillary pressure parameters on CO2 distribution does not consider the heterogeneity of all formations. The coupled equations for determining the primary variables assume that the porous medium consists of rigid rock and both fluids are incompressible. Additionally, the dynamic viscosity of the fluids is assumed to be constant, and all source and sink terms are ignored.

5. Results and Discussions

5.1. Distribution and Migration Behavior of CO2 in the Reservoir–Caprock System

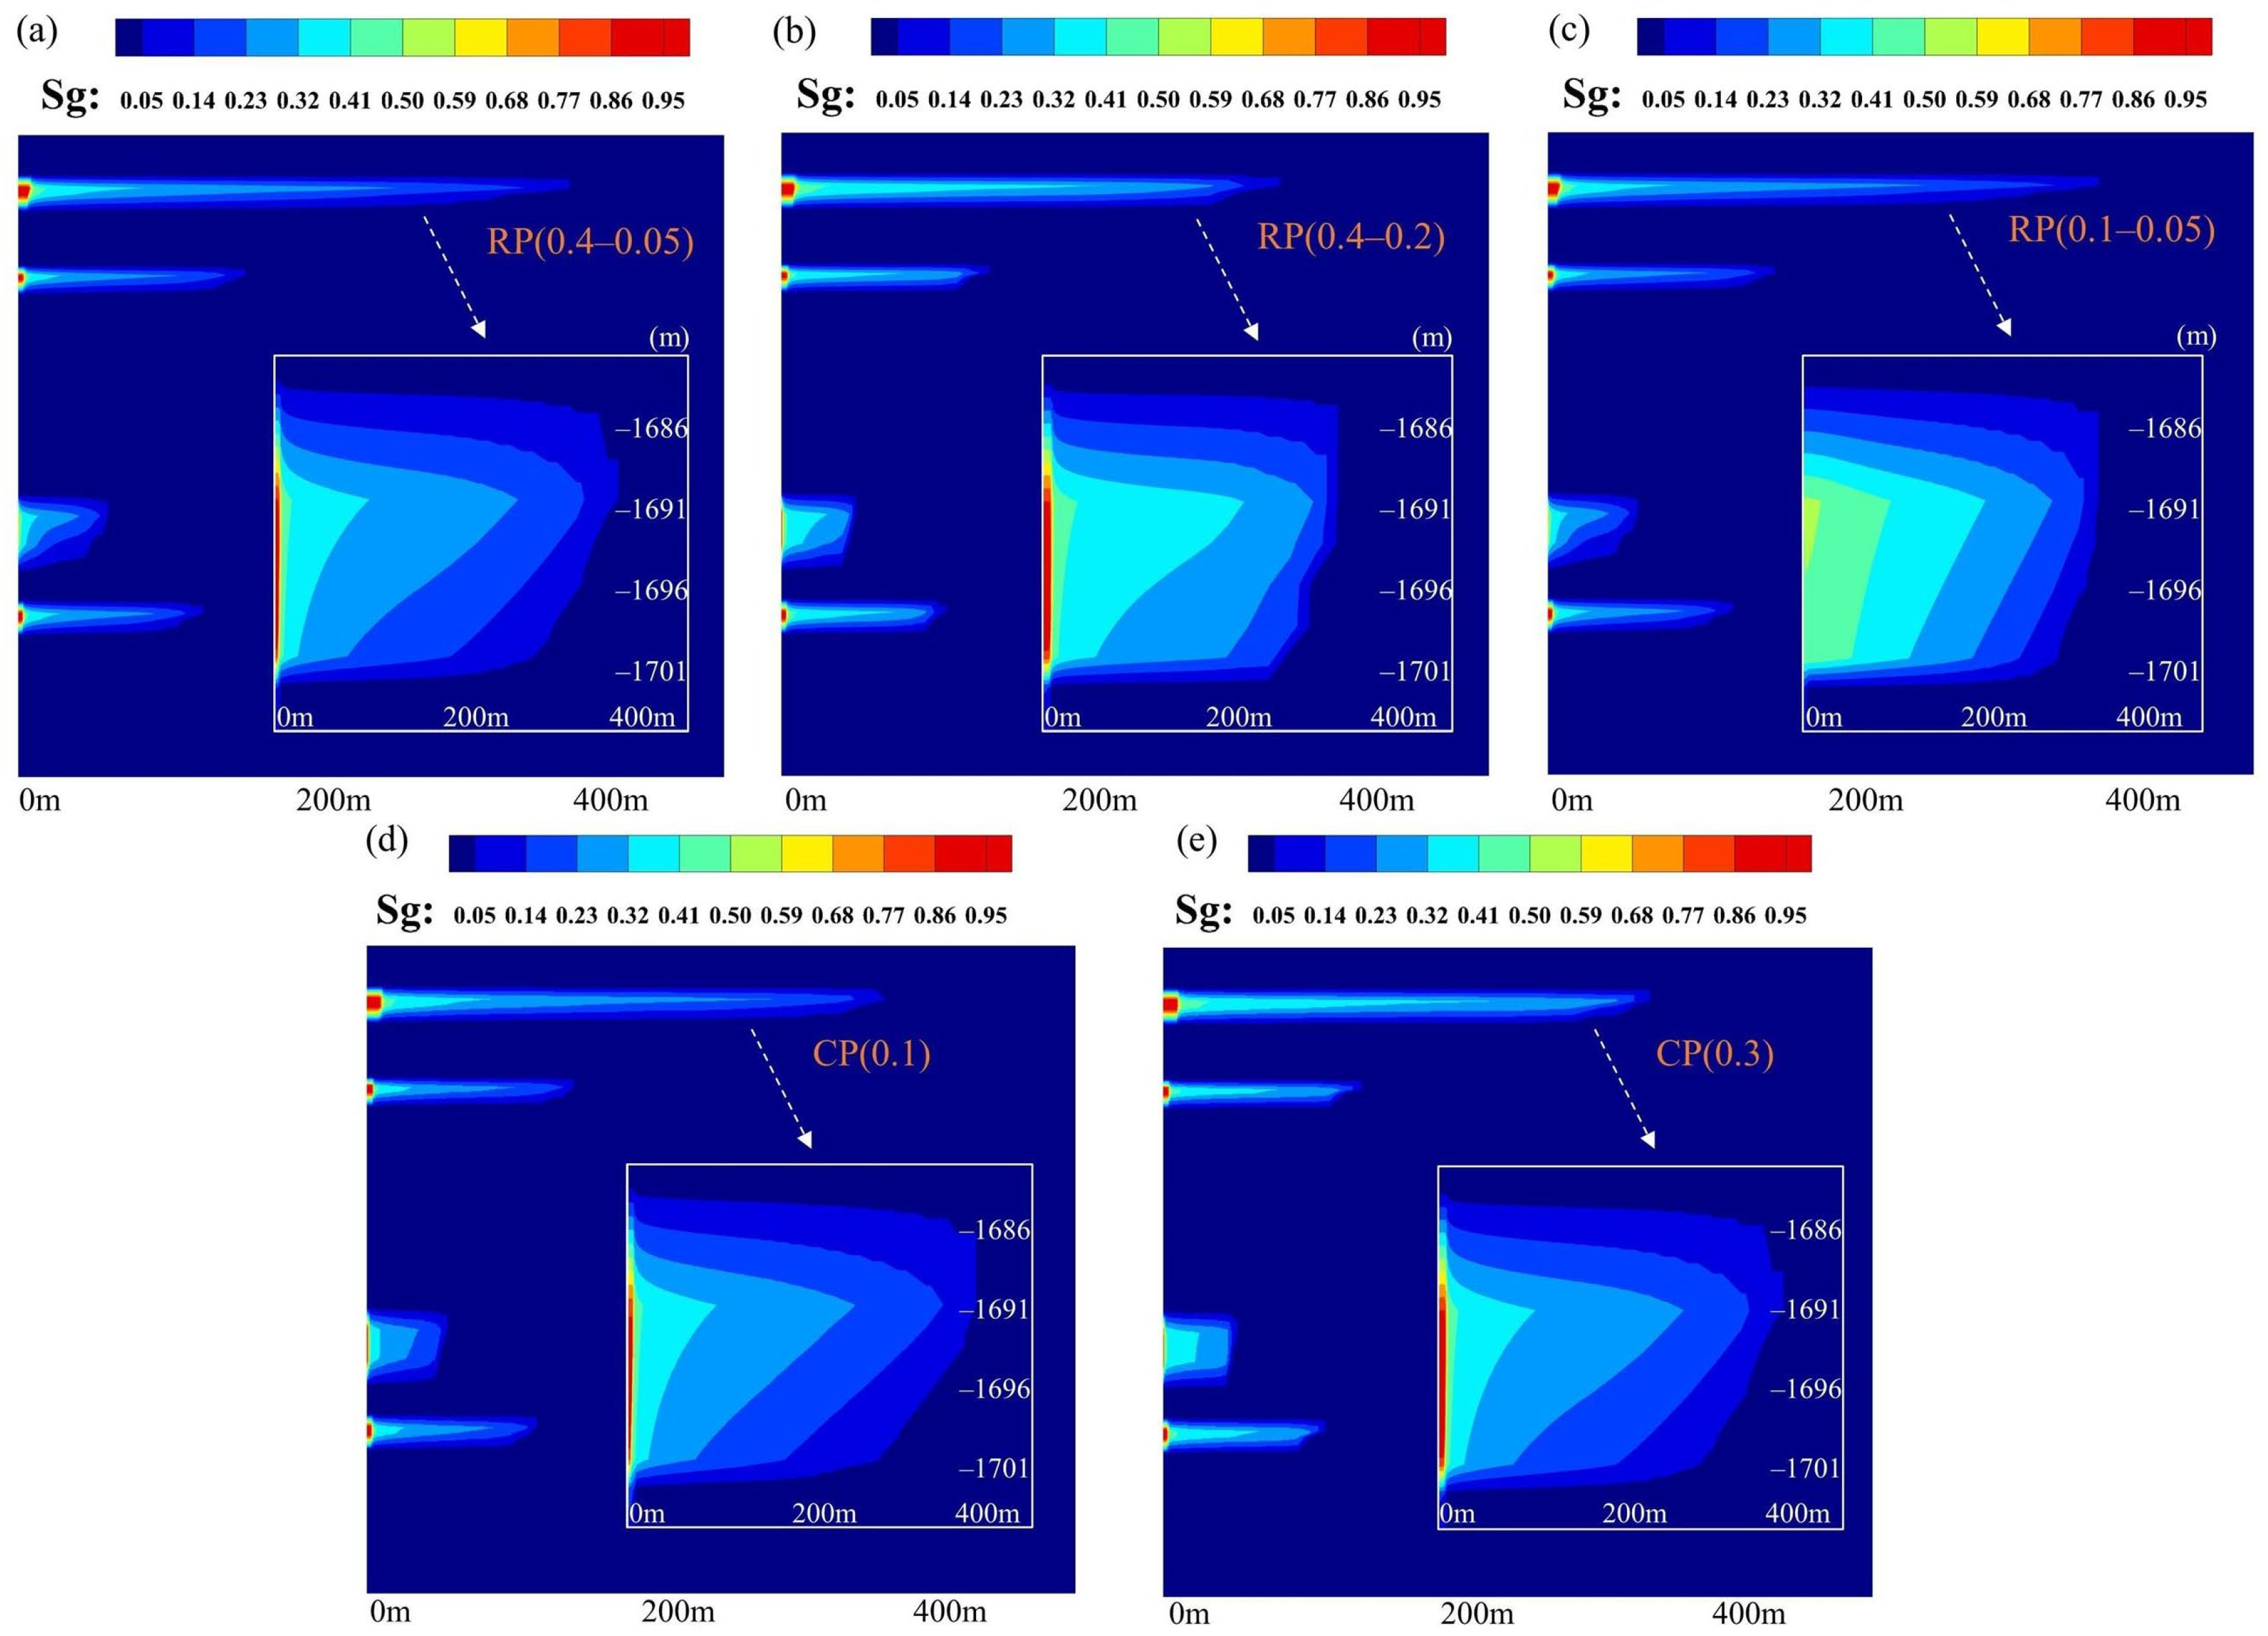
Upon commencement of CO2 injection, the lateral spread of the CO2 plume is sustained by concentration gradients, capillary forces, and hydrostatic pressure differences. Simultaneously, buoyancy facilitates the vertical migration of CO2, leading to its eventual accumulation at the caprock’s base and resulting in a pattern resembling a “plume” distribution [35]. Nevertheless, with prolonged injection of CO2 at high concentrations, its intrusion into the caprock induces a distinctive transition in the morphology of the CO2 plume at the interface between the reservoir and the caprock. Various models portraying the distribution of CO2 gas saturation in the Liujiagou formation, as depicted in Figure 4, demonstrate this phenomenon. It is evident from the figure that different relative permeability and capillary pressure models yield diverse impacts on the distribution and migration of CO2.
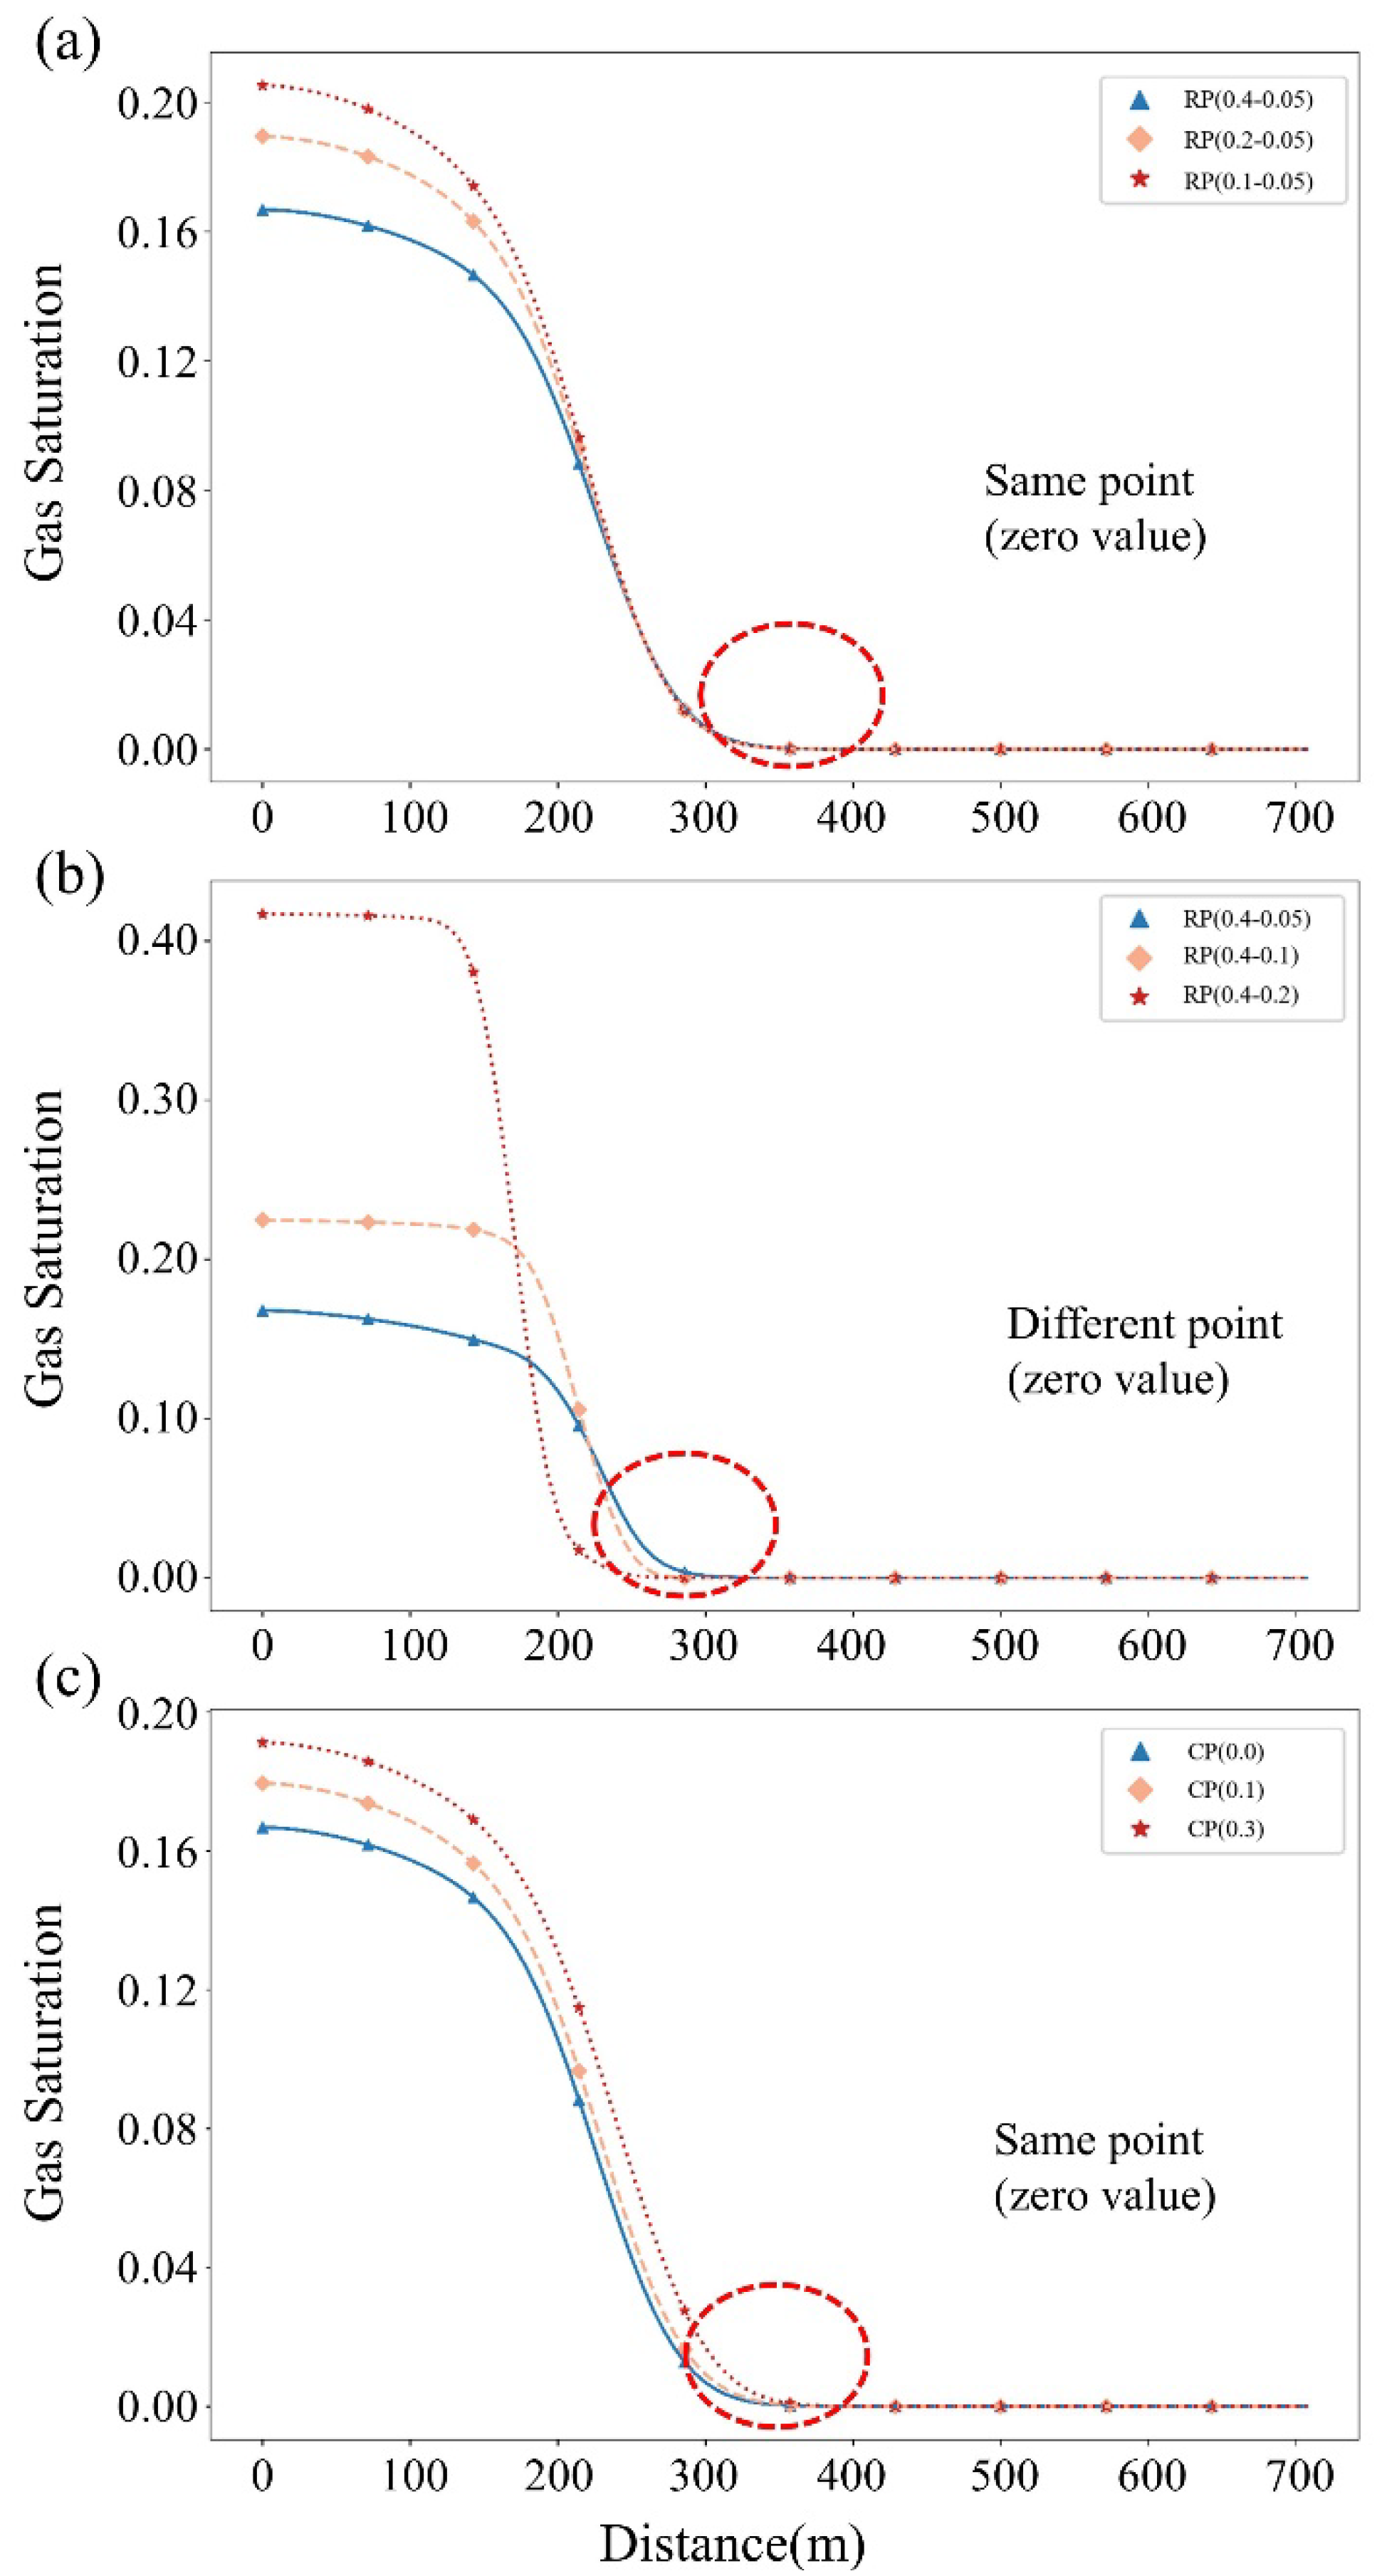
Based on the CO2 gas saturation curve along the horizontal monitoring line of different models (Figure 5a), it is observed that the gas saturation increases successively at the same spatial point when the residual water saturation decreases while keeping the residual gas saturation constant. This observation suggests that as the residual water saturation decreases, the relative permeability of the gas phase decreases, while the relative permeability of the liquid phase increases, resulting in a weaker gas flow ability [19]. However, it is noteworthy that the farthest diffusion distance of CO2 remains unchanged (the curves have the same zero point), indicating that the residual gas saturation remains constant. In other words, the change in residual water saturation does not affect the farthest diffusion distance of CO2, yet it does enhance the likelihood of gas migration upwards and subsequent accumulation as CO2 at the bottom of the caprock.
In the case where the residual water saturation remains constant and the residual gas saturation increases successively, various relative permeability models indicate a successive increase in CO2 saturation at the same spatial point (Figure 5b). This is due to the enlargement of the non-wetting condition of the rock formation as the residual gas saturation increases. During the displacement phase, the saturation of water decreases, leading to a decrease in the relative permeability of the liquid phase. Although CO2 experiences buoyancy, the ability of saltwater to displace the space occupied by CO2 diminishes, resulting in a weakened ability of CO2 to occupy new saltwater spaces. Moreover, as the non-wetting characteristic of the rock formation intensifies and the residual gas saturation increases, a larger quantity of CO2 becomes trapped in the minuscule pores of rock particles. Additionally, the larger the residual gas saturation, the shorter the horizontal diffusion distance of CO2. This indicates that a change in residual gas saturation, even when the residual water saturation remains unchanged, can impact the maximum diffusion distance of CO2.
By varying the parameters of the capillary pressure model while keeping other conditions constant, an increase in residual water saturation is observed, which corresponds to an increase in capillary pressure. Analysis of the curves reveals a successive rise in CO2 saturation at equidistant spatial points (Figure 5c). During the initial injection stage of CO2, as it tries to enter water-saturated pores, capillary pressure poses resistance, making it more difficult for CO2 to penetrate the pores. However, as CO2 injection continues, it surpasses the capillary displacement pressure and gains entry into the pores. Once injection ceases, capillary pressure restrains CO2 from escaping the occupied pores. Hence, higher capillary pressure increases the probability of CO2 becoming trapped within the pores, resulting in a greater CO2 saturation. Notably, different capillary pressure models exhibit distinct characteristics, but they share the same zero point when the relative permeability model remains unchanged. This finding suggests that the capillary pressure model does not exert influence on the maximum diffusion distance of CO2.
These findings are consistent with previous studies conducted by Krevor et al. and Zhao et al. [36,37], which also found that the migration range of CO2 plumes is limited by residual gas saturation. However, our study offers additional insights into the migration distance of carbon dioxide, which has not been explicitly explored in previous research. This observation necessitates further investigation into the influence of residual gas saturation. It is noteworthy that regardless of variations in residual water saturation, the maximum migration distance remains unchanged, indicating that residual gas saturation could potentially play a crucial role in determining the extent of CO2 plumes.

5.2. Assessment of the Sealing Efficacy of the Caprock

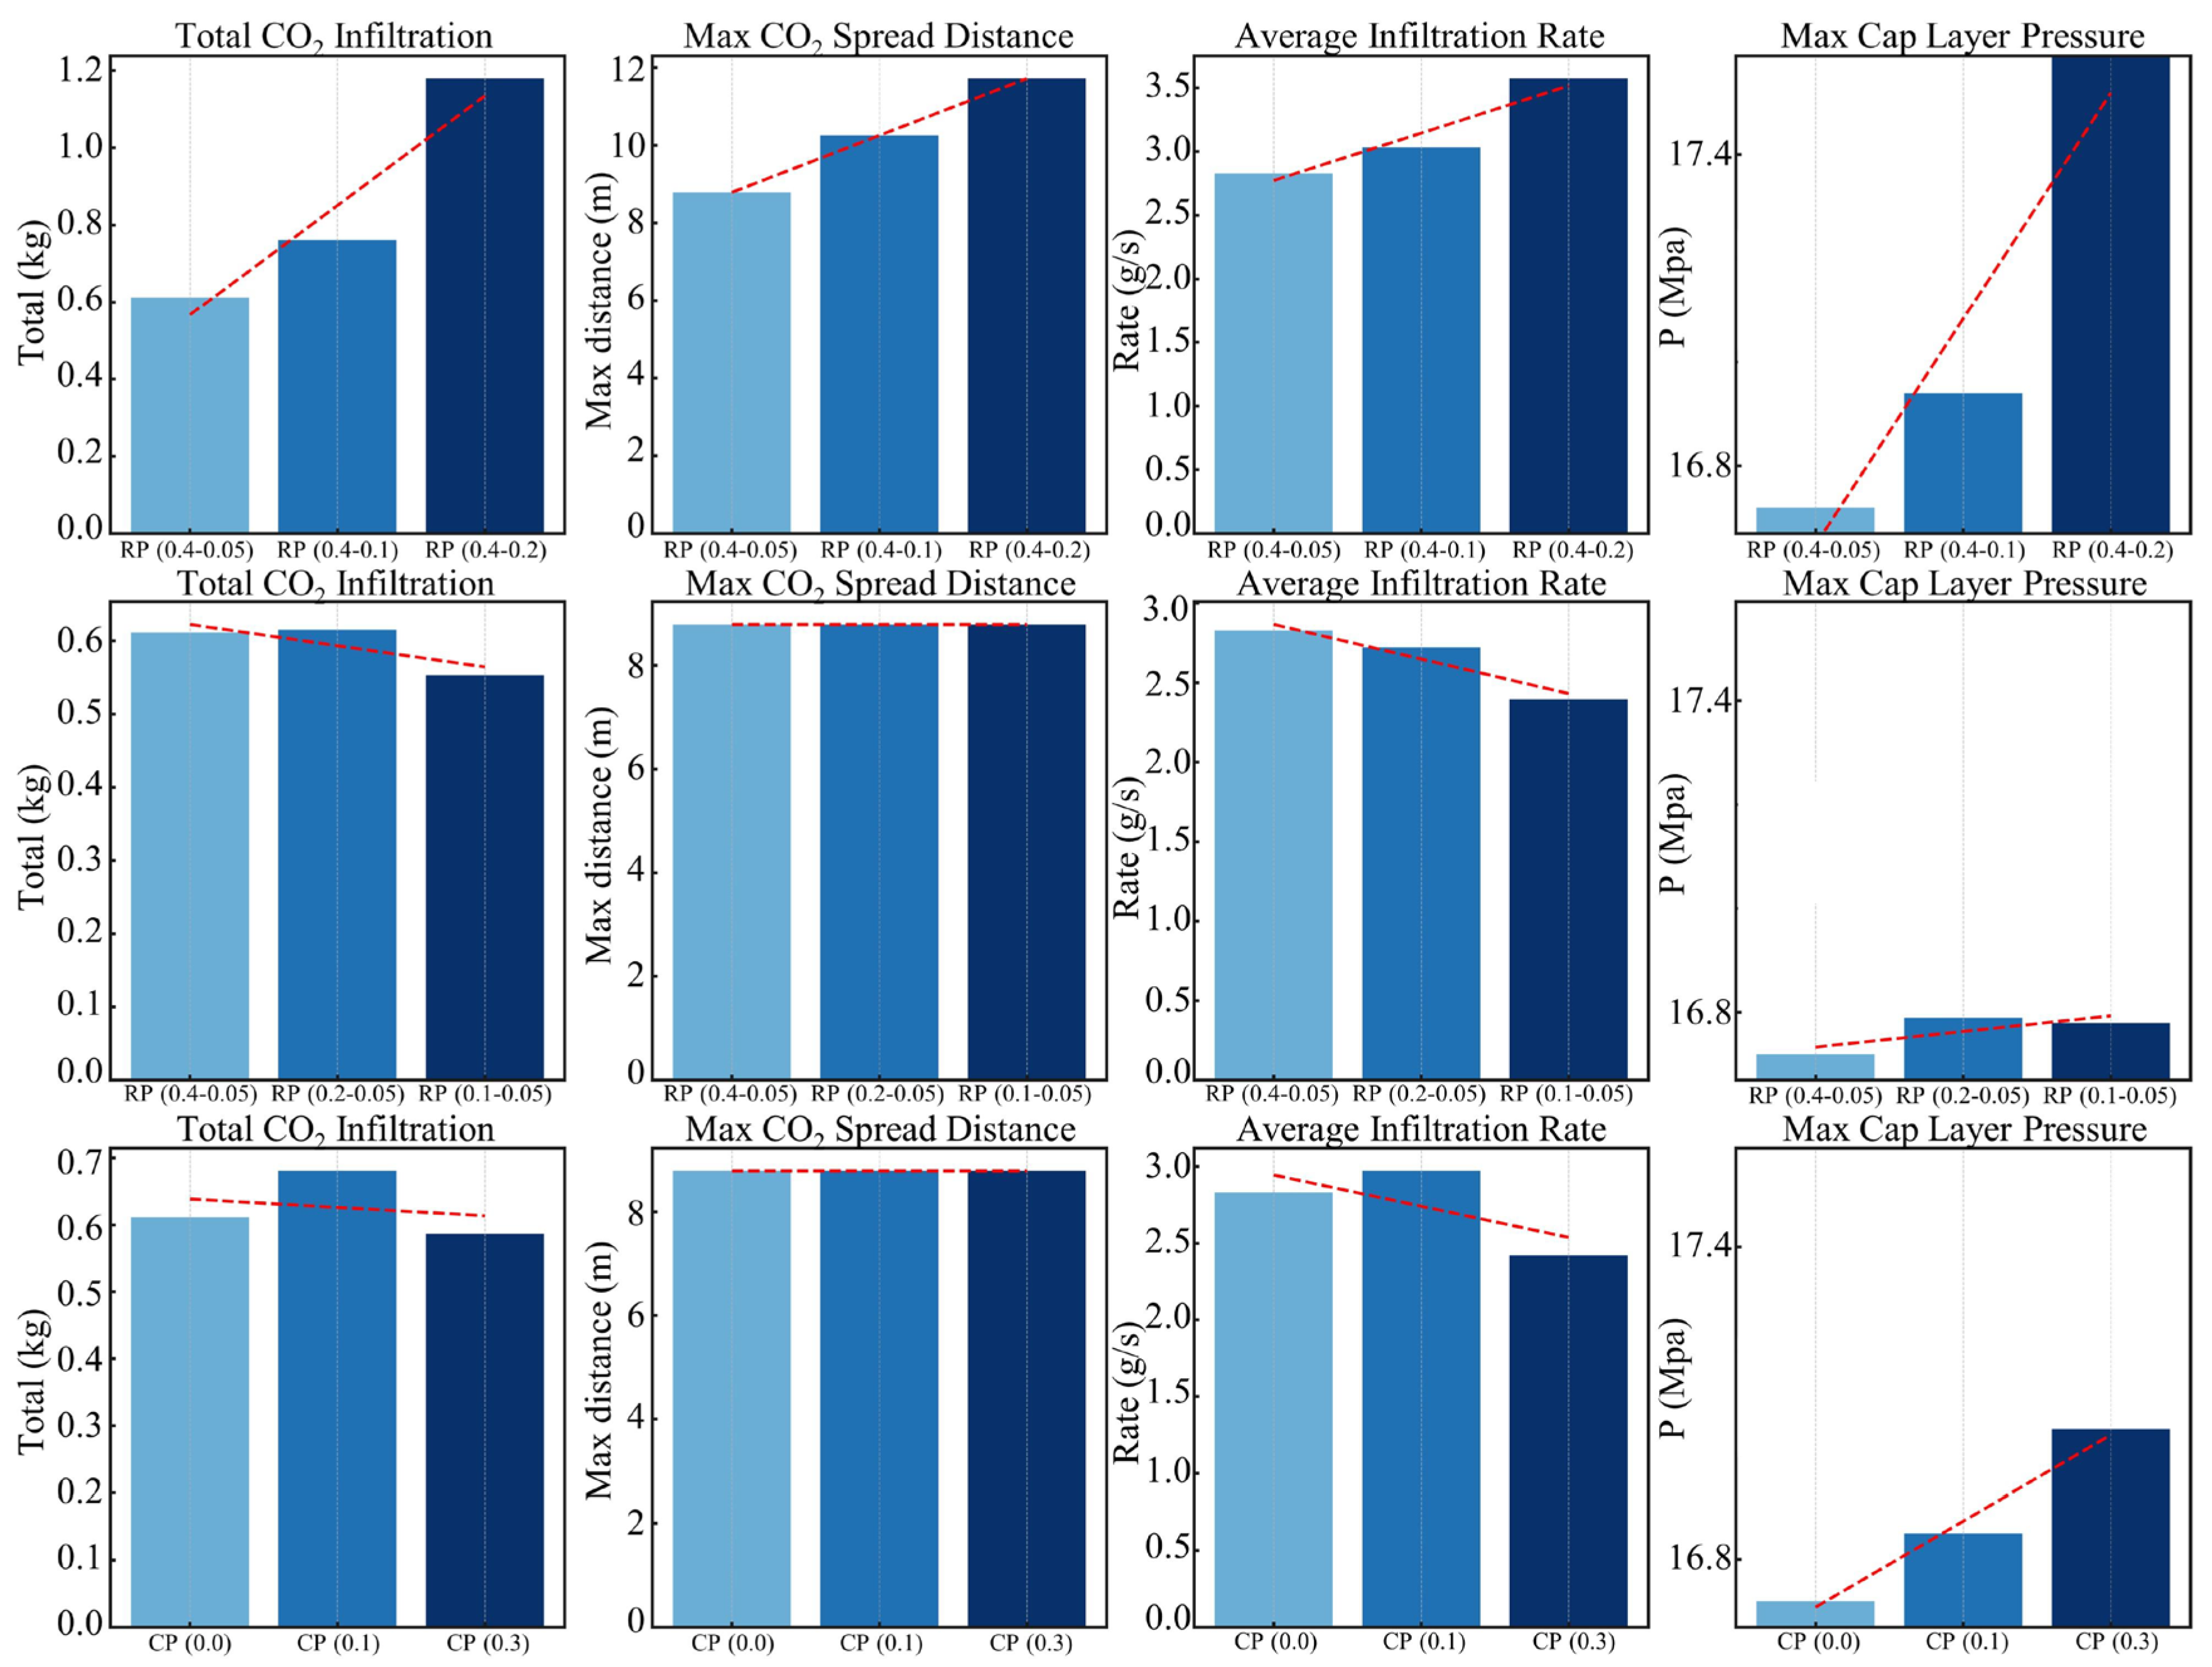
Evaluating the integrity of the caprock is a crucial aspect of CO2 geological storage. The integrity of the caprock directly affects the long-term effectiveness of CO2 storage. Caprock acts as a natural barrier in underground storage systems, playing a vital role in preventing CO2 leakage. Inadequate caprock integrity can lead to CO2 permeating through pores or spreading through fractures to the surface, posing environmental and human health risks and potentially compromising the sustainability of the storage system. Thus, evaluating the integrity of the caprock is of the utmost importance. Common evaluation methods include the safety diagnostic factor method introduced by the GeoNOC-CO2 team and the Net–Gross method [38]. Figure 6 presents a comparative analysis of the farthest diffusion distance, total infiltration amount, average flow rate, and maximum pressure values among different intrusion models, based on the findings from the TOUGH simulation. Significant variations in the total infiltration amount, farthest diffusion distance, and maximum pressure values are observed among the different models. However, the farthest diffusion distance increases only with an increase in residual gas saturation. Furthermore, changing the residual water saturation parameter does not affect the farthest diffusion distance when the residual gas saturation remains constant, which aligns with the earlier findings (see Figure 5 and Figure 6).
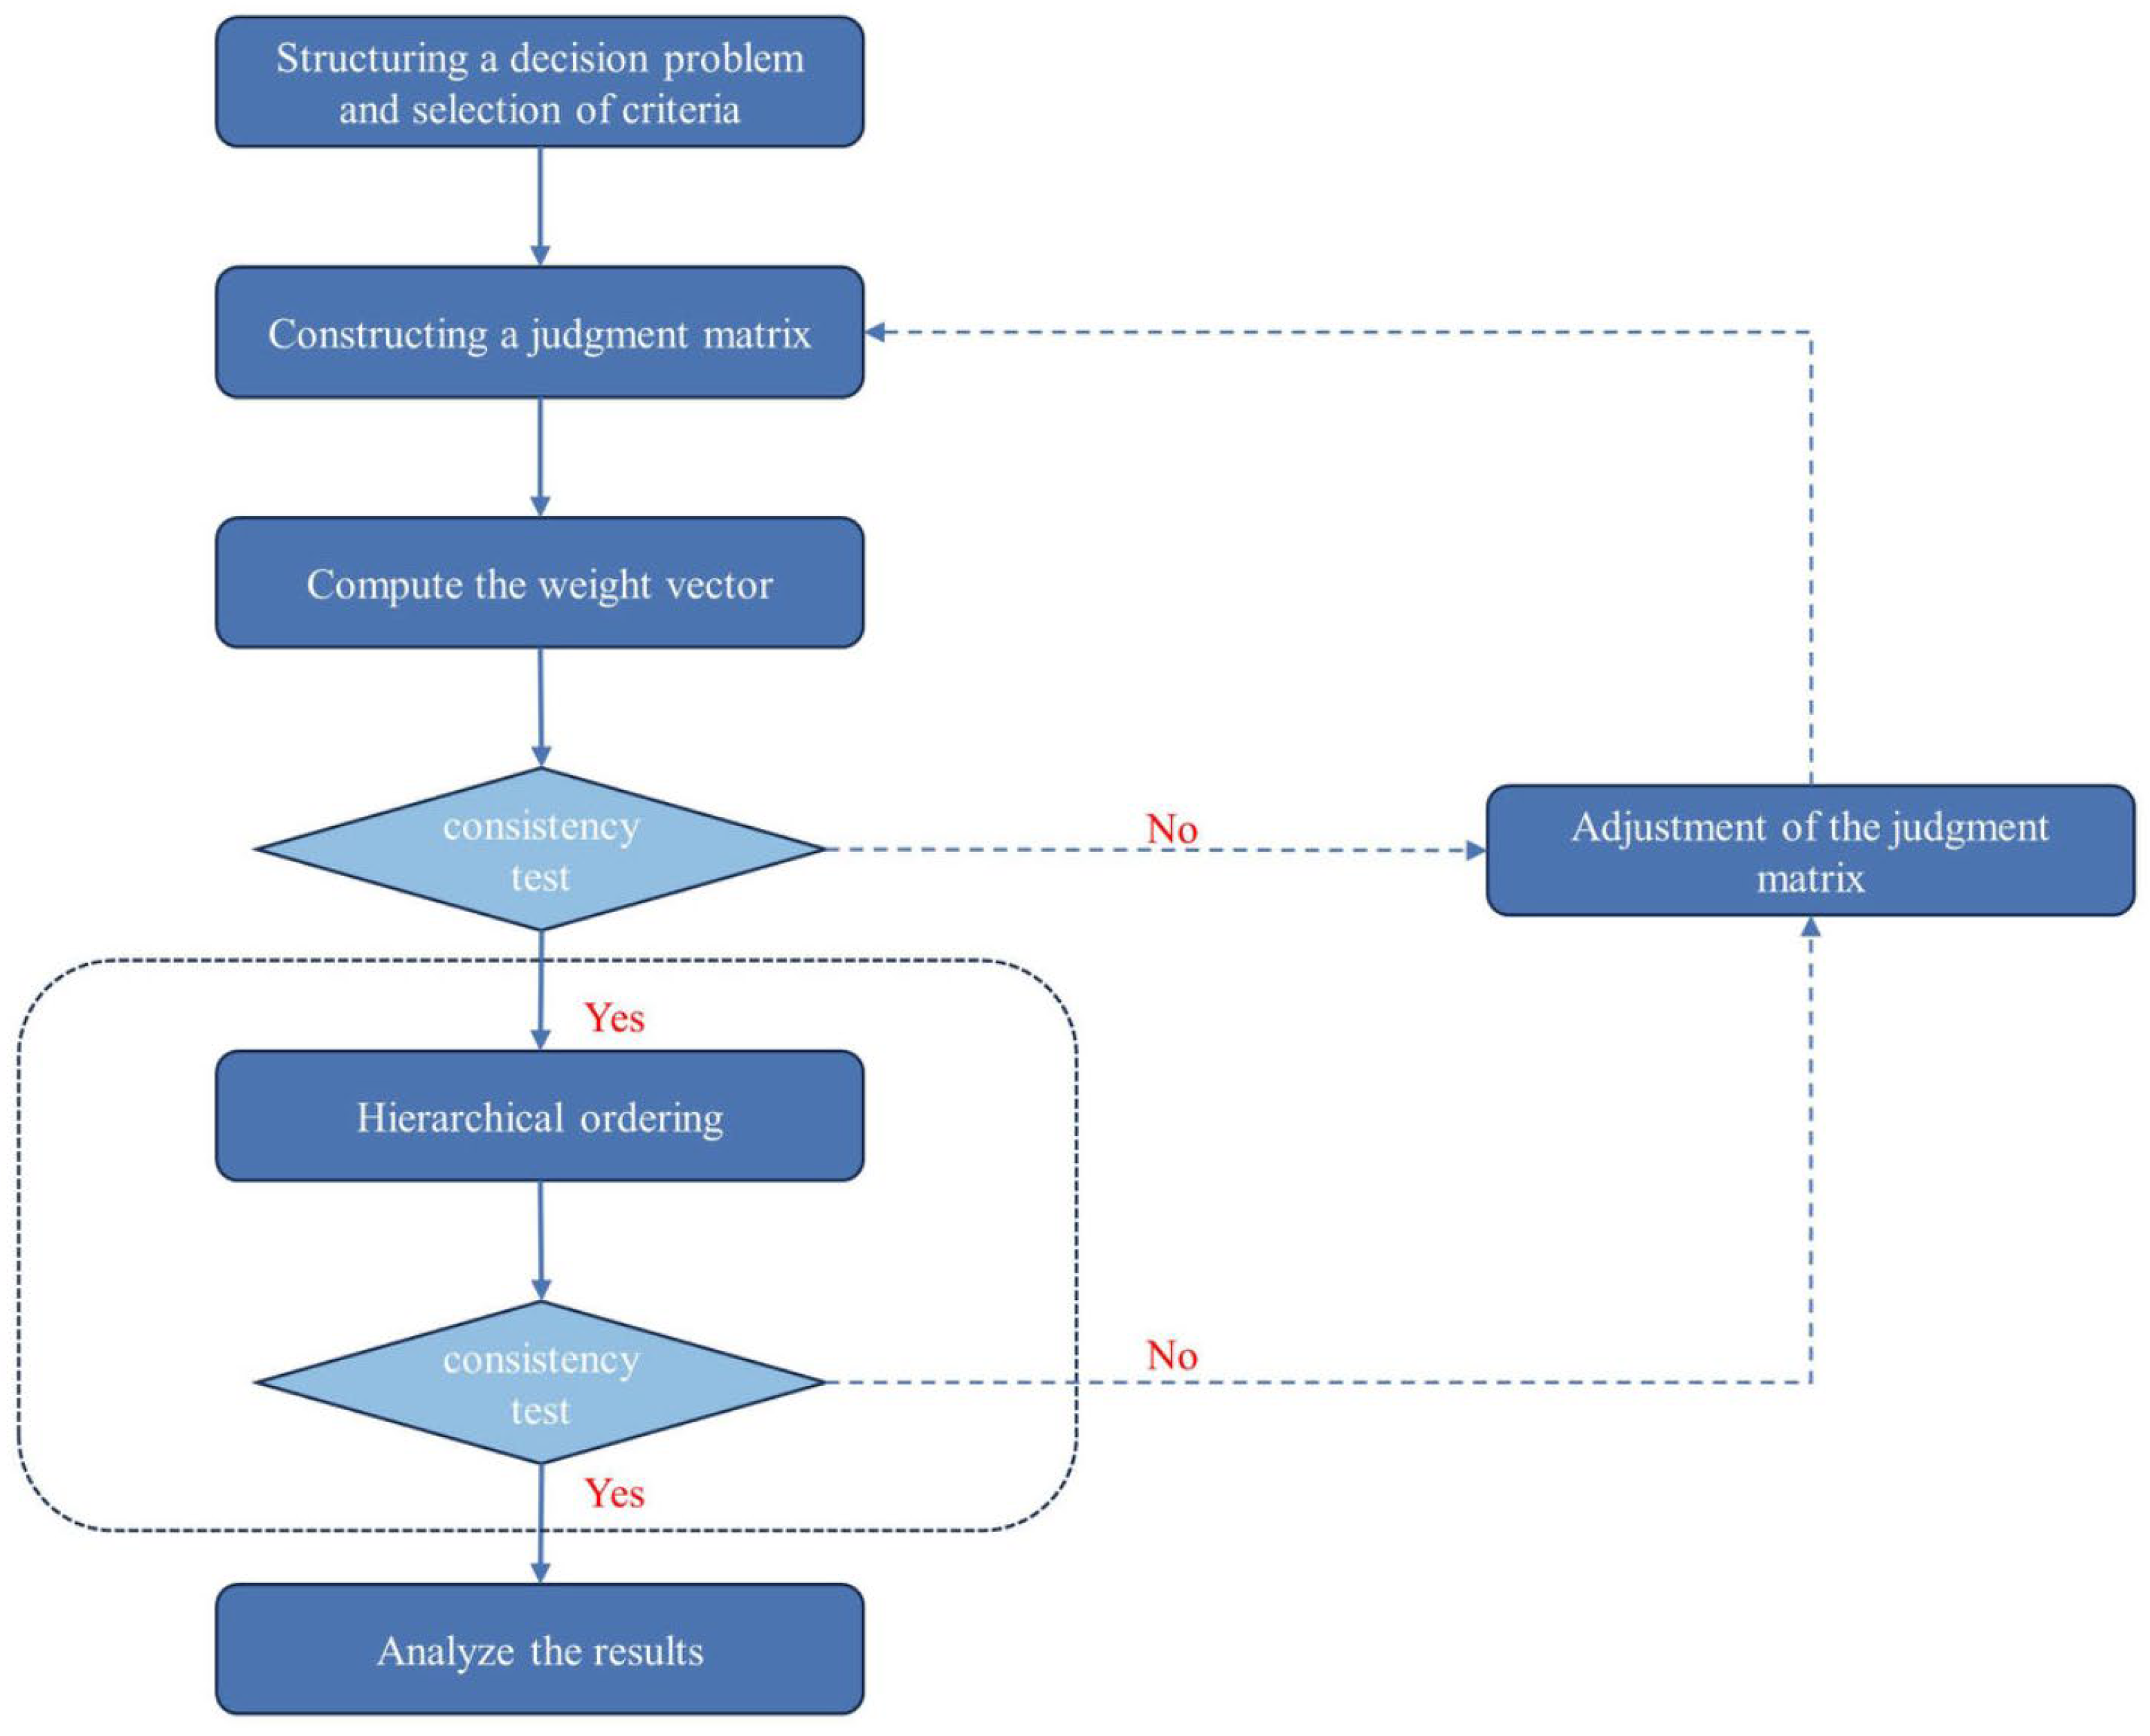
To systematically and hierarchically evaluate influencing factors, this study employed Analytic Hierarchy Process (AHP) quantitative analysis to rank various caprock models and offer insights for parameter optimization, constituting an effective approach in assessing the impact of caprock sealing. Three levels were established in this study (Figure 7), including the goal level (evaluating caprock models), the criterion level (comprising total volume, flow rate, distance, and pressure as the four indicators), and the alternative level (eight parameter models. Note: CP (0.0) is equivalent to RP (0.4–0.05)). Through a combination of expert ratings and data variations, the weight of criteria with higher variations was adjusted using the ratio of each criterion’s standard deviation to the maximum standard deviation. Consequently, a 4 × 4 decision matrix was formed, as presented in Table 5. Simultaneously, eight schemes were used to form four 8 × 8 judgment matrices based on four criteria. The initial scores were normalized to derive the weight matrix for each scheme. These weight matrices were then integrated with the criteria weight matrix to determine the comprehensive weights and rankings of each scheme, as illustrated in Table 6. For each judgment matrix, the maximum eigenvalue and its corresponding eigenvector were computed, and consistency tests were conducted using the consistency index, random consistency index, and consistency ratio. The obtained results met the prescribed criteria. The complete workflow of the Analytic Hierarchy Process (AHP) analysis in this paper is depicted in Figure 8.
Consistency tests can be employed to determine the consistency ratio of the overall ranking, which is based on the decision results represented by the weight vector of the total ranking. Consistency test (CR = 0.052 < 0.1) of the AHP analysis was conducted and passed. The weights of each indicator—maximum pressure, maximum dispersion distance, invasion total, and average flow speed—were as follows: 0.537, 0.279, 0.121, 0.063. The pressure conditions at the top of the caprock were an important factor affecting the safety of CO2 storage. Excessive pressure can cause the caprock to fracture, while excessively low pressure can result in CO2 upward invasion. According to the analysis of the judgment matrix, the maximum dispersion distance of CO2 is also an important indicator for evaluating CO2 leakage. It has a reasonable weight and practical geological significance.
The results demonstrate a ranking of the models: RP (0.4–0.2) > RP (0.4–0.1) > RP (0.4–0.05) = CP (0.0) > RP (0.1–0.05) > CP (0.1) > CP (0.3) > RP (0.2–0.05), reflecting a descending order of influence on the caprock’s sealing performance. RP (0.4–0.2) exhibits the highest impact but is the most unfavorable for caprock sealing due to its elevated residual saturation, facilitating CO2 invasion into the caprock. Conversely, RP (0.2–0.05) exerts the least influence and is the most advantageous for caprock sealing due to its low residual saturation, impeding CO2 infiltration. The detrimental effect on sealing performance increases in RP models with higher residual saturation. CP (0.3) outperforms CP (0.1) and CP (0.0) due to its elevated capillary pressure, enhancing resistance against CO2. In relative permeability models, residual saturation holds critical significance, with higher residual gas saturation intensifying the negative impact on sealing performance through increased CO2 penetration. Capillary pressure serves as another crucial factor affecting caprock sealing. Appropriately augmenting residual water saturation in the capillary pressure model enhances the caprock’s ability to withstand CO2, thereby improving sealing performance.
Raza (2018) proposed the reduction in residual gas saturation as a means to enhance storage effectiveness. In their study, they discovered a significant correlation between residual gas saturation and pressure, which aligns with the findings of this research [39]. However, their work did not provide further insights into residual water saturation. Li (2017) highlighted the beneficial impact of lower residual water saturation on CO2 migration through aquifers [40]. This lead to improved reservoir storage capacity and reduced leakage risk, in line with the outcomes presented in this study. The notion that higher capillary pressure enhances CO2 storage effectiveness has garnered considerable support from the investigations conducted by Song (2013) and Ali (2022) [8,41]. Consequently, these works serve to further substantiate the accuracy of the analytical and evaluative outcomes of the present study.
An intriguing finding emerges from the analysis of relative permeability models, with RP (0.4–0.05) demonstrating superiority over RP (0.1–0.05) and RP (0.2–0.05). This observation highlights the significant impact of altering the residual water saturation solely on the liquid-phase relative permeability within this particular model, thereby enabling effective control of CO2 storage and attaining optimal sealing effects. Notably, the parameter values for this influence range between 0.4 and 0.1. This observation may indeed be linked to the artificial influence present in AHP analysis. Thus, it warrants further exploration in subsequent research, which can be conducted through experimental studies or numerical simulations [25].
Consequently, when undertaking caprock model selection and parameter optimization, it is advisable to prioritize models exhibiting lower residual saturation while ensuring an adequate capillary pressure capacity. Such an approach facilitates the achievement of optimal sealing effects.

6. Conclusions and Outlook

This study examines the impact of residual water saturation and residual gas saturation in relative permeability and capillary pressure models on the migration, distribution, and integrity of CO2 caprock seals. The analysis of our findings leads to the following conclusions:
(1) Confinement Capacity: A reduced residual water saturation and increased residual gas saturation enhance the gas phase’s relative permeability, strengthening the geological formation’s ability to confine CO2. Remarkably, the extent of CO2 diffusion is solely limited by residual gas saturation, negating the role of residual water saturation.
(2) Caprock Integrity: Elevated levels of residual gas saturation pose a higher risk of CO2 permeating through the caprock, jeopardizing containment. Additionally, capillary pressure models demonstrate that higher residual water saturation increases the caprock’s barrier capabilities against CO2. This signifies the necessity to prioritize models and caprocks that provide superior capillary pressure for optimal sealing.
(3) Optimization of Parameters: Solely fine-tuning the residual water saturation parameter within the relative permeability model can result in optimal CO2 containment. The study identifies an optimal range for this parameter to be between 0.4 and 0.1.
This research marks a substantial advancement in our understanding of CO2 geologic storage in saline aquifers. It offers a novel framework for evaluating the interplay between residual saturations, relative permeability, and capillary pressure. Importantly, we introduce the concept that residual gas saturation has a controlling role in CO2 migration, a factor often overlooked in prior numerical simulations. While the study provides a robust analytical base, it does have limitations tied to the Analytical Hierarchy Process (AHP) analysis, which may introduce human subjectivity into the scoring criteria. Future investigations should focus on defining the specific conditions and rock properties influencing residual gas saturation. This analysis provides valuable insights for practical CO2 storage projects. During the CO2 injection process, optimization of the geologic storage strategy can be achieved through adjustments to water flooding strategies (which affect residual water saturation) and control of gas injection pressure (which affects residual gas saturation). We strongly recommend the execution of further experimental and simulation studies to substantiate the relationship between residual saturation, relative permeability, capillary pressure, and CO2 migration patterns.

Author Contributions

Conceptualization, B.C. and Y.Z.; methodology, B.C.; software, B.C. and G.F.; validation, B.C., Y.Z. and P.L.; formal analysis, B.C.; investigation, G.F.; resources, B.C.; data curation, Y.Z. and P.L.; writing—original draft preparation, B.C.; writing—review and editing, Y.Z.; visualization, B.C.; supervision, S.Q. and T.H.; project administration, Y.Z., S.Q. and T.H.; funding acquisition, Y.Z., S.Q. and T.H. All authors have read and agreed to the published version of the manuscript.

Funding

This research was supported by the National Natural Science Foundation of China: 42141009, the IGGCAS Key programme: IGGCAS-202201 and IGGCAS-202204 and the Youth Innovation Promotion Association Foundation of the Chinese Academy of Sciences: 2019069.

Data Availability Statement

Not applicable.

Conflicts of Interest

The authors declare no conflict of interest.

Nomenclature

F κ mass or heat flux of component κ
f apparent friction coefficient
h β specific enthalpy of phase β
k absolute permeability
k r β relative permeability of phase β
M k mass or energy per volume of component k
P pressure
P β fluid pressure in phase β
q κ sinks and sources of component κ
Γ n closed boundary surface of V n
ρ R grain density of the rock
ϕ porosity
C R specific heat of the rock
s β saturation of phase β
t time
T temperature
u m mixture velocity (velocity of mass center)
u β or u β velocity of phase β
U β specific internal energy of phase β
V n subdomain of the flow system
X β κ mass fraction of component κ present in phase β
λ thermal conductivity
ρ β density of phase β
gorggravitational acceleration

References

  1. He, H.; Lian, J.; Chen, C.; Xiong, Q.; Li, C.C.; Zhang, M. Enabling Multi-Chemisorption Sites on Carbon Nanofibers Cathodes by an In-situ Exfoliation Strategy for High-Performance Zn–Ion Hybrid Capacitors. Nano-Micro. Lett. 2022, 14, 106. [Google Scholar] [CrossRef] [PubMed]
  2. Zhao, Y.; Setzler, B.P.; Wang, J.; Nash, J.; Wang, T.; Xu, B.; Yan, Y. An Efficient Direct Ammonia Fuel Cell for Affordable Carbon-Neutral Transportation. Joule 2019, 3, 2472–2484. [Google Scholar] [CrossRef]
  3. Aminu, M.D.; Nabavi, S.A.; Rochelle, C.A.; Manovic, V. A review of developments in carbon dioxide storage. Appl. Energy 2017, 208, 1389–1419. [Google Scholar] [CrossRef]
  4. Ajayi, T.; Gomes, J.S.; Bera, A. A review of CO2 storage in geological formations emphasizing modeling, monitoring and capacity estimation approaches. Pet. Sci. 2019, 16, 1028–1063. [Google Scholar] [CrossRef]
  5. Zhou, N.; Lu, S.; Wang, M.; Liu, W.; Guan, Y.; Tan, H.; Wang, Z. Applicability of fractal capillary pressure models to sandstones. J. Pet. Sci. Eng. 2020, 185, 106626. [Google Scholar] [CrossRef]
  6. Kalam, S.; Olayiwola, T.; Al-Rubaii, M.M.; Amaechi, B.I.; Jamal, M.S.; Awotunde, A.A. Carbon dioxide sequestration in underground formations: Review of experimental, modeling, and field studies. J. Pet. Explor. Prod. Technol. 2021, 11, 303–325. [Google Scholar] [CrossRef]
  7. Khudaida, K.J.; Das, D.B. A numerical study of capillary pressure–saturation relationship for supercritical carbon dioxide (CO2) injection in deep saline aquifer. Chem. Eng. Res. Des. 2014, 92, 3017–3030. [Google Scholar] [CrossRef]
  8. Song, J.; Zhang, D. Comprehensive Review of Caprock-Sealing Mechanisms for Geologic Carbon Sequestration. Environ. Sci. Technol. 2013, 47, 9–22. [Google Scholar] [CrossRef]
  9. Jiao, Z.; Pawar, R.; Duguid, A.; Bourcier, W.; Haussmann, C.; Coddington, K.; Harp, D.; Ganshin, Y.; Quillinan, S.; McLaughlin, F.; et al. A Field Demonstration of an Active Reservoir Pressure Management through Fluid Injection and Displaced Fluid Extraction at the Rock Springs Uplift a Priority Geologic CO2 Storage Site for Wyoming. Energy Procedia 2017, 114, 2799–2811. [Google Scholar] [CrossRef]
  10. Das, D.B.; Mirzaei, M.; Widdows, N. Non-uniqueness in capillary pressure–saturation–relative permeability relationships for two-phase flow in porous media: Interplay between intensity and distribution of random micro-heterogeneities. Chem. Eng. Sci. 2006, 61, 6786–6803. [Google Scholar] [CrossRef]
  11. Celia, M.A.; Bachu, S.; Nordbotten, J.M.; Bandilla, K.W. Status of CO2 storage in deep saline aquifers with emphasis on modeling approaches and practical simulations. Water Resour. Res. 2015, 51, 6846–6892. [Google Scholar] [CrossRef]
  12. Bachu, S. Screening and ranking of sedimentary basins for sequestration of CO2 in geological media in response to climate change. Environ. Geol. 2003, 44, 277–289. [Google Scholar] [CrossRef]
  13. Lee, Y.; Kim, K.; Sung, W.; Yoo, I. Analysis of the Leakage Possibility of Injected CO2 in a Saline Aquifer. 2010. Available online: https://pubs.acs.org/doi/pdf/10.1021/ef100073m (accessed on 7 February 2023).
  14. Yang, D.; Wang, S.; Zhang, Y. Analysis of CO2 Migration during Nanofluid-Based Supercritical CO2 Geological Storage in Saline Aquifers. Aerosol Air Qual. Res. 2014, 14, 1411–1417. [Google Scholar] [CrossRef]
  15. Zhang, K.; Xie, J.; Li, C.; Hu, L.; Wu, X.; Wang, Y. A full chain CCS demonstration project in northeast Ordos Basin, China: Operational experience and challenges. Int. J. Greenh. Gas Control 2016, 50, 218–230. [Google Scholar] [CrossRef]
  16. Fawad, M.; Mondol, N.H. Monitoring geological storage of CO2: A new approach. Sci. Rep. 2021, 11, 5942. [Google Scholar] [CrossRef] [PubMed]
  17. Fawad, M.; Mondol, N.H. Monitoring geological storage of CO2 using a new rock physics model. Sci. Rep. 2022, 12, 297. [Google Scholar] [CrossRef]
  18. Jia, W.; McPherson, B. Multiphase Flow Associated with Geological CO2 Storage. In Science of Carbon Storage in Deep Saline Formations; Elsevier: Amsterdam, The Netherlands, 2019; pp. 117–143. [Google Scholar] [CrossRef]
  19. Juanes, R.; Spiteri, E.J.; Orr, F.M., Jr.; Blunt, M.J. Impact of relative permeability hysteresis on geological CO2 storage. Water Resour. Res. 2006, 42, W12418. [Google Scholar] [CrossRef]
  20. Yang, D.; Gu, Y. Permeability change during CO2 injection in coal: An experimental study. Int. J. Coal Geol. 2004, 59, 245–261. [Google Scholar]
  21. Pruess, K.; García, J. Multiphase flow dynamics during CO2 injection into saline aquifers. Environ. Geol. 2002, 42, 282–295. [Google Scholar] [CrossRef]
  22. Li, Z.; Dong, M.; Li, S.; Huang, S. CO2 storage in the Permian saline aquifers in the Ordos Basin, China. Int. J. Greenh. Gas Control 2013, 13, 155–168. [Google Scholar] [CrossRef]
  23. Deng, H.; Stauffer, P.H.; Dai, Z.; Jiao, Z.; Surdam, R.C. Simulation of industrial-scale CO2 storage: Multi-scale heterogeneity and its impacts on storage capacity, injectivity and leakage. Int. J. Greenh. Gas Control 2012, 10, 397–418. [Google Scholar] [CrossRef]
  24. Pruess, K.; Oldenburg, C.; Moridis, G. TOUGH2 User’s Guide Version 2.0; Lawrence Berkeley National Laboratory Report LBNL-43134; Lawrence Berkeley National Lab. (LBNL): Berkeley, CA, USA, 1999.
  25. Saaty, T.L. The Analytic Hierarchy Process; McGraw-Hill: New York, NY, USA, 1980. [Google Scholar]
  26. van Genuchten, M.T. A closed-form equation for predicting the hydraulic conductivity of unsaturated soils. Soil Sci. Soc. Am. J. 1980, 44, 892–898. [Google Scholar] [CrossRef]
  27. Corey, A.T. The interrelation between gas and oil relative permeabilities. Prod. Mon. 1954, 19, 38–41. [Google Scholar]
  28. Li, C.; Zhang, K.; Wang, Y.; Guo, C.; Maggi, F. Experimental and numerical analysis of reservoir performance for geological CO2 storage in the Ordos Basin in China. Int. J. Greenh. Gas Control 2016, 45, 216–232. [Google Scholar] [CrossRef]
  29. Li, Q.; Liu, G.Z.; Liu, X.H.; Li, X.C. Application of a health, safety, and environmental screening and ranking framework to the Shenhua CCS project. Int. J. Greenh. Gas Control 2013, 17, 504–514. [Google Scholar] [CrossRef]
  30. Xie, J.; Zhang, K.; Hu, L.; Wang, Y.; Chen, M. Understanding the carbon dioxide sequestration in low-permeability saline aquifers in the Ordos Basin with numerical simulations, Greenhouse Gases: Science and Technology. Greenh. Gases Sci. Technol. 2015, 5, 558–576. [Google Scholar] [CrossRef]
  31. Pruess, K. ECO2N: A TOUGH2 Fluid Property Module for Mixtures of Water, NaCl, and CO2; Lawrence Berkeley National Laboratory Report LBNL-57952; Lawrence Berkeley National Lab. (LBNL): Berkeley, CA, USA, 2005.
  32. Pruess, K.; Spycher, N. ECO2N—A fluid property module for the TOUGH2 code for studies of CO2 storage in saline aquifers. Energy Convers. Manag. 2007, 48, 1761–1767. [Google Scholar] [CrossRef]
  33. Yang, F.; Bai, B.; Tang, D.; Shari, D.; David, W. Characteristics of CO2 sequestration in saline aquifers. Fuel 2018, 216, 391–401. [Google Scholar] [CrossRef]
  34. Duan, Z.; Sun, R. An improved model calculating CO2 solubility in pure water and aqueous NaCl solutions from 273 to 533 K and from 0 to 2000 bar. Chem. Geol. 2003, 193, 257–271. [Google Scholar] [CrossRef]
  35. Hesse, M.A.; Orr, F.M.; Tchelepi, H.A. Gravity currents with residual trapping. J. Fluid Mech. 2008, 611, 35–60. [Google Scholar] [CrossRef]
  36. Krevor, S.; Blunt, M.J.; Benson, S.M.; Pentland, C.H.; Reynolds, C.; Al-Menhali, A.; Niu, B. Capillary trapping for geologic carbon dioxide storage—From pore scale physics to field scale implications. Int. J. Greenh. Gas Control 2015, 40, 221–237. [Google Scholar] [CrossRef]
  37. Zhao, B.; MacMinn, C.W.; Juanes, R. Residual trapping, solubility trapping and capillary pinning complement each other to limit CO2 migration in deep saline aquifers. Energy Procedia 2014, 63, 3833–3839. [Google Scholar] [CrossRef]
  38. Whittaker, S.; Rostron, B.; Hawkes, C.; Gardner, C.; White, D.; Johnson, J.; Chalaturnyk, R.; Seeburger, D. A decade of CO2 injection into depleting oil fields: Monitoring and research activities of the IEA GHG Weyburn-Midale CO2 Monitoring and Storage Project. Energy Procedia 2011, 4, 6069–6076. [Google Scholar] [CrossRef]
  39. Raza, A.; Gholami, R.; Rezaee, R.; Bing, C.H.; Nagarajan, R.; Hamid, M.A. CO2 storage in depleted gas reservoirs: A study on the effect of residual gas saturation. Petroleum 2018, 4, 95–107. [Google Scholar] [CrossRef]
  40. Li, Y.; Ranjith, P.G.; Perera, M.S.A.; Yu, Q. Residual water formation during the CO2 storage process in deep saline aquifers and factors influencing it: A review. J. CO2 Util. 2017, 20, 253–262. [Google Scholar] [CrossRef]
  41. Ali, M.; Jha, N.K.; Pal, N.; Keshavarz, A.; Hoteit, H.; Sarmadivaleh, M. Recent advances in carbon dioxide geological storage, experimental procedures, influencing parameters, and future outlook. Earth-Sci. Rev. 2022, 225, 103895. [Google Scholar] [CrossRef]
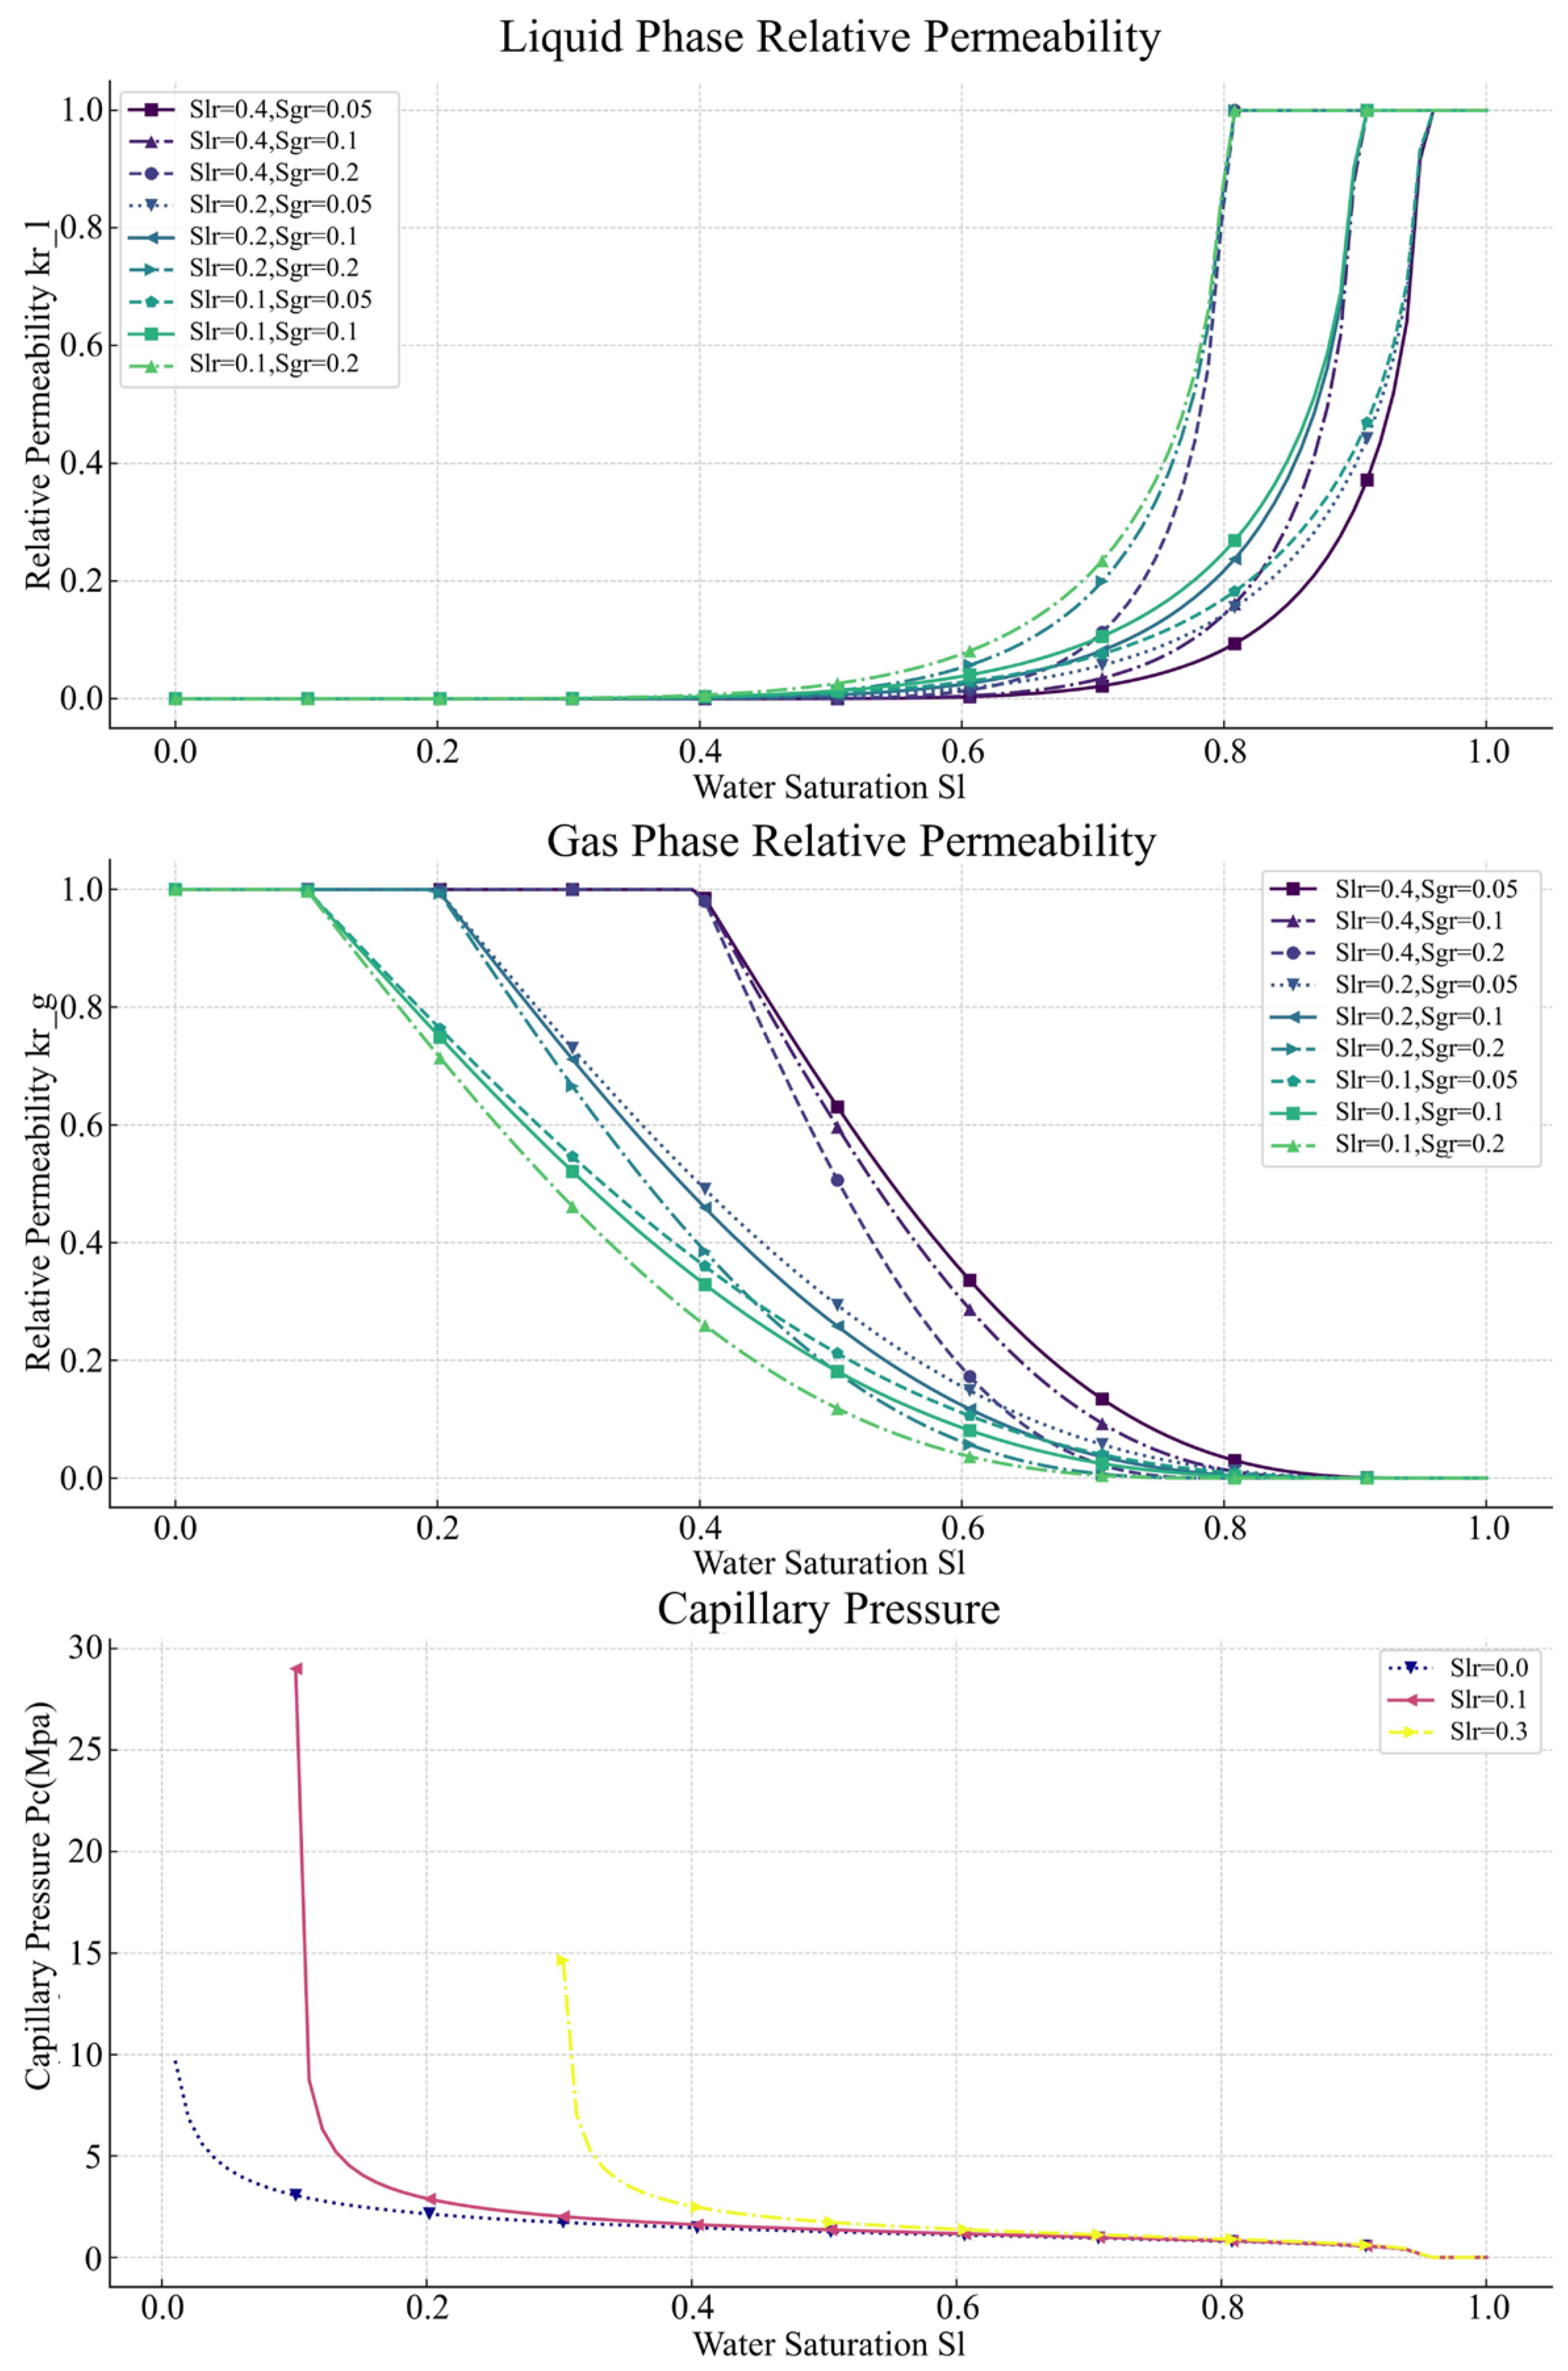
Figure 1. The relative permeability curve and capillary pressure curve under different parameters.
Water 15 03316 g001
Figure 3. Illustration of stratigraphic simulation: (a) represents the entire Shenhua CCS demonstration project’s simulated stratigraphy, (b) represents the Liujiagou Formation in the demonstration project.
Water 15 03316 g003
Figure 4. The spatial distribution of gas saturation in different relative permeability models and capillary pressure models, with the enlarged region in the figure representing the Liujiagou reservoir–caprock interval. (ae) represent RP (0.4–0.05), RP (0.4–0.2), RP (0.1–0.05), CP (0.1), CP (0.3) respectively.
Water 15 03316 g004
Figure 5. (a) Changes in residual water saturation in the relative permeability model; (b) Changes in residual gas saturation in the relative permeability model; (c) Changes in residual water saturation in the capillary pressure model.
Water 15 03316 g005
Figure 6. Comparative analysis of farthest diffusion distance, total infiltration amount, mean flow rate and maximum pressure.
Water 15 03316 g006
Figure 7. The Analytic Hierarchy Process (AHP) hierarchy structure.
Water 15 03316 g007
Figure 8. The whole AHP process.
Water 15 03316 g008
Table 1. The governing equations solved in ECO2N [31,32].
DescriptionEquation
Mass and Energy Conservation d d t V n   M k d V n = Γ n   F k n d Γ n + V n   q k d V n
For Mass M k = ϕ ρ S β ρ ρ X β x , F κ = ρ u β ρ ρ X β k
For Energy M k = ( 1 ϕ ) ρ R C R T + ϕ β S β ρ β U β , F k = λ T + β u β ρ β h β
Darcy’s law u β = k k r β μ ρ P β ρ β g
Table 2. Simplified stratigraphic parameters.
FormationReservoir Thickness
(m)
Cap
Thickness
(m)
Logging   Permeability   ( × 10 3   μ m2)Porosity
(%)
Fracturing Pressure
(MPa)
Formation Pressure (MPa)
R1916992.8110.635.2917.45
R25575.4712.437.5317.89
R3401911.4319.738.9520.15
R48436.5812.942.6021.43
Caprock---4.3--
Table 3. Model parameters of the base model.
ParametersValues
Porosity0.05–0.13
Permeability R 1 :   20 × 10 3   μ m 2 , R 2 R 4 :   1 × 10 3   μ m 2
Rock grain density 2260   k g / m 3
Specific heat of the rock grain 920   J / k g · K
Thermal conductivity 2.5   W / m · K
Initial temperature distribution T D = 0.03 D + 273.1924   K ( D > 1500   m )
Initial pressure distribution P ( D ) = 1.133 × 10 4 D 3.78 × 10 6   P a
Relative permeability model λ = 0.5   S l s = 1.0
Capillary pressure model λ = 0.271 1 / P 0 = 4.2 × 10 5 P a 1 S l s = 0.999
Note: D is the depth in meters; T(D) and P(D) are the temperature and pressure at depth D, respectively; R1–R4 represent the four injection layers from top to bottom in Figure 3.
Table 4. The relative permeability model and capillary pressure model for different parameters.
Classification S w r S g r Model Classification
RP (0.4–0.05)0.40.05Relative permeability model
RP (0.4–0.1)0.40.1Relative permeability model
RP (0.4–0.2)0.40.2Relative permeability model
RP (0.2–0.05)0.20.05Relative permeability model
RP (0.1–0.05)0.10.05Relative permeability model
CP (0.0)0.0--capillary pressure model
CP (0.1)0.1--capillary pressure model
CP (0.3)0.3--capillary pressure model
Table 5. The Analytic Hierarchy Process (AHP) judgment matrix.
Caprock PressureMaximum Ingress DistanceTotal Amount of CO2 IngressIngress RateWeights
Caprock pressure15550.537
Maximum ingress distance0.21450.279
Total amount of CO2 ingress0.20.25130.121
Ingress rate0.20.20.3310.063
Table 6. Comprehensive weight acquired via the AHP.
Caprock PressureMaximum Ingress DistanceTotal Amount of CO2 IngressIngress RateComprehensive WeightComprehensive Weight
Weights0.5370.2790.1210.063--
RP (0.4–0.05)0.1540.1110.1250.1460.1383
RP (0.4–0.1)0.2050.1670.1670.1670.1872
RP (0.4–0.2)0.2560.2780.2080.2080.2541
RP (0.2–0.05)0.0770.1110.1040.1040.0917
RP (0.1–0.05)0.1280.1110.1040.1040.1194
CP (0.0)0.1540.1110.1250.1460.1383
CP (0.1)0.1030.1110.1670.1670.1175
CP (0.3)0.0770.1110.1250.1040.0946
Disclaimer/Publisher’s Note: The statements, opinions and data contained in all publications are solely those of the individual author(s) and contributor(s) and not of MDPI and/or the editor(s). MDPI and/or the editor(s) disclaim responsibility for any injury to people or property resulting from any ideas, methods, instructions or products referred to in the content.