Article

Quantitative Analysis of the Driving Factors of Water Quality Variations in the Minjiang River in Southwestern China

1
Sichuan Academy of Environmental Policy and Planning, Chengdu 610041, China
2
State Key Laboratory of Geohazard Prevention and Geoenvironment Protection (Chengdu University of Technology), Chengdu 610059, China
3
College of Environment and Civil Engineering, Chengdu University of Technology, Chengdu 610059, China
4
State Key Laboratory of Environment Criteria and Risk Assessment, Chinese Research Academy of Environmental Sciences, Beijing 100012, China
*
Author to whom correspondence should be addressed.
Water 2023, 15(18), 3299; https://doi.org/10.3390/w15183299
Submission received: 9 August 2023 / Revised: 14 September 2023 / Accepted: 16 September 2023 / Published: 19 September 2023
(This article belongs to the Special Issue Assessment of Water Quality and Pollutant Behavior)

Abstract

:
The Minjiang River is an important first-level tributary of the Yangtze River. Understanding the driving factors of water quality variations in the Minjiang River is crucial for future policy planning of watershed ecology protection of the Yangtze River. The water quality of the Minjiang River is impacted by both meteorological factors and anthropogenic factors. By using wavelet analysis, machine learning, and Shapley analysis approaches, the impacts of meteorological factors and anthropogenic factors on the permanganate index (CODMn) and ammonia nitrogen (NH3-N) concentrations at the outlet of the Minjiang River Basin were quantified. The observed CODMn and NH3-N concentration data in the Minjiang River from 2016 to 2020 were decomposed into long-term trend signals and periodic signals. The long-term trends in water qualities showed that anthropogenic factors were the major driving factors, accounting for 98.38% of the impact on CODMn concentrations and 98.18% of the impact on NH3-N concentrations. The periodic fluctuations in water qualities in the Minjiang River Basin were mainly controlled by meteorological factors, with an impact of 68.89% on CODMn concentrations and 63.94% on NH3-N concentrations. Compared to anthropogenic factors, meteorological factors have a greater impact on water quality in the Minjiang River Basin during both the high-temperature and rainy seasons from July to September and during the winter from December to February. The separate quantification of impacts of driving factors on the varying water quality signals contributed to the originality in this work, providing more intuitive insights for the assessment of the influences of policies and the climate change on the water quality.

1. Introduction

The Minjiang River is a primary tributary of the upper Yangtze River located in Southwestern China. As one of the earliest developed regions in Southwestern China, the Minjiang River Basin (MRB) has supported agricultural and industrial activities for centuries. In recent years, the MRB environmental authorities have enacted and operationalized various policies and ecological initiatives aimed at protecting and remediating the water quality within the basin in response to the increasing pressure on aquatic systems due to anthropogenic disturbances [1,2]. The water quality of the Minjiang River was reported to have improved significantly from 2011 to 2020, characterized by a reduction in the permanganate index (CODMn), ammonia nitrogen (NH3-N), and total phosphorus (TP) contents by 7.59%, 20.54%, and 19.68%, respectively [3].
The water quality of rivers is impacted by both meteorological factors and anthropogenic factors [4,5]. Establishing relationships between driving factors and water quality indices is fundamental for distinguishing and quantifying the impacts from anthropogenic factors versus meteorological factors within basin-scale river systems [6,7]. Modeling tools like process-based mechanistic models and data-driven machine learning models are effective for quantitatively delineating complex driver–response dynamics [8,9].
Watershed scale process-based models including SWAT [10], HSPF [11], and MIKE SHE [12] can represent interconnected hydrological, hydraulic, and water quality processes across heterogeneous landscapes. These models have capacities for characterizing explicit spatiotemporal details, mechanistic interpretability, and scenario analysis under altered climate or management conditions [13]. For example, Liu et al. [14] constructed an integrated hydrological and water quality model of the MRB based on SWAT, simulated variations of flows, pollutant concentrations, and fluxes at the outlet of the MRB from 2015 to 2018. However, rigorous data requirements, huge computational costs, and the difficulty of calibration are significant challenges in practical applications of process-based models [15].
Machine learning approaches have shown abilities for emulating watershed hydrological and water quality variations by discovering empirical patterns in monitored data. Approaches like artificial neural networks [16], regression trees [17], and support vector machines [18] utilize flexible model architectures and optimization algorithms to fit highly nonlinear relationships between driving factors and response variables. Although black box modeling had limited physical interpretability for these processes [19], machine learning models have the advantage of automatic identification of key interactions and hydrological signatures in monitored data [20]. The total nitrogen and total phosphorus contents of the Minjiang River were inverted using remote sensing materials and machine learning approaches, which were highly performed [21].
In the MRB, the monitored water quality data in previous studies had relatively low time frequencies (weeks to months), and it was difficult to characterize the short-term periodic patterns. Likewise, the fluctuation magnitudes of water quality data in the MRB were generally large, giving rise to significant difficulties in identifying long-term changes in the water quality. We speculate that the long-term trends and short-term periodic patterns were controlled by different driving mechanisms.
To further identify the impacts of driving factors on the water quality, statistical approaches and scenario analyses have been commonly used [22,23]. In the MRB, the impacts of the spatial land use distribution of riparian zones were qualitatively assessed [21]. The impacts of pollution reduction measures on water quality improvement were evaluated through a scenario analysis, but the results were highly affected by the selected base year, and no conclusive quantified result was demonstrated [20]. Yuan et al. [3] developed a statistically based climate–water quality assessment framework to compare the impacts of anthropogenic factors and meteorological factors on the water quality of the Minjiang River. The framework implemented nonparametric analysis approaches to alleviating constraints due to the quality and quantity of input data. However, this statistically based framework was unable to quantify the temporal and spatial variations of the relative impacts of anthropogenic factors and meteorological factors on the water quality. Consequently, similar studies of the MRB have not successfully quantify the impacts of anthropogenic factors and meteorological factors on the long-term trend and periodic pattens of the water quality indices separately. This has significant potential for the assessment of environmental policies for the watershed management of the MRB.
Based on the high-frequency water quality data monitored from 2016–2020 at the outlet of the MRB, a wavelet analysis was used in this study to decompose time series raw data into signals characterizing long-term trends and periodic fluctuations. In addition to the collected pollutants data and meteorological data within the basin, machine learning and the Shapley analysis were further utilized to quantify the relative impacts of driving factors on both the long-term trends and periodic patterns of water quality indices (Figure 1). The influences of both climate change and human activities across varying timescales in the MRB were considered. The findings of this study may provide quantitative insights for accurately assessing regional policies for watershed ecological restoration, contributing to aquatic environment management in the MRB and the broader Yangtze River Basin. Additionally, the methodological framework developed in the present study may provide suggestions about water quality risk management for other watersheds.

2. Materials and Methods

2.1. Study Area

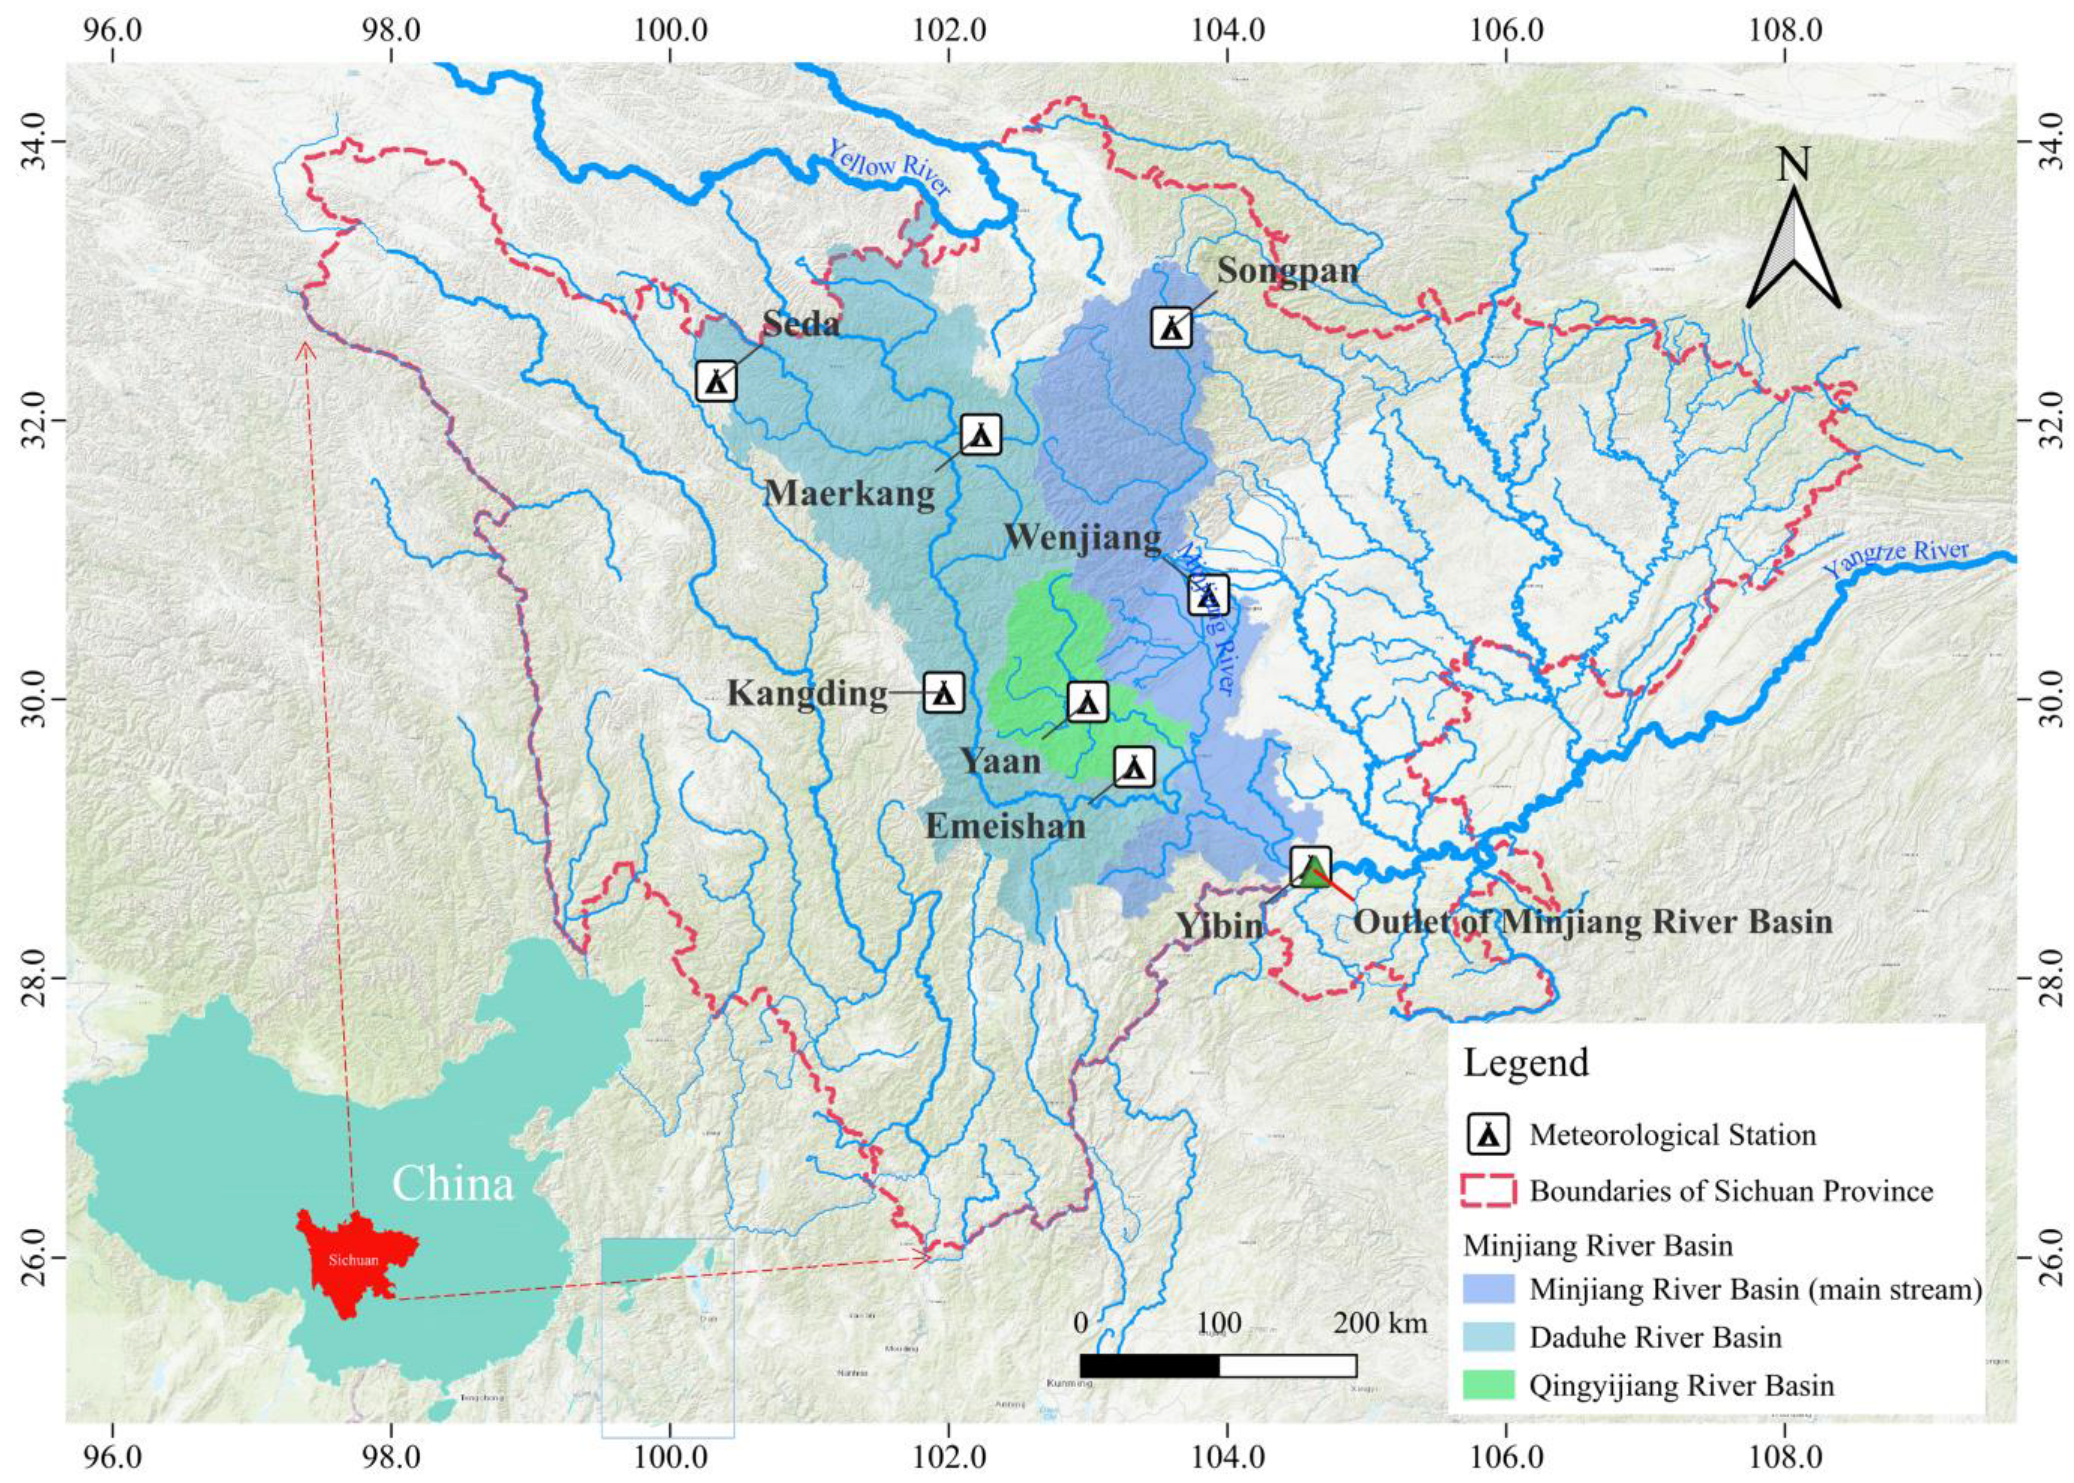
The study area included the mainstream of the Minjiang River, the Daduhe River Basin, and the Qingyijiang River Basin (Figure 2). The MRB has an annual mean temperature of 9.1 °C and an annual mean precipitation of 1083 mm. The main stream of the Minjiang River originates from the southern foothills of the Min Mountains on the Sichuan–Gansu border, flowing southward with a length of 7.530 × 10² km and a basin area of 4.532 × 10³ km2. The Daduhe River is a first-order tributary joining the mainstream of the Minjiang River at Leshan City, Sichuan. It flows southward through Qinghai Province and Sichuan Province with a total length of 1.074 × 10³ km and a basin area of 7.715 × 10⁴ km2. The part of Daduhe River located in Sichuan Province with a length of 8.760 × 10² km (81.60% of the total length of the river) and a basin area of 6.792 × 10⁴ km2 (88.00% of the whole basin) was considered in this study. The Qingyijiang River is a first-order tributary converging with the Daduhe River at Leshan City, with a length of 2.870 × 10² km and a basin area of 1.285 × 10⁴ km2. The mean annual discharge at the outlet of the MRB is 2.850 × 10³ m3/s.

2.2. Data Sources

2.2.1. Pollutant Loads

The pollutant load data used in this study were derived from the Sichuan statistical yearbooks over the years (http://tjj.sc.gov.cn/scstjj, accessed on 6 June 2023). The types of pollutant loads were divided into three categories: industrial sources, urban living sources, and agricultural sources. The basic unit of the pollutant loads at the spatial scale was the prefecture-level city. The industrial and urban living pollutant loads were characterized by six variables from the statistical yearbooks of Sichuan Province, which included the industrial wastewater discharged, COD emissions from industrial wastewater, ammonia nitrogen emissions from industrial wastewater, urban living wastewater discharged, COD emissions in urban sewage, and ammonia nitrogen emissions from domestic sewage. The data points for these variables across 10 years were fitted to their dates. Then data during the research period (2016–2020) were extracted and downscaled to the daily frequency and used as input data. On the other hand, the migration and transformation of pollutants from agricultural sources are more complex [24]; therefore, there are few effective methods to accurately quantify the pollutant loads from agricultural sources on a large basin scale [25]. Therefore, the fertilizer use data in the Sichuan statistical yearbooks were used to reflect the agricultural pollutant loads. The raw data of the pollutant loads were collected based on the administrative division, requiring further spatial split or integration based on the distribution of GDP, population, and area of each prefecture-level city within the MRB. The data on pollutant loads used in this study were from 2016 to 2020.

2.2.2. Water Quality Data

The water quality data in this study were monitored at the Liangjianggou Station (longitude 104.62° E, latitude 28.78° N), which is located at the outlet of the MRB. In this study, the concentrations of CODMn and NH3-N were selected as the objects characterizing the water quality of the Minjiang River. The monitored indices and corresponding monitoring methods used in this study are shown in Table 1. The water quality data were monitored from 1 January 2016 to 31 December 2020, and the temporal resolution was 1 d. The mean annual concentrations of CODMn and NH3-N were 2.04 mg/L and 0.20 mg/L, respectively.

2.2.3. Meteorological Data

The meteorological data in this study were collected from the National Centers for Environmental Information of the United States (https://www.ncei.noaa.gov, accessed on 15 May 2023). There are eight meteorological stations involved in the MRB (Figure 2 and Table 2), scattered in the upper, middle, and lower reaches of the study area. The meteorological indices used in this study included the air temperature and precipitation depth. After raw data preprocessing, the time frequency was integrated from 3 h to 1 d. The period of the meteorological data is from 1 January 2016 to 31 December 2020.

2.3. Wavelet Analysis

The long-term trend and periodic pattern are both important for time series data analysis [26,27]. The long-term trend describes the overall changes in an indicator over the past several years. The periodic pattern describes the cyclic variation in data on smaller time scales, such as the monthly, seasonal, quarterly, or annual patterns. The monitored water quality data include both long-term trends and periodic signals; therefore, it is necessary to decompose the water quality data through a time–frequency domain analysis to further quantify the impact of different driving factors on the long-term trend and periodic signals of water qualities.
Wavelet analysis is a classic time–frequency domain method that can decompose non-stationary signals into wavelet functions at different scales and positions [28]. The basic principle is to decompose a signal into a linear combination of a set of wavelet basis functions, where each wavelet basis function is constructed from a mother wavelet function with different scaling and shifting parameters [29]. The scaling and shifting parameters of these wavelet basis functions control the time and frequency resolution of the analysis results. The wavelet analysis process consists of two steps: decomposition and reconstruction. At first, the original signal is decomposed into wavelet coefficients at multiple scales and frequencies. Then, in the reconstruction step, the wavelet coefficients are combined to simulate the original signal [30].
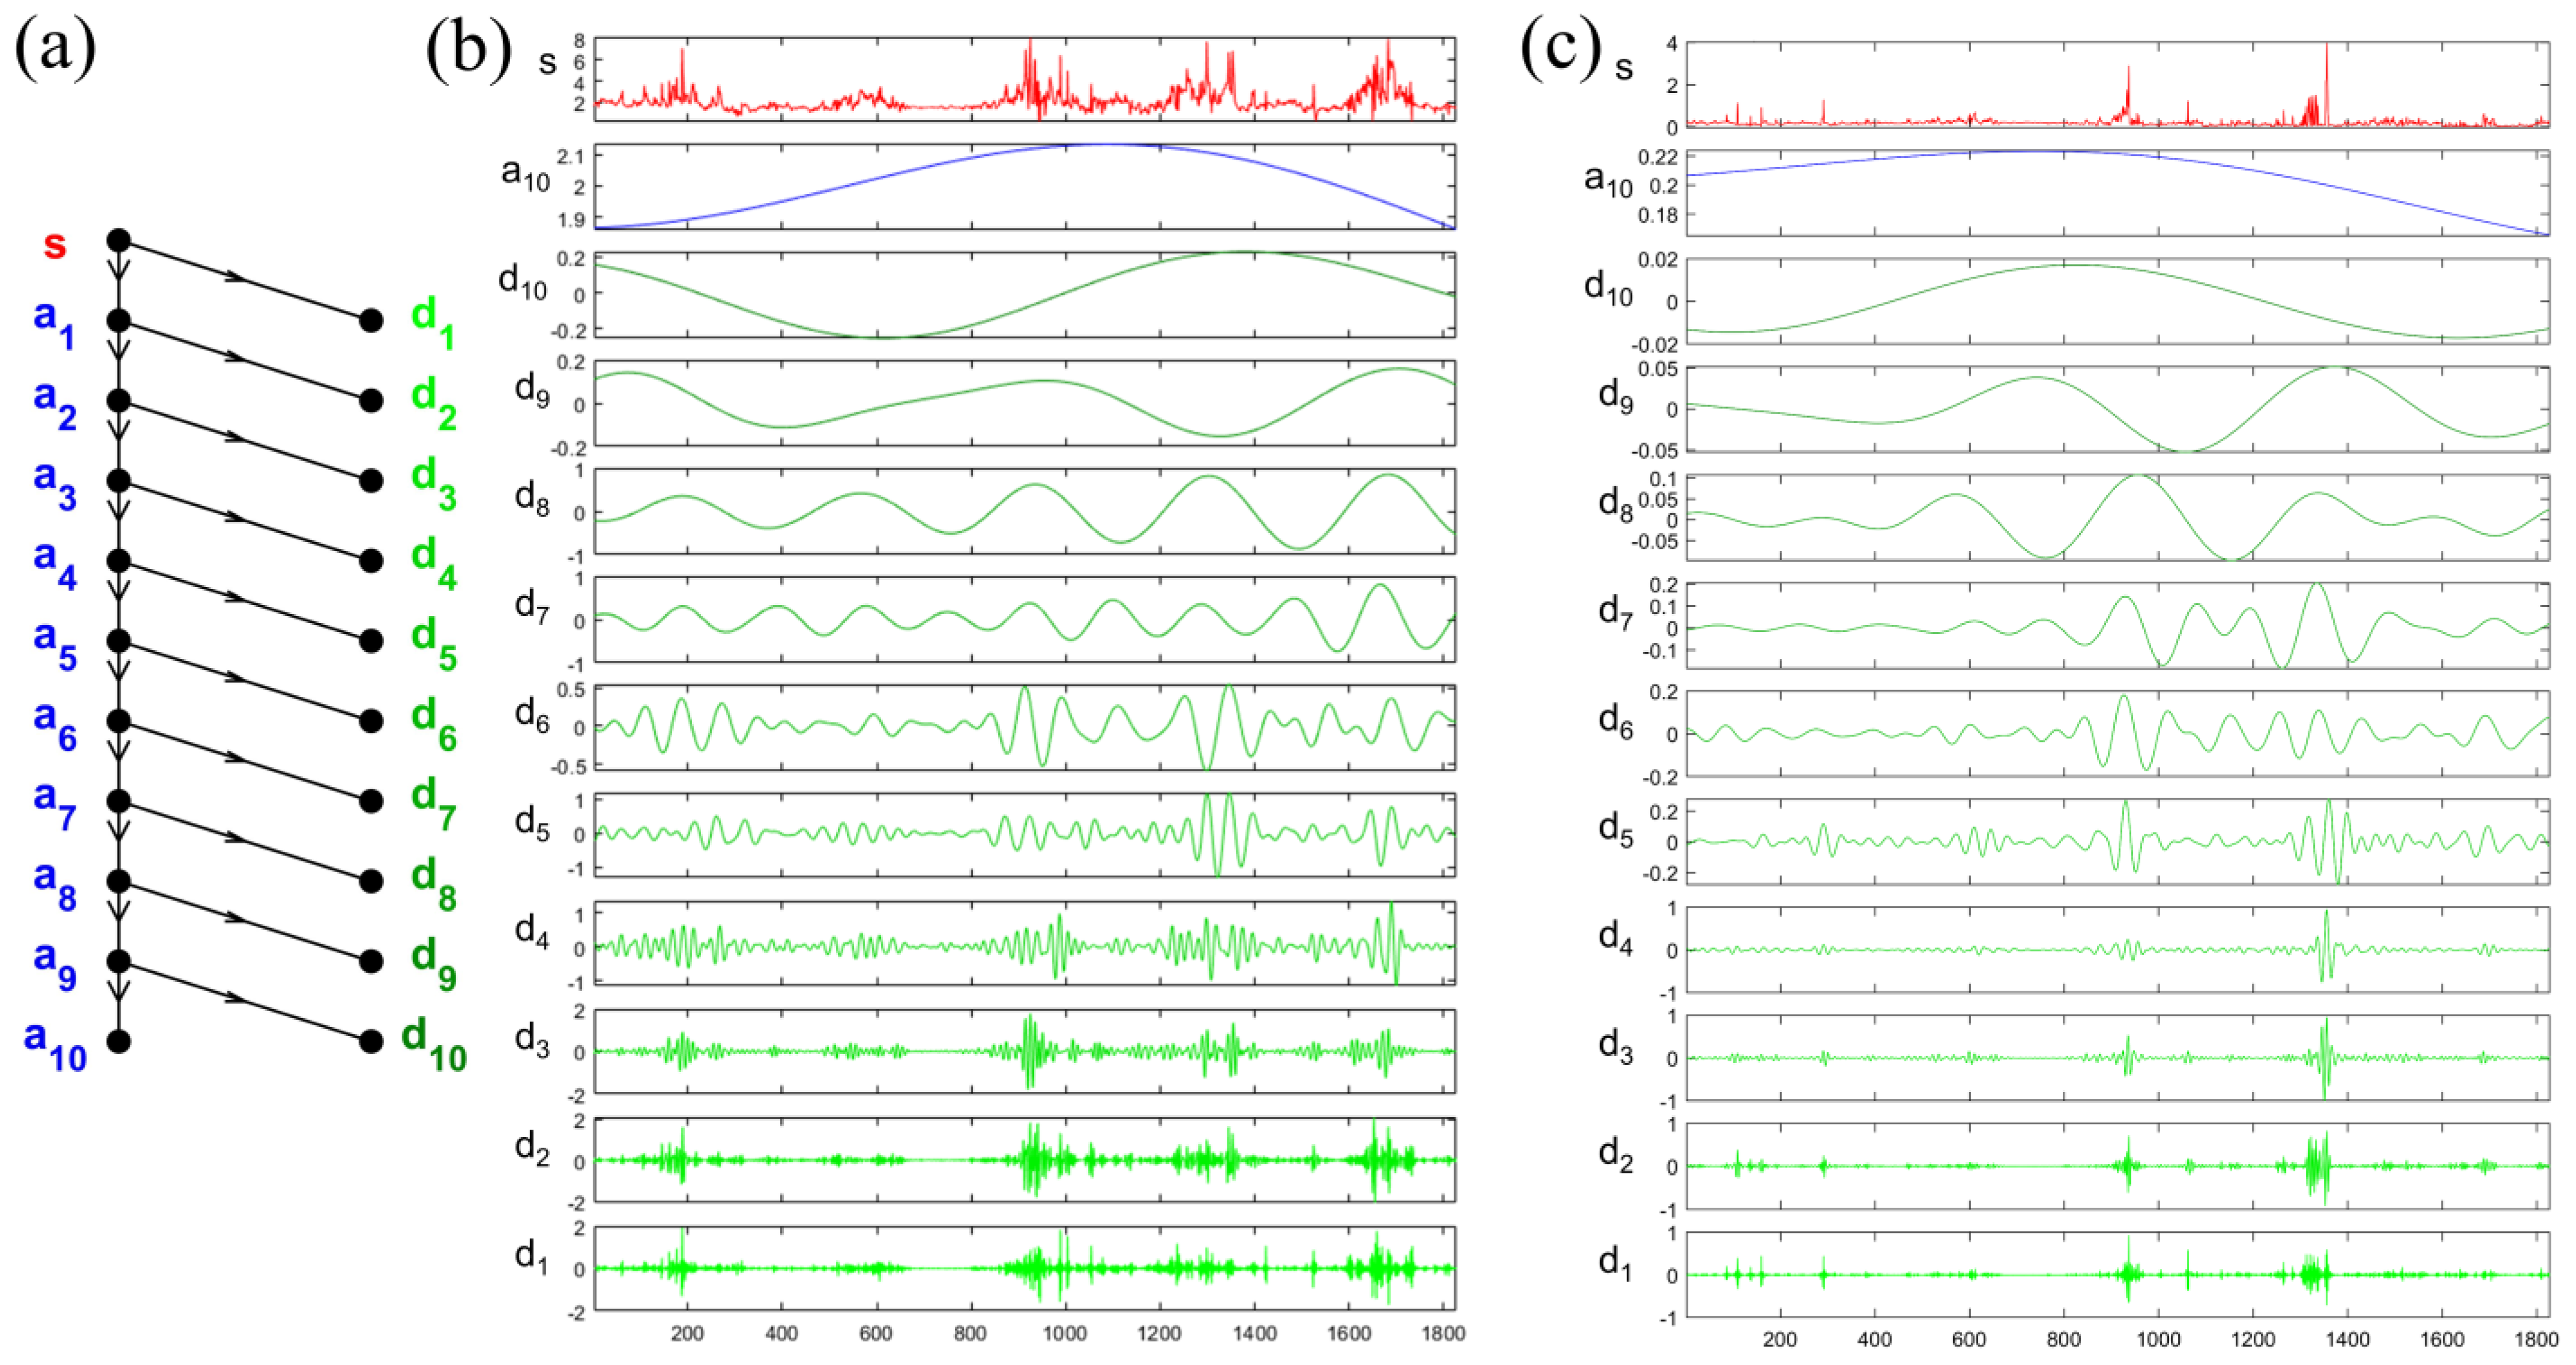
In this study, the single-level discrete wavelet transform (DWT) and discrete Meyer (dmey) mother wavelet function were used in the wavelet analysis. The wavelet decomposition level was set to 10 (Figure 3).

2.4. Machine Learning Models

Machine learning algorithms have advantages in nonlinear modeling, including missing data processing, large-scale data processing, and fast prediction optimization capabilities [31]. The accuracy of the relationships established between the driving factors and water quality indices of the MRB using different machine learning algorithms were compared. Then, the model with the highest accuracy was used for further quantitative analysis of the impacts of the driving factors. Support vector machines (SVM), ensembles of trees, neural networks, and regression trees were included in this study. The computing platform is MATLAB R2020b.
SVMs are boundary-based classification methods to divide data into different categories by searching for the optimal hyperplane in the feature space [18]. Ensembles of trees is an ensemble learning method that can be used for data regression and classification [17]. It consists of a weighted combination of multiple trees, including various algorithms such as the random forest and gradient boosting. Neural networks are based on neurons and their connections, simulating complex nonlinear functions by optimizing model hyperparameters [16]. The regression tree algorithm is based on a tree structure that is used to perform regressions which use a series of decision rules to divide the data into different subsets, thereby achieving data classification and prediction [32].

2.5. Shapley Analysis

The Shapley analysis is based on cooperative game theory to explain the results of machine learning models [33]. For each feature, the Shapley analysis first constructs a “feature set” that includes all the possible combinations with other features, then it calculates the contribution of each feature set to the model prediction. Using the model including the feature set to calculate the prediction value and subtracting the prediction value calculated by the model without the feature set, the obtained results were identified as the contribution of the feature set to the model prediction value, which quantifies the impacts of each feature on the result [34].

2.6. Statistical Index

The determination coefficient (R2) output by algorithm modules in MATLAB was used to evaluate the modeling performance, which was compared the simulated and observed results.

3. Results and Discussion

3.1. Decomposition Results of Water Quality Indices through the Wavelet Analysis

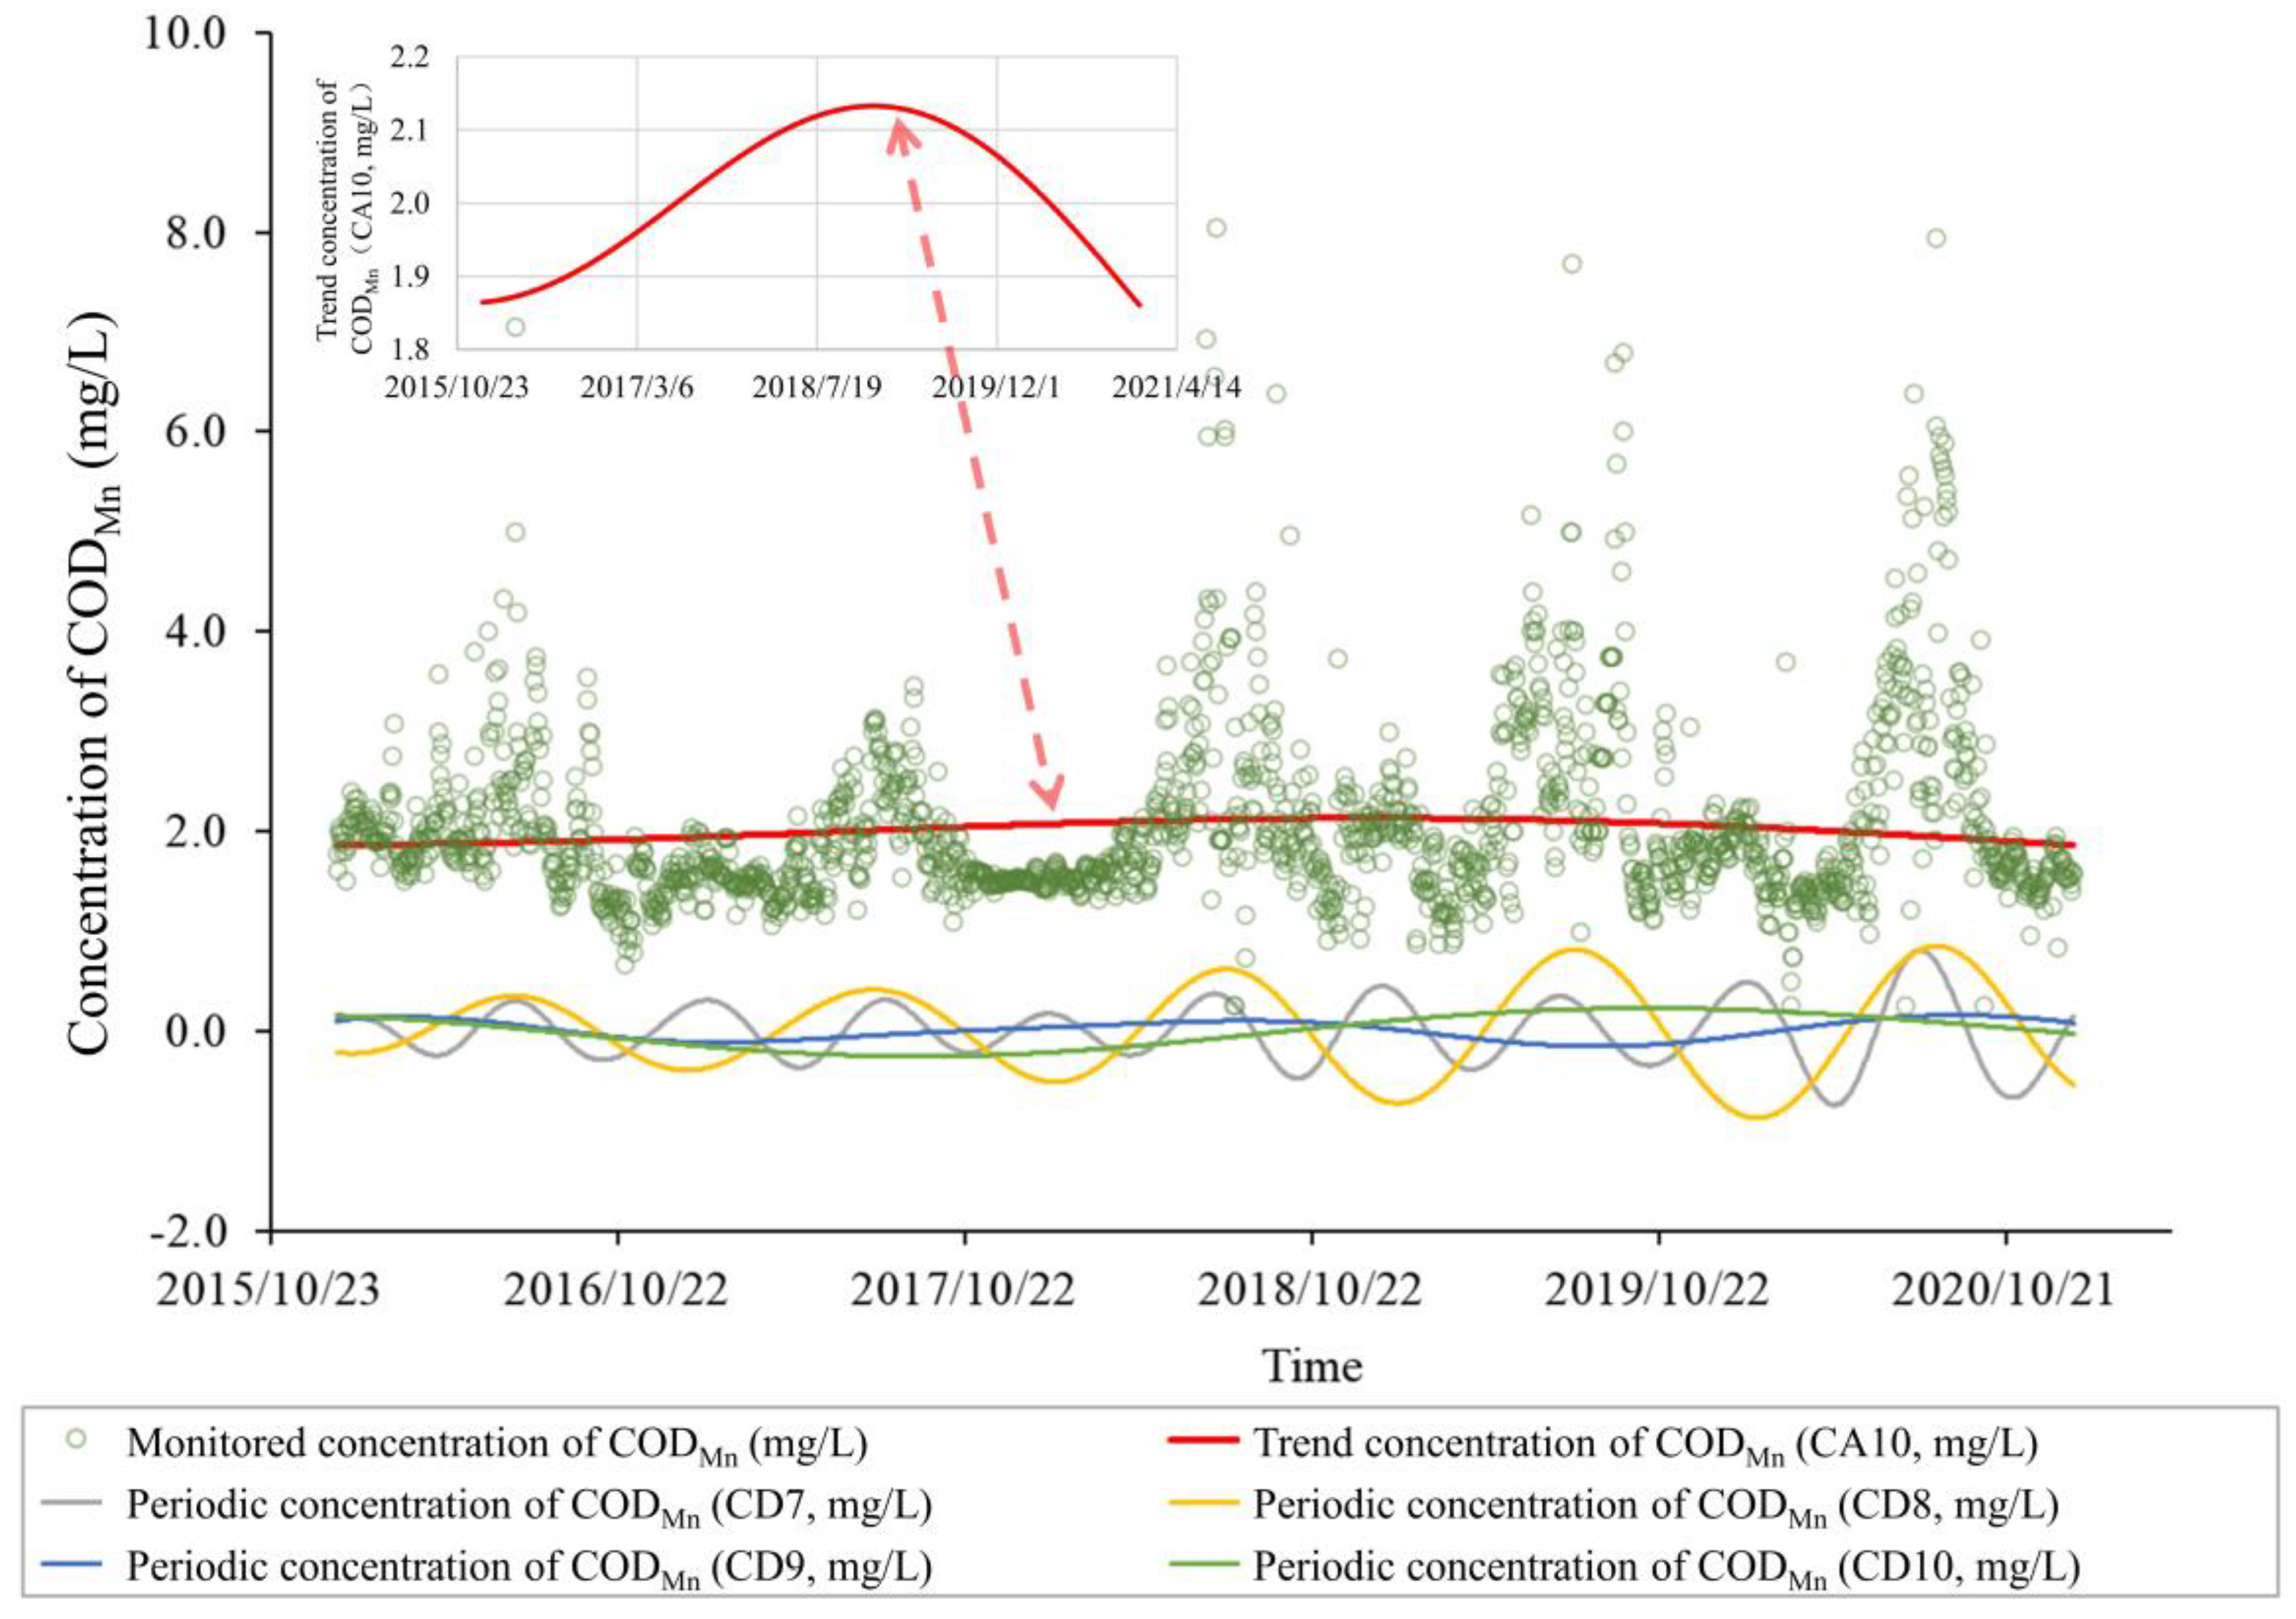
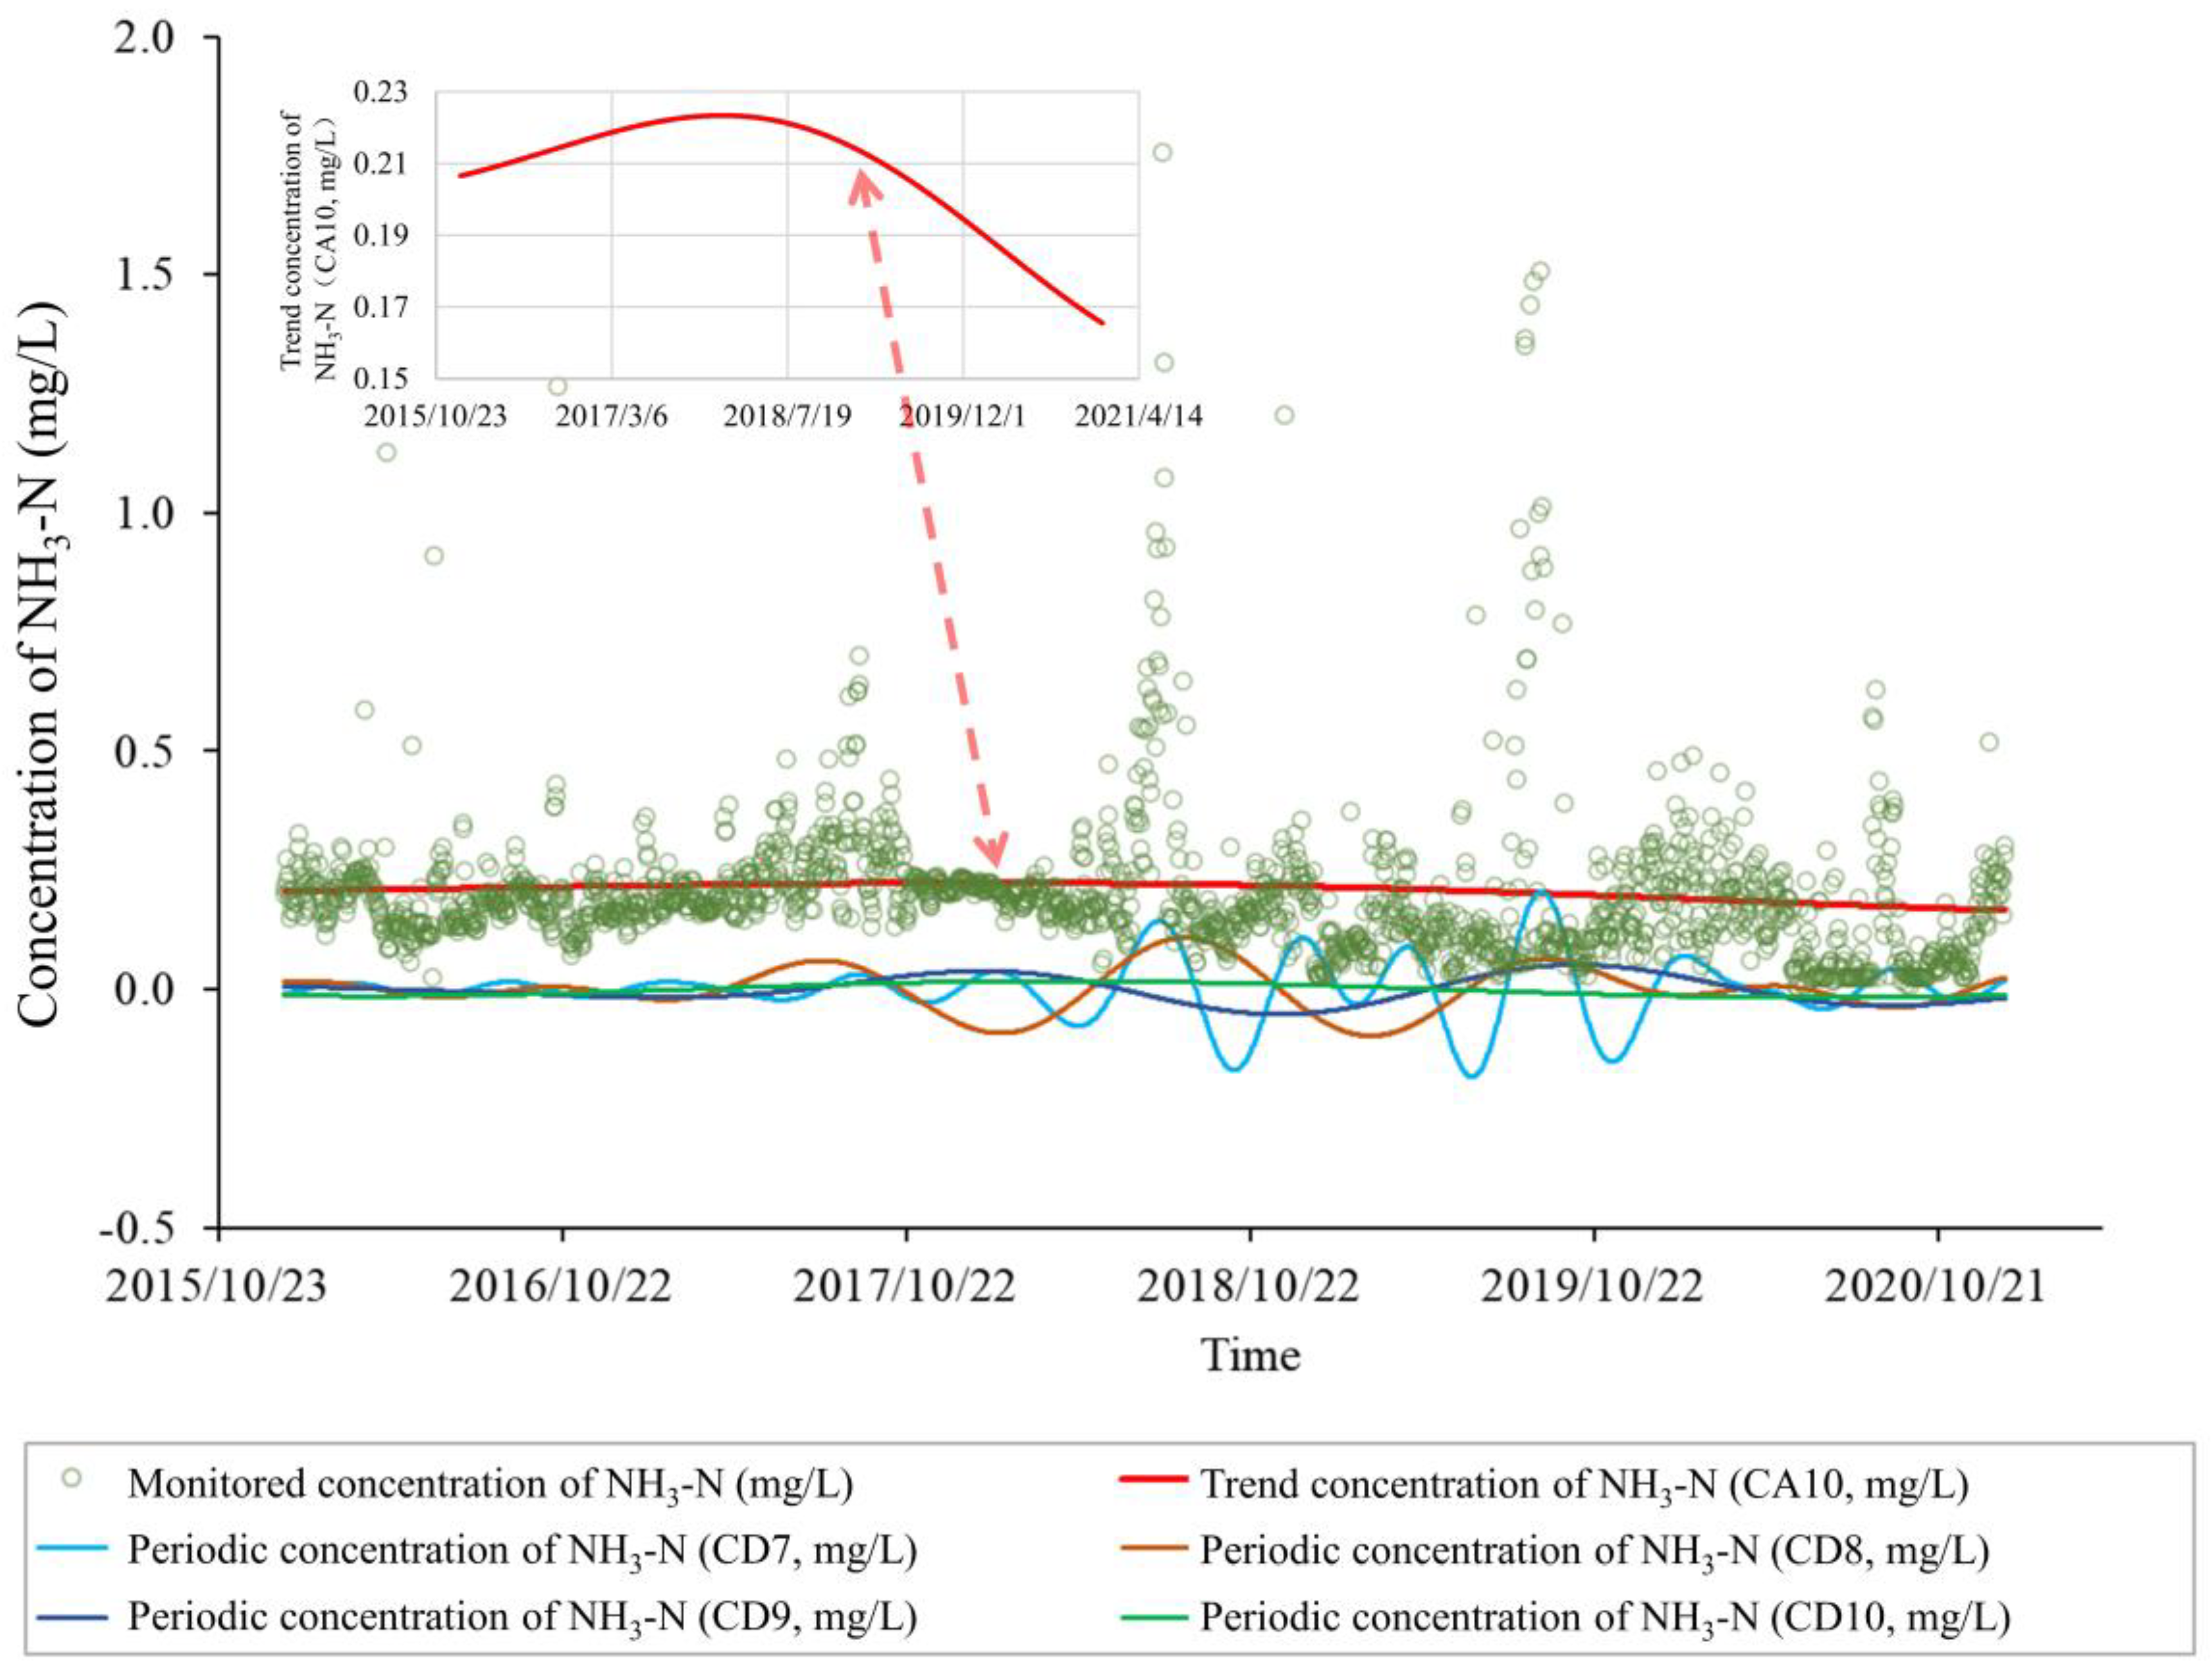
The observed daily CODMn and NH3-N concentrations from 2016 to 2020 at Liangjianggou Station, the outlet of the MRB, were decomposed based on the wavelet analysis. The raw data were decomposed into a long-term trend signal CA10 on the interannual scale and periodic signals CD1~10 of different frequencies fluctuating around 0 (Figure 4 and Figure 5). The CA10 signal characterized the long-term patterns of these two water quality indices, reflecting long-lasting impacts from anthropogenic activities, policy measures, and global climate change in the MRB. The signals CD1~10 were composed of a series of signals with different frequencies, characterizing periodic fluctuations of water quality indices and reflecting seasonal and stochastic impacts within the year in the MRB.
The long-term trends in both the CODMn and NH3-N concentrations from 2016 to 2020 showed an increasing and then a decreasing trend. The CA10 curve of the CODMn concentration increased and decreased by nearly the same magnitude (Figure 4), while the long-term NH3-N signal decreased significantly after a slight increase, close to an overall downward trend (Figure 5). In terms of the periodic signals, the amplitudes of the CODMn concentration variation gradually increased over time, while the amplitudes of the NH3-N concentration variation were relatively gentler except for the period from 2018 to 2019.
The results of the present study were different from Yuan et al. [3], in that the CODMn and NH3-N concentrations had significant decreasing trends between 2011 and 2020. This is likely because that the decreasing trends in the CODMn and NH3-N concentrations were averaged and calculated based on the observed raw data of 26 water quality monitoring stations within the MRB, where the sites in the upper reaches of the basin presented more significant trends [3]. The results of the present study only originated from data at the watershed outlet, where the water quality signals were from various sources and the trends were eliminated. Likewise, the decreasing trends in the raw CODMn and NH3-N data in Yuan et al. [3] might have been disturbed by large magnitudes of periodic fluctuations, which were detected as having considerable interannual variations in our results. This is why we the raw data should be decomposed into signals with different time frequencies.

3.2. The Quantified Impacts of Driving Factors on Water Quality Indices of the MRB

The variations in the CODMn and NH3-N concentrations monitored at the outlet of the MRB were affected by a combination of meteorological and anthropogenic factors.
In terms of the anthropogenic factors, the relevant driving factors for the water qualities of the MRB demonstrated distinct patterns as a result of economic developments and environmental policy implementation. The pollutant loads from industrial sources decreased from 2016 to 2020. With rapid urbanization and improvements in rural sewage treatment systems, the wastewater and chemical oxygen demand (COD) discharges from urban living sources showed increasing trends, while the NH3-N discharge from urban living sources was continuously reduced (Table 3). Agricultural non-point pollution is one of the most difficult factors in accurately quantifying the impacts of anthropogenic factors. This study applied fertilizer use to characterize the agricultural pollutant loads from non-point sources. The amounts of total fertilizer use, nitrogen fertilizer use, and phosphorus fertilizer use in the MRB decreased year by year, while the compound fertilizer use increased (Table 3).
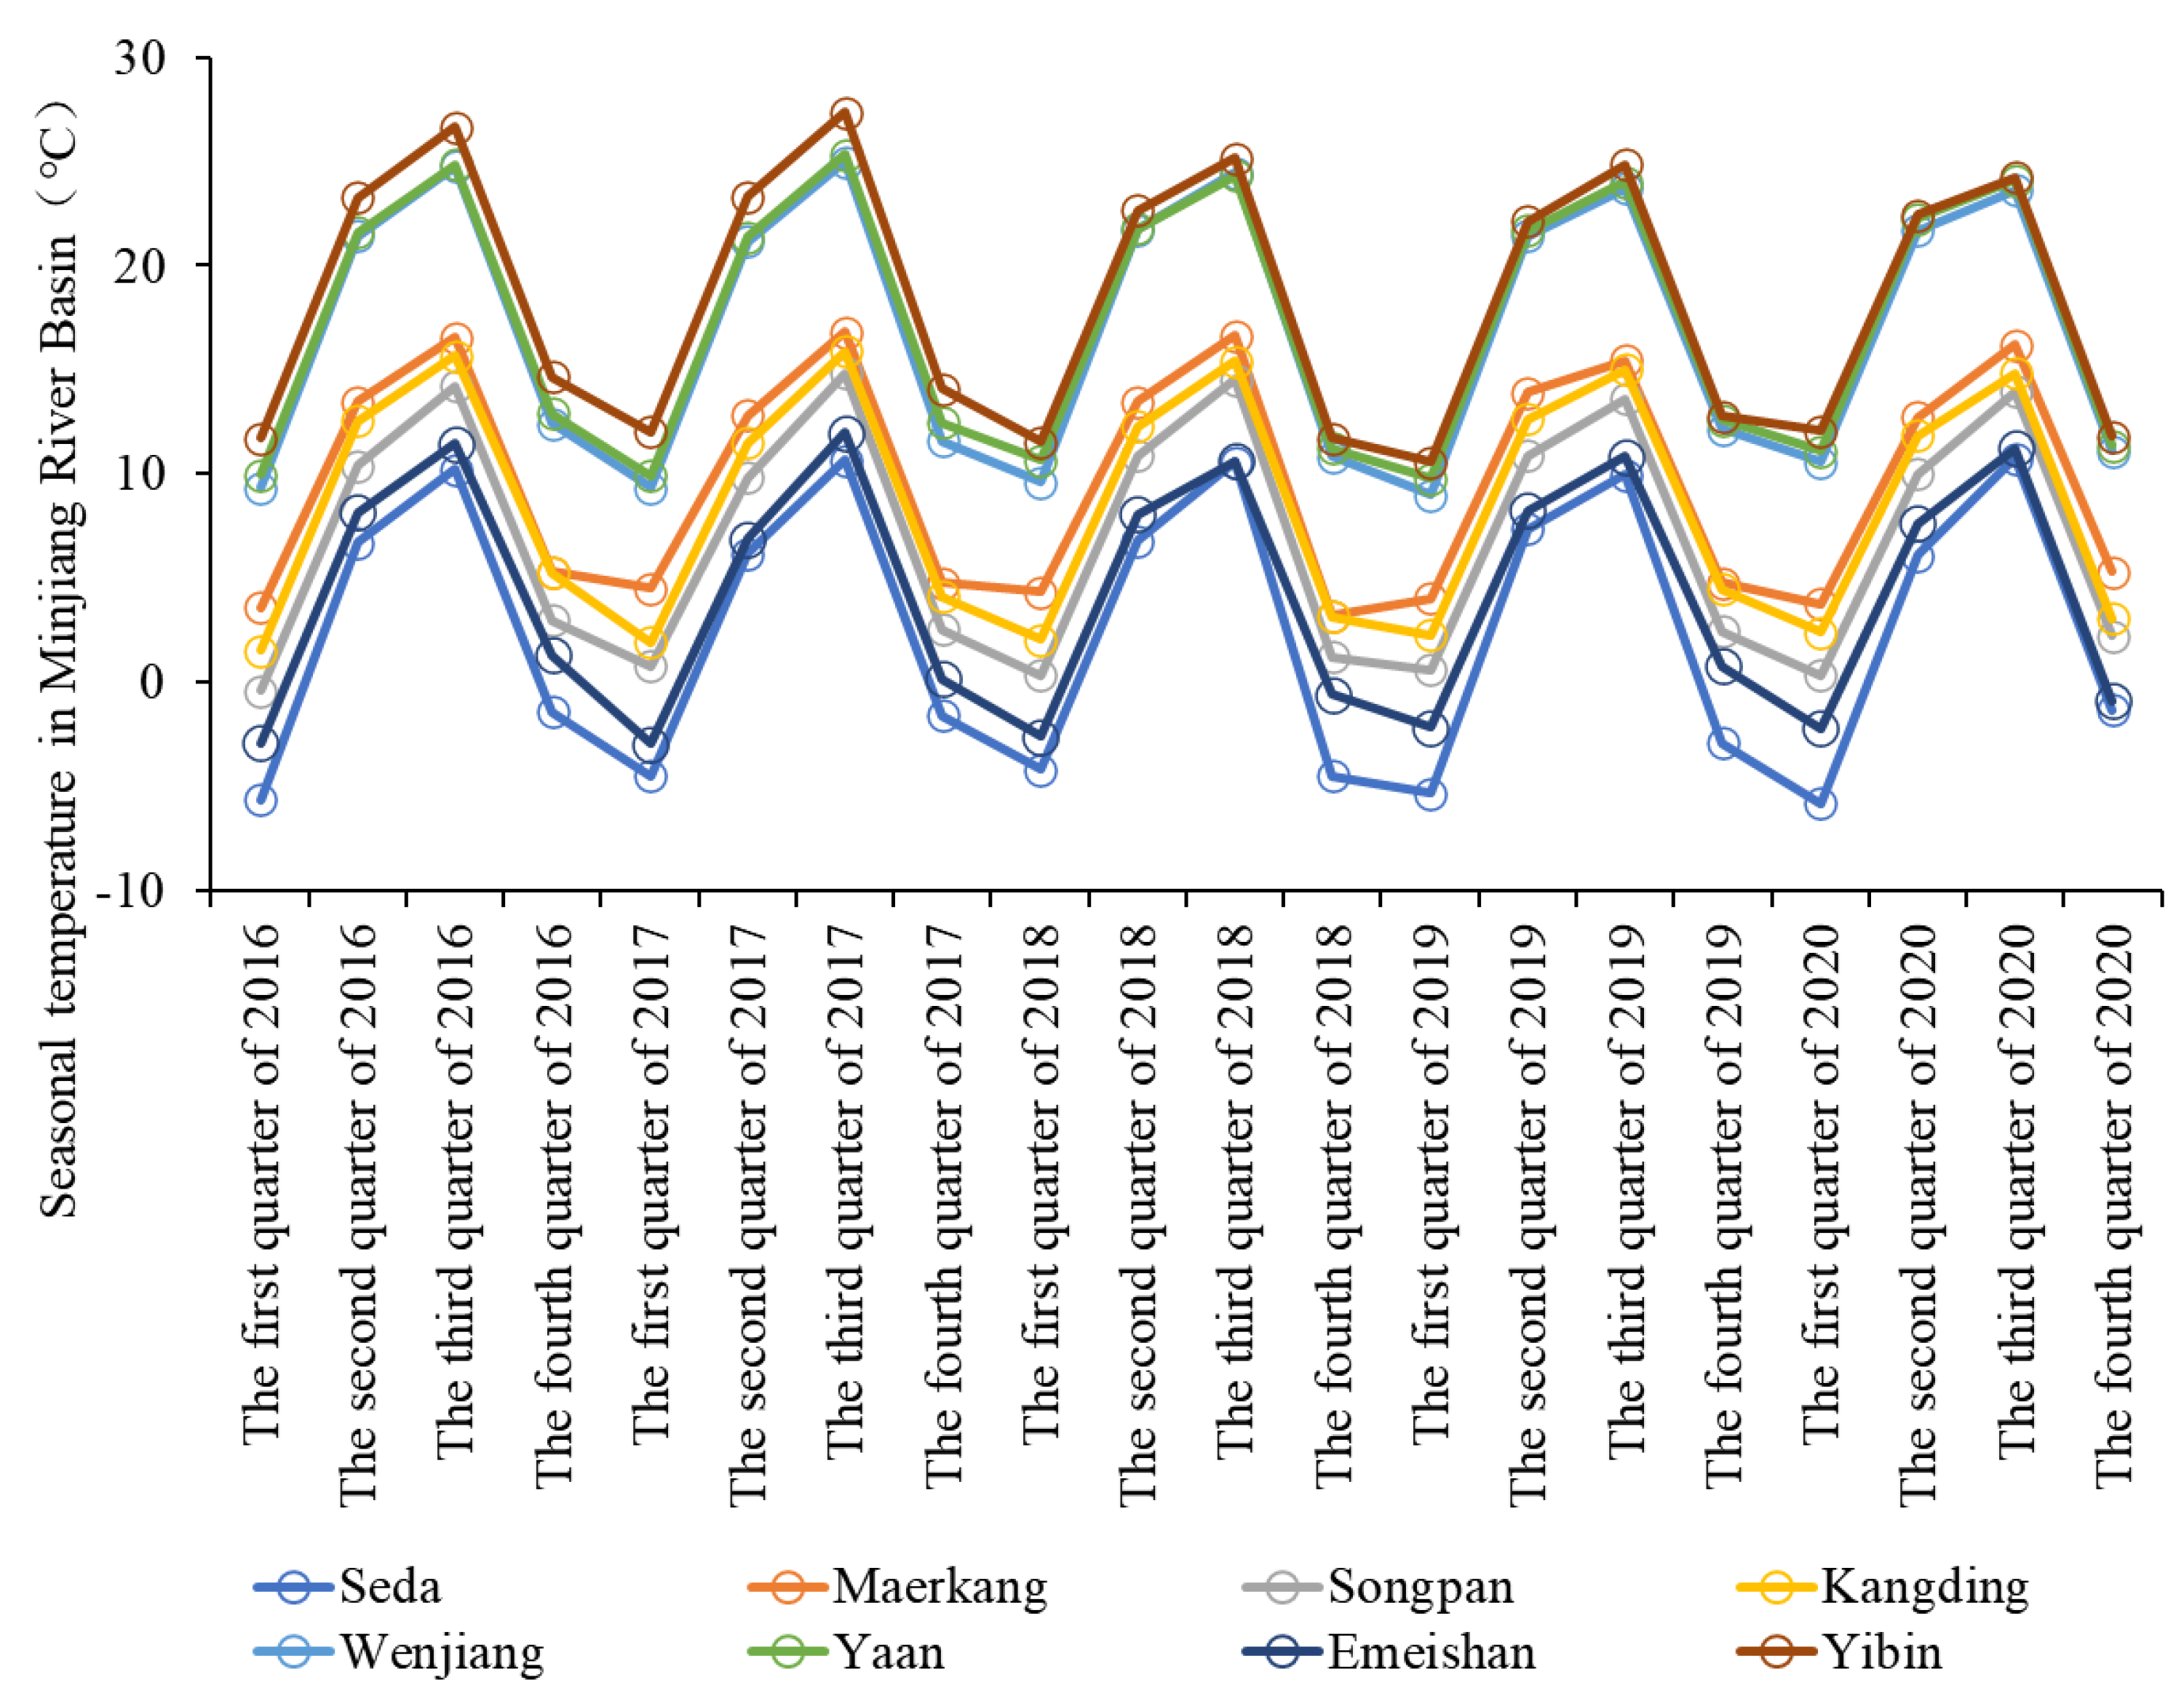
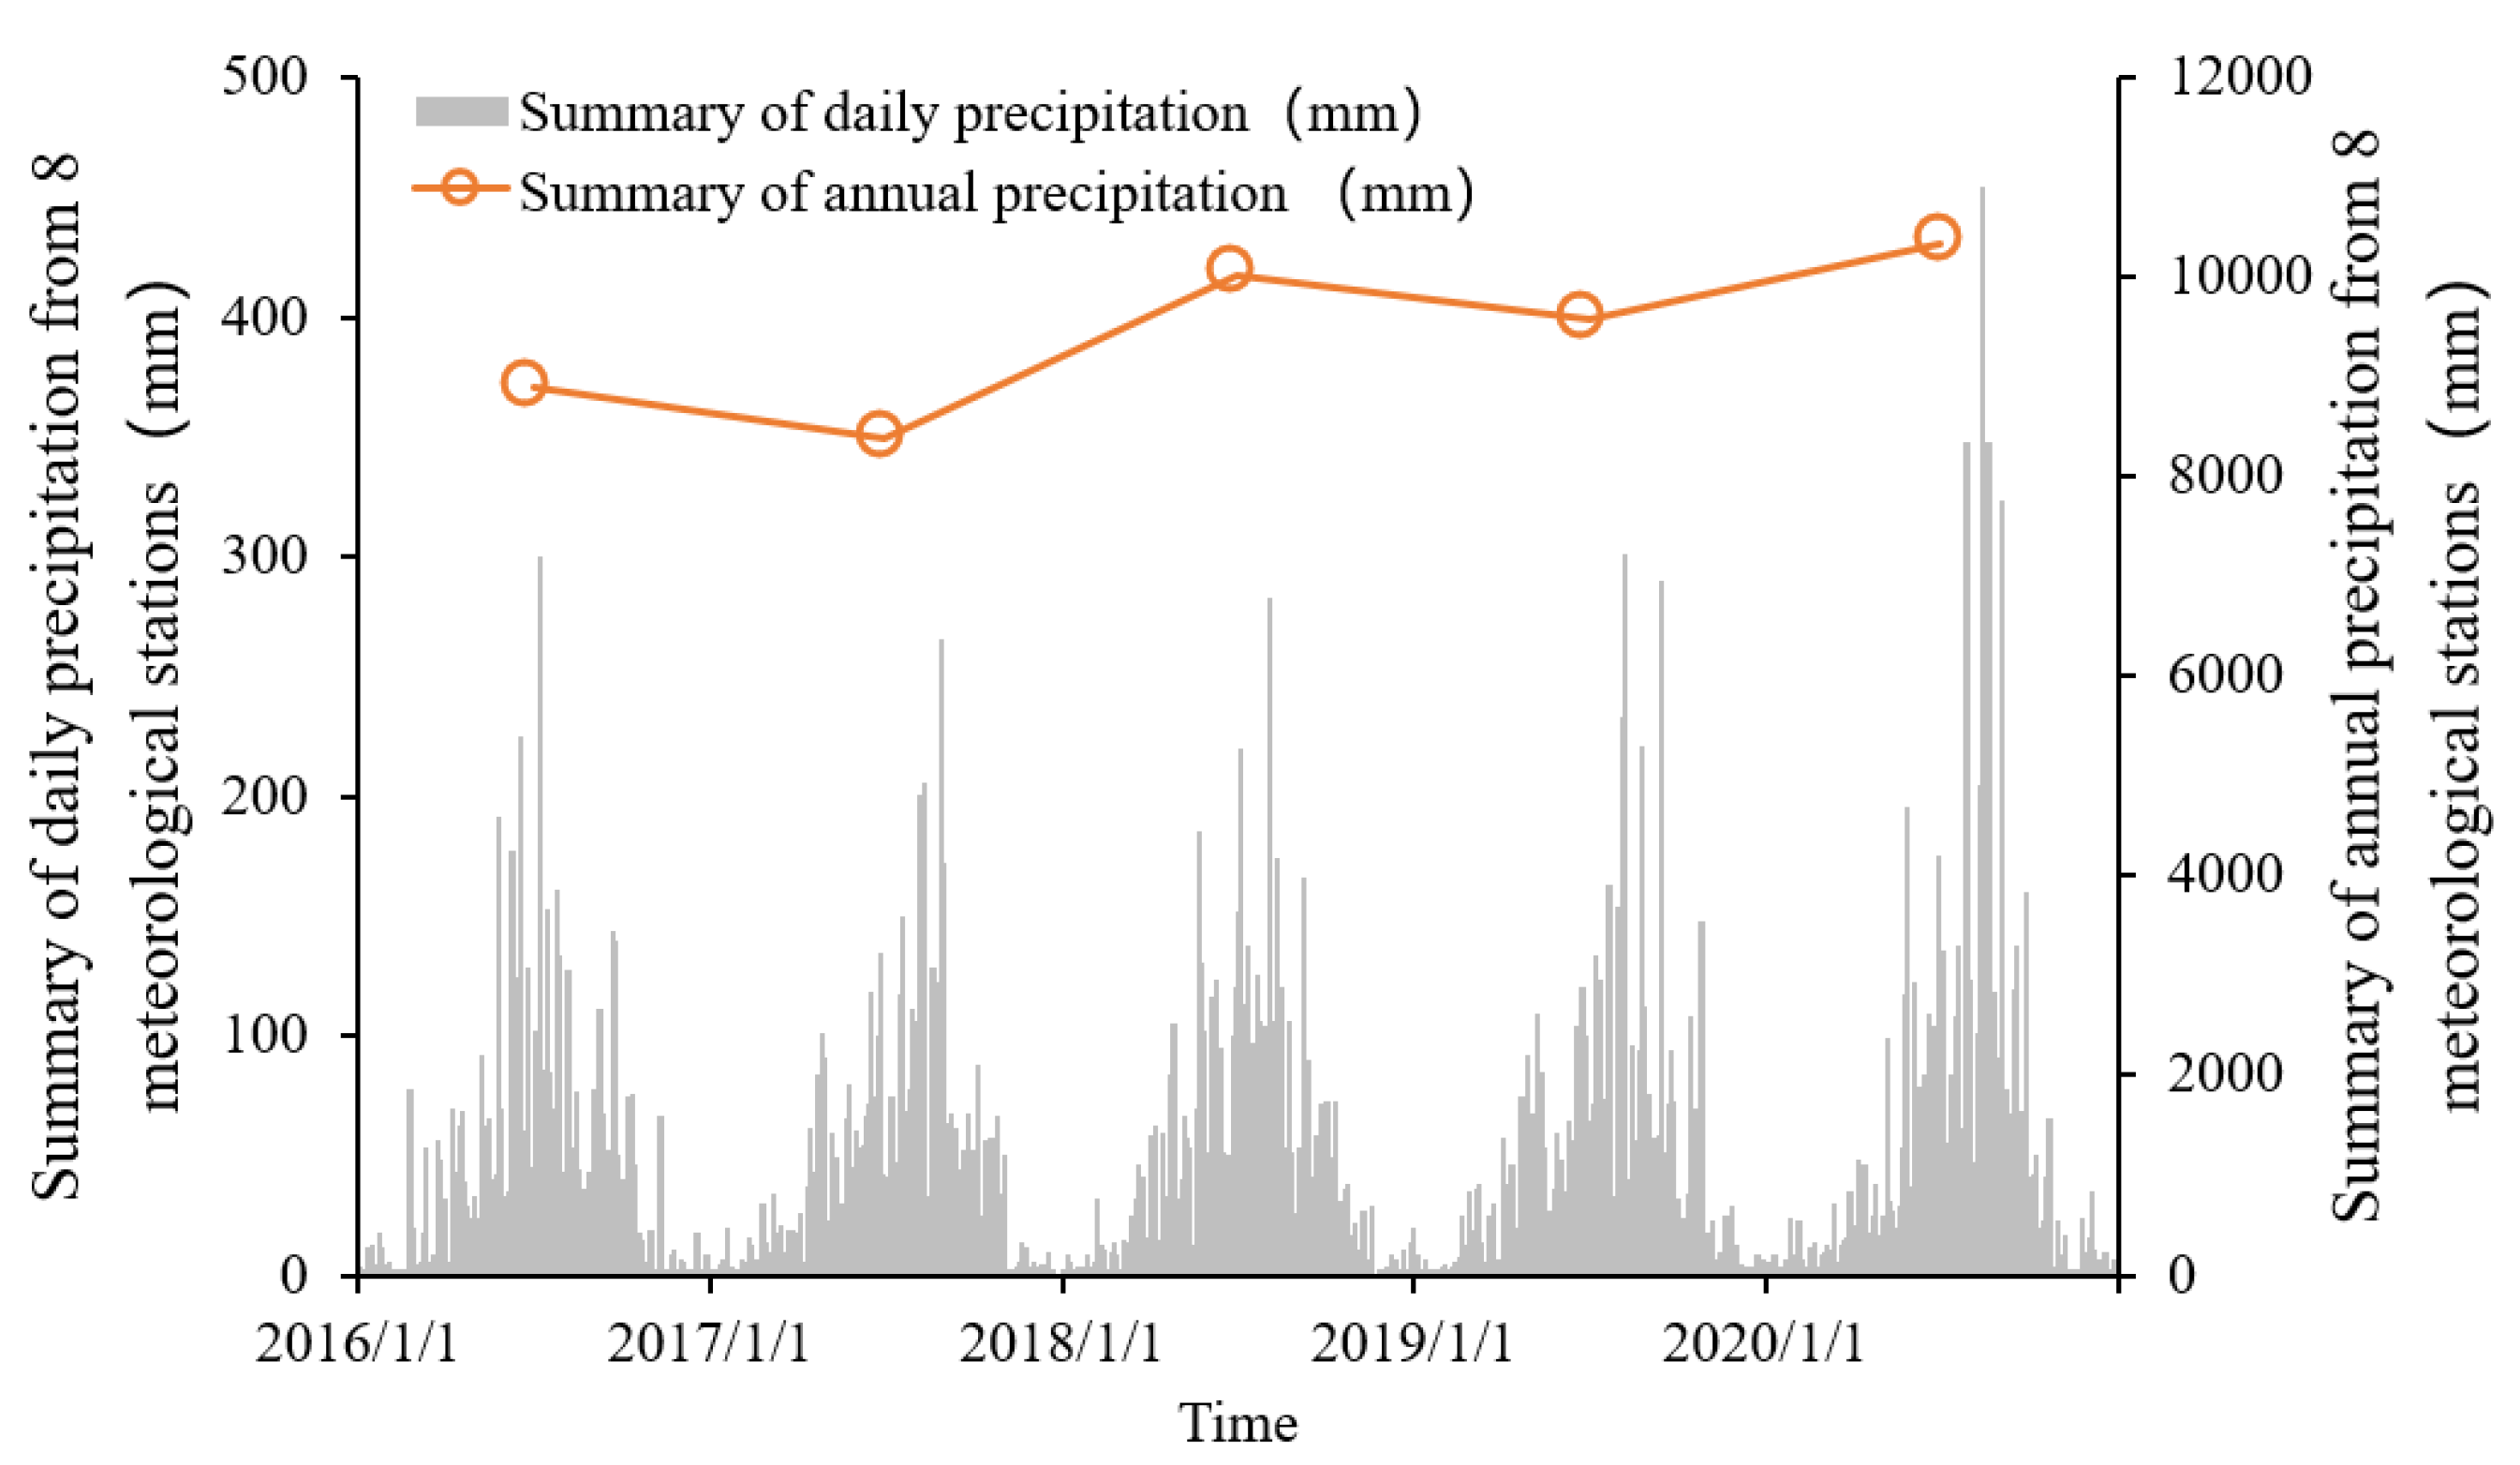
In terms of the meteorological factors, the air temperature and precipitation depth from eight meteorological stations were used to analyze the impacts on the water quality indices of the MRB (Figure 1). The air temperature demonstrated significant seasonal patterns (Figure 6), which can impact the migration and transformation of aquatic organisms and pollutants by changing the dissolved oxygen concentrations, pH values, and biological activities in water as well as the water density and flow state [35]. Precipitation is an important driving force for water and material cycles. The amount, form, timing, and spatial distribution of precipitation events can affect material cycles in land–shore–river-coupled systems through runoff generation and confluence processes in basin-scale aquatic environments. Precipitation events will thus affect the pollutant concentrations and distributions in river systems [36]. According to the data from eight meteorological stations in the MRB, the annual precipitation in the MRB showed an upward trend from 2016 to 2020 (Figure 7). More precipitation can significantly increase the river runoff and improve the hydrodynamic conditions of rivers, which are conducive to enhancing the self-purification capacity of rivers. However, rainfall–runoff processes can increase the amount of pollutants entering rivers, which produces certain risks to the aquatic environment [37].
Based on the time series data of variables characterizing the anthropogenic factors and meteorology monitored in different locations of the MRB, machine learning algorithms and a Shapley analysis were combined to quantify the impact of the driving factors on the water quality indices.
The performances of four mapping models between the driving factors and water quality indices, constructed using four machine learning algorithms, were evaluated and compared, including the ensemble tree, regression tree, neural network, and support vector machine. The input data for the machine learning training included the pollutant loads derived from industrial, agricultural, and urban living sources as well as air temperature and precipitation data. The output data of the model included the mean daily CODMn and NH3-N concentrations at the Liangjianggou Station from 2016 to 2020 as well as the decomposed trend and periodic CODMn and NH3-N concentration signals.
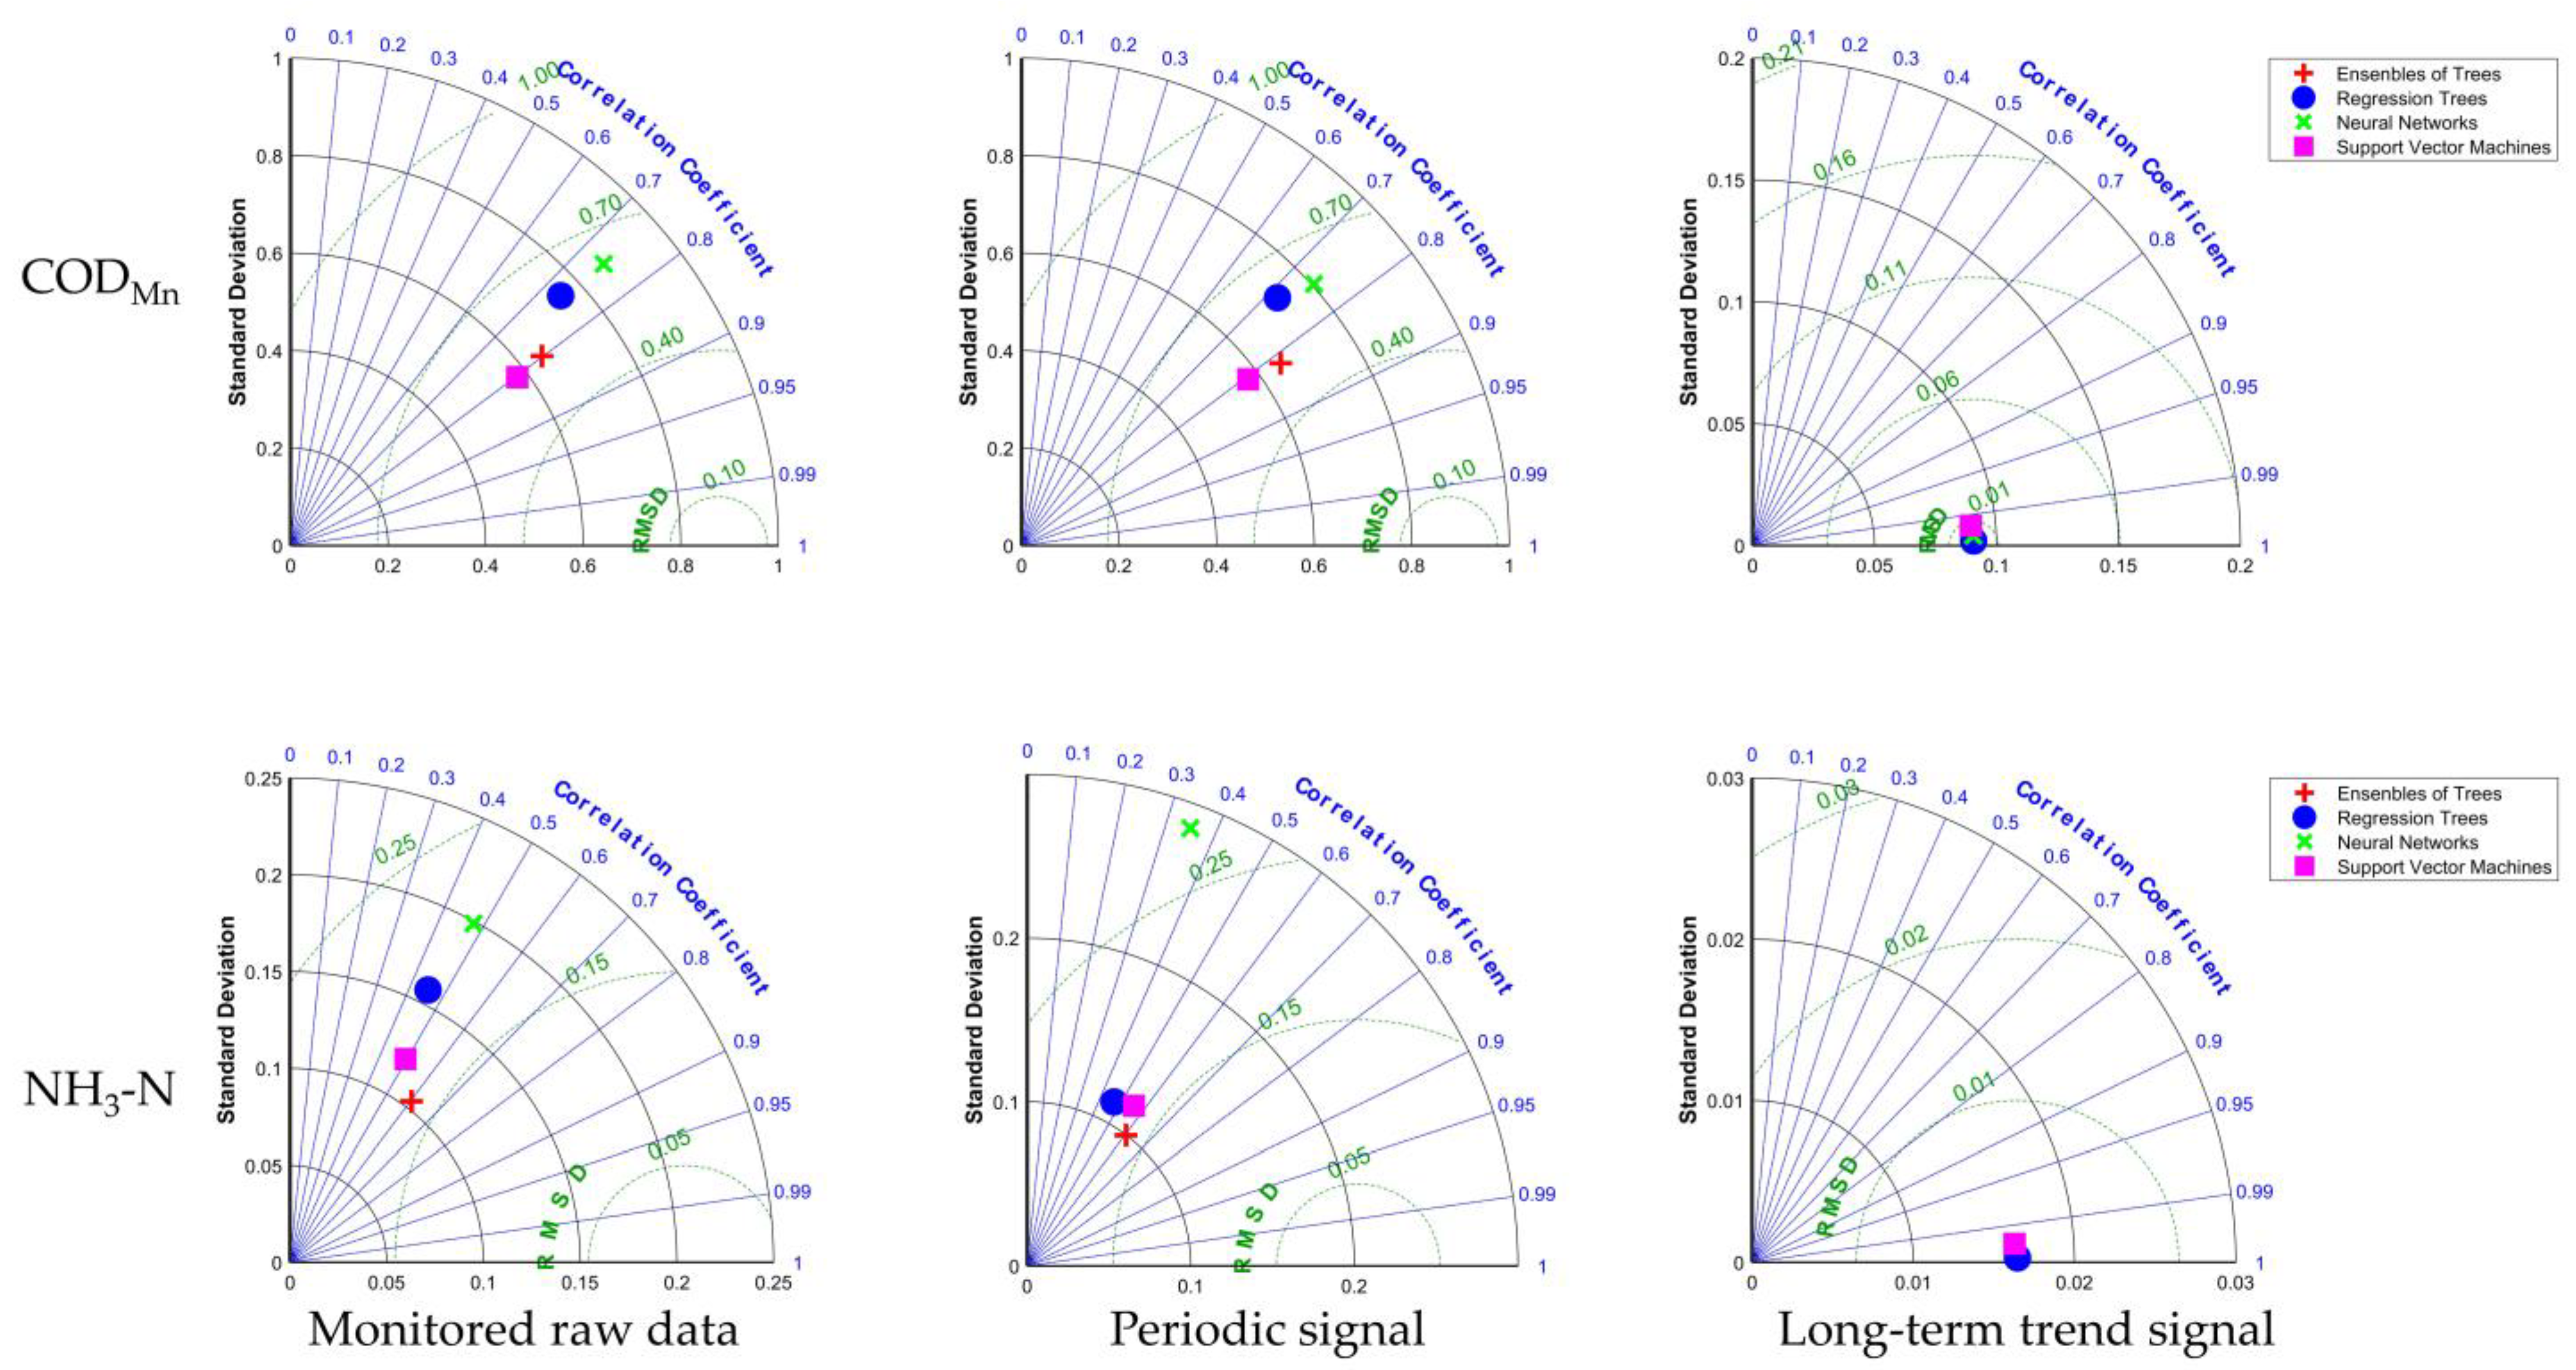
The training results of the CODMn models were better than the NH3-N models. According to the determination coefficients (R2) of the training processes, the training results of the trend signals were the best (R2 ≥ 0.99), followed by the periodic signals and monitored raw data (Table 4). This is mainly because the variation in the trend signals is smoother and simpler, which make it easier for the models to learn. The periodic data also had better periodicity than the raw data, making the learning process easier. Likewise, the periodic data are much more complex than the trend signals, so the training results for the long-term trend signals were the best. Among the four training methods, the ensemble trees had the best performance, which was based on the R2 values and the Taylor diagram of the modeling results (Table 4 and Figure 8). The comparisons between the simulated results and observed data are presented in Figure S1, Figure S2, Figure S3, Figure S4. Hence, the results obtained using the ensemble trees were used for the subsequent Shapley analysis.
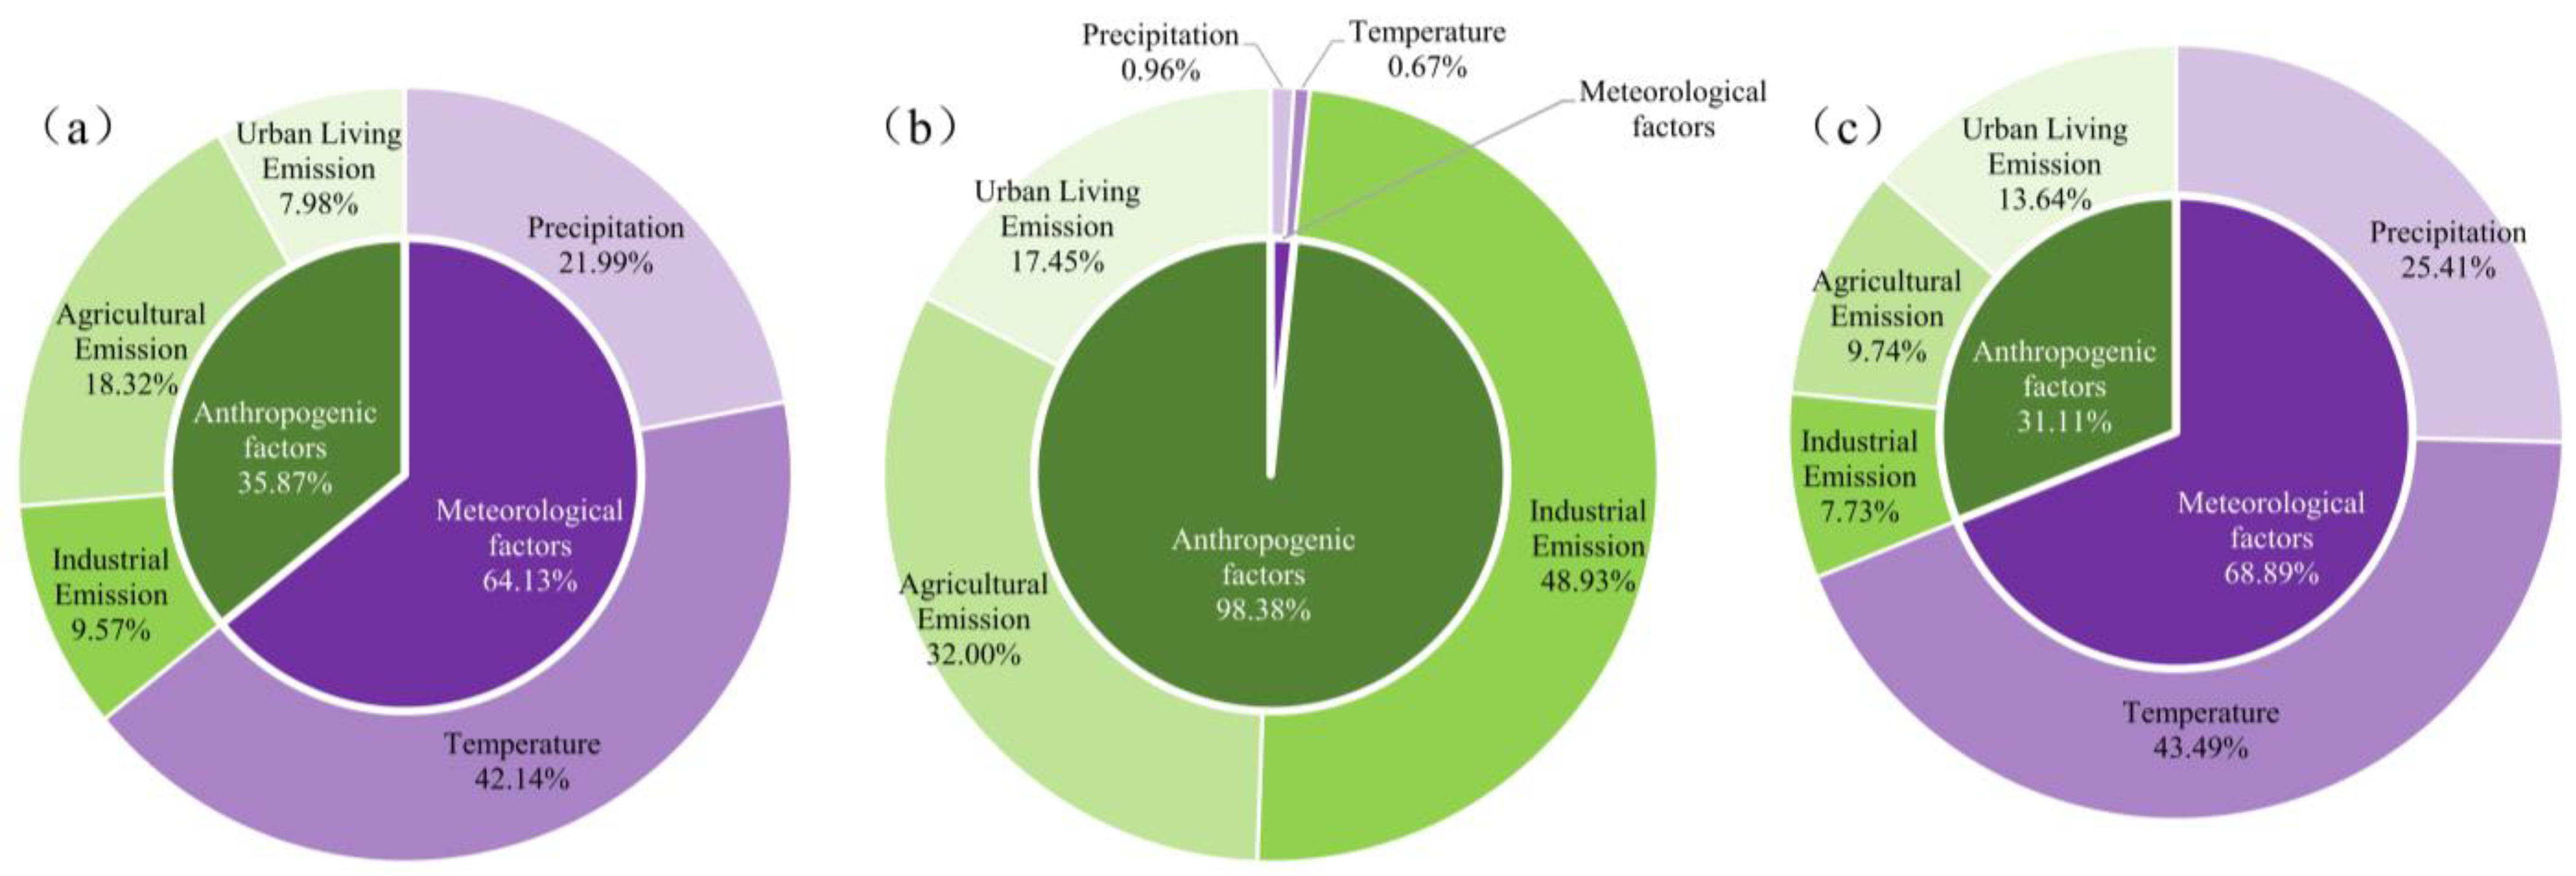
Using the Shapley analysis and the trained machine learning models, the impacts of the driving factors on the monitored raw data, long-term trend signals, and periodic signals of the CODMn and NH3-N concentrations were quantified (Figure 9 and Figure 10). For the monitored raw CODMn concentrations, the impacts of meteorological factors occupied a proportion of 64.13%, while the results for the anthropogenic factors occupied 35.87%. Of the meteorological factors, the impacts caused by air temperature and precipitation were 42.14% and 21.99%, respectively. On the other hand, the anthropogenic factors had much less impact than the meteorological factors, with agricultural, urban living, and industrial factors accounting for 18.32%, 7.98%, and 9.57%, respectively. As for the long-term trend signal of the CODMn concentration, the anthropogenic factors accounted for 98.38%, among which the industrial sources (48.93%) and agricultural sources (32.00%) were more important than the urban living sources (17.45%). For the periodic signals of the CODMn concentrations, the result was similar to the raw monitored data, with a slight increase in the impacts of meteorological factors (68.89%).
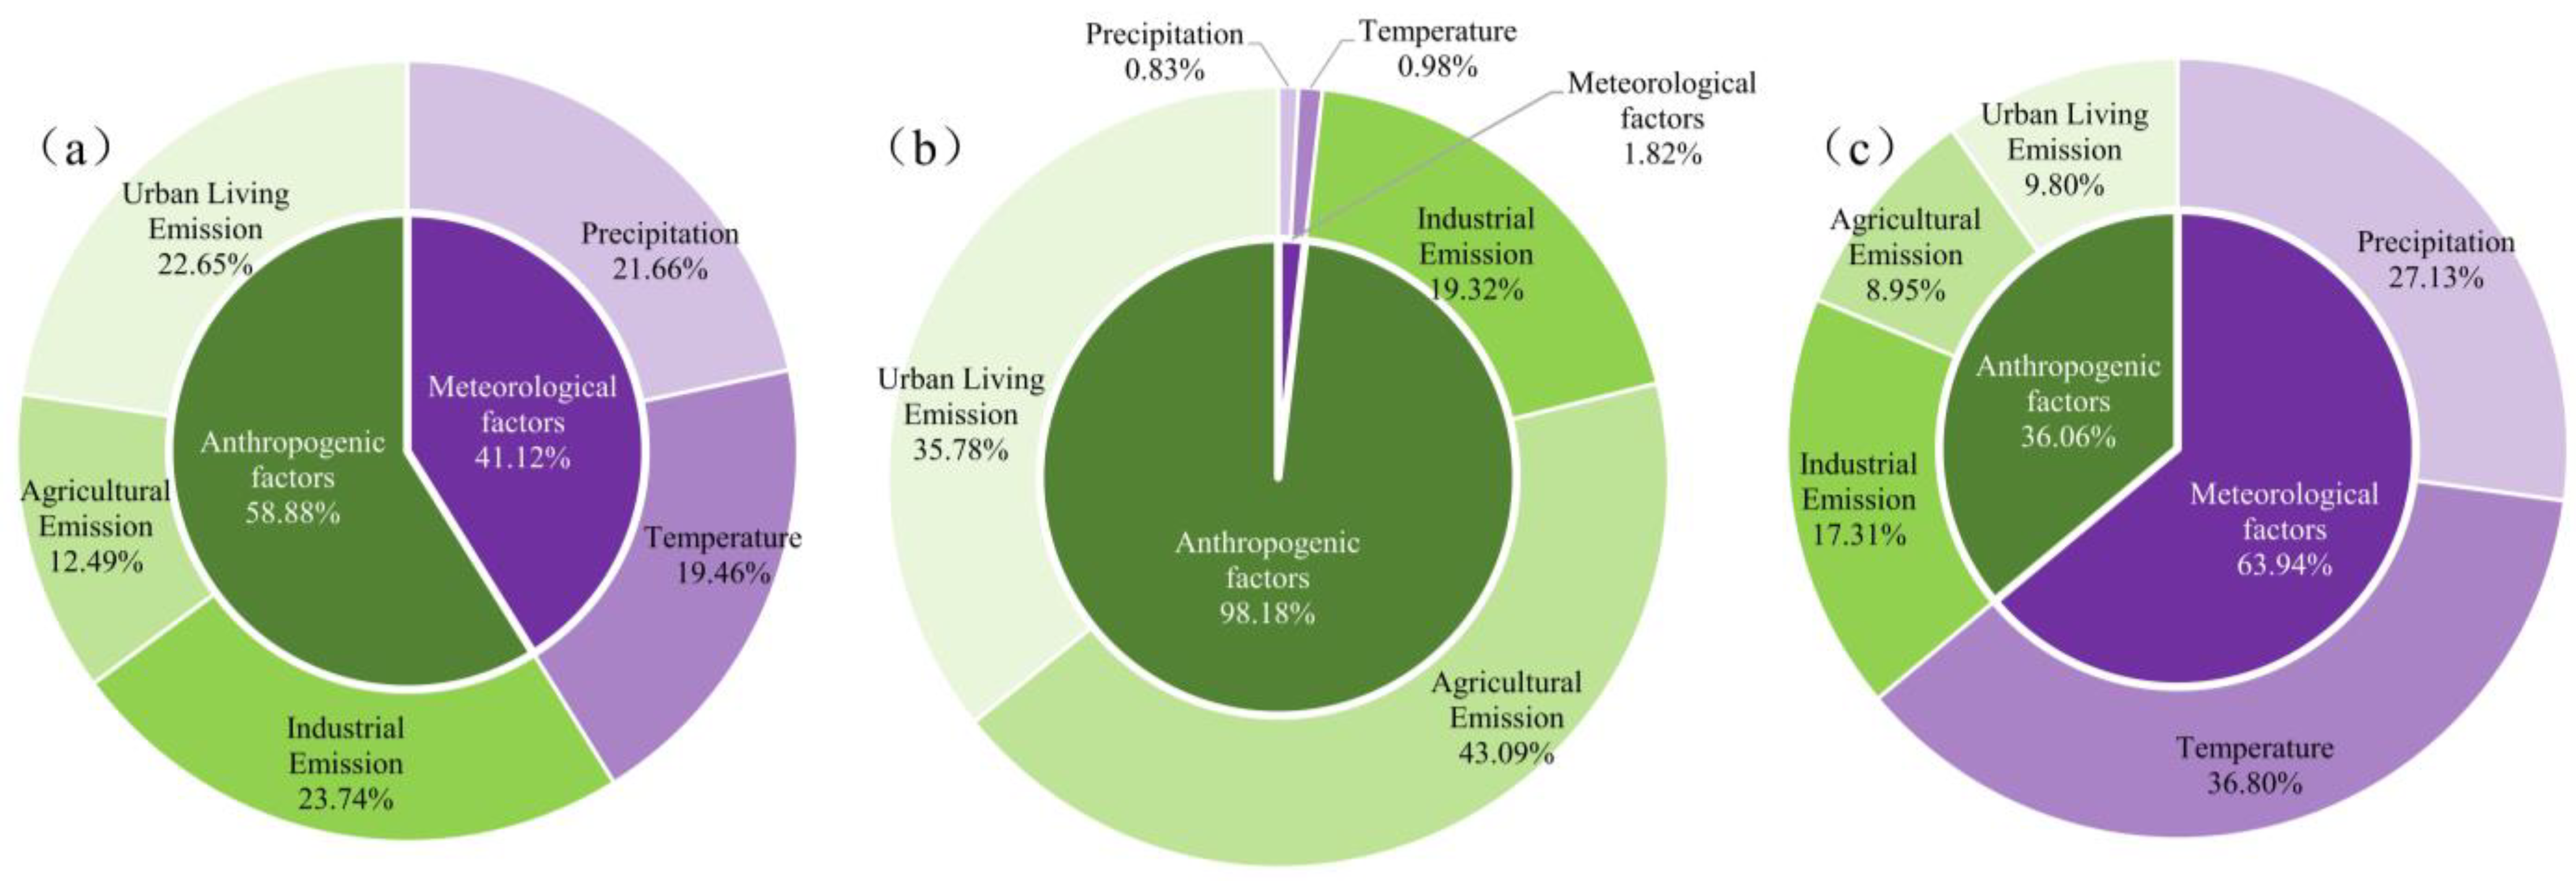
For the monitored raw NH3-N concentrations at the outlet of the MRB, the anthropogenic factors were the main factors controlling the variations in NH3-N concentrations, with a contribution of 58.88%, exceeding the meteorological factors of 41.12%. Among the anthropogenic factors, the impacts on the monitored raw NH3-N data from industrial sources (23.74%) and urban living sources (22.65%) were more significant than the impacts of agricultural sources (12.49%). For the long-term trend signals of the NH3-N concentration, the impacts of anthropogenic factors accounted for 98.18%, indicating the leading role of human activities in the long-term trend variations in NH3-N concentrations at the outlet of the MRB. However, different from the long-term trend signals of the CODMn concentrations, agricultural sources (43.09%) and urban living sources (35.78%) had significantly higher impacts than industrial sources (19.32%). Likewise, variations in the NH3-N concentration periodic signals were mainly controlled by meteorological factors (63.94%), which were similar to the results of the CODMn concentration periodic signals.
Overall, in the MRB, the long-term trend variations in the water quality data were primarily controlled by anthropogenic factors, while the periodic fluctuations were dominated by meteorological factors. The results indicated the positive effect of restricted policies for pollutants emissions and ecological protection. In addition, similar results for monitored raw data and periodic signals also reflected the key role of meteorological factors like precipitation and temperature changes for short-term patterns in the water quality of the Minjiang River. The results of the monitored raw data in this study were in agreement with the findings of Yuan et al. [3], who demonstrated that meteorological factors accounted for approximately 60% of the impacts on the CODMn concentrations of the MRB, while approximately 40% of the impacts on the NH3-N concentrations can be attributed to meteorological factors. Notably, our study further delineated the impacts of different driving factors in a more detailed classification and realized a dynamic assessment of these impacts, as described in the following section.

3.3. Seasonal Patterns of Quantified Impacts of Driving Factors on Water Quality

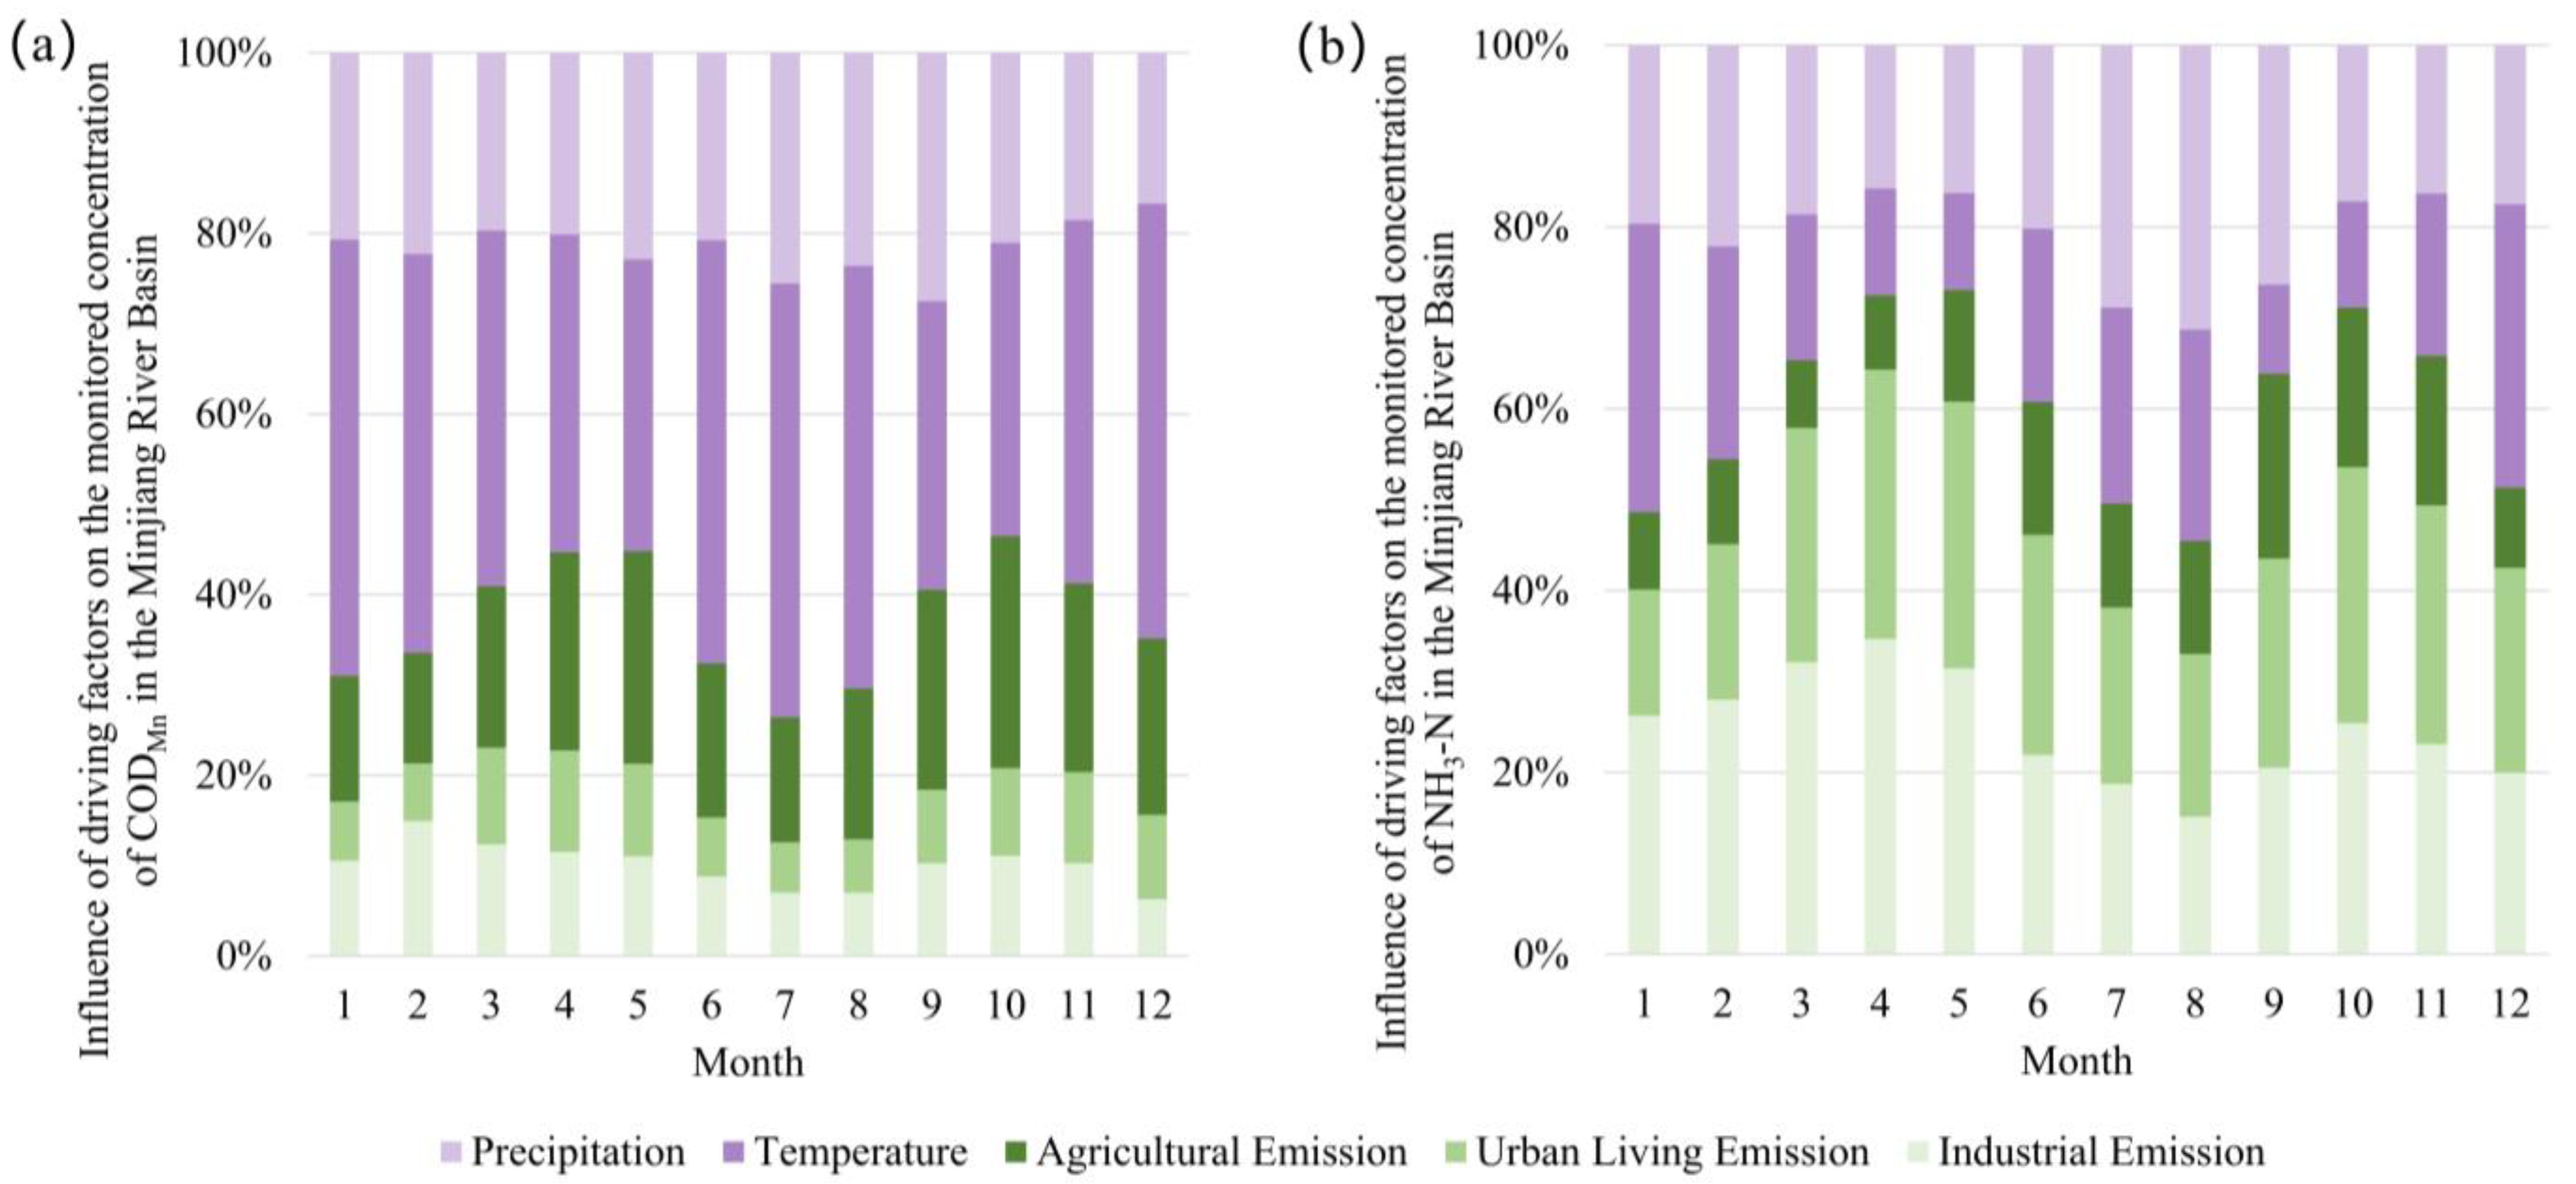
The driving factors of the water quality at the outlet of the MRB had significant seasonal patterns within the year, especially meteorological factors. Therefore, the impacts of different driving factors on the water quality at the outlet of the MRB also varied dynamically. The monthly patterns of impacts on the CODMn and NH3-N concentrations from 2016 to 2020 in the MRB were calculated (Figure 11) based on variations in driving factors like precipitation, air temperature, and pollution from different sources.
Significant seasonal patterns in the impacts of all the driving factors on the CODMn and NH3-N concentrations were identified. Meteorological factors had greater impacts on the water quality indices in periods with high air temperature and flood events (July to September), as well as periods with low air temperatures (December to February) compared to in other seasons. The increased impacts in periods with higher air temperatures could be explained by enhanced biogeochemical processes in river water, for instance, by affecting microbial metabolic rates, which can subsequently influence the dissolved oxygen concentrations, self-purification capacity, and water quality of water bodies. [38]. Under low-temperature conditions in winter, the thermal movement of water molecules and the kinetic energy of Brownian motion of colloidal particles are slowed down, which may reduce the degradation rate of pollutants in river water [39], resulting in a tougher aquatic environment. Furthermore, seasonal patterns were also derived from the impacts of the precipitation factor, which displayed significantly high values during flood seasons. Accelerated migration processes of water and pollutants into rivers triggered by more storms during this period might lead to stronger impacts on the water quality of the Minjiang River.

4. Conclusions

In this study, the monitored raw data of the CODMn and NH3-N concentrations at the outlet of the MRB from 2016 to 2020 were decomposed into two distinct kinds of signals through a wavelet analysis: the long-term trend signals and the periodic signals. Machine learning approaches and a Shapley analysis were further used to quantify the impacts of different driving factors on water quality signals at the outlet of the MRB, and the seasonality of the quantified impacts were analyzed. The coupled framework for the quantification of the impacts of driving factors on decomposed water quality signals is the highlight of our study. The main research conclusions are as follows:
  • The long-term trend signals of both the CODMn and NH3-N concentrations showed an increasing trend followed by a decreasing trend, in which the CODMn concentration increased and decreased by roughly the same magnitude, while the NH3-N concentration decreased more. This indicated that within the study period, the deterioration trend of water quality in the Minjiang River had been effectively controlled and significantly improved. The periodic signals of the CODMn concentrations exhibited a greater amplitude of fluctuation compared to the NH3-N concentrations, implying that the meteorological periodic drivers may have more pronounced influences on the CODMn concentrations.
  • Four machine learning algorithms were used to construct relationships between the driving factors and water quality indices of the MRB. The ensembles of trees approach demonstrated the best performances for both CODMn and NH3-N concentrations (R2 = 0.3648–0.9998).
  • For the monitored raw data, the meteorological factors were the dominant factors affecting the variations in CODMn concentrations at the outlet of the MRB (accounting for 64.13%), while the anthropogenic factors were the major factors affecting the NH3-N concentrations (accounting for 58.88%). In terms of the long-term trend signals, anthropogenic factors were the uncontroversial controlling factors, with quantified impacts of 98.38% on the CODMn concentrations and 98.18% on the NH3-N concentrations. For periodic signals, the meteorological factors had higher impact values, with a 68.89% impact on the CODMn concentrations and a 63.94% impact on the NH3-N concentrations.
  • The quantified impacts of the driving factors on the water quality of the Minjiang River had seasonal patterns. The meteorological factors demonstrated higher impacts during the flood season with high temperatures (July to September) and the dry season with low temperatures (December to February) compared to other seasons, indicating that the high temperature, low temperature, and precipitation events can significantly alter the biogeochemical processes in the MRB, further affecting the water quality.
Likewise, compared with pollution from industrial sources and urban living sources, agricultural emissions have more dramatic fluctuations and stronger randomness, making pollutants more difficult to accurately quantify. Therefore, more efforts should be considered in our future work regarding the accurate data acquisition and quantification of the pollutants loads from agricultural sources.

Supplementary Materials

The following supporting information can be downloaded at: https://www.mdpi.com/article/10.3390/w15183299/s1, Figure S1: Comparisons of simulated results versus different signals of observed data for CODMn concentrations using different machine learning algorithms; Figure S2: Comparisons of simulated results versus different signals of observed data for NH3-N concentrations using different machine learning algorithms; Figure S3: Temporal variations of simulated results versus different signals of observed data for CODMn concentrations using different machine learning algorithms. Red lines represent simulated results and blue circles represent observed data; Figure S4: Temporal variations of simulated results versus different signals of observed data for NH3-N concentrations using different machine learning algorithms. Red lines represent simulated results and blue circles represent observed data

Author Contributions

Conceptualization, C.L. and Y.H.; methodology, C.L. and Y.H.; investigation, C.L. and F.S.; data curation, Y.H. and W.W.; writing—original draft preparation, C.L.; writing—review and editing, C.L., Y.H., F.S., L.M., Y.W. and H.Z.; supervision, B.L. All authors have read and agreed to the published version of the manuscript.

Funding

This work was supported by the National Nature Science Foundation of China (No. 42107096 and 41807407), the National Key Research and Development Program of China (No. 2020YFC1808300), and the Key Research and Development Program of Sichuan Province (No. 2021YFQ0067).

Data Availability Statement

The data that supports the findings of this study are available from the corresponding authors upon reasonable request.

Conflicts of Interest

The authors declare no conflict of interest.

References

  1. Liu, N.; Sun, P.; Caldwell, P.V.; Harper, R.; Liu, S.; Sun, G. Trade-off between Watershed Water Yield and Ecosystem Productivity along Elevation Gradients on a Complex Terrain in Southwestern China. J. Hydrol. 2020, 590, 125449. [Google Scholar] [CrossRef]
  2. He, Y.; Pan, H.; Wang, R.; Yao, C.; Cheng, J.; Zhang, T. Research on the Cumulative Effect of Multiscale Ecological Compensation in River Basins: A Case Study of the Minjiang River Basin, China. Ecol. Indic. 2023, 154, 110605. [Google Scholar] [CrossRef]
  3. Yuan, W.; Liu, Q.; Song, S.; Lu, Y.; Yang, S.; Fang, Z.; Shi, Z. A Climate-Water Quality Assessment Framework for Quantifying the Contributions of Climate Change and Human Activities to Water Quality Variations. J. Environ. Manag. 2023, 333, 117441. [Google Scholar] [CrossRef]
  4. Wu, Z.; Liu, X.; Lv, C.; Gu, C.; Li, Y. Emergy Evaluation of Human Health Losses for Water Environmental Pollution. Water Policy 2021, 23, 801–818. [Google Scholar] [CrossRef]
  5. Alnahit, A.O.; Mishra, A.K.; Khan, A.A. Evaluation of High-Resolution Satellite Products for Streamflow and Water Quality Assessment in a Southeastern US Watershed. J. Hydrol. Reg. Stud. 2020, 27, 100660. [Google Scholar] [CrossRef]
  6. Johnson, A.C.; Acreman, M.C.; Dunbar, M.J.; Feist, S.W.; Giacomello, A.M.; Gozlan, R.E.; Hinsley, S.A.; Ibbotson, A.T.; Jarvie, H.P.; Jones, J.I.; et al. The British River of the Future: How Climate Change and Human Activity Might Affect Two Contrasting River Ecosystems in England. Sci. Total Environ. 2009, 407, 4787–4798. [Google Scholar] [CrossRef] [PubMed]
  7. Zeng, F.; Ma, M.-G.; Di, D.-R.; Shi, W.-Y. Separating the Impacts of Climate Change and Human Activities on Runoff: A Review of Method and Application. Water 2020, 12, 2201. [Google Scholar] [CrossRef]
  8. Yao, Y.; Zheng, C.; Andrews, C.B.; Scanlon, B.R.; Kuang, X.; Zeng, Z.; Jeong, S.; Lancia, M.; Wu, Y.; Li, G. Role of Groundwater in Sustaining Northern Himalayan Rivers. Geophys. Res. Lett. 2021, 48, e2020GL092354. [Google Scholar] [CrossRef]
  9. Yu, X.; Shen, J.; Du, J. A Machine-Learning-Based Model for Water Quality in Coastal Waters, Taking Dissolved Oxygen and Hypoxia in Chesapeake Bay as an Example. Water Resour. Res. 2020, 56, e2020WR027227. [Google Scholar] [CrossRef]
  10. Akoko, G.; Le, T.H.; Gomi, T.; Kato, T. A Review of SWAT Model Application in Africa. Water 2021, 13, 1313. [Google Scholar] [CrossRef]
  11. Chen, Y.; Xu, C.-Y.; Chen, X.; Xu, Y.; Yin, Y.; Gao, L.; Liu, M. Uncertainty in Simulation of Land-Use Change Impacts on Catchment Runoff with Multi-Timescales Based on the Comparison of the HSPF and SWAT Models. J. Hydrol. 2019, 573, 486–500. [Google Scholar] [CrossRef]
  12. Ramteke, G.; Singh, R.; Chatterjee, C. Assessing Impacts of Conservation Measures on Watershed Hydrology Using MIKE SHE Model in the Face of Climate Change. Water Resour Manag. 2020, 34, 4233–4252. [Google Scholar] [CrossRef]
  13. Kabir, T.; Pokhrel, Y.; Felfelani, F. On the Precipitation-Induced Uncertainties in Process-Based Hydrological Modeling in the Mekong River Basin. Water Resour. Res. 2022, 58, e2021WR030828. [Google Scholar] [CrossRef]
  14. Liu, Q.; Wang, W.; Luo, B.; Wang, K. Contribution of pollution reduction measures and meteorological conditions to improvement of water environment of the Minjiang River Basin in the middle of the 13th five-year plan based on SWAT model. Environ. Eng. 2021, 39, 45–54. [Google Scholar]
  15. Herrera, P.A.; Marazuela, M.A.; Hofmann, T. Parameter Estimation and Uncertainty Analysis in Hydrological Modeling. WIREs Water 2022, 9, e1569. [Google Scholar] [CrossRef]
  16. Pradhan, P.; Tingsanchali, T.; Shrestha, S. Evaluation of Soil and Water Assessment Tool and Artificial Neural Network Models for Hydrologic Simulation in Different Climatic Regions of Asia. Sci. Total Environ. 2020, 701, 134308. [Google Scholar] [CrossRef]
  17. Zounemat-Kermani, M.; Batelaan, O.; Fadaee, M.; Hinkelmann, R. Ensemble Machine Learning Paradigms in Hydrology: A Review. J. Hydrol. 2021, 598, 126266. [Google Scholar] [CrossRef]
  18. Feng, Z.; Niu, W.; Wan, X.; Xu, B.; Zhu, F.; Chen, J. Hydrological Time Series Forecasting via Signal Decomposition and Twin Support Vector Machine Using Cooperation Search Algorithm for Parameter Identification. J. Hydrol. 2022, 612, 128213. [Google Scholar] [CrossRef]
  19. Jiang, S.; Zheng, Y.; Solomatine, D. Improving AI System Awareness of Geoscience Knowledge: Symbiotic Integration of Physical Approaches and Deep Learning. Geophys. Res. Lett. 2020, 47, e2020GL088229. [Google Scholar] [CrossRef]
  20. Shen, C. A Transdisciplinary Review of Deep Learning Research and Its Relevance for Water Resources Scientists. Water Resour. Res. 2018, 54, 8558–8593. [Google Scholar] [CrossRef]
  21. Tan, Z.; Ren, J.; Li, S.; Li, W.; Zhang, R.; Sun, T. Inversion of Nutrient Concentrations Using Machine Learning and Influencing Factors in Minjiang River. Water 2023, 15, 1398. [Google Scholar] [CrossRef]
  22. Belkhiri, L.; Mouni, L. Geochemical Modeling of Groundwater in the El Eulma Area, Algeria. Desalination Water Treat. 2013, 51, 1468–1476. [Google Scholar] [CrossRef]
  23. Belkhiri, L.; Mouni, L. Geochemical Characterization of Surface Water and Groundwater in Soummam Basin, Algeria. Nat Resour Res 2014, 23, 393–407. [Google Scholar] [CrossRef]
  24. Tao, H.; Liao, X.; Cao, H.; Zhao, D.; Hou, Y. Three-Dimensional Delineation of Soil Pollutants at Contaminated Sites: Progress and Prospects. J. Geogr. Sci. 2022, 32, 1615–1634. [Google Scholar] [CrossRef]
  25. Shen, Z.; Liao, Q.; Hong, Q.; Gong, Y. An Overview of Research on Agricultural Non-Point Source Pollution Modelling in China. Sep. Purif. Technol. 2012, 84, 104–111. [Google Scholar] [CrossRef]
  26. Xun, Y.; Wang, L.; Yang, H.; Cai, J. Mining Relevant Partial Periodic Pattern of Multi-Source Time Series Data. Inf. Sci. 2022, 615, 638–656. [Google Scholar] [CrossRef]
  27. Bhaskaran, K.; Gasparrini, A.; Hajat, S.; Smeeth, L.; Armstrong, B. Time Series Regression Studies in Environmental Epidemiology. Int. J. Epidemiol. 2013, 42, 1187–1195. [Google Scholar] [CrossRef]
  28. Zheng, J.; Pan, H.; Yang, S.; Cheng, J. Adaptive Parameterless Empirical Wavelet Transform Based Time-Frequency Analysis Method and Its Application to Rotor Rubbing Fault Diagnosis. Signal Process. 2017, 130, 305–314. [Google Scholar] [CrossRef]
  29. Anvari, R.; Kahoo, A.R.; Mohammadi, M.; Khan, N.A.; Chen, Y. Seismic Random Noise Attenuation Using Sparse Low-Rank Estimation of the Signal in the Time–Frequency Domain. IEEE J. Sel. Top. Appl. Earth Obs. Remote Sens. 2019, 12, 1612–1618. [Google Scholar] [CrossRef]
  30. Zeng, W.; Li, M.; Yuan, C.; Wang, Q.; Liu, F.; Wang, Y. Identification of Epileptic Seizures in EEG Signals Using Time-Scale Decomposition (ITD), Discrete Wavelet Transform (DWT), Phase Space Reconstruction (PSR) and Neural Networks. Artif Intell Rev 2020, 53, 3059–3088. [Google Scholar] [CrossRef]
  31. Mohammadi, B. A Review on the Applications of Machine Learning for Runoff Modeling. Sustain. Water Resour. Manag. 2021, 7, 98. [Google Scholar] [CrossRef]
  32. Zhang, H.; Yang, Q.; Shao, J.; Wang, G. Dynamic Streamflow Simulation via Online Gradient-Boosted Regression Tree. J. Hydrol. Eng. 2019, 24, 04019041. [Google Scholar] [CrossRef]
  33. Louhichi, M.; Nesmaoui, R.; Mbarek, M.; Lazaar, M. Shapley Values for Explaining the Black Box Nature of Machine Learning Model Clustering. Procedia Comput. Sci. 2023, 220, 806–811. [Google Scholar] [CrossRef]
  34. Rozemberczki, B.; Watson, L.; Bayer, P.; Yang, H.-T.; Kiss, O.; Nilsson, S.; Sarkar, R. The Shapley Value in Machine Learning. arXiv 2022, arXiv:2202.05594. [Google Scholar]
  35. Zlatanović, L.; Van Der Hoek, J.P.; Vreeburg, J.H.G. An Experimental Study on the Influence of Water Stagnation and Temperature Change on Water Quality in a Full-Scale Domestic Drinking Water System. Water Res. 2017, 123, 761–772. [Google Scholar] [CrossRef] [PubMed]
  36. Hernández-Crespo, C.; Fernández-Gonzalvo, M.; Martín, M.; Andrés-Doménech, I. Influence of Rainfall Intensity and Pollution Build-up Levels on Water Quality and Quantity Response of Permeable Pavements. Sci. Total Environ. 2019, 684, 303–313. [Google Scholar] [CrossRef]
  37. Rostami, S.; He, J.; Hassan, Q. Riverine Water Quality Response to Precipitation and Its Change. Environments 2018, 5, 8. [Google Scholar] [CrossRef]
  38. Coffey, R.; Paul, M.J.; Stamp, J.; Hamilton, A.; Johnson, T. A Review of Water Quality Responses to Air Temperature and Precipitation Changes 2: Nutrients, Algal Blooms, Sediment, Pathogens. J Am Water Resour Assoc 2019, 55, 844–868. [Google Scholar] [CrossRef]
  39. Karlsson, J.K.G.; Woodford, O.J.; Al-Aqar, R.; Harriman, A. Effects of Temperature and Concentration on the Rate of Photobleaching of Erythrosine in Water. J. Phys. Chem. A 2017, 121, 8569–8576. [Google Scholar] [CrossRef] [PubMed]
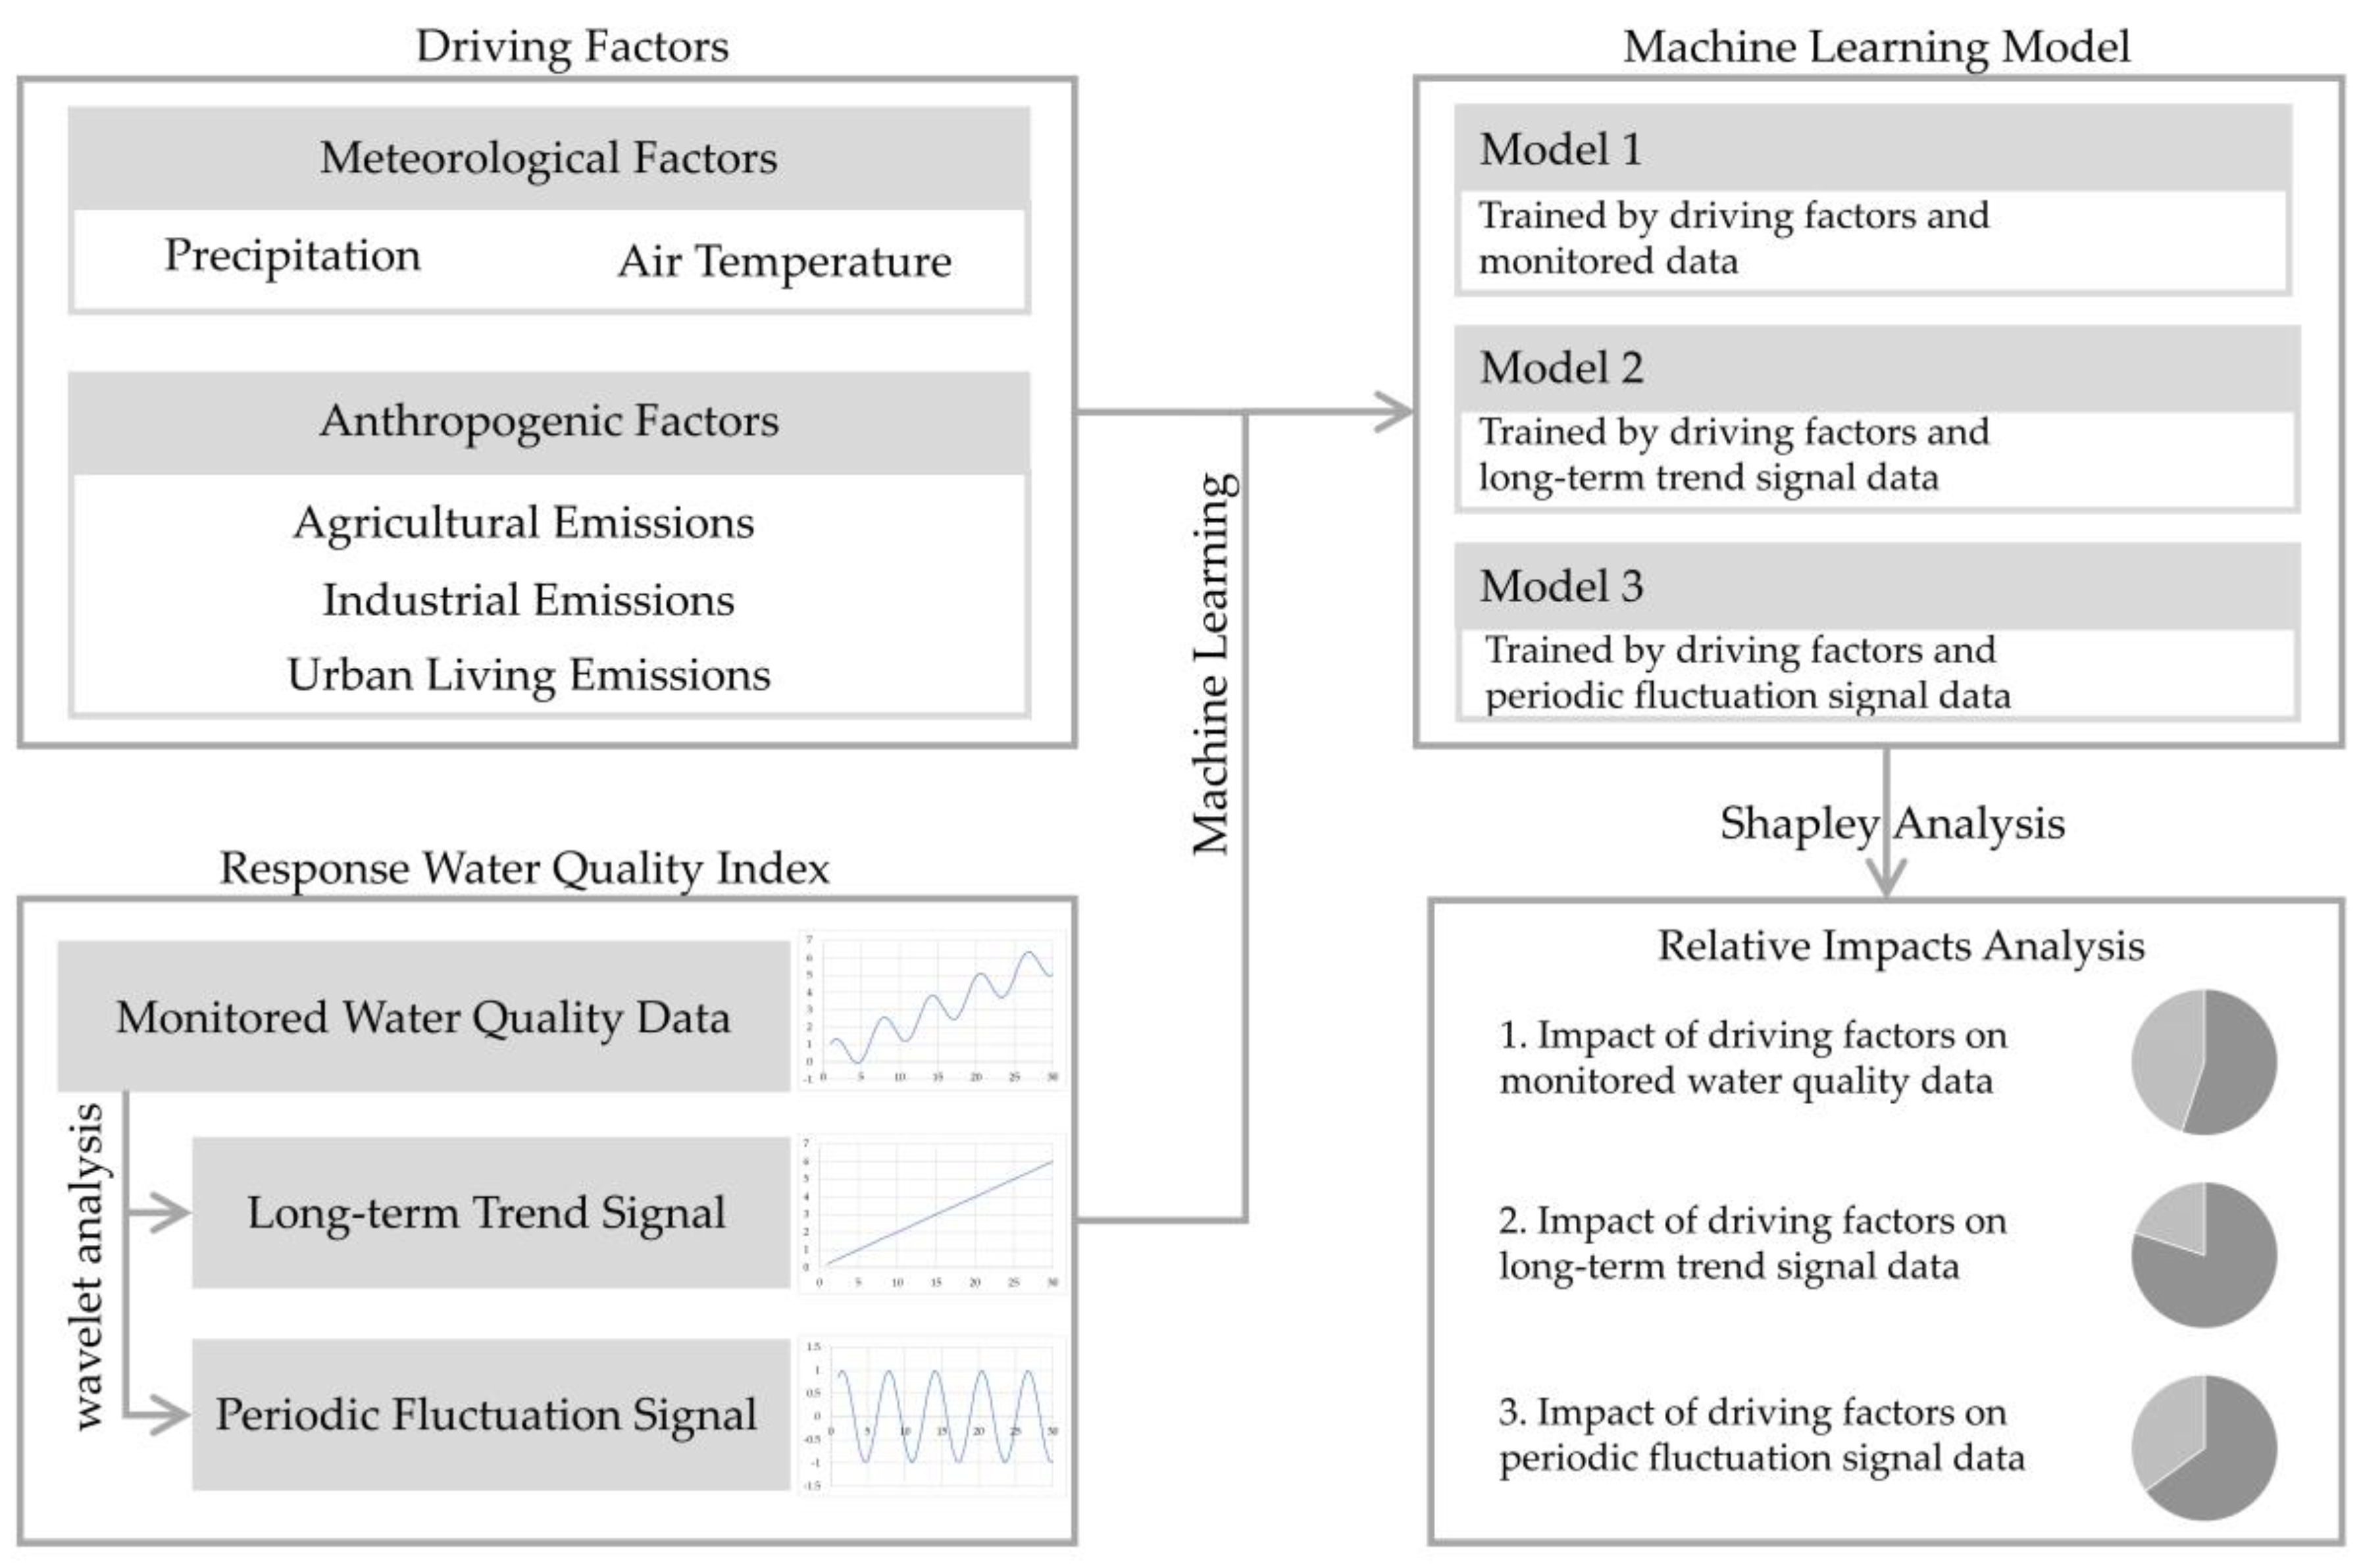
Figure 1. Overview of the present study.
Water 15 03299 g001
Figure 2. The locations of the meteorological and water quality monitoring stations in the MRB.
Water 15 03299 g002
Figure 3. (a) Flow chart and results of the wavelet analysis for different (b) CODMn and (c) NH3-N concentrations.
Water 15 03299 g003
Figure 4. Decomposed results of the CODMn concentration at the outlet of the MRB based on the wavelet analysis.
Water 15 03299 g004
Figure 5. Decomposed results of the NH3-N concentration at the outlet of the MRB based on the wavelet analysis.
Water 15 03299 g005
Figure 6. The air temperature variation at different meteorological stations in the MRB.
Water 15 03299 g006
Figure 7. Variations in the mean daily and annual precipitation of different stations in the MRB.
Water 15 03299 g007
Figure 8. The the Taylor diagrams of the modeling results of monitored data, periodic signals and long-term trend signals of CODMn and NH3-N concentrations by different machine learning approaches.
Water 15 03299 g008
Figure 9. The quantitative impacts of driving factors on the (a) monitored raw data, (b) long-term trend signals, and (c) periodic signals of CODMn concentration at the outlet of the MRB.
Water 15 03299 g009
Figure 10. The quantitative impacts of driving factors on the (a) monitored raw data, (b) long-term trend signals, and (c) periodic signals of the NH3-N concentration at the outlet of the MRB.
Water 15 03299 g010
Figure 11. The quantitative impacts of driving factors on the (a) CODMn and (b) NH3-N concentrations at the outlet of the MRB.
Water 15 03299 g011
Table 1. Methods of measurements of water quality indices at the Liangjianggou Station.
Water Quality IndicesMethods of MeasurementsUnit
CODMnPotassium permanganate oxidation-ORP
potentiometric titration method
mg/L
NH3-NSalicylic acid spectrophotometrymg/L
Table 2. Meteorological station information in the MRB with the collected data used in the present study.
Station NameLatitude (Degree)Longitude (Degree)Elevation (m)
Seda32.28100.333896
Maerkang31.90102.232666
Songpan32.67103.602883
Wenjiang30.75103.87541.0
Yaan29.98103.00629.0
Kangding30.05101.972617
Emeishan29.52103.333049
Yibin28.80104.60342.0
Table 3. Pollutant load data in the MRB (ten thousand tons per year).
YearAgricultural EmissionsIndustrial EmissionsUrban Living Emissions
Chemical FertilizersNitrogenous FertilizersPhosphate FertilizersCompound FertilizersWastewaterCODNH3-NWastewaterCODNH3-N
2016249.0121.948.9060.205.079 × 1045.0000.32003.017 × 10562.207.700
2017242.0117.047.1060.204.662 × 1044.2000.17003.217 × 10566.407.500
2018235.2112.145.4060.304.346 × 1044.1000.19003.417 × 10570.507.400
2019222.8103.541.4062.104.662 × 1043.9000.17003.617 × 10574.707.200
2020210.890.7038.0067.004.374 × 1042.6000.13003.817 × 10578.807.100
Table 4. The determination coefficients of different training models.
ModelCODMnNH3-N
Monitored DataTrend DataPeriodic DataMonitored DataTrend DataPeriodic Data
Ensembles of trees0.63780.99970.66850.36480.99980.3659
Regression trees0.53860.99950.51570.20520.99970.2204
Neural networks0.55250.99790.55540.22720.99460.1226
Support vector machines0.64360.99150.64940.24540.99500.3097
Disclaimer/Publisher’s Note: The statements, opinions and data contained in all publications are solely those of the individual author(s) and contributor(s) and not of MDPI and/or the editor(s). MDPI and/or the editor(s) disclaim responsibility for any injury to people or property resulting from any ideas, methods, instructions or products referred to in the content.