Article

On the Usefulness of the Proper Orthogonal Decomposition on the Description of the Highly Concentrated Sediment Release Phenomena Resulting from a Two-Phase Solid-Fluid Simulation: Effect of the Ambient Current

by
Alina Santa Cruz
1,
Duc Hau Nguyen
2 and
Sylvain S. Guillou
1,*
1
Laboratoire Universitaire des Sciences Appliquées de Cherbourg (LUSAC, UR 4253), Université de Caen Normandie, 60 rue Max Pol Fouchet CS 20082, 50130 14000 Caen, France
2
Faculty of Computer Science and Engineering, Thuyloi University, C5, 175 Tay Son St., Hanoi 116705, Vietnam
*
Author to whom correspondence should be addressed.
Water 2023, 15(18), 3284; https://doi.org/10.3390/w15183284
Submission received: 17 July 2023 / Revised: 7 September 2023 / Accepted: 9 September 2023 / Published: 18 September 2023
(This article belongs to the Section Hydraulics and Hydrodynamics)

Abstract

:
Proper orthogonal decomposition (POD) is used to examine the release of highly concentrated water–sediment mixture in water, with or without ambient current. This technique allows us to extract the dominant features in spatio-temporal data sets and the POD total energies associated to the base parameter of the decomposition. Both one-component and two-component POD techniques are, respectively, applied on data relative to the solid volume fraction and on the solid volume fraction velocities. The analysis is based on an experiment in the literature and data sets provided by a two-phase flow solid-fluid numerical simulation. For release phenomenon without ambient current, the analysis of the POD results highlights that the impact of the particle diameter on the solid phase dynamics and the particle dispersion is modest during the falling time, but that it becomes preponderant during the formation of a turbidity current. Aided by POD, the impact of the ambient current is studied for a given particle diameter. As the ambient current becomes strong, we can observe the effect of the resistance of the bottom against the water–sediment mixture transport. According to the strength of the ambient current, the POD results show that the dynamics of the release phenomenon have two different regimes on either side of a clearly identified threshold value.

1. Introduction

The maintenance and increase in the water depth is necessary to ensure a safe entrance to navigation channels, harbors, and docks. Dredging operations are a routine necessity to remove the sediments and debris gradually carried into the different passage zones of the ships. The dredged sediment is released over a deposit zone. The dilution of the discharged material with seawater results in a variable solid volume fraction. The concentration of the sediment cloud appearing at the time of release is greater than 350 g/L and has an impact on the environment. Three different steps can be observed in this phenomenon: after the release, during the settling stage, sediments settle under a cloud of very high concentration; a second step is the material impact on the bed; the impact is followed by the formation of a turbidity current. Villaret [1] and Boutin [2] performed experiments of the release of sediment in a flume with and without currents. They were used as reference by Guillou et al. [3] to study the release and the formation of the density current by applying a two-phase flow model (NSMP-code). The choice of this kind of modeling is due to the high concentration of the mixture. Nguyen et al. [4] performed complementary simulations with the same code for two sand diameters and several lateral currents. Fluid flows are largely characterized by the coexistence of multiscale coherent structures revealing their own spatial and temporal scales. Their identification is an essential step in the study of the physical processes involved in numerical or experimental data. Many analysis methods have been developed to examine the dynamics of these coherent structures (wavelets method, Lyapunov exponent, Q-criterion, or λ2-criterion). In this way, proper orthogonal decomposition (POD) is a commonly used method of data analysis. POD is a technique which allows the identification of the most energetic structures that contribute in a physical spatio-temporal set of realizations [5]. Thus, POD leads to the extraction of their dominant characteristic features: it is based on a spatial-dependent orthonormal basis and time-dependent orthogonal time functions. It can be used for the reconstruction of the most probable realizations (cf. Holmes et al. [6]). The snapshot POD technique [5] is well adapted to extract information from numerical data. Cizmas et al. [7] used it to extract the spatio-temporal pattern in fluidized beds and then to build a reduced order model of the gas and the interaction of solid particles. Other works have dealt with bubbles in multiphase flow [8,9,10,11,12,13] and used POD technique to obtain a model simulation of variable density flow and solute transport in the case of submarine groundwater discharge. The reduced model associated with Galerkin projections is able to reproduce and predict the model results with accuracy with less computational time. Model reduction for groundwater flow models has also been implemented by Vermeulen et al. [14] and Vermeulen et al. [15]. As previously observed, POD has been used in two-phase applications. In particular, some authors [16,17,18,19,20] have applied this specific technique to identify the dominant structures in the flow dynamics of horizontal slug flow commonly observed in many industrial processes. Both phases, the liquid (water or oil) and the gaseous, have been explored.
The study of the concentrated sediment release from the experimental results is limited to the characterization of the evolution of the turbidity distribution at falling time and sediment release. The measurement of the dynamics of both phases present in this complex phenomenon is not accessible with experimental techniques. This work deals with the high “concentrated” sediment release phenomena resulting from a two-phase solid-fluid numerical simulation. Moreover, the effect of the lateral ambient current is also studied. The snapshot POD technique can be applied on variables characterizing the solid fraction that cannot be easily obtained by the experimental way. The snapshot proper orthogonal decomposition one-component (1C) method was applied to the water–sediment mixture release phenomenon in a previous work (cf. Nguyen et al. [21]). The dominant features in space and time were extracted from the spatio-temporal dynamics of the simulations. Now, one scalar component and two vectorial component proper orthogonal decomposition have been applied, respectively, to the fluctuating solid phase volume fraction and solid phase velocities. More specifically, we focused on the contribution of the proper orthogonal decomposition two-component (2C) method applied on the solid phase velocities to improve the comprehension of the link between the dynamics of the solid phase and the dispersion of the particle dispersion. Moreover, this work could also be a preliminary step to propose, at a future time, a reduced order model for engineering application, concerning the falling process or the density current phase.
In the Section 2, the following are introduced: the sediment release experiment, the numerical modeling configuration, and the basis of the proper orthogonal decomposition technique. The Section 3 deals with the results obtained by POD for a water–sediment mixture release, with or without ambient current. The impact of the particle diameter is studied without an ambient current for two different kinds of sand; then, the impact of the ambient current is only examined for the smallest diameter case. Particular attention is paid to the analysis of the link between the dynamics of the solid phase volume fraction and velocities. Finally, conclusions are given in the Section 4.

2. Materials and Methods

2.1. Experimental and Modeling Configuration

2.1.1. Governing Equations and Configurations Studied

There are several modeling strategies to simulate the coupling between a fluid and solid from the two-phase discrete element method in which the motion of each particle is modeled to the general sediment transport model in an environment for which sediments have no influence on the fluid flow. Between them, there exists the Eulerian–Eulerian two-phase model for which a concentration of particle is considered. It allows us to better model the interaction between the water and the particles without simulating the motion of each particle [22]. After considering the particles’ size and the size of the domain, we choose to use the two-phase Euler–Euler approach. The two-phase flow model used here is based on the Eulerian–Eulerian description of the sediment and water motion [4]. We used an in-house 2D-solver first developed by Barbry et al. [23] and improved substantially by Chauchat and Guillou [24] and Nguyen et al. [25]. It is based on the resolution of the two-phase Euler–Euler equation for fluids and particles using the finite difference method. It is based on the governing Equation (1), as follows, where the subscript k is “f” for fluid and “s” for solid phase:
α k t + . α k . u k = 0 α k . u k t + . α k u k u k = 1 ρ k . α k p k     I ̿ + τ k ̿ + α k .   g + 1 ρ k . M k            
where α k , u k , and ρ k stand for the volume fraction, velocity, and density of phase k, respectively, g is the acceleration of gravity, M k the inter-phase momentum transfer, p k the pressure of phase k, and τ k ̿ is the viscous term. The sum of volume fractions, α k , is obviously equal to 1. α k   τ k ̿ is linked to shear rate tensors of each phase, D s ̿ and D f ̿ by the following Equation (2) [26]:
    α f   τ f ̿ = μ f s D s ̿ + μ f f D f ̿                   α s   τ s ̿ = μ s s D s ̿ + μ s f D f ̿  
The viscous coefficients are provided by Equation (3), in which the amplification factor β is provided by the model (Equation (4)) proposed by Graham [27] in the function of the inter-particle distance dip (Equation (5)). In that relation, d is the particle diameter and αs,max is the maximum close packing concentration (close to 0.635 for non-cohesive spherical solid particles). Equations (3)–(5) are as follows:
μ f f = α f μ f ,           μ f f = α f μ f ,       μ s s = α s β μ f s ,       μ f s = α s μ f  
β = 5 2 + 9 4 1 1 + d i p d 1 2 d i p d 1 1 + 2 d i p d 1 1 + 2 d i p d 2 1 α s
d i p d = 1 α s α s m a x 1 3 α s α s m a x 1 3
Moreover, the phase particle also plays a different role following the phase. The reader is referred to [4] for more information on the model, as it is not the main objective of this paper.

2.1.2. The Release Phenomenon

A recipient (maximum capacity of 60 L) containing a highly concentrated mixture of sand and water is placed at 15 cm below the free-water surface in a straight channel of 72 m long, of 1.5 m wide, and of 1.5 m height (Villaret [1] and Boutin [2]) with a current.
The measurement of the release (a camera that takes pictures every 0.5 s, and concentration measurements are obtained by using optical transducers placed at three fixed points) starts when the bottom of the recipient is opened (cf. Figure 1). After the release, two counter-rotating vortices [1] fall until the bottom have been observed. Then, a second phase appears in which the sediment cloud is expanding in the two lateral directions.
Pure-sand experiments were performed for several parameters, namely the sediment diameters (Dp), the sediment release volumes (Vd), the initial concentrations of the mixture (Cm), and the imposed ambient current (Uc). Villaret [1] and Boutin [2] determined the falling time (time lapse between the release and the impact of the sediment cloud on the bottom), the up- and downstream radius of the cloud, the maximum height of the density current, and the front velocity of the density current (Table 1).
Moreover, both authors noticed that the experiment had a 2D development of the plume, in spite of the fact that the experimental domain had a square section. Thus, the 2D-solver previously presented was applied to obtain the numerical experiment.

2.1.3. Design of Numerical Experiments

The 2-D X/Z computation domain has a length of 14 m in the horizontal direction (positive upstream, centered to the dumping location) and over 1 m on the vertical one. A no-slip condition is fixed on the bottom and a slip condition is fixed at the top boundary. At the channel inlet, the fluid velocity is imposed, and no sediment is introduced. According to the recommendations of Nguyen [4] the opening of the recipient (width = 10 cm), the concentration and a Poiseuille parabolic profile of maximum velocity (Winj) are imposed, assuring the right mixture discharge. Indeed, it was observed in this previous work that the Poiseuille-type profile is well suited to the experimental conditions. The values of the channel inlet velocity and the release are shown in Table 1. Two sand diameters are considered, namely Dp1 = 90 µm (sand 1) and Dp2 = 160 µm (sand 2). A uniform mesh of 1401 nodes on the horizontal and 61 vertical nodes were used, and the time step was fixed to 0.001 s. Data analyses were performed over the simulation outputs for every 0.1 s. This work is focused on the averaged motion, and the outputs timestep seems to be adapted to this characterization. It will serve for the POD analysis hereafter.
Cases Dp1 (sand 1) and Dp2 (sand 2), assumed in this work as reference cases, were previously presented by Guillou et al. [3]. They studied the evolution of the sediment cloud as well as solid velocity fields in still water for both cases. It was found that the two-phase model reproduces two counter-rotating vortices, as observed experimentally by Villaret [1] and Boutin [2].
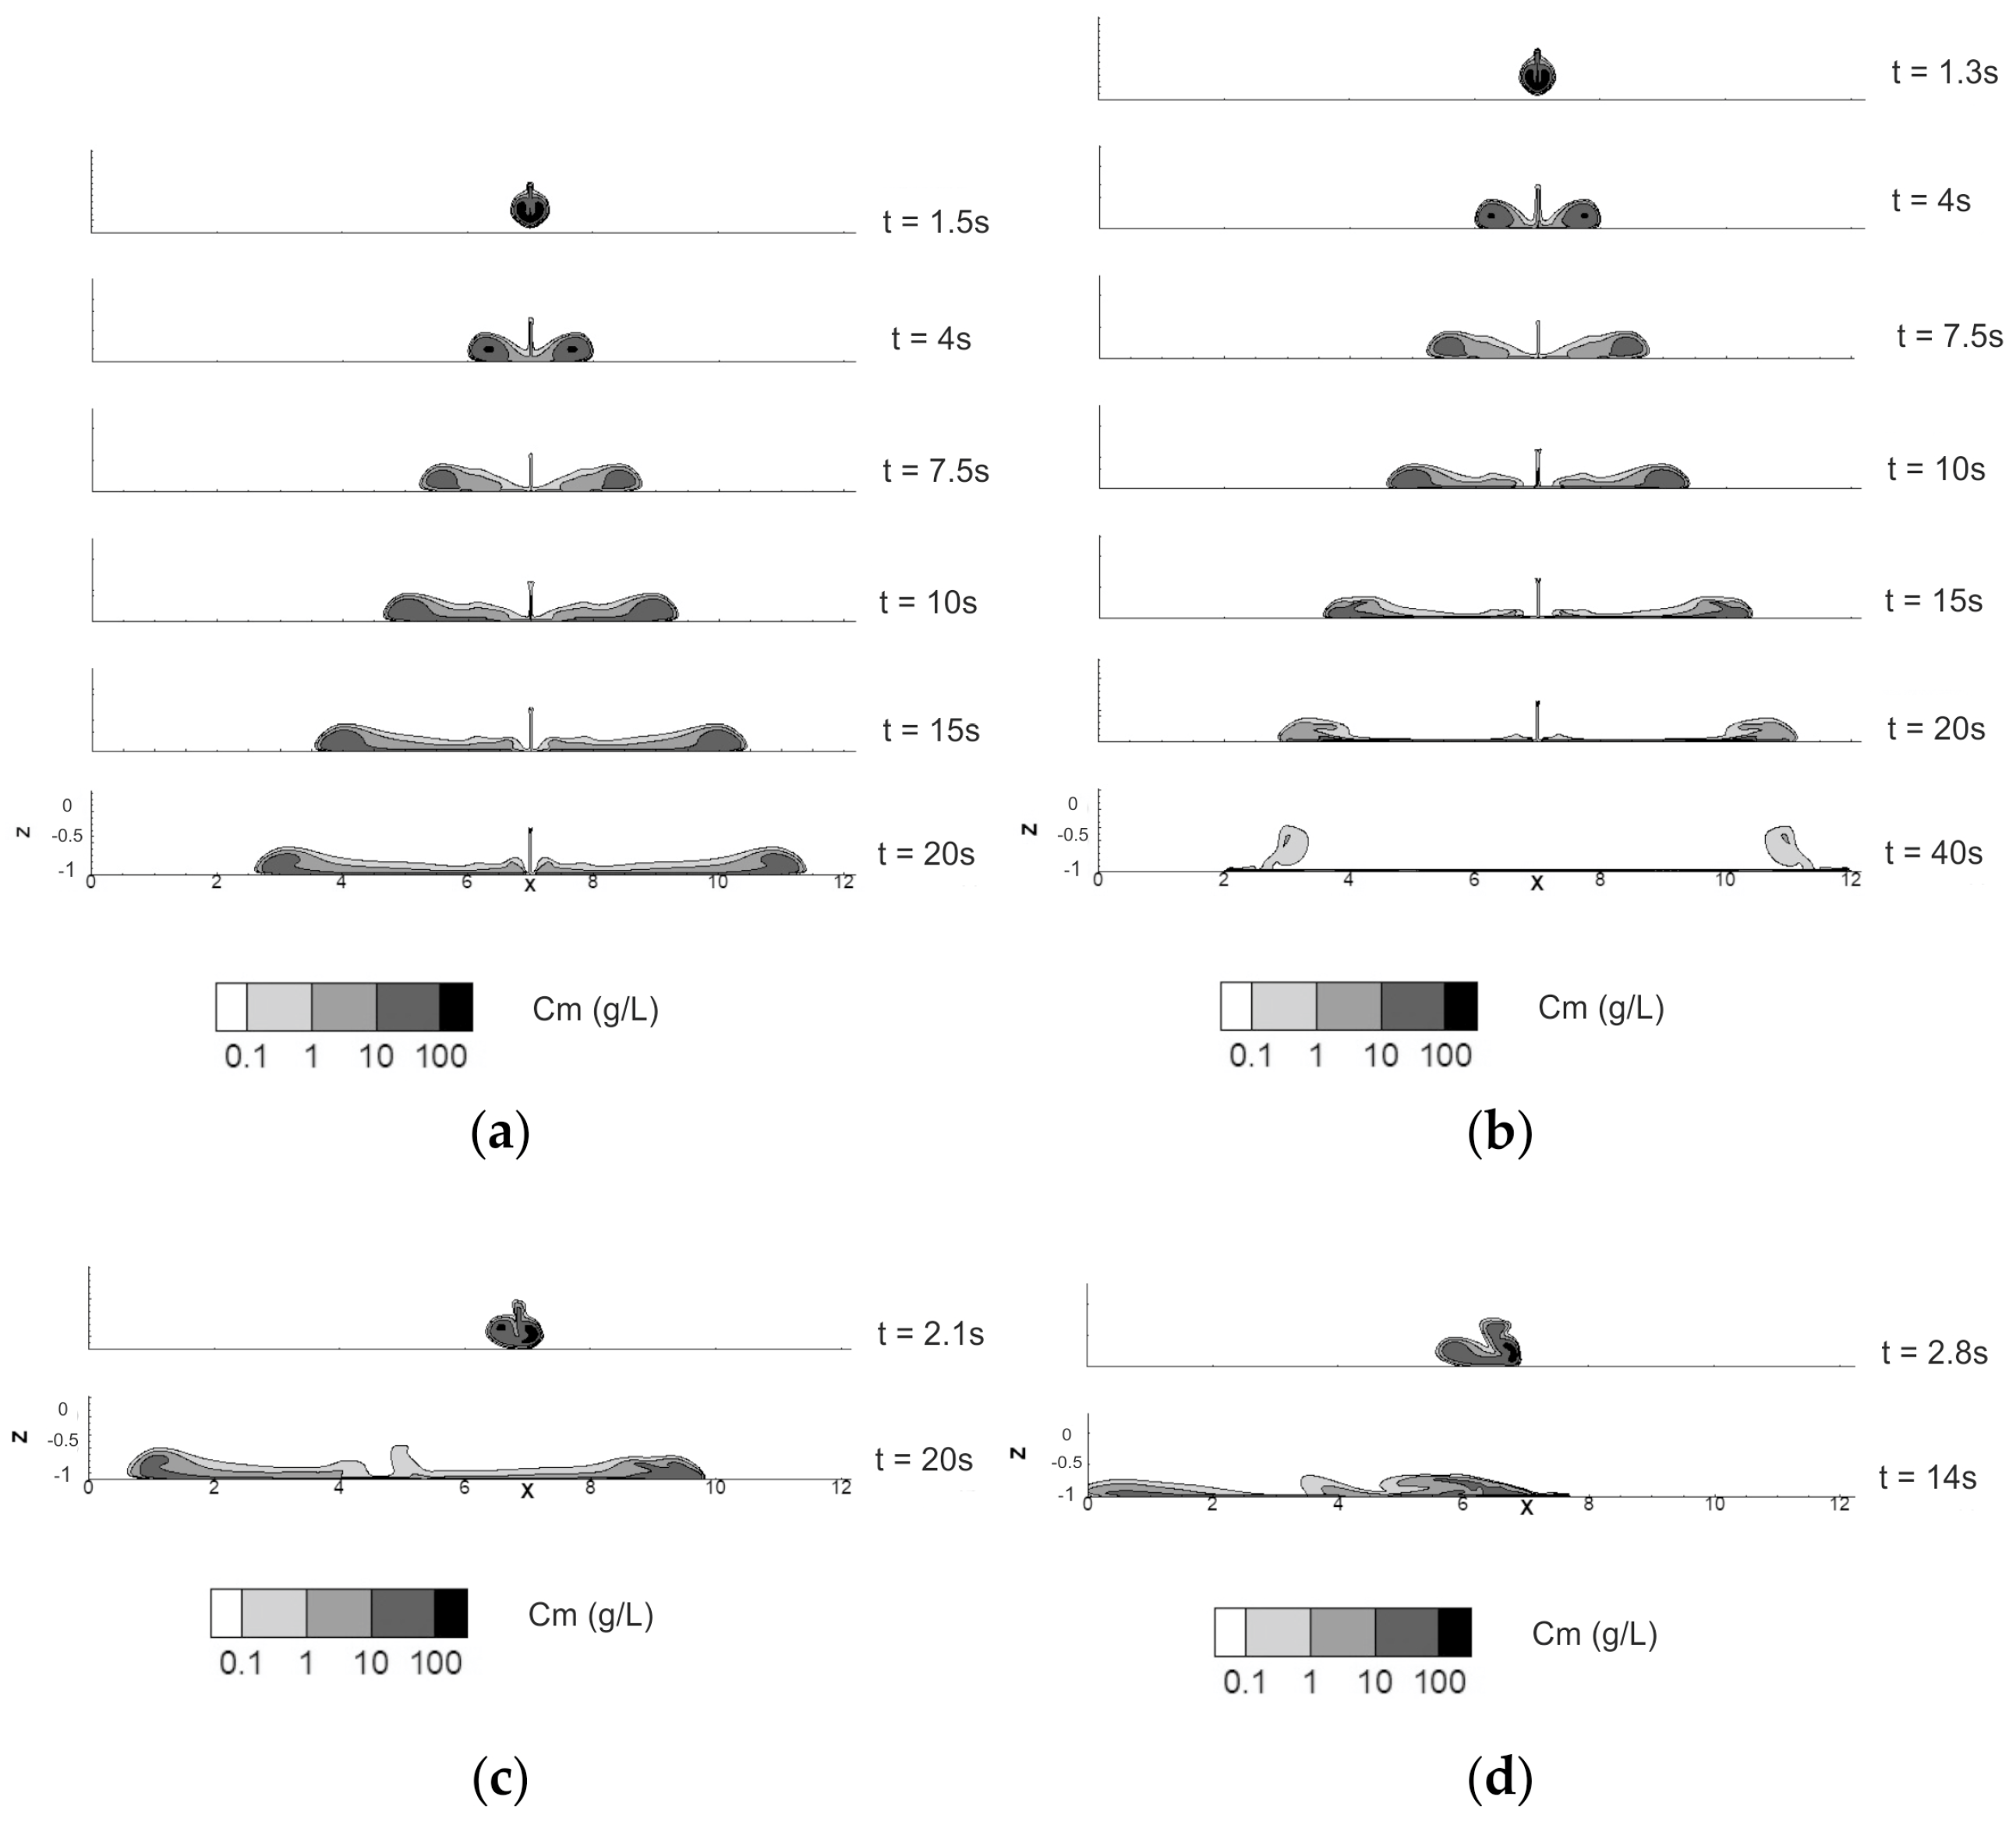
Other simulations were performed in the case of release with a lateral ambient current in the channel for a given type of sand. As noticed by Nguyen et al. [4], these numerical results are in correct agreement with the experimental data. Indeed, as observed in Figure 2, for Dp1 and Dp2, three steps are observed during a sediment release: the convective descent of the sediment cloud, the sediment cloud impact on the bottom, and the propagation of density currents up- and downstream until the equilibrium under the ambient current influence. For results obtained within an ambient current, only cases simulated for the sediment particle diameter of 90 µm and the ambient current going from 10 to 25 [cm/s] (Dp1-Uc10, Dp1-Uc15, Dp1-Uc20 and Dp1-Uc25) will be studied.

2.2. Proper Orthogonal Decomposition

2.2.1. Theoretical Aspects

POD is a powerful technique as it allows the identification of the energetic dominant spatial and temporal modes present in the flow. In this work, we will consider a set of M scalar or vectorial realizations represented by u x , t i , i = 1,…, M; t i represents the parameter time and x the position. POD extracts the orthonormal basis Φ k x   of scalar or vectorial eigenfunctions, which maximizes the projection of the functions u x , t i   in a mean square sense.
Thus, to solve the POD problem it is necessary to define the average correlation function based on the inner product (.,.) and <.>, the ensemble average. ‖.‖ is the norm, as follows:
R x , y = u x , t i u * y , t i
To obtain the solutions of the following eigenvalue ( λ ) problem, the following Equation (7) is used:
D R x , y Φ y d y = λ Φ x
To identify Φ k x   is equivalent to solving an optimization problem, i.e., the following Equation (8):
m a x u , Φ 2 Φ 2
Every field realization can be written as the basis of the flow, as in the following Equation (9):
u x , t i = k = 1 a k t i Φ k x
where a k are the temporal orthogonal coefficients obtained from the projection of u x , t i   onto the Φ k x POD basis, as in the following Equation (10):
a k t i = u x , t i , Φ k x ,   i = 1 ,   ,   M
Due to the optimality of convergence in the energy of the POD basis, the realization can be projected onto the Φ k x   POD basis and can be reconstructed as following from a small number (kmax) of spatio-temporal modes, as in the following Equation (11):
u ~ x , t i = k = 1 k m a x a k t i Φ k x ,         i = 1 ,   , M
An important property of the proper orthogonal decomposition is that temporal coefficients and eigenfunctions are uncorrelated in time and space. Thus, it is important to check that the following Equation (12) is correct:
Φ k t x Φ j x = δ j k
a k t t . a j t = λ j δ j k
where δ j k represents the Kronecker delta function.
More information about the basis of the POD properties is available in Holmes et al. [6].
According to the characteristics of the data decomposed by POD, the ensemble average differs, and it can be a spatial or a temporal one. The first one is used for data within a long-term history and moderate spatial resolution. For numerical simulation cases, as in this work, the snapshot POD approach applies an ensemble average over the number of the realizations because it is efficient when the data have a high spatial resolution but a moderate-term history. For more information on the computational implementation of the snapshot POD, see Cizmas et al. [7].
In this paper, the focus is on solid volume fraction and solid phase velocity fields obtained from the numerical experiments (c.f. Section 2.1.1). In practice, one must first compute the time average u ¯ x = 1 M i = 1 M u x , t i in order to construct a new velocity field with a zero average.
α ¯ x [-] is the mean field obtained from α x , t i , the solid volume fraction fields snapshot collection, and u ¯ x   [m/s] is the mean field obtained from u x , t j , the solid phase velocity fields snapshot collection selected to be decomposed. In this work, POD decomposition has been applied onto the difference between the mean fields. In the first case, a discrete version of the POD, POD1C, will be applied onto the solid volume fraction fields snapshot collection, with α x , t i = α x , t i α ¯ x . In the second case, two component vectorial POD2C will be applied onto fluctuating solid phase velocity fields u x , t j = u x , t j u ¯ x   , and this leads to spatial eigenfunctions within two-component vectors. To represent these eigenfunctions, it is necessary to calculate a pseudo-vector field equal to the rotational of the two-component vectors field. The choice of the size M of the snapshots collection decomposed by POD technique (cf. Table 1) will be discussed in the following.
For POD decompositions, a small number of spatio-temporal modes are necessary to perform an optimal reconstruction of the realizations in the energy sense. Each eigenvalue corresponds to the information carried by each eigenmode; in other words, it corresponds to its energy contribution. The total POD energy captured in a decomposition of a data set is equal to the sum of all POD eigenvalues λ j . Thus, for POD1C and POD2C, we, respectively, obtain E α s [ ] and E u s ,   w s [m2/s2]. The average root mean square error percentage highlights the relative difference between an original set of realizations and a reconstructed one.

2.2.2. About the Size of the Snapshot Collection Decomposed by POD

POD decomposition can be applied to different collections of snapshots selected from the total snapshot sequence output from the numerical simulations. For Dp2, dt is 0.1 s and Ns = 400 (total time = 40 s). The size of the sequence decomposed, with dt = 0.1 s, has been selected equal to M = 40 (short collection with a total time of 4 s) and M = 400 (long collection). Considering dt = 0.2 s, new snapshot collections can be extracted from the initial one and, thus, M is, respectively, equal to 20 (4 s) and 200 (40 s).
Figure 3 shows the average root mean square error between the original simulation realizations and the reconstructed fields for a short duration time of 4 s (a) and a longer one of 40 s (b) (kmax is the number of POD spatio-temporal modes used in the reconstruction). In both cases, for a fixed total time sequence, no significant differences are observed in spite of the change in the sampling frequency. Both decompositions, based on α s and u s ,   w s , lead to a similar accuracy of reconstruction for a given kmax (cf. Figure 3). The average root mean square error obviously decreases with the increase in kmax. Note that it can be observed that, for a given kmax, the average root mean square error is lower for the POD decomposition based on u s ,   w s . These results verify that the good choice of the snapshot collection decomposed by POD is not strictly linked to the snapshot dt. The POD results presented in the following have been obtained from snapshot sequences computed with dt = 0.1 s, which seems to be sufficient to lead to suitable decomposition with a short or a long sequence of realizations. The parameters (M, dt) are defined according to the steps of the release phenomenon that will be studied.

3. POD Results for a Water–Sediment Mixture Release

In the following, a one-component scalar decomposition POD1C is applied to the fluctuating solid volume fraction fields and a two-component vectorial decomposition POD2C is applied to the fluctuating solid phase velocities fields. Reference cases Dp1 (for Dp = 90 µm) and Dp2 (for Dp = 160 µm), respectively, present water–sediment mixture release without ambient current configurations. POD decompositions are performed on different sized snapshot collections for case Dp1 (M = 15; 40; 75; 100; 150; 200, and a total sequence time going from 1.5 s to 20 s) and Dp2 (M = 13; 40; 75; 100; 150; 200; 250; 300; 350; 400, and a total sequence time going from 1.3 s to 40 s).
As previously noticed by Nguyen et al. [4], until a time of 20 s, the three steps of the release phenomenon are identified (cf. Figure 2) in the numerical results: the convective descent during which the sediment falls under the influence of gravity, the collapse occurring when the descending cloud or jet impacts the bottom dispersion, and the passive transport beginning with the sediment transport and its spreading.
Because of release are studied in a quiescent water, sediment transport is quickly stopped and, thus, sediment spreading occupation zone is limited in the domain. As noticed by Nguyen et al. [4], in both cases, the propagation is symmetric and linear for a short time, and the position of the front of the density current reaches nearly 4 m at a time equal to 20 s. As such, choosing M = 200 (20 s) as size of the snapshot collection (in Dp1 and Dp2 cases) to apply POD decomposition and to compare the results extracted seems suitable (for the release phenomenon going on until the sediment transport).
The convective descent of the sediment cloud is characterized by a falling time (Tf). Two different processes are involved in this phenomenon: on the one hand the density effect of the sediment–water mixture, like a saline water plume, and, in the other hand, the terminal settling velocity of individual particles. The time required for the plume to reach the bottom depends on both processes. Table 2 shows Tf obtained by Villaret [1] and Boutin [2], the results obtained in the present work, and by Farout-Fréson [28]. Note that Farout-Fréson [28] proposed a model based on the averaged form of the hydrodynamic biphasic equations, coupled to a sediment transport equation with a specific numerical settling velocity. This model was calibrated on the experimental campaigns of Villaret [1] and Boutin [2].
Note that, in an opposite way to the numerical results presented in here, the Villaret [1] and Boutin [2] experimental results were obtained without a control of the injection velocity profile. In the present work, in both cases, Dp1 and Dp2, convective descent of the sediment cloud is characterized by a falling time (Tf) of 1.5 s and 1.3 s (cf. Table 2) observed in the instantaneous field series. The experimental fall time was extracted from snapshots taken of the generated turbid plume with a synchronized camera. This implies an important uncertainty of 0.5 s. Thus, numerical results presented in this paper can be considered as satisfactory despite being superior to that of the upper limit observed for experimental results. It can be seen that the reduction in the falling time due to a greater Dp turns out to be slight.

3.1. POD of Snapshots Collections Describing Falling Time

For the first time, we focused our analysis on POD decompositions obtained for snapshot collection limited to the convective sediment cloud descent. Thus, M~Tf/0.1 was chosen as equal to 15 for Dp1 (which corresponds to time Tf = 1.5 s) and 13 for Dp2 (Tf = 1.3 s).
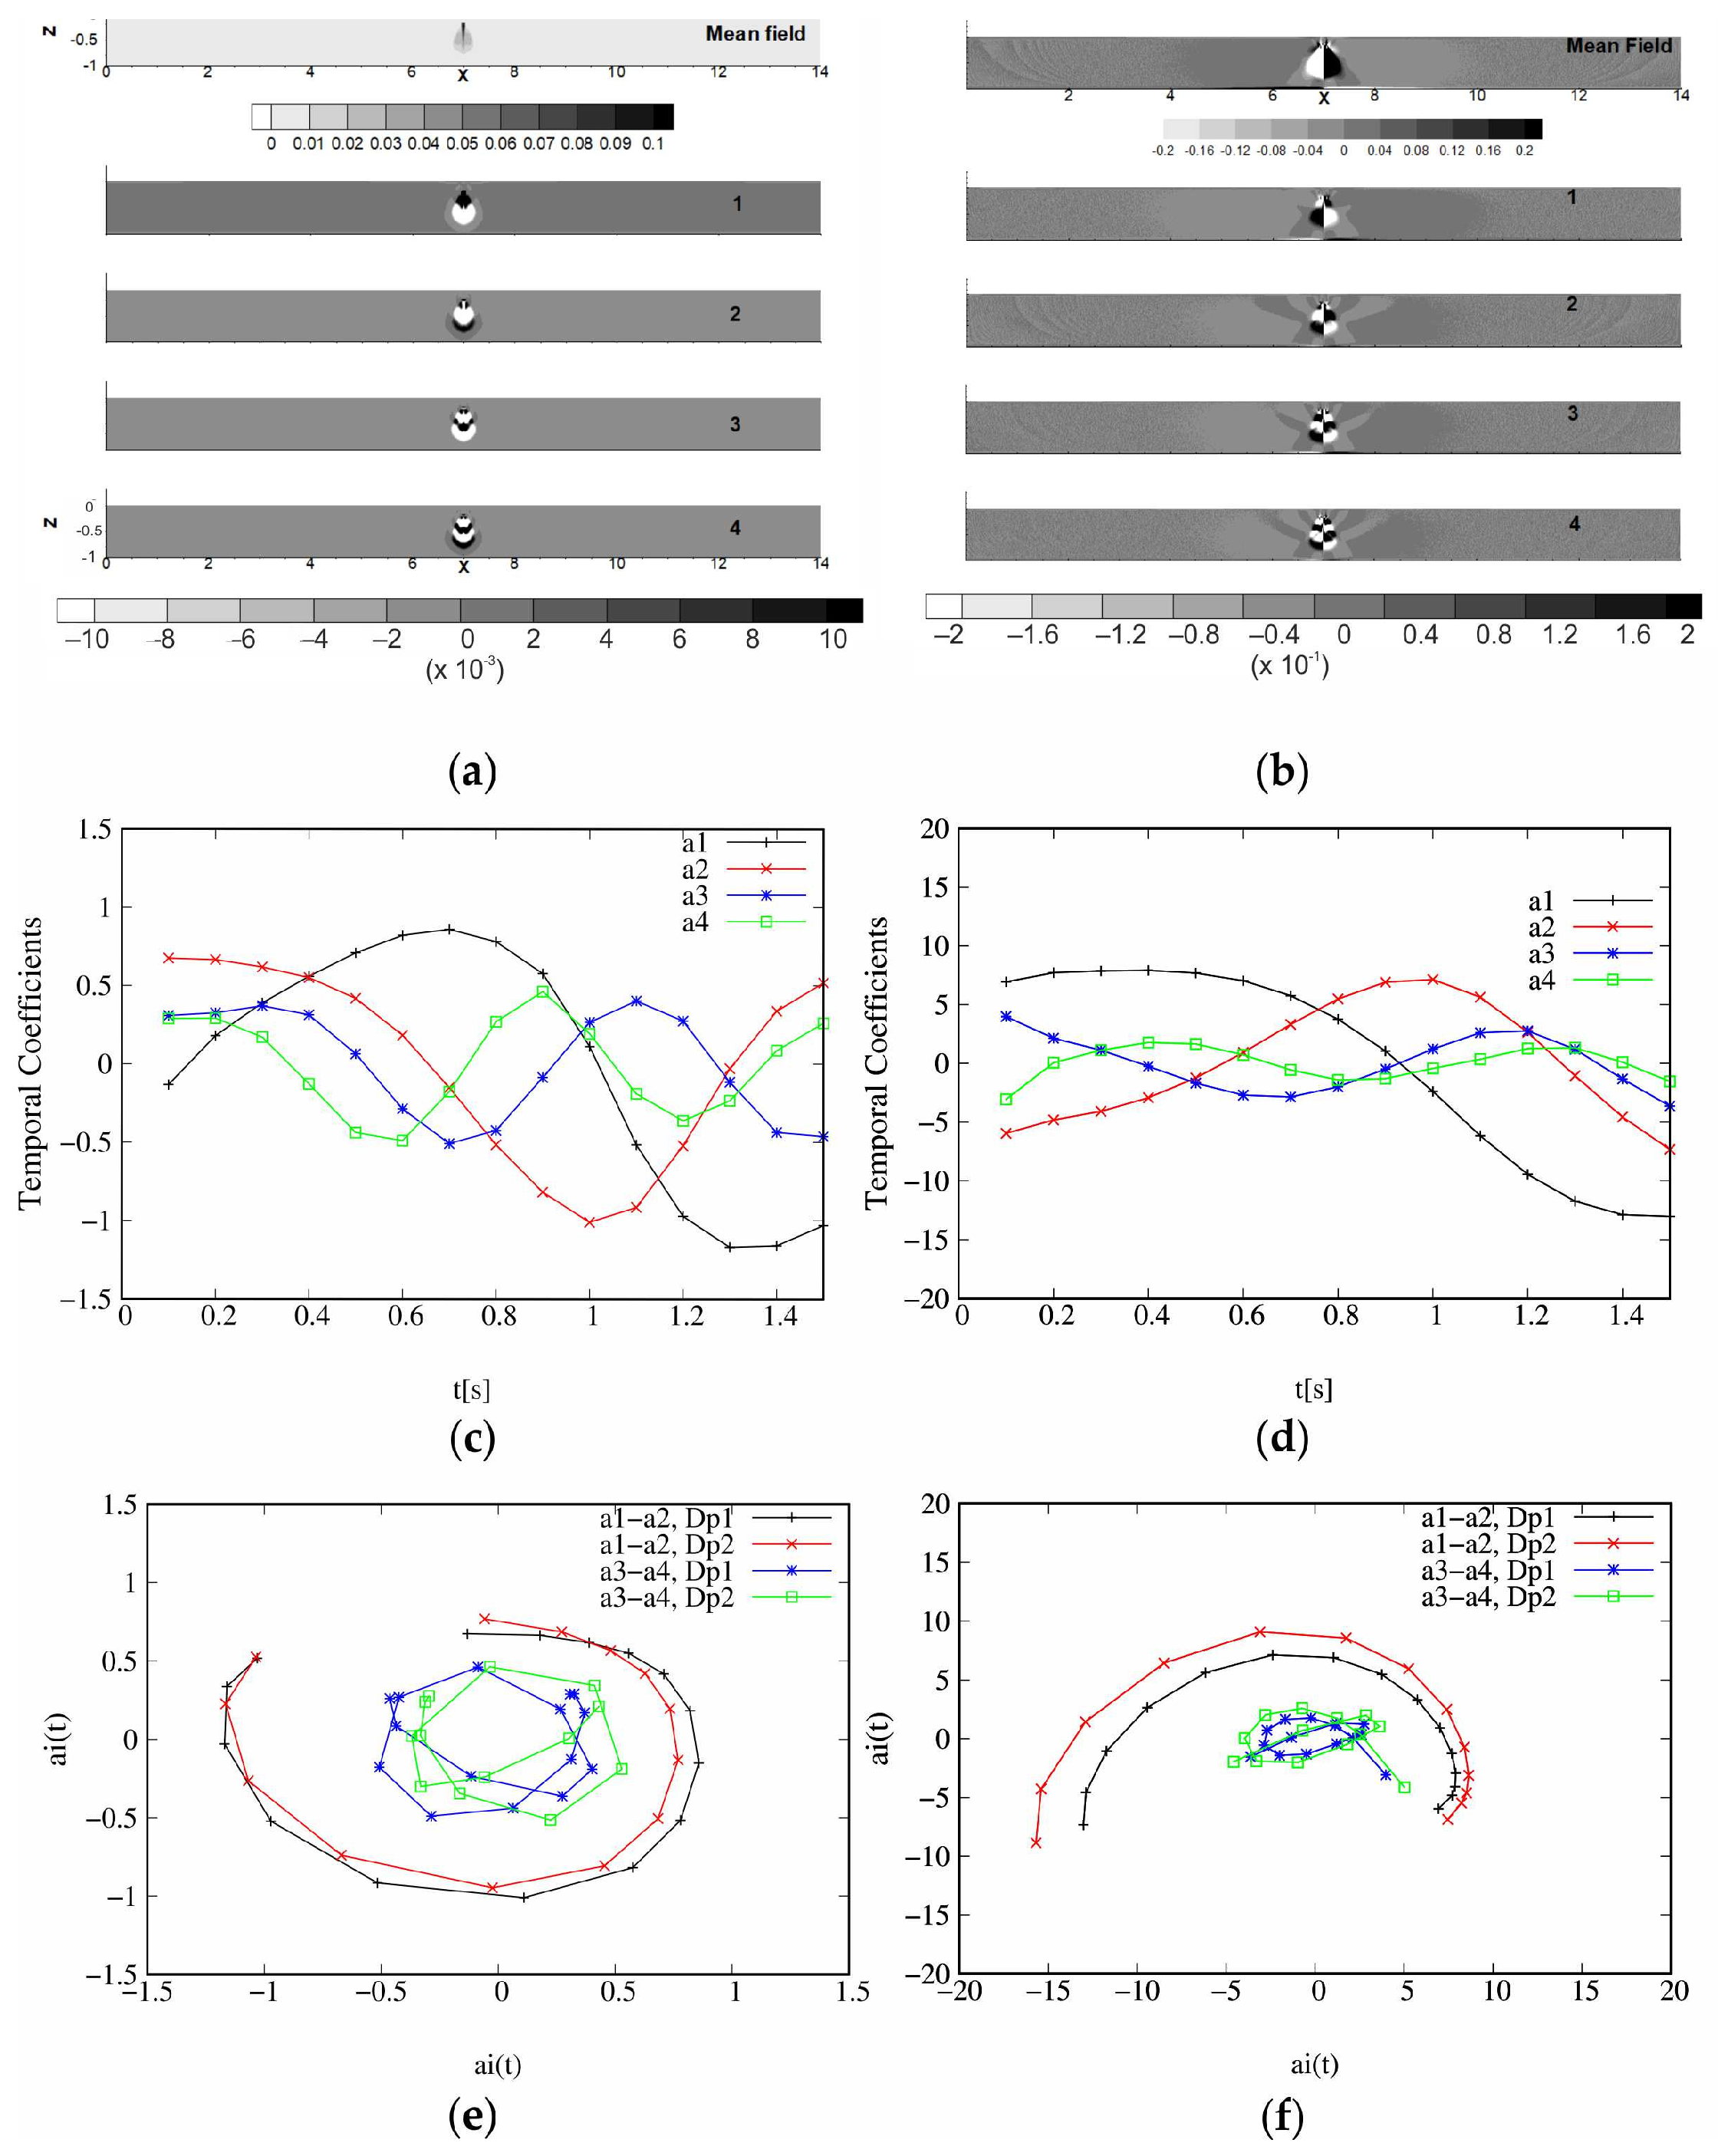
Figure 4a (i.e., Figure 4b) shows the mean solid volume fraction field (i.e., mean solid phase velocity field) for Dp1 and POD1C (i.e., for Dp1 and POD2C) and also the first spatial eigenfunctions extracted from the difference compared to the mean field, in other words the eigenfunctions linked to the most energetic eigenvalues.
The spatial dimensionless eigenfunctions extracted by POD2C (cf. Figure 4b) present strong and compact couples of counter-rotating structures or POD modes associated to the appearance and growing of symmetrical vortices during the falling of the water–sediment mixture. The number of the POD modes observed in an eigenfunction Φ k x   increases with the index k. Similarly, the eigenfunctions obtained from the POD1C decompositions exhibit aligned and piled POD modes (cf. Figure 4a). This arrangement is, obviously, strictly associated to the convective descent of sediment. The eigenfunctions extracted for the Dp2 case are not shown here. The spatio-temporal modes extracted from this snapshot collections have broadly similar characteristics to the Dp1 case. However, the increase in Dp, leading to the enhancement of the particles’ weight, implies the elongation in the form of the POD modes.
As observed in Figure 4c (i.e., Figure 4d), the four first a i t temporal coefficients extracted from the decomposition POD1C of the difference compared to the mean solid volume fraction α s (i.e., POD2C of the difference compared to the mean solid volume velocities u s , w s ) show oscillations. For a 3 t and a 4 t , the oscillations are twice as short as for a 1 t and a 2 t . The phase space projections a 1 t , a 2 t and a 3 t , a 4 t illustrate the correlation between the temporal coefficients of the most energetical eigenfunctions and their relative frequency (cf. Figure 4e,f) (the two first eigenvalues have an energy contribution greater than 20% and for the two next ones, the individual contribution is lower than 10%. The choice was, therefore, made to verify the phasing of the dynamics between eigenmodes whose energy contributions are of the same order). The harmonious shape of curves indicates a strong correlation between the two temporal coefficients shown in the projection. For the POD1C applied to a snapshot collection corresponding to the falling time, a 1 t , a 2 t has a circular shape, while a 3 t , a 4 t seems to have a temporal pattern close to Tf/2.
Note that in the POD2C case, the characteristic time of the phase space projections a 1 t , a 2 t seem to be a slightly longer that in the POD1C case. It can be inferred that the dynamics of the phenomenon have a small difference for the solid volume fraction and the solid volume velocities behaviors.
Moreover, these phase space projections reveal a similar phasing during the falling time, despite the modification of the sediment particle diameter. In other words, the dynamics of the most energetics eigenfunctions extracted from the difference compared to the mean solid volume fraction and the difference compared to the mean solid volume velocities stay unchanged.
From the energetic point of view, it can be observed that (cf. Table 3), as expected, the total kinetic energy values E u s ,   w s   and E u s ,   w s   are mainly accumulated in the first eigenvalue. The contribution λ 1 / E u s ,   w s is close to ~65%, and λ 1 / E α s   is close of ~42% for both POD1C and POD2C.
Moreover, note that only three modes are necessary to reach more than 95% of the kinetic energy E u s ,   w s   and contain the dynamics of the difference compared to the mean solid volume fraction flow. The behaviour of the difference compared to the mean solid volume fraction seems to be more complex; indeed, more spatio-temporal modes are necessary to contain the same percentage of E α s   equal to 80%.
Dp has an impact on the amount of total energy extracted (cf. Table 3). On the one hand (POD1C), the Dp impact on the dynamics of the volume fraction is slight (a reduction of 7%), and on the other hand (POD2C), its impact on the velocity field reaches 30% of augmentation. Moreover, note that the distribution of the contributions of the first four values remains, with very slight differences, the same for the two particle diameters. This confirms that the dynamics of these phenomena are weakly impacted by the modification of the diameter of the particles. Thus, the particle size and its weight seem to have a modest impact on the solid volume fraction distributions during the sediment descent stage; however, this impact is most marked on the level of agitation of the solid phase velocities.

3.2. POD for Snapshot Collection Describing All the Release Phenomenon

In the following, we will focus our analysis on decompositions obtained for snapshot collections with a size M growing from 15 (13) for the case Dp1 (Dp2) until 200, with dt = 0.1 s; in other words, from a short duration of 1.5 s (1.3 s) to a duration of 20 s, describing the three steps of the release phenomenon. For Dp2, complementary decompositions have been made for values of M until from M = 400 (a duration of 40 s). Figure 5 shows the evolution of the total energy (E) captured by POD decompositions according to the number of snapshots M decomposed for α s and for u s , w s for Dp1 and Dp2.
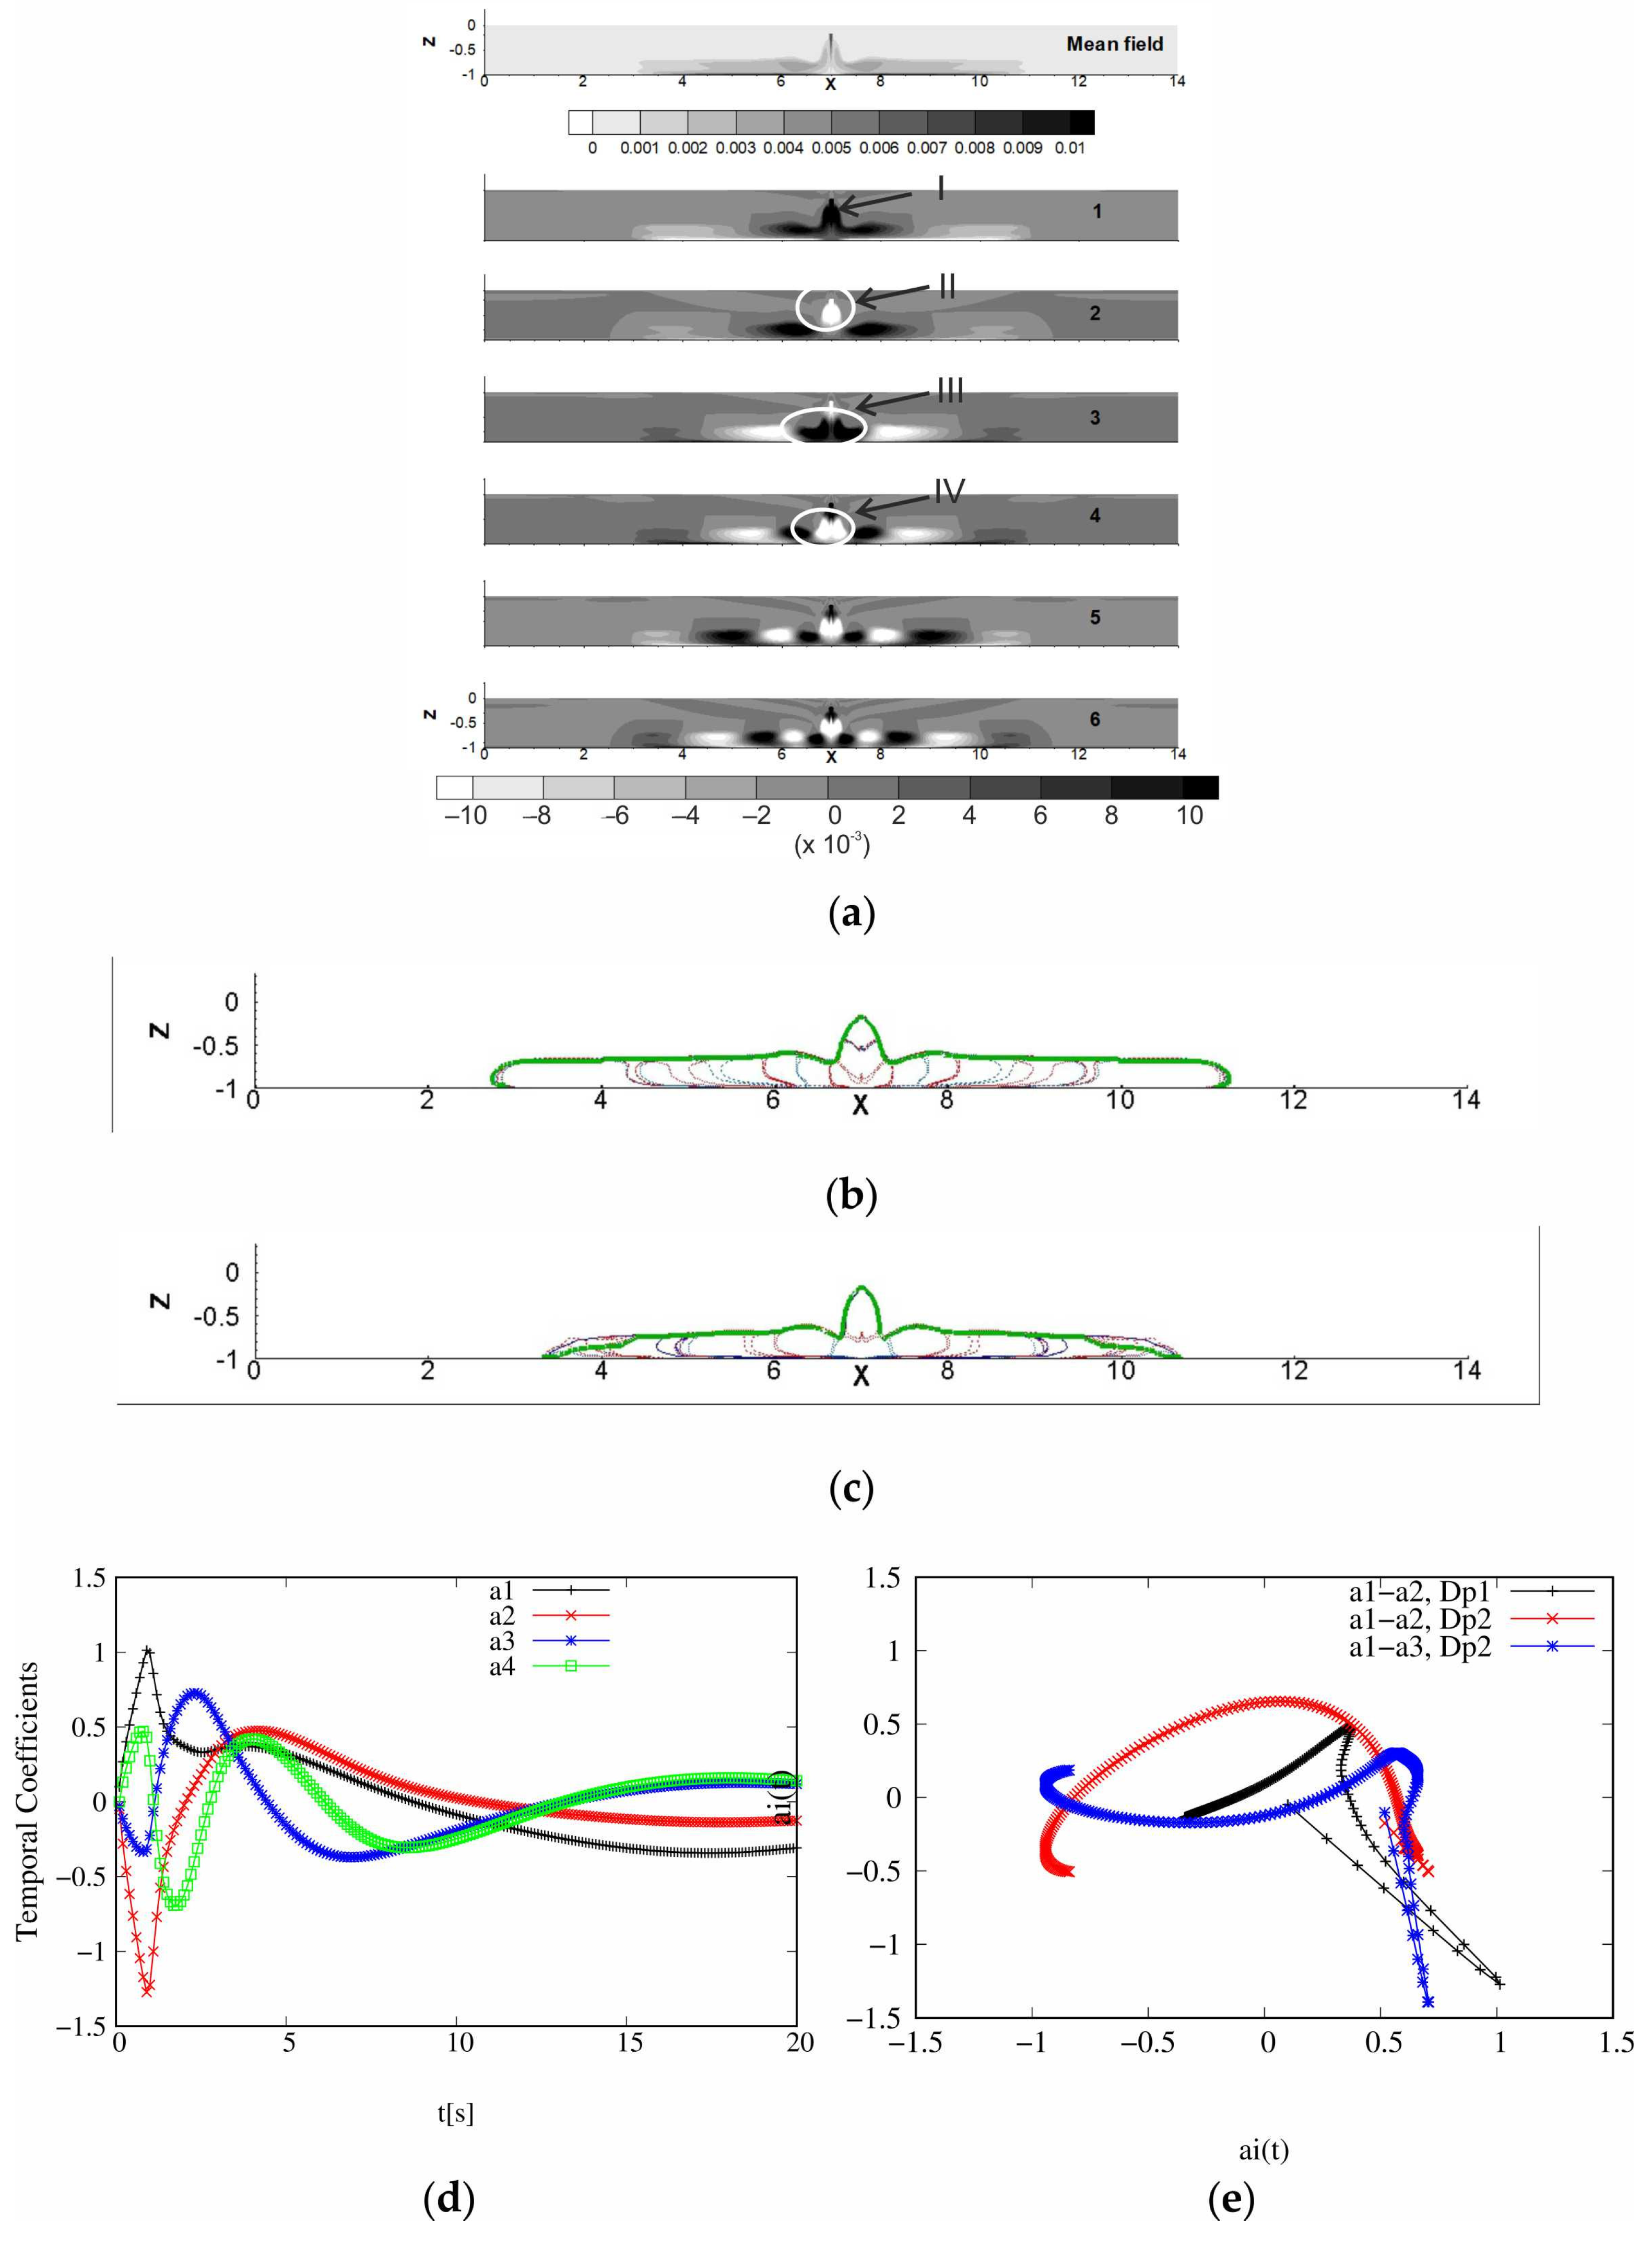
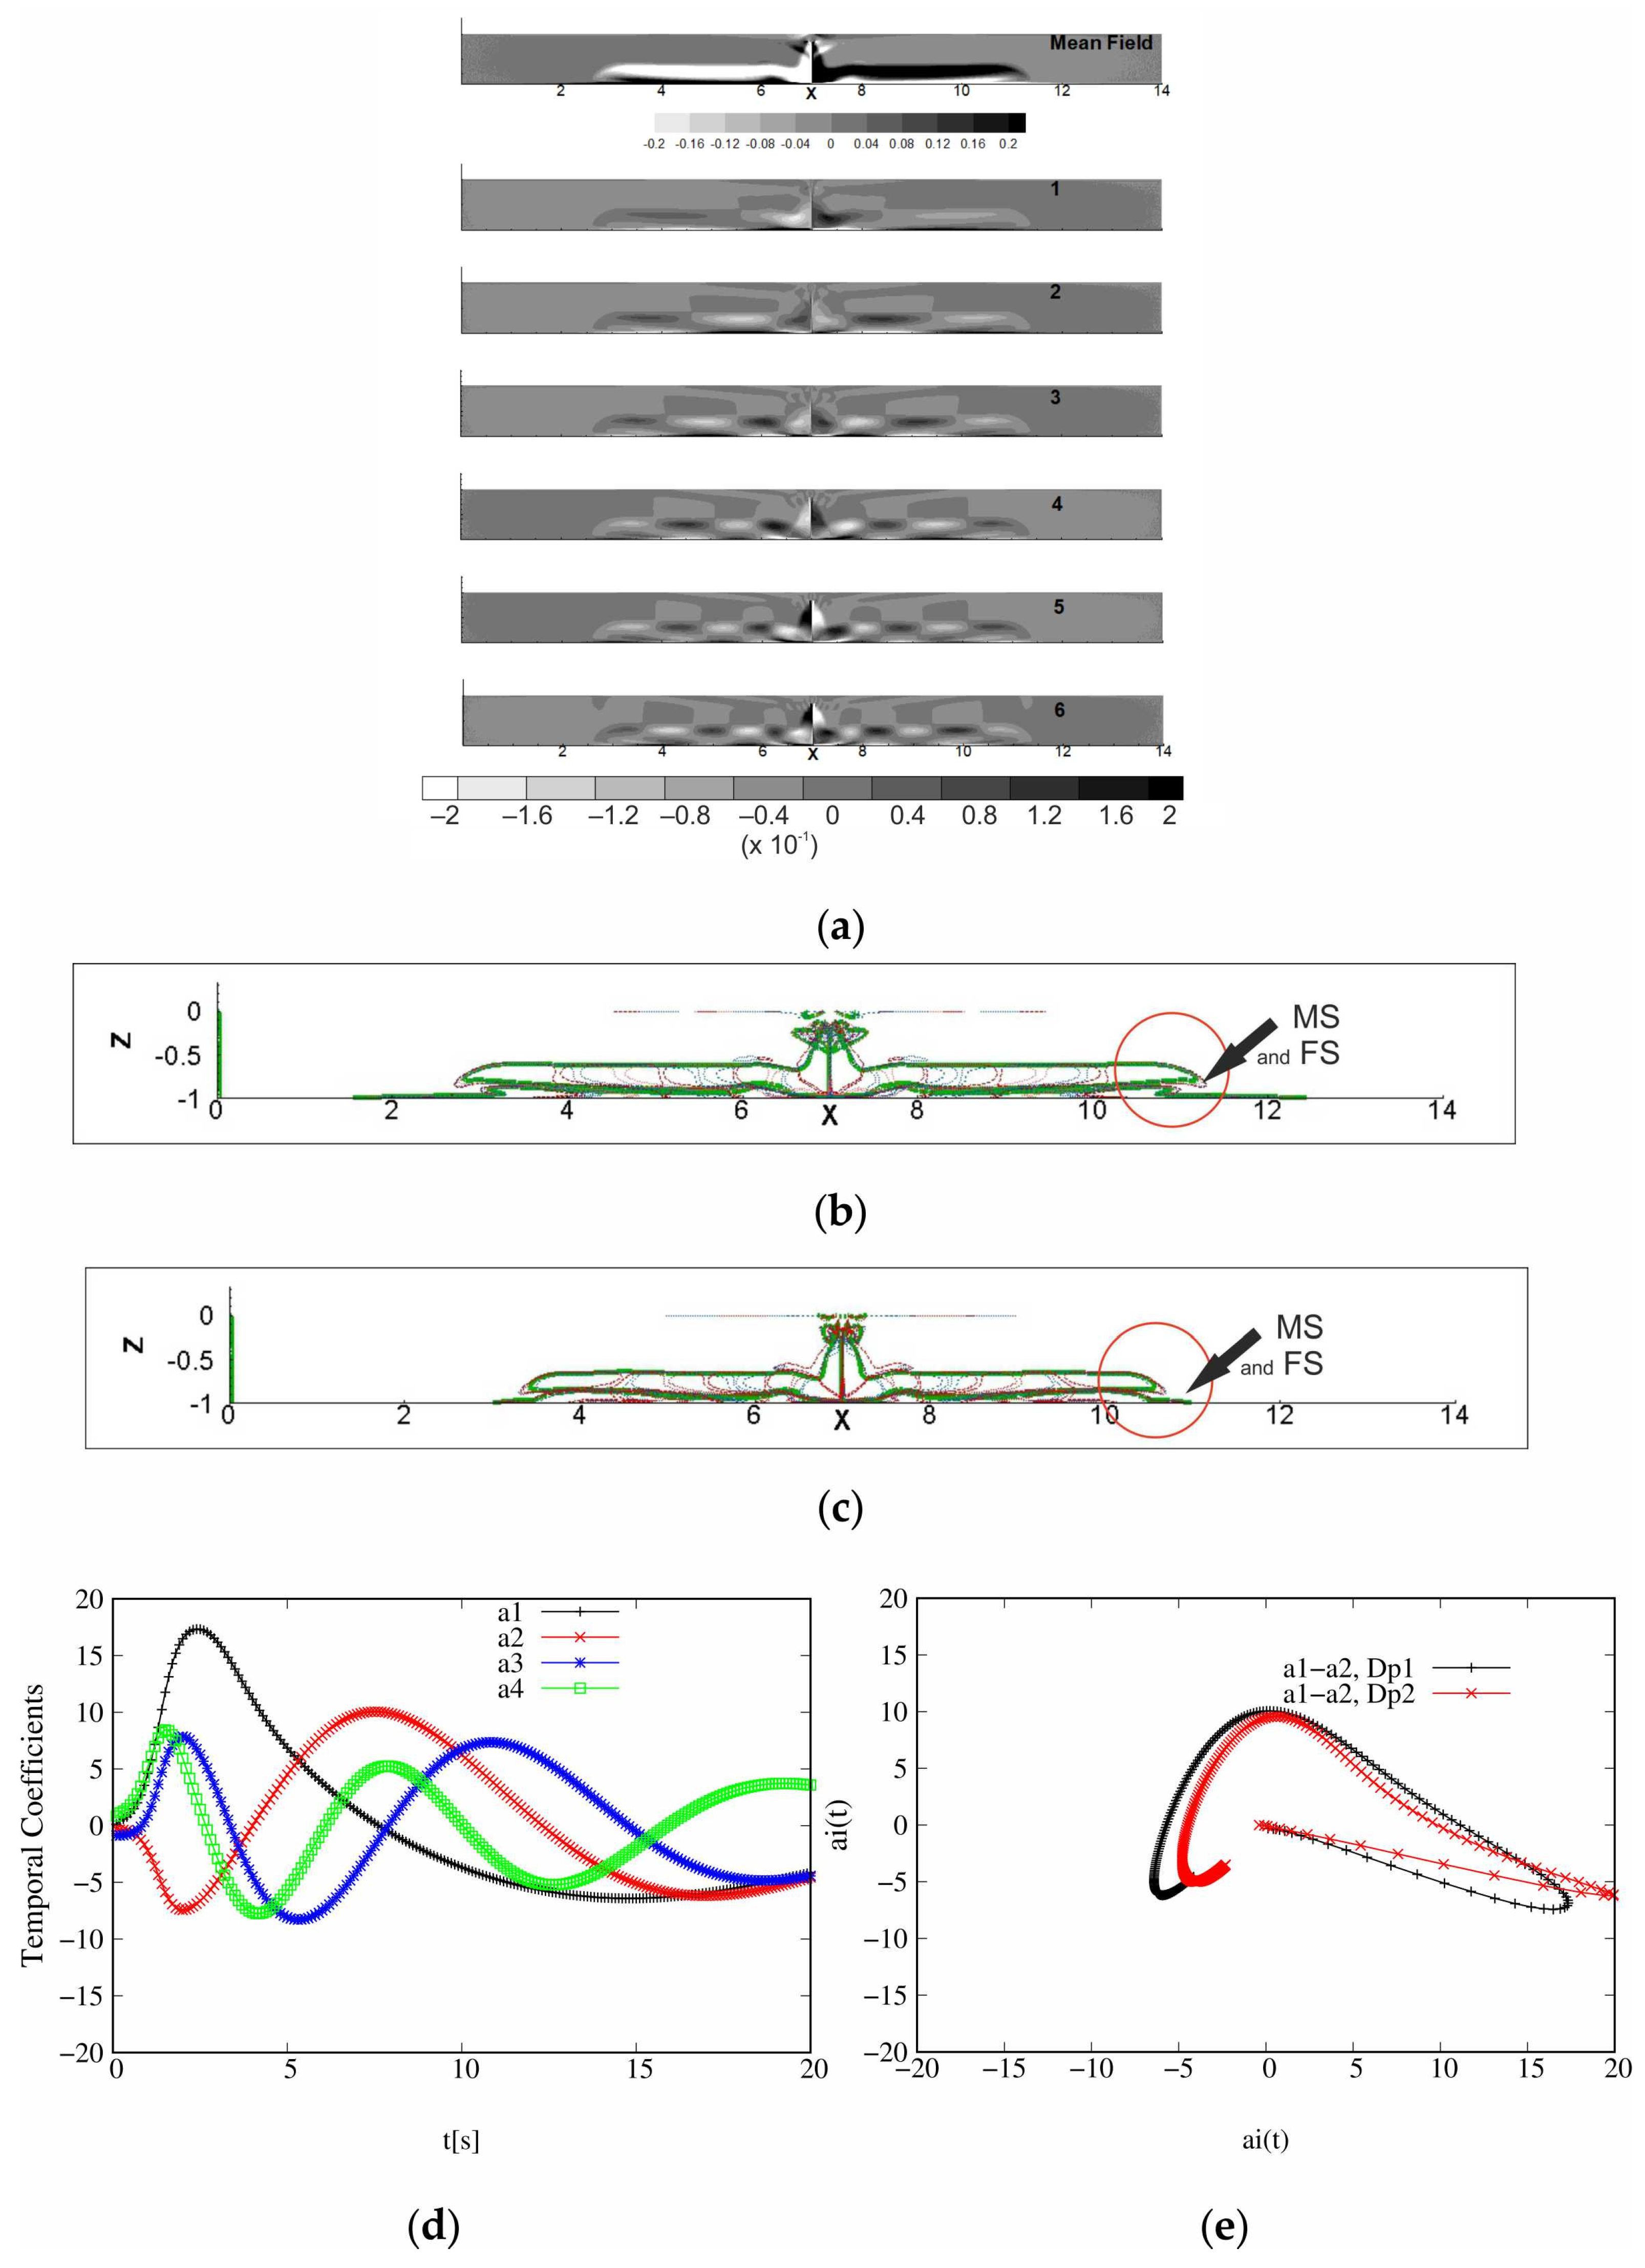
The energetic aspect has been completed by information dealing with the spatial dimensionless eigenfunctions extracted by POD1C and POD2C applied on snapshot collections obtained for Dp1 and M = 200 and a duration of 20 s (cf. Figure 6 and Figure 7 for Dp1).
The contribution of the three most energetic eigenvalues to the total energies E α s and E u s , w s are presented in the Table 4. Note that, with the increase in the particle diameter, ( λ 1 + λ 2 + λ 3 ) / E u s , w s stays close to ~62%, while ( λ 1 + λ 2 + λ 3 ) / E α s   passes from 43 % (for Dp1) to 63% (for Dp2). Thus, the particle’s size and its weight seem to have an impact on the complexity of the behavior compared to the mean solid volume fraction.
In the same way as seen in the previous paragraph, for decompositions limited to the falling time snapshot collections, a small number of spatio-temporal modes is enough to extract 95% of the total energy. In the case relative to the solid volume fraction velocities, there were 10 modes (compared to the 200 modes extracted) in the POD2C decomposition based on the parameter u s , w s and 15–18 in the POD1C decomposition based on α s . It is clear that, for this specific set-up, it would be possible to obtain a reduced-order model covering the different steps of the sediment release.
For POD2C applied to u s , w s and the Dp1 case, the total kinetic energy contained by the two initial counter-rotating vortices increases until a maximum value of 198 reached M = 100, corresponding to a total collection time of ~10 s (cf. Figure 5b). This growth observed during (and just beyond) beyond the falling time implies an enhancement in the level of agitation of the solid phase velocities linked to the sediment descent. For snapshot collections with a size M > 100, E u s , w s slowly decreases with M values, to reach 180 at 20 s. This implies that the level of agitation of the flow during the entire event, and more particularly during the formation of a turbidity current, become weaker. It is be reasonable to associate it with the mixing and dilution of the sediment. Thus, it is not surprising to observe (cf. Figure 5a) for POD1C applied to α s that the energy curve decreases for Dp1 from 1.19 to 0.86 (for a duration of 10 s) and 0.63 (for 20 s).
What is the impact of Dp on the evolution of E u s , w s according to the size (M) of the decomposed snapshot collection? Additional decompositions resulted in Dp2 and M growing up to 400. Note that for M > 200 the snapshot collections contain a lot of data relative to the turbidity current step. The slight decrease observed for Dp1 is most drastic and earliest for the largest particle diameter case Dp2: in this case E u s , w s   decreases from 198 (for a duration of 5 s) to 133 (for 20 s) and 86 (for 40 s). It seems that, as observed for the vertical descent phase of the release, the marked influence of the particle size and weight is also present during the passive transport of the sediment leading to a resistance opposed to the motion of the solid phase. In an opposite way, for the E α s   curves (cf. Figure 6a) the trend observed for Dp1 and Dp2 becomes different at around M = 100. Indeed, while E α s   continues to decrease for Dp1, for the largest particle diameter case Dp2 we observe an augmentation until ~1.1 for 20 s, and then a stabilization until 40 s. This trend is observed for POD2C applied to inlet snapshot collections including the third step of the release phenomenon, characterized by a long and complete collapse of sediment, concentrated at the bottom (cf. Figure 2b). Indeed, as observed by Nguyen et al. [5], the radius of the particle bed grows and reaches nearly 4 m for a total time of 20 s in both Dp cases. However, the collapsing of the sediment mixture differs until time t > 15 s.
Eigenfunctions extracted for the Dp1 case for POD2C applied on the difference compared to the mean solid volume velocities snapshots (cf. Figure 7a) reveal well-defined POD modes, which also support the existence of a low complexity of the dynamics. In the same way, the temporal coefficient reveals a marked temporal organization (cf. Figure 7d,e). The marked oscillations observed during the first seconds are smoothed after the falling time. The phase space projection a 1 t , a 2 t present a harmonious shape. For Dp1, the footprint of falling and collapse of the water–sediment mixture is present on the four most energetic POD2C eigenfunctions. They put to the fore strong counter-rotating structures associated to the appearance of the initial counter-rotating vortices due to sediment falling and water–sediment mixture collapse. All these eigenfunctions present POD modes stretched on the bottom. Indeed, the opposition of the quiet water to the motion implies their stretched shape. For k ≥ 3 other compact, counter-rotating, and symmetrical POD modes of Φ k x evolve parallel to the bottom, above the flat POD modes previously described. Their size decreases with the increasing index.
Eigenfunction sets extracted within POD1C also reveal well-defined compact and strong POD modes. Temporal coefficient also reveals a marked temporal organization (cf. Figure 6d,e) (as will be noticed in the following, for the snapshot collection describing all the release phenomenon, the contribution of the first eigenvalues is less marked than in the falling time snapshot collection case. The three, or even the first four, eigenvalues can have contributions of the same order. Also, drawing other curves a 1 t , a 3 t , a 1 t , a 4 t , a 12 t , a 3 t , … may be relevant. As can be observed (cf. Figure 6e), the phase space projection a 1 t , a 2 t for the two particle diameters studied in this work have different shapes. However, it can be observed that there is a similarity between a 1 t , a 2 t Dp1 and a 1 t , a 3 t Dp2.). Note that the oscillations fade faster to reach constant values, thus, the dynamics of the solid volume fraction seem to reach a stability ahead of the dynamics of the solid volume velocity. In the Dp1 case (cf. Figure 6a), the two most energetic eigenfunctions, namely Φ 1 x and Φ 2 x , show central POD modes (labelled I and II) strongly linked to the water–sediment mixture falling; they also present a symmetrical couple of modes dealing with the deposit of the water–sediment mixture after its collapse and the transport of the particle cloud. Φ 3 x seems to be also marked by collapse and the deposit of water–sediment mixture. POD modes labelled III and IV (cf. Figure 6a) are linked to the sediment collapse, while the other ones are linked to the density current. For Dp1, one layer of strong symmetrical POD modes on the bottom, linked to the progressive passive transport of density, appears for Φ k x with k ≥ 5 and k ≥ 6 for Dp2. In the case of Dp1, the POD modes have regular contours, while for Dp2 they seem to be weaker and less regular. For Dp2, the presence of a larger particle diameter Dp implies that the POD modes (I and II) linked to the deposit of the water–sediment mixture are also present in the third eigenfunction.
To define the outline for the solid volume fraction velocities, we identified the places where there is no motion of the solid volume during all the mixture release. Figure 7b,c show outlines superimposed on the four first eigenfunctions, respectively, for Dp1 and Dp2. The mean field presents two main counter-rotating and symmetrical structures (MS). The interaction with the surface leads to the appearance of flat structures (FS) along the bottom. The MS structure on the right turns in the clockwise sense (as observed in the mean solid volume fraction velocity field, cf. Figure 7a), inducing the mixing of the flow and, thus, a water–sediment mixture resuspension. The right flat structure (FS) turns in the anti-clockwise sense and induces the retention of the water–sediment mixture. All of the most energetic eigenfunctions present the two layers of POD modes previously identified. For Dp1, the main structures (MS) overcome and overtake the coherent creeping structures (FS) (cf. Figure 7b). As a result, the cloud outline does not show any crushing (cf. Figure 6b). Note that the particle cloud was identified as the place where the solid volume fraction becomes different to 0 during the mixture release. The cloud outline is the front of the particle cloud. In the opposite way, for Dp2, the lower layer extends almost as far as the upper one (cf. Figure 6c) and the density front of the particle cloud outlines a crushing in its extremity. Thus, it is not surprising to observe the external POD modes collapsing due to the resistance of the bottom to transport of sediments (more difficult density transport). This slump is due to the slowdown in the front density observed in the turbidity snapshots (cf. Figure 2b). Thus, the influence of the size and the weight of the particles due to a larger Dp induces to POD modes more marked by the settling of the water–sediment mixture after the sediment collapse.
To retrieve the settling information by the way of the POD1C, we associate the base parameter α s to the duration covered by the inlet snapshots collection, which needs to be sufficient to clearly observe the settling in the concentration field (cf. Figure 2). POD2C is associated with the two-dimensional base parameter u s , w s , and it presents the advantage of revealing the trends based on shorter snapshots collections than in the POD1C because the inlet data contains the settling velocity data.

3.3. Impact of the Ambient Current

In the following section, the impact of the ambient current on the water–sediment mixture release for Dp1 will be studied. POD1C and POD2C will be applied to determine the differences between the mean solid volume fraction fields and the mean solid phase velocities fields for cases within an ambient current going from Uc = 10 cm/s to Uc = 25 cm/s (Dp1-Uc10, Dp1-Uc15, Dp1-Uc20, Dp1-Uc25).
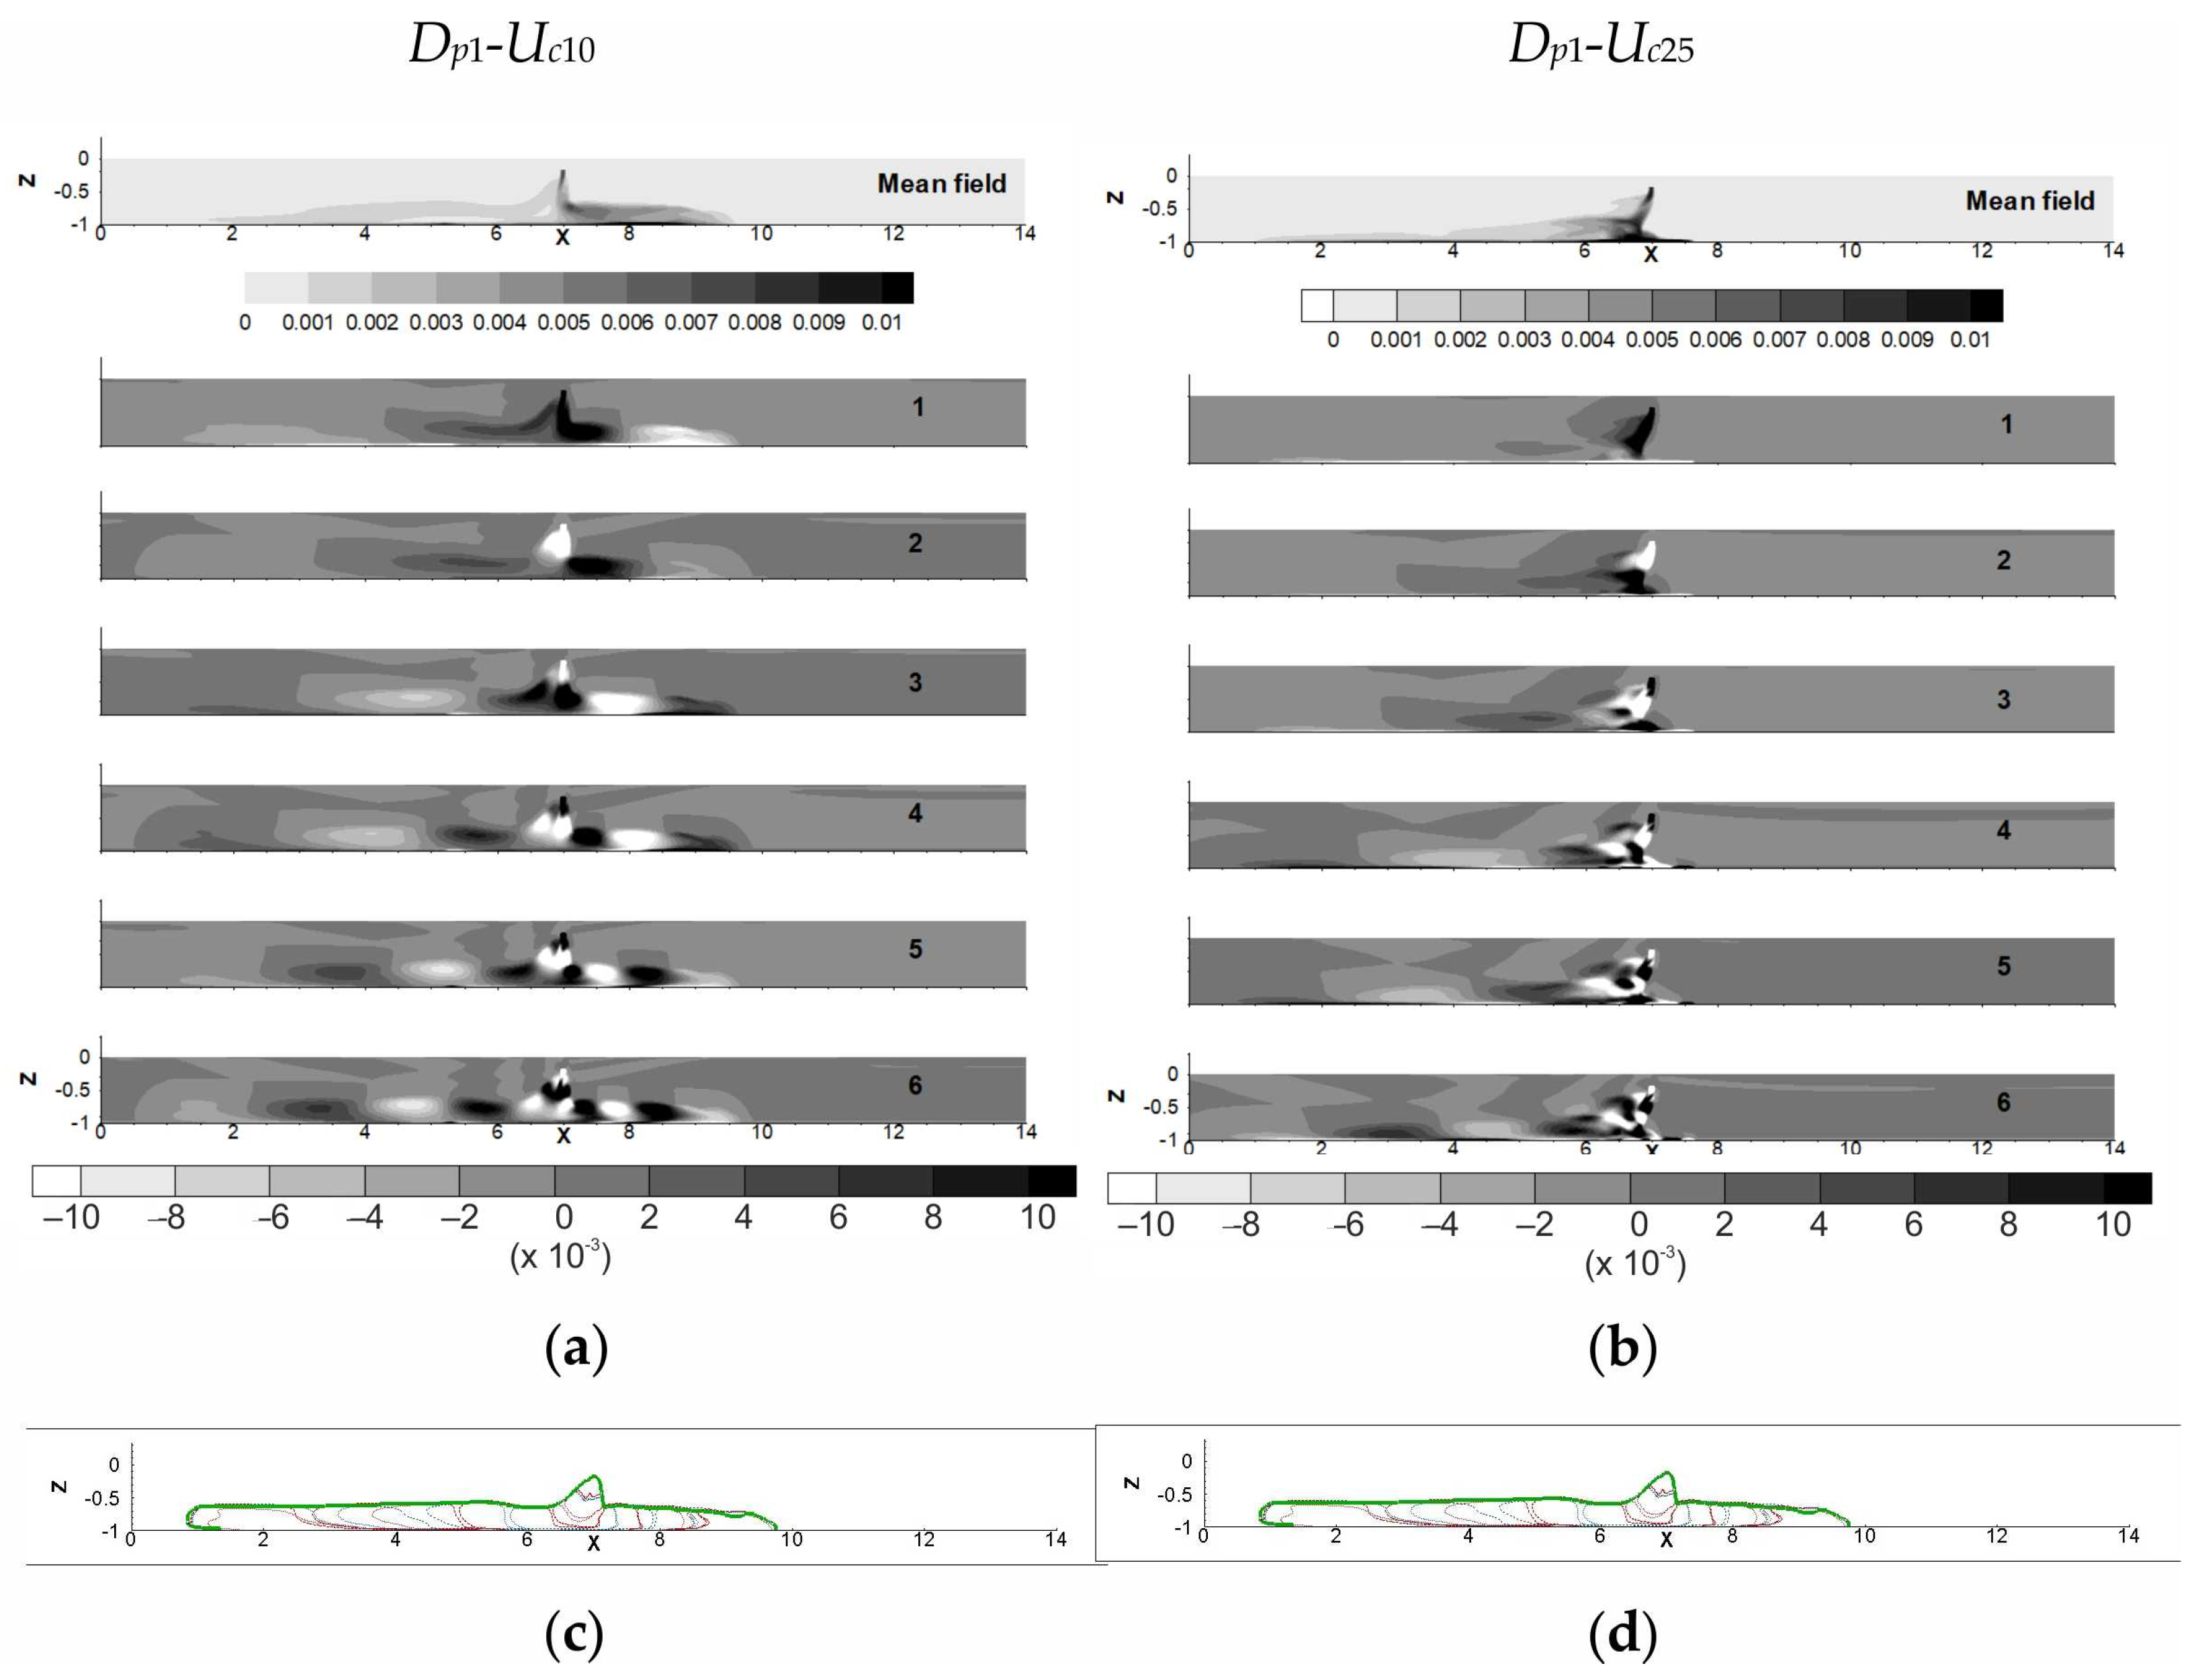
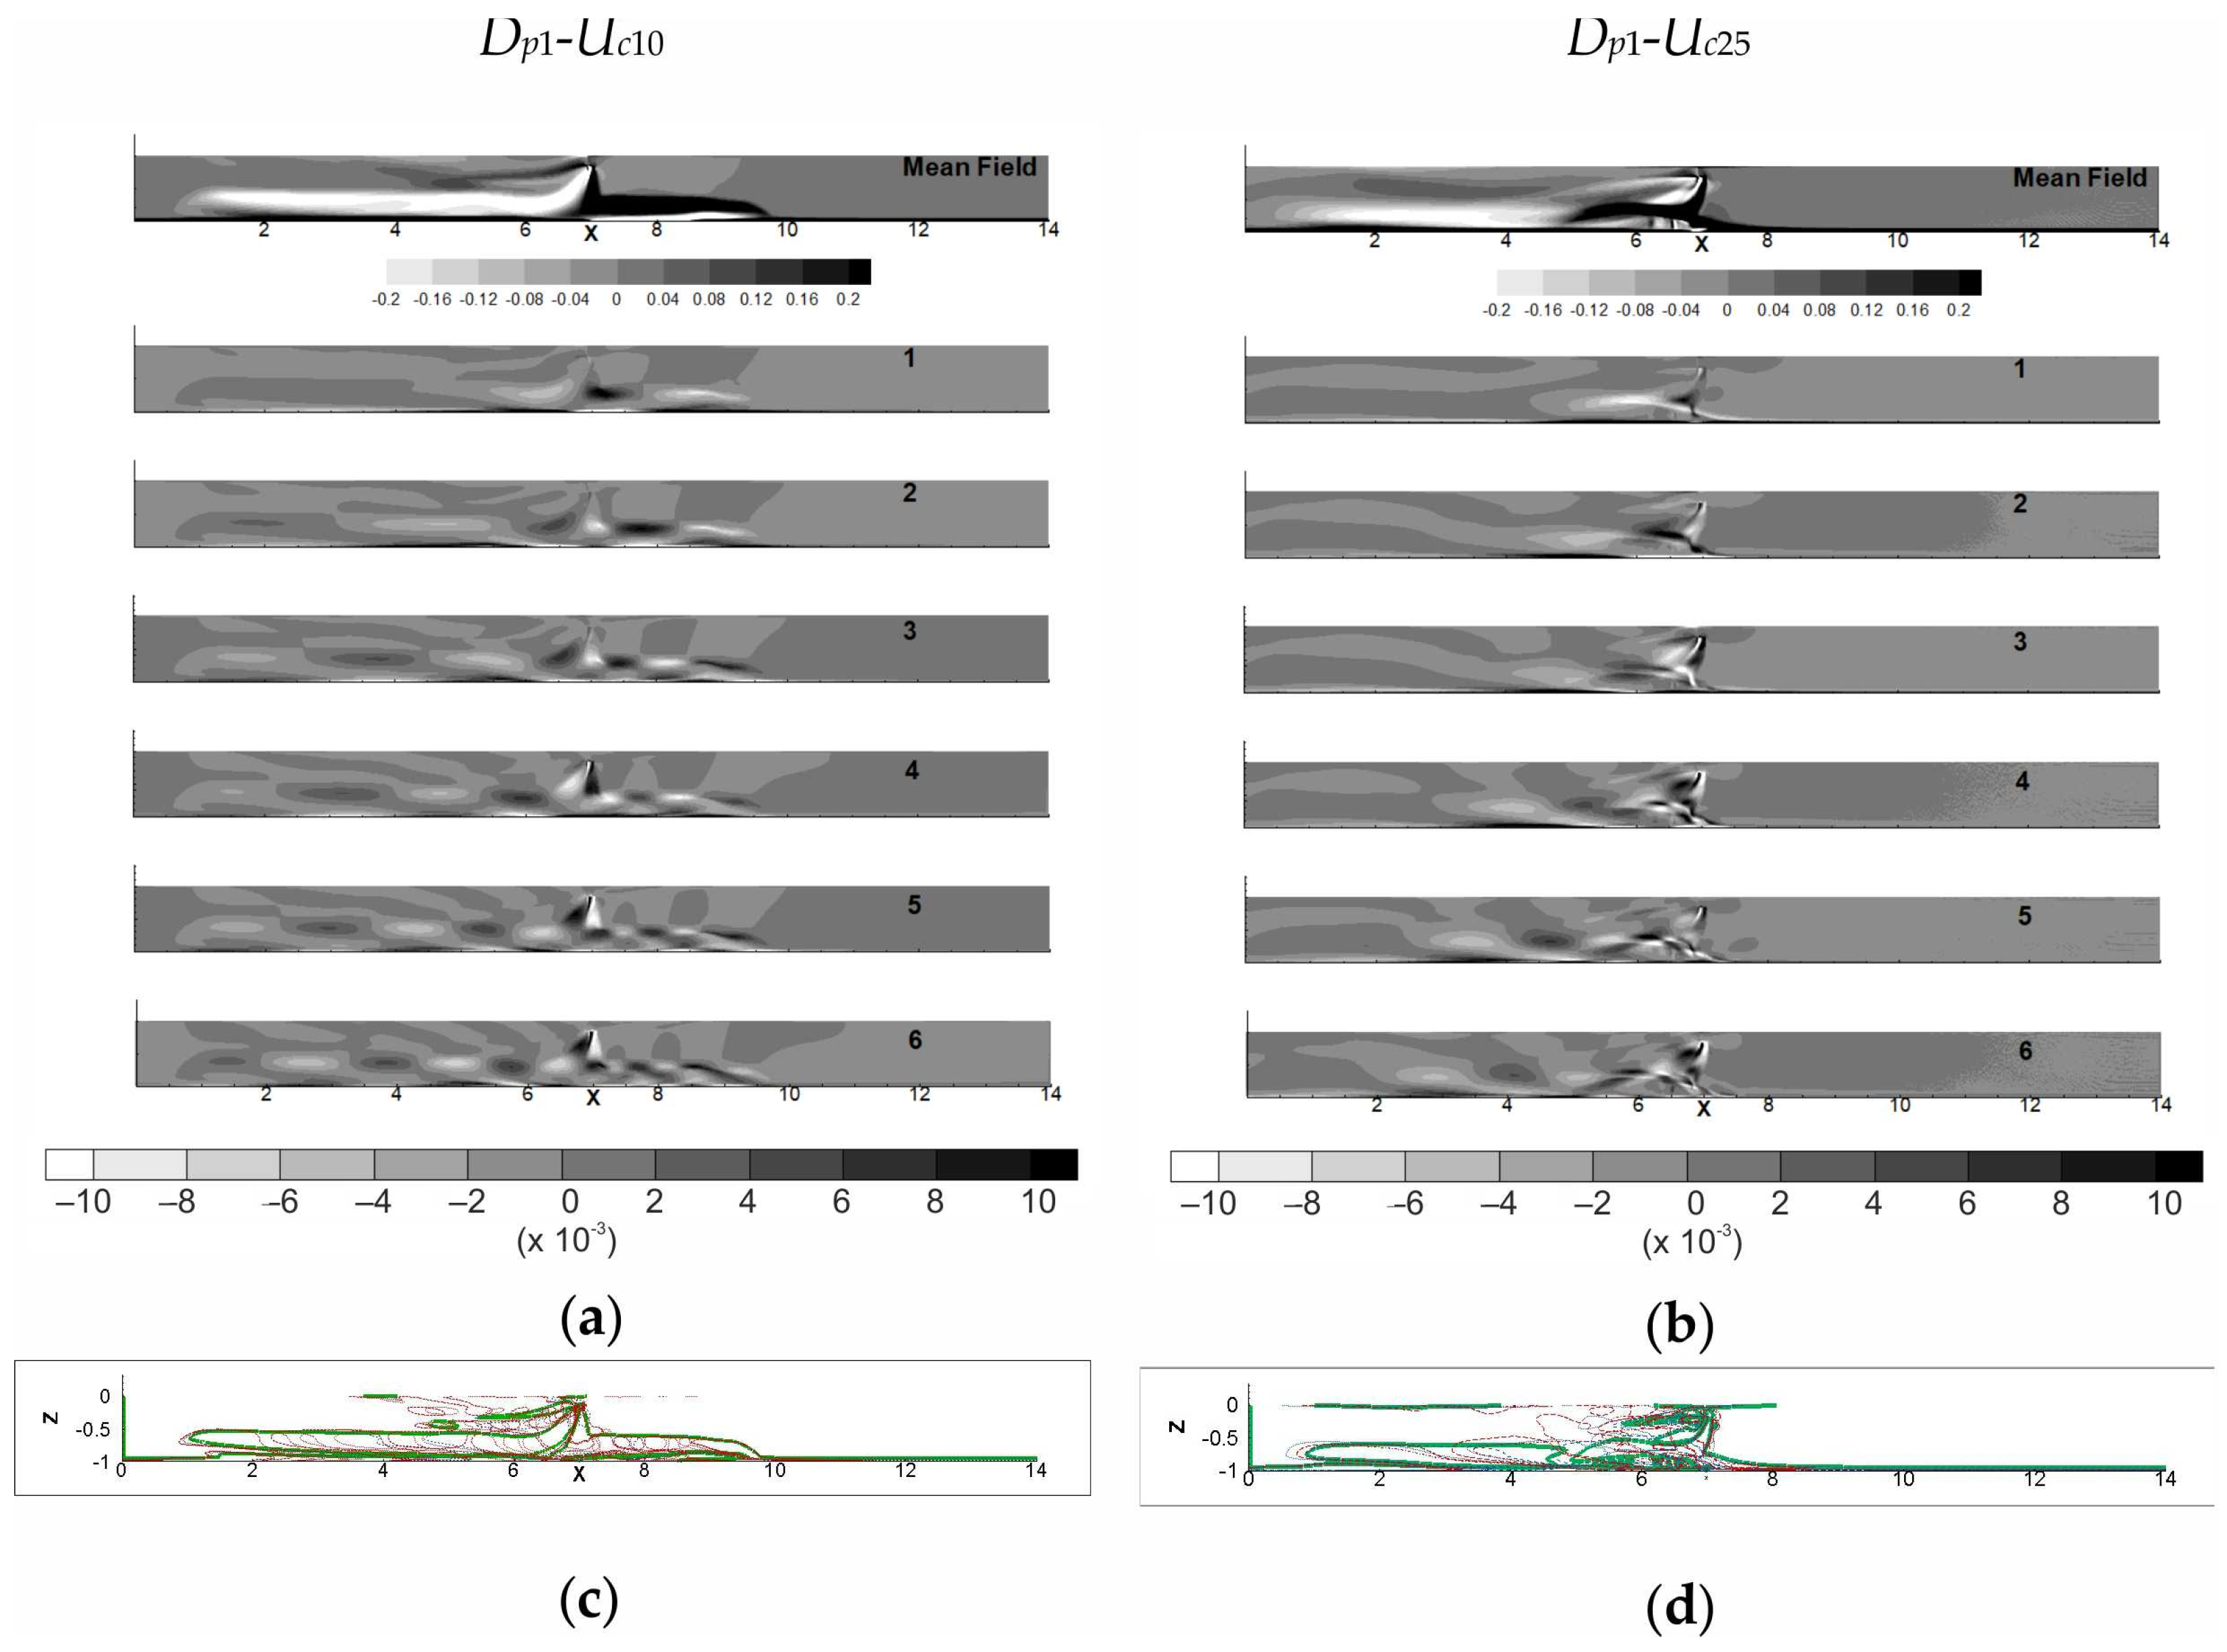
Figure 8 shows the impact of Uc on the total energy extracted by both decompositions applied in this work for sand 1. Figure 9 and Figure 10, respectively, present eigenfunctions obtained from the α s and u s , w s   snapshot decompositions for the cases Dp1-Uc10 and Dp1-Uc25.
As noticed by Nguyen et al. [4], ambient current (Uc) breaks the symmetry of the turbidity distribution during the water–sediment mixture release (cf. Figure 2c,d). The water–sediment mixture occupation zone is shifted to the upstream direction. Thus, during 20 s after water–sediment mixture release, the downstream radius linearly increases from 4 m (for Uc = 0 cm/s) to 10 m for (Uc = 25 cm/s). The upstream radius linearly decreases from 4 m to nearly 0 because the propagation velocity of the front of the density current on the bottom decreases with Uc. Thus, for the cases with ambient velocity, the number of calculation steps (Ns) necessary to observe that the sediment cloud is out of the computation domain, but goes down with increasing ambient velocity (cf. Table 1). To analyze and compare the water–sediment mixture release phenomenon, the size M of the collection of decomposed snapshots is chosen to be equal to Ns.
E α s and E u s , w s are presented in Table 5 for different values of Uc. As previously noticed, for Uc = 0 cm/s and POD2C decomposition is based on the parameter u s , w s and 10 modes (compared to the M = 200 modes extracted), in other words 5% of M. This ratio evolves until it reaches 7.9% with the increasing Uc. The presence of the ambient current leads to a modest increment in the number of eigenvalues necessary to reach 95% of the total energy extracted. A similar trend is observed for results extracted by POD1C (cf. Table 5).
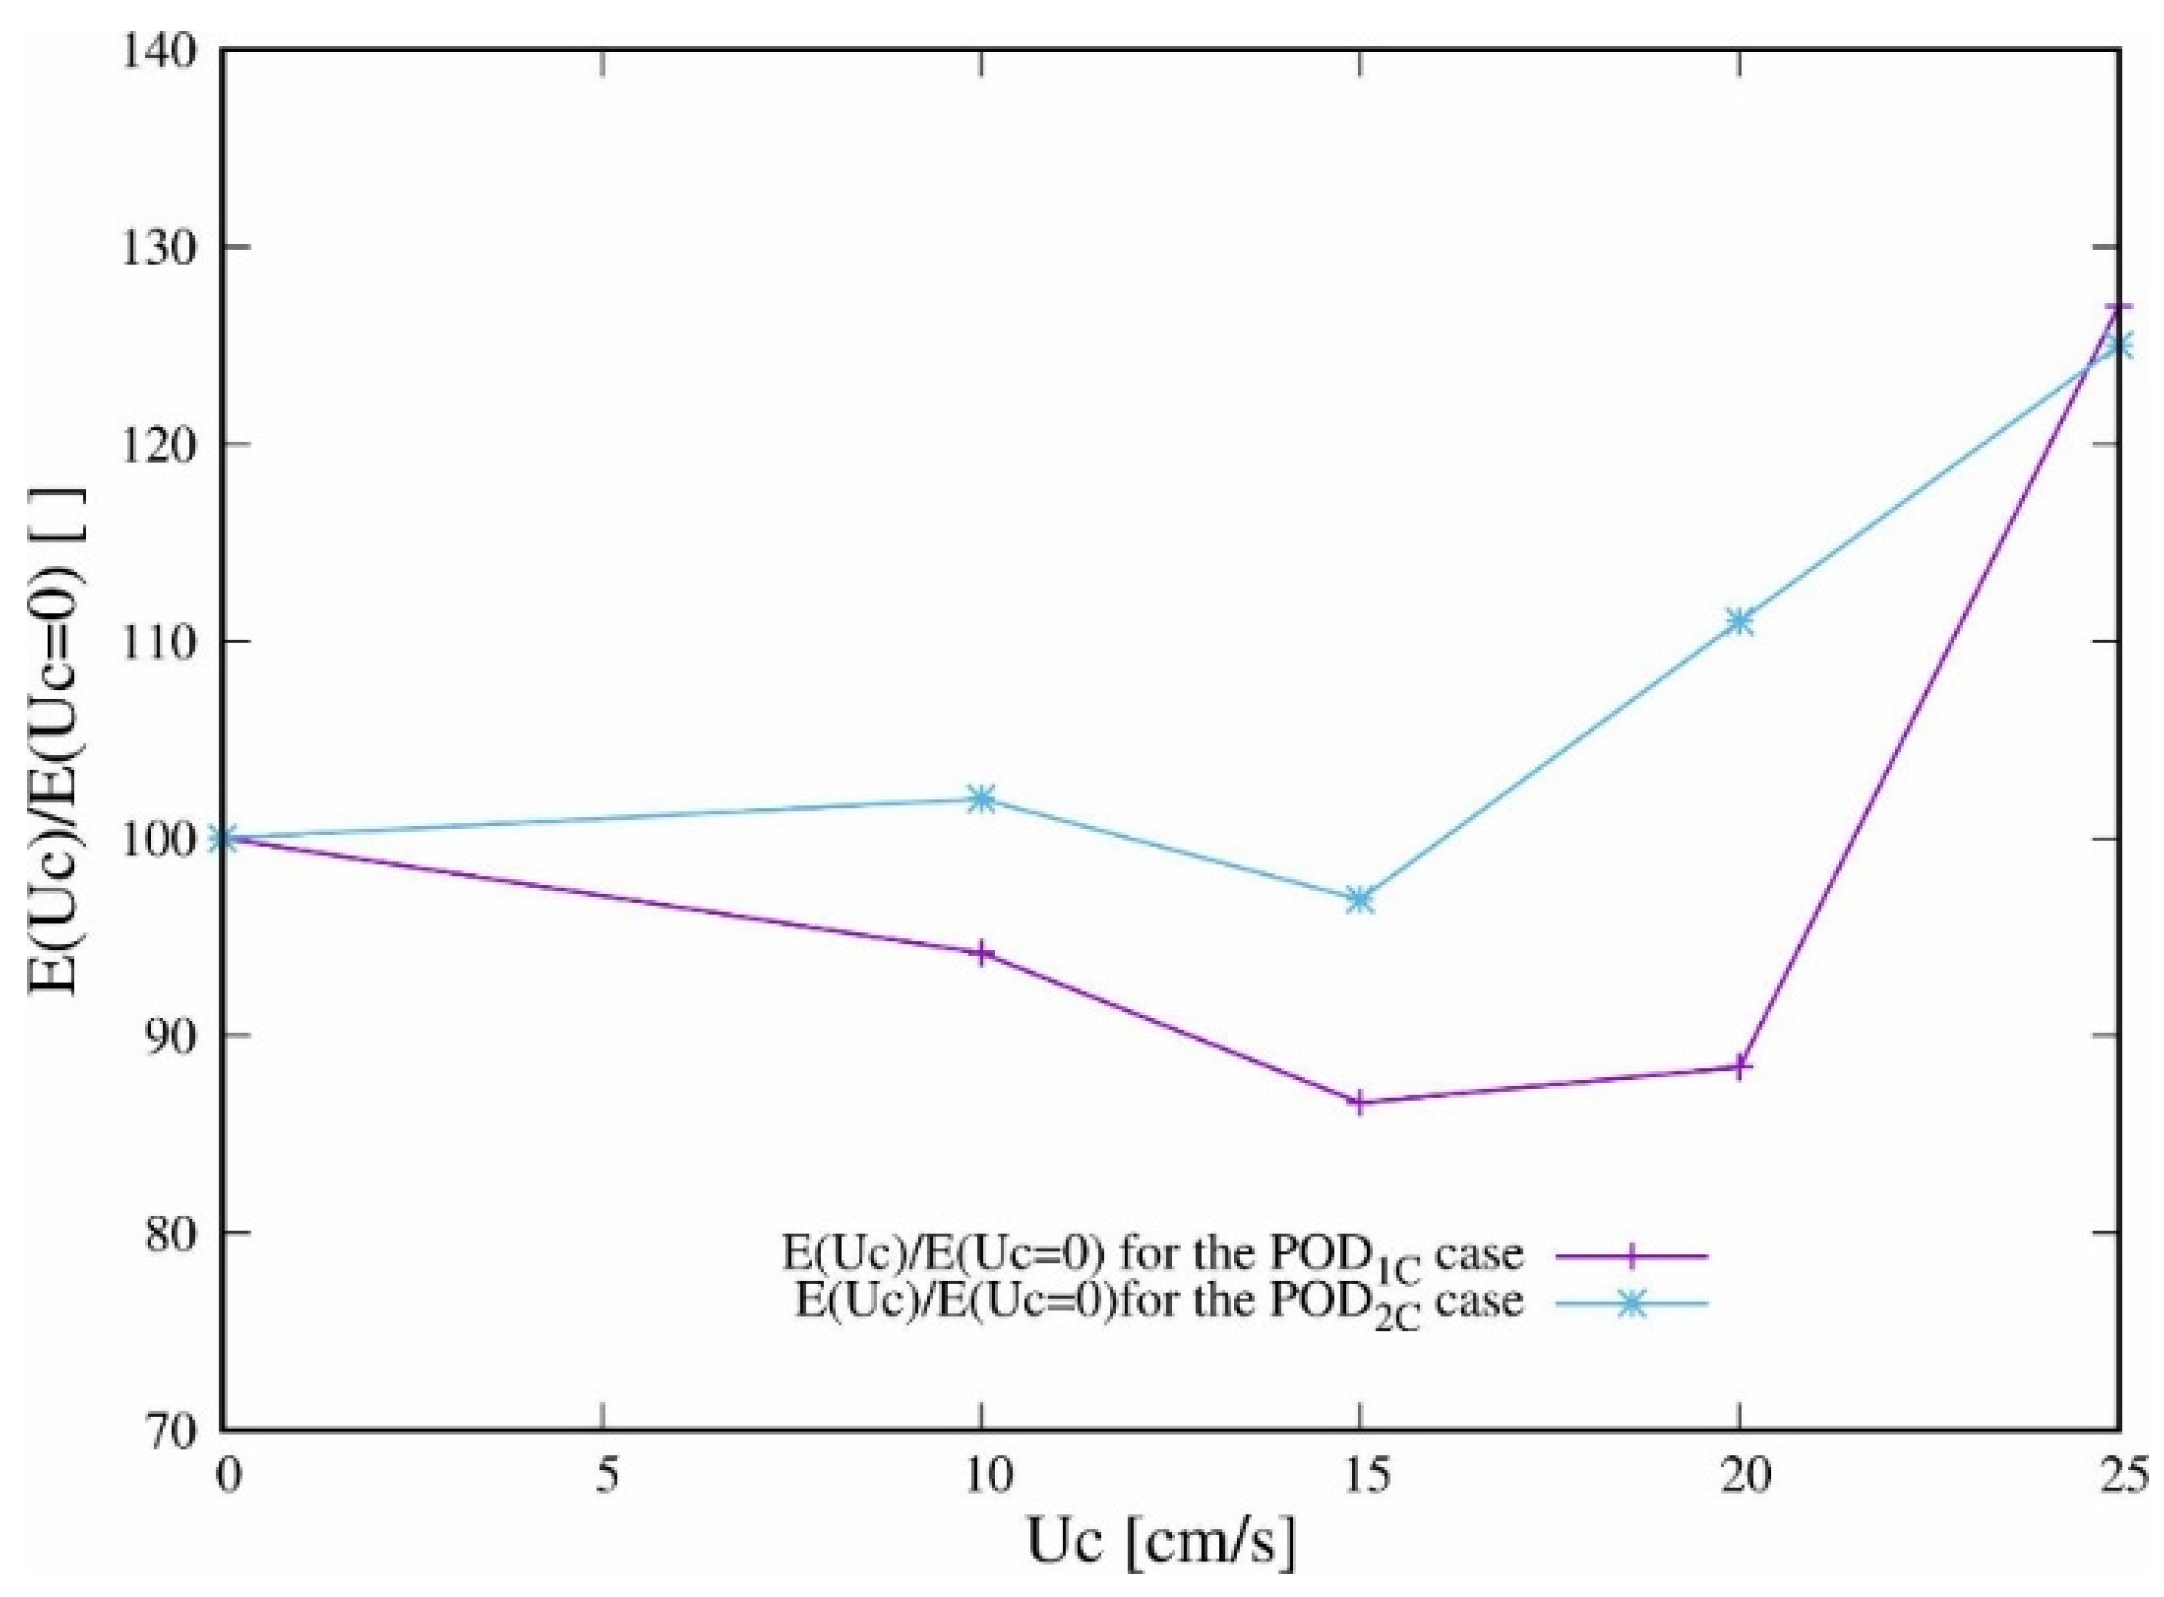
As shown in Figure 8, the ambient current seems to have a modest impact on the amount of E u s , w s extracted for Uc values less than Uc = 15 cm/s. Then, for strong ambient currents, we observe a modification in the evolution, as E u s , w s reaches a marked augmentation of nearly 124%. The level agitation of the solid volume phase velocities suddenly increases beyond a threshold placed between 15 and 20 cm/s. It can be inferred that, below this threshold, the resistance opposed to the strength of Uc limits the development of the agitation. Note that the evolution of E α s shows more marked differences. Before the threshold we observe a clear decrease, then a similar augmentation of ~124% is also reached for Uc = 20 cm/s.
Moreover, this observation completes the values of falling time (Tf) and the water–sediment mixture release diameter when the collapse occurs, as measured by Nguyen [4] for sand 1 and the different values of Uc studied in this work. This author noticed an augmentation of both values with the increase in Uc; however, this augmentation is clearly less marked when the ambient current reaches 20 cm/s.
As can be seen in Figure 9 and Figure 10, it appears that the ambient current presence breaks the symmetry of the POD modes in all the eigenfunctions for both POD decompositions. For Dp1-Uc10, the stretching of upstream POD modes of the eigenfunctions extracted by POD2C stays slight (Figure 10a). The increase in the Uc value leads to a decrease in the size of the POD modes, their gradual stretching and distortion and their displacement in the left direction. In other words, as shown in Figure 10, according to the strength of the ambient current the dynamics of the solid volume fraction can exhibit: a regime within a marked spatial organization and POD modes placed on both sides of the water–sediment mixture injection point (Dp1-Uc10), or a regime showing a heavy loss of the spatial organization of the eigenfunctions and all the POD modes placed on the left of water–sediment mixture injection point (Dp1-Uc25). The eigenfunctions extracted by POD2C for different values of Uc, and not presented here, highlight that the transition between the two regimes occurs at a value between 15 and 20 cm/s. Obviously, this shape of the POD modes reflects the presence of shear observed on turbidity snapshots (cf. Figure 2c,d). Note that at the early steps of time, turbidity isocontours have regular shapes; later, when sediments evolve on the bottom, turbidity presents irregular contours. With the increase in the Uc value, the shearing and the irregularity of the turbidity contours appears at an earlier time after the sediment injection. A similar impact of an ambient current can be also observed on the eigenfunctions obtained from POD1C decomposition of the difference compared to the mean solid volume fraction snapshots. Indeed, for Dp1-Uc10 (cf. Figure 9), POD modes of density transport placed downstream the point of injection of the water–sediment mixture are slightly distorted, and the deformation is more marked for upstream POD modes. These collapses and distortions are due to the resistance of the bottom to the density transport against the direction of the ambient current. It can be also shown that the POD modes placed upstream have more important intensities compared to the downstream ones. Obviously, this intensity distribution reflects that sediment is pushed by the ambient current to the left. Changes from Uc = 10 cm/s to Uc = 25 cm/s imply an amplification of the loss of the spatial organization of the solid phase volume fraction, in other words the destruction of the coherency of the particle’s clouds.
Figure 9c and Figure 10c (i.e., Figure 9d and Figure 10d) show the POD mode outlines (solid line) superimposed to the four first eigenfunctions for Dp1-Uc10 (i.e., Dp1-Uc25). As previously noticed, in all the eigenfunctions, the POD modes have been displaced to the left, pushed by the ambient current. For Uc = 25 cm/s, the higher value of ambient current studied in this paper, all the POD modes observed in both sets of eigenfunctions are strictly placed on the left of the water–sediment mixture injection point.
In spite of the displacement towards the left, the front of the density cloud and POD mode outlines observed for Dp1-Uc10 (cf. Figure 9c and Figure 10c) have strong similarities with the features found without the ambient current. A different behavior is noted for Uc = 25 cm/s, similar to the one previously shown for the Dp2-Uc0 case. A lower layer of flat creeping structures (FS) extends almost as far as the main and upper structures (MS) (cf. Figure 10d). Thus, the downstream front of the particle cloud outline shows a crushing linked to the resistance of the bottom against the sediment transport. Note that the sediment plume observed in Figure 2d (t = 14 s) has a very low concentration.

4. Conclusions

In this work, numerical simulations of water–sediment mixture release were carried out according to the test conditions studied in an experimental way [1,2] and by previous numerical simulations [3,4]. The POD tool was, respectively, applied in scalar and vectorial versions, on the differences in the mean solid volume fraction snapshots and on the differences in the mean solid phase velocities fields to extract the most important pattern of their dynamics.
Two complementary POD tools were used to clarify the link between the solid phase dynamics and the particle dispersion during the three stages of the release phenomenon, and these differences were mainly due to the particle size and its weight. Moreover, the results highlight the existence of different behaviors according to the strength of the ambient current for the Dp1 case.
During the falling time, without an ambient current, it is observed that the particle size has a modest influence on the shape of the POD modes of the most energetic eigenfunctions extracted by POD decomposition. Indeed, for Dp2 cases, the POD modes show an elongated shape compared to the Dp1 cases. An analysis extended to the entire release phenomenon put to the fore that the particle size and its weight affect the passive transport of the sediment. Indeed, for Dp2 cases, the eigenfunctions extracted by POD present POD modes stretched on the bottom due to the enhancement of the opposition of the quiet water to the solid phase motion, compared to the Dp1 case. The evolutions of the total energy information extracted by both POD decompositions reveal some information about the influence of the particle diameter. While the impact on E u s , w s appears for the decomposition of the short snapshot collection limited to the falling time, the impact on E α s appears later for longer snapshots collections covering the settling in the concentration field. Indeed, the POD2C presents the advantage of revealing the trends earlier than POD1C because the settling velocity date is intrinsic to the base parameter u s , w s .
The outline obtained for the solid volume fraction velocities superposed to the POD modes extracted from POD2C highlight the presence of a main structure layer placed over a second single layer of flat and creeping structures. The interaction of these two layers is different according to the particle size, and it seems to be linked to the behavior of the water–sediment mixture transport, and more particularly to the shape of the front of the particle cloud outline. Indeed, a water–sediment mixture collapse is observed for Dp2 and, conversely, this crushing is not observed for the Dp1 case.
Finally, the impact of the ambient current, increasing from 0 to 25 cm/s, is also explored by using both POD tools on Dp1 snapshots. According to the strength of Uc, the total energies and the eigenfunction patterns extracted by both POD decompositions evolve. Indeed, the regime of the release phenomenon changes. For a weak ambient current, POD patterns are displaced to the left but show regular contours. For a strong ambient current, we observe an impact on the spatial organization of the POD pattern identified in the eigenfunction extracted by both decompositions. The decrease in their size and their gradual stretching and distortion reveal the loss of their spatial organization. Their complete displacement downstream of the injection point is also observed. The transition between the regime for Uc 15 and 20 cm/s is clearly identified in the curves of total energies.
In this paper, the POD1C (i.e., POD2C) was applied to collections of 2D snapshots with one component (i.e., two components). A 3D case could be considered, but it would need to use a different solver. In future developments, we would like to use OPENFOAM coupled with SEDFOAM to solve the full 3D case as we carried out in the case of the flow around tidal turbines [29,30]. Those simulations are sensitive and time consuming. They will be the objective of future works. In future work, further investigation could be developed for the Dp2 case with different ambient current velocities to determine if the discrepancies observed stay or become more marked compared to the Dp1 case.

Author Contributions

Conceptualization, A.S.C., D.H.N. and S.S.G.; methodology, A.S.C., D.H.N. and S.S.G.; software, A.S.C.; validation, A.S.C.; formal analysis, A.S.C., D.H.N. and S.S.G.; investigation, A.S.C. and S.S.G.; resources, S.S.G.; writing—original draft preparation, A.S.C., D.H.N. and S.S.G.; writing—review and editing, A.S.C., D.H.N. and S.S.G.; visualization, A.S.C.; supervision, S.S.G.; project administration, S.S.G.; funding acquisition, S.S.G. All authors have read and agreed to the published version of the manuscript.

Funding

This research received no external funding.

Data Availability Statement

Not applicable.

Acknowledgments

Part of the computational means were founded by Manche County Council.

Conflicts of Interest

The authors declare no conflict of interest. The funders had no role in the design of the study; in the collection, analyses, or interpretation of data; in the writing of the manuscript; or in the decision to publish the results.

References

  1. Villaret, C.; Claude, B.; Du Rivau, J.D. Etude Expérimentale de la Dispersion des Rejets par Clapage; LNHE, EDF: London, UK, 1998. [Google Scholar]
  2. Boutin, R. Dragage et Rejets en Mer. Les Produits de Type Vase; Presses de l’ENPC: Paris, France, 2000; 307p. [Google Scholar]
  3. Guillou, S.; Chauchat, J.; Pham Van Bang, D.; Nguyen, D.H.; Nguyen, K.D. Simulation of the dredged sediment’s release with a two-phase flow model. Bull. Perm. Int. Assoc. Navig. Congr. 2011, 142, 25–33. [Google Scholar]
  4. Nguyen, D.H.; Lévy, F.; Pham Van Bang, D.; Guillou, S.; Nguyen, K.D.; Chauchat, J. Simulation of dredged sediment releases into homogeneous water using a two-phase model. Adv. Water Resour. 2012, 48, 102–112. [Google Scholar] [CrossRef]
  5. Sirovich, L. Turbulence and the dynamics of coherent structures. Q. Appl. Math. 1987, 5, 561–590. [Google Scholar] [CrossRef]
  6. Holmes, P.; Lumley, J.L.; Berkooz, G. Turbulence, Coherent Structures, Dynamical Systems, and Symmetry; Cambridge University Press: Cambridge, UK, 1996. [Google Scholar] [CrossRef]
  7. Cizmas, P.G.; Palacios, A.; O’Brien, T.; Syamlal, M. Proper-orthogonal decomposition of spatio-temporal patterns in fluidized beds. Chem. Eng. Sci. 2003, 58, 4417–4427. [Google Scholar] [CrossRef]
  8. Yuan, T.; Cizmas, P.G.; O’Brien, T.O. A reduced model for a bubbling fluidized bed based on proper orthogonal decomposition. Comput. Chem. Eng. 2005, 30, 243–259. [Google Scholar] [CrossRef]
  9. Brenner, T.A.; Fontenot, R.L.; Cizmas, P.G.; O’Brien, T.O.; Breault, R.W. Augmented proper orthogonal decomposition for problems with moving discontinuities. Powder Technol. 2010, 203, 78–85. [Google Scholar] [CrossRef]
  10. Reddy, S.R.; Freno, B.A.; Cizmas, P.G.; Gokaltun, S.; MacDaniel, D.; Dulikravich, G.S. Constrained reduced-order models based on proper orthogonal decomposition. Comput. Methods Appl. Mech. Engrg. 2017, 321, 18–34. [Google Scholar] [CrossRef]
  11. Haghgoo, M.Z.; Bergstrom, D.J.; Spiteri, R.J. Analyzing dominant particle-flow structures inside a bubbling fluidized bed. Int. J. Heat Fluid Flow 2019, 77, 232–241. [Google Scholar] [CrossRef]
  12. Li, X.; Hu, B.X. Proper orthogonal decomposition reduced model for mass transport in heterogeneous media. Stoch. Environ. Res. Risk. Assess 2013, 27, 1181–1191. [Google Scholar] [CrossRef]
  13. Li, X.; Chen, X.; Hu, B.X.; Navon, M.I. Model reduction of a coupled numerical model using proper orthogonal decomposition. J. Hydrol. 2013, 507, 227–240. [Google Scholar] [CrossRef]
  14. Vermeulen, P.T.M.; Heemink, A.W.; Te Stroat, C.B.M. Reduced models for linear groundwater flow models using empirical orthogonal functions. Adv. Water Resour. 2004, 27, 57–69. [Google Scholar] [CrossRef]
  15. Vermeulen, P.T.M.; Heemink, A.W.; Valstar, J.R. Inverse modeling of groundwater flow using model reduction. Water Resour. Res. 2005, 41, W06003. [Google Scholar] [CrossRef]
  16. Polansky, J.; Wang, M. Proper Orthogonal Decomposition as a technique for identifying two-phase flow pattern based on electrical impedance tomography. Flow Meas. Instrum. 2017, 53, 126–132. [Google Scholar] [CrossRef]
  17. Olbrich, M.; Bar, M.; Oberleithner, K.; Schmelter, S. Statistical characterization of horizontal slug flow using snapshot proper orthogonal decomposition. Int. J. Multiph. Flow 2021, 134, 103453. [Google Scholar] [CrossRef]
  18. Munir, S.; Israr, M.; Heikal, M.R.; De Sercey, G. Identification of dominant structures and their flow dynamics in the turbulent two-phase flow using POD technique. J. Mech. Sci. Technol. 2015, 29, 4701–4710. [Google Scholar] [CrossRef]
  19. Munir, S.; Farooq, U. POD based on vorticity: Application in a two-phase slog flow. J. Fluids Eng. 2022, 144, 041501. [Google Scholar] [CrossRef]
  20. Munir, S.; Azis, A.R.A.; Heikal, M.R.; Israr, M. Combination of linear stochastic estimation and proper orthogonal decomposition: Application in two-phase slug flow. J. Braz. Soc. Mech. Sci. Eng. 2023, 45, 112. [Google Scholar] [CrossRef]
  21. Nguyen, D.H.; Guillou, S.; Hien, L.T.T.; Nguyen, Q.H. Proper orthogonal decomposition of a very high concentrated release of sediment in water: Spatio temporal patterns. IJRTE 2019, 8, 2347–2353. [Google Scholar] [CrossRef]
  22. Guillou, S.; Thiébot, J.; Chauchat, J.; Verjus, R.; Besq, A.; Nguyen, D.H.; Pouv, K.S. The Filling Dynamics of an Estuary: From the Process to the Modelling. In Sediment Transport in Aquatic Environments; Manning, A., Ed.; InTech: London, UK, 2011; pp. 125–146. ISBN 978-953-307-586-0. Available online: https://www.intechopen.com/chapters/20914 (accessed on 3 October 2011).
  23. Barbry, N.; Guillou, S.; Nguyen, K.D. Une approche diphasique pour le calcul du transport sédimentaire en milieux estuariens. Comptes Rendus De L’académie Des Sci. 2000, 328, 793–799. [Google Scholar] [CrossRef]
  24. Chauchat, J.; Guillou, S. On turbulence closures for two-phase sediment-laden flows models. J. Geophys. Res. 2008, 113, C11017. [Google Scholar] [CrossRef]
  25. Nguyen, K.D.; Guillou, S.; Chauchat, J.; Barbry, N. A two-phase numerical model for suspended-sediment transport in estuaries. Adv. Water Resour. 2009, 32, 1187–1196. [Google Scholar] [CrossRef]
  26. Lundgren, T. Slow flow through stationary random beds and suspensions of spheres. J. Fluid. Mech. 1972, 51, 273–299. [Google Scholar] [CrossRef]
  27. Graham, A.L. On the viscosity of suspensions of solid spheres. Appl. Sci. Res. 1981, 37, 275–286. [Google Scholar] [CrossRef]
  28. Farout-Fréson, I.; Sergent, P.; Lefrançois, E.; Datt, G. Modèle numérique de clapage–phase de chute. In Proceedings of the IXèmes Journées Nationales Génie Civil—Génie Côtier, Brest, France, 12–14 September 2006; pp. 179–186. [Google Scholar] [CrossRef]
  29. Khaled, F.; Guillou, S.S.; Méar, Y.; Hadri, F. Impact of blockage ratio on the transport of sediments in the presence of a hydrokinetic turbine: Numerical modelling of the interaction sediments-turbine. Int. J. Sediment Res. 2021, 36, 696–710. [Google Scholar] [CrossRef]
  30. Khaled, F.; Guillou, S.S.; Méar, Y.; Hadri, F. Numerical investigation of the local impact of hydrokinetic turbine on sediment transport—Comparison between two actuator models. Eur. J. Mech. B Fluids 2023, 102, 31–45. [Google Scholar] [CrossRef]
Figure 1. Illustrative sketch of the release phenomenon: (a) description of the sediment release experiments, Rd and Ru are, respectively, downstream and upstream radius of the sediment cloud front; (b) water–sediment mixture dumping without ambient current (Dp1); (c) water–sediment mixture dumping with ambient current (Dp1-Uc20).
Water 15 03284 g001
Figure 2. Instantaneous turbidity Cm [g/L] fields’ evolutions obtained by simulations: (a) case Dp1; (b) case Dp2; (c) case Dp1-Uc10; (d) Dp1-Uc25. N represents the number of the snapshot. The first image of each case represents the turbidity distribution at falling time. In the cases without velocity (Dp1, Dp2), the sediments settle and move on the bottom in both directions until the total sedimentation of the particles, whereas in the cases with a current (Dp1-Uc10, Dp1-Uc25), the sediment plume is transported in the left direction until the limit of the simulation domain.
Water 15 03284 g002
Figure 3. Average root mean square error percentage according to kmax, the number of POD spatio-temporal modes used in the snapshot reconstruction. The duration time of a sequence is equal to 0.1 M. The results shown in this figure are extracted by POD1C and POD2C for Dp2 particles applied to snapshot collections with a short duration time of 4 s (a) and a longer one of 40 s (b).
Water 15 03284 g003
Figure 4. Results obtained for the Dp1 case for POD applied to a snapshot collection corresponding to the falling time Tf = 1.5 s (dt = 0.1 s and M = 15). (a) Mean solid volume fraction field and POD1C spatial dimensionless eigenfunctions Φ k x obtained from the difference compared to the mean solid volume fraction α s   ; (b) mean solid phase velocity field and POD2C spatial dimensionless eigenfunctions Φ k x obtained from the difference compared to the mean solid volume velocities u s ,   w s . Dark colours represent positive values and clear colors represent negative values; (c) POD1C temporal orthogonal coefficients a j t (d) POD2C temporal orthogonal coefficients a j t ; (e) phase space projections of temporal coefficients obtained through the POD1C for Dp1 and Dp2 cases; (f) phase space projections of temporal coefficients obtained through the POD2C for Dp1 and Dp2 cases.
Water 15 03284 g004
Figure 5. (a) Total POD1C energy ( E α s [ ]) and (b) total POD2C energy ( E u s ,   w s [m2/s2]) according to the M number of snapshots decomposed for Dp1 and Dp2. Here, dt is equal to 0.1 s, and the duration of the size collection is equal to Mdt.
Water 15 03284 g005
Figure 6. (a) Mean solid volume fraction field and POD1C spatial dimensionless eigenfunctions Φ k x obtained from the Dp1 case for the difference compared to the mean solid volume fraction α s and M = 200 (dark colours represent positive values and clear colors represent negative values). (b) Particle’s cloud outline (solid line) superimposed to the four first eigenfunctions for M = 200. (c) Particle’s cloud outline (solid line) superimposed to the four first eigenfunctions for the Dp2 case M = 200. (d) POD1C temporal orthogonal coefficients a j t . (e) Phase space projections of temporal coefficients obtained through the POD1C for the Dp1 and Dp2 cases.
Water 15 03284 g006
Figure 7. (a) Mean field and POD2C spatial dimensionless eigenfunctions Φ k x   obtained from the Dp1 case for the difference compared to the mean solid volume velocities u s ,   w s and M = 200 (with POD2C we obtain dimensionless spatial eigenfunctions; however, we have represented the rotational of each eigenfunction. Dark colors represent positive values and clear colors represent negative values). (b) Outline obtained for the solid volume fraction velocities (solid line) superimposed to the four first eigenfunctions for the Dp1 case M = 200. (c) Outline obtained for the solid volume fraction velocities (solid line) superimposed to the four first eigenfunctions for the Dp2 case M = 200. (d) POD2C temporal orthogonal coefficients a j t . (e) Phase space projections of temporal coefficients obtained through the POD2C for Dp1 and Dp2 cases (as observed for the phase space projection a 1 t , a 2 t (cf. Figure 7e), a 1 t , a 3 t and a 2 t , a 3 t also present similar shapes for both particle diameters. This finding suggests that, despite the differences observed elsewhere related to the impact of the diameter of the particles, the difference compared to the mean solid volume velocities maintain a similar dynamic).
Water 15 03284 g007
Figure 8. Total POD energy for sand 1 according to the ambient current: E α s [ ] extracted from solid volume fraction snapshots collection and total kinetic energy E u s ,   w s   [m2/s2]. Both values are dimensionless by the values obtained without an ambient current: 0.63 for POD1C and 180 for POD2C.
Water 15 03284 g008
Figure 9. Mean solid volume fraction field and POD1C spatial dimensionless eigenfunctions Φ k x   obtained for the difference compared to the mean solid volume fraction ( α s ’). Dark colors represent positive values and clear colors represent negative values: (a) Dp1-Uc10 (M = 200); (b) Dp1-Uc25 (M = 140); (c) particle’s cloud outline (solid line) superimposed to the four first eigenfunctions for Dp1-Uc10 and (d) for Dp1-Uc25.
Water 15 03284 g009
Figure 10. Mean solid phase velocity field and POD2C spatial dimensionless eigenfunctions Φ k x obtained for the difference compared to the mean solid volume velocities u s ,   w s . To represent these eigenfunctions, it is necessary to calculate a pseudo-vector field equal to the rotation of the two-dimensional vector field. Dark colors represent positive values and clear colors represent negative values: (a) Dp1-Uc10 (M = 200); (b) Dp1-Uc25 (M = 140); outline obtained for the solid volume fraction velocities (solid line) superimposed to the four first eigenfunctions for (c) Dp1-Uc10 and (d) for Dp1-Uc25.
Water 15 03284 g010
Table 1. Testing conditions of the simulated cases and nomenclature: Tf is the falling time defined from simulations, Ns is the size of the complete collection of snapshots outputted from simulation for each configuration studied, M the number of snapshots used in the POD decomposition (≤Ns), Winj is the injection velocity from the recipient, Dp the sediment particle diameter (90 μm or 160 μm), μ the dry density of the solid (2650 kg/m3), Cm is the concentration of the mixture (450 g/L), Vr is the volume of dumped material (60 L), and Uc the ambient velocity [2].
CasesDp1Dp1 -Uc10Dp1 -Uc20Dp1 -Uc15Dp1-Uc25Dp2
Ns200200159183140400
Tf (s)1.52.12.62.42.81.3
Winj (m/s)0.790.790.790.790.790.89
Dp (μm)9090909090160
Vr (L)606060606060
Uc (cm/s)0102015250
Size of the decomposed collection M = 15–200
(dt = 0.1 s)
M = 200
(dt = 0.1 s)
M = 159
(dt = 0.1 s)
M = 183
(dt = 0.1 s)
M = 140
(dt = 0.1 s)
M = 15–400
(dt = 0.1 s)
Table 2. Sediment cloud falling time (Tf) obtained for a mixture concentration of 450 g/L.
Falling Time for the Case Dp1Falling Time for the Case Dp2
Experimental results (Villaret [1] and Boutin [2])0.95 (0.45–1.45)0.72 (0.22–1.22)
Numerical results in this work1.51.3
Numerical results—bi esp2D (Farout-Fréson [28])10.7
Table 3. Energy contribution of the modes for POD applied to snapshot collection limited to the falling time.
Dp1 M = 15 (1.5 s)Dp2 M = 13 (1.3 s)
E α s 1.271.19
E u s , w s 98140
λ 1 / E α s [ % ] and λ 2 / E α s [ % ] 44, 2842, 29
λ 1 / E u s , w s % and λ 2 / E u s , w s % 68, 2364, 24
( λ 1 + λ 2 + λ 3 ) / E α s [ % ] 8079
( λ 1 + λ 2 + λ 3 ) / E u s , w s [ % ] 9694
Table 4. Energy contribution of the modes for POD applied to a snapshot collection describing the release phenomenon.
Dp1 M = 200 (20 s)Dp2 M = 200 (20 s)
E α s 0.631.03
E u s , w s 180133
( λ 1 + λ 2 + λ 3 ) / E α s [ % ] 4363
( λ 1 + λ 2 + λ 3 ) / E u s , w s [ % ] 6264
Number of eigenvalues necessary to reach 95% of E α s 1518
Number of eigenvalues necessary to reach 95% of E u s , w s 1010
Table 5. Energy contribution of the modes for POD applied to a snapshot collections describing the density current propagation for cases within current ambient.
Dp1 M = 200 (20 s)Dp1-Uc10 M = 200 (20 s)Dp1-Uc25 M = 140 (14 s)
E α s 0.630.590.8
E u s , w s 180184224
Number of eigenvalues necessary to reach 95% of E α s 151814
Number of eigenvalues necessary to reach 95% of E u s , w s 101211
(Number of eigenvalues necessary to reach 95% of E α s )/M [%]7.5910
(Number of eigenvalues necessary to reach 95% of E u s , w s )/M [%]567.9
Disclaimer/Publisher’s Note: The statements, opinions and data contained in all publications are solely those of the individual author(s) and contributor(s) and not of MDPI and/or the editor(s). MDPI and/or the editor(s) disclaim responsibility for any injury to people or property resulting from any ideas, methods, instructions or products referred to in the content.