Article

Comparative Analysis of the Hydrodynamic Performance of Dual Flapping Foils with In-Phase and Out-of-Phase Oscillations

1
College of Mechanical Engineering, Zhejiang University of Technology, Hangzhou 310023, China
2
School of Mechanical & Automotive Engineering, Zhejiang University of Water Resources and Electric Power, Hangzhou 310018, China
*
Author to whom correspondence should be addressed.
Water 2023, 15(18), 3275; https://doi.org/10.3390/w15183275
Submission received: 20 July 2023 / Revised: 1 September 2023 / Accepted: 14 September 2023 / Published: 15 September 2023
(This article belongs to the Special Issue Advances in Hydrodynamics of Water Pump Station System)

Abstract

:
In the context of the plain river network, conventional water pumps suffer several drawbacks, including inadequate efficiency, poor security, and costly installation costs. In order to improve the hydrodynamic insufficiency problem and enhance the hydrodynamic performance and applicability of flapping hydrofoils, this paper proposes a bionic pumping device based on dual flapping foils. Based on the finite volume method and overlapping grid technology, the numerical simulation and experimental verification of the hydraulic performance of two typical motion modes of in-phase and out-of-phase oscillations are conducted, thereby providing a theoretical foundation for improving and optimizing the design of flapping hydrofoils. The results show that the out-of-phase oscillation has better hydraulic performance compared to the in-phase oscillation. The formation of the tail vortex structure plays a crucial role in determining the hydraulic efficiency of dual flapping foils, with in-phase oscillation forming a pair of vortex streets and out-of-phase oscillation forming two pairs of vortex streets. The pumping efficiency of the out-of-phase oscillation is significantly higher than that of the in-phase oscillation, reaching up to 38.4% at a fixed frequency of f = 1 Hz, which is an increase of 90.5% compared to the in-phase oscillation. The characteristic curve of the in-phase oscillation shows an “S” type unstable oscillation phenomenon, namely the hump phenomenon, while the out-of-phase oscillation does not show such a phenomenon, which can effectively expand its application range. In addition, the applicable head of the out-of-phase oscillation hydrofoil is lower, which can better meet the requirements of ultra-low head conditions.

1. Introduction

In the region characterized by a plain river network, the presence of a mild topography and low water flow rate leads to inadequate hydrodynamics; the water pollution caused by it harms the residents’ health and quality of life [1,2,3,4,5]. As one of the common management measures, the pump-gate joint dispatching method can enhance the hydrodynamics of river networks and efficiently enhance the quality of the water’s surroundings [6,7]. However, under the ultra-low head condition, the pumping station has the problems of low operating efficiency, excessive vibration, and poor stability, which cannot adapt to the situation with almost no heads of small rivers in the plains [8,9,10]. Research has found that the bionic pumping device imitating the movement of the fishtail has the advantages of high propulsion efficiency, low noise, and high flow rate, which can play a beneficial role in pushing water [11,12]. The relevant studies mainly focus on single foils and dual foils need to be further studied [13,14]. In addition, studies have shown that dual foils have certain advantages over single foils, summarized by the following: Compared with single foils, dual foils are more adaptable to the river’s width in application scenarios. The dual foil also has higher stability and flow field structure, as well as more robust control performance for better and more precise control of the water flow direction. Therefore, this paper proposes a bionic pumping device based on a dual flapping foil, aiming to improve the problem of insufficient river hydrodynamics and enhance the mobility of water flow.
Many scholars have studied dual foils, which are widely used in energy harvesting, underwater vehicles, and wave gliders [15,16,17,18,19,20]. In terms of motion parameters, Kinsey and Dumas investigated the energy harvesting performance of a turbine based on a tandem configuration using numerical methods and introduced the global phase parameter, and they found that the maximum efficiency could reach 64% by varying the inter-foil spacing and motion phase difference parameters [21]. Subsequently, He et al. further investigated the inter-foil spacing and analyzed the influence mechanism numerically, and concluded that the inter-foil spacing has a significant effect on the energy harvesting of the dual foils [22]; Bao et al. studied the propulsion performance of the dual foils and found that the effect of the inter-foil spacing on the propulsion performance was mainly in the wake interference [23]. Dewey et al. examined the propulsion performance of tandem hydrofoils using a vortex array model and PIV experiments, and demonstrated the wake vortex structure with varying phase differences to analyze the effect of phase difference on propulsion performance [24]. Liu et al. numerically investigated the energy harvesting efficiency of a dual foil in the presence of a 90° phase relationship in pitch amplitude, and explored the effects of frequency, amplitude, and other kinematic parameters on energy harvesting efficiency [25]. Ahmet Gungor et al. numerically investigated the effect of two oscillating foils in a side-by-side configuration on the phase difference and Strouhal number. Then, they classified the vortex patterns of the wake of the dual foil and elucidated the physical mechanism of the wake merging process [26,27]. Chao Li Ming et al. numerically investigated the thrust generation and wake structure of dual foils in tandem, parallel, and staggered arrangements, and found that it is affected by the horizontal gap and vertical gap [28]. Huerta et al. conducted an experimental study of dual foils with different phase differences in open water and found that dual foil with a side-by-side structure is more beneficial in terms of efficiency compared to a single foil [29]. Wang et al. undertook a parametric analysis of the propulsive efficiency of propulsors. Their findings revealed that a propulsive efficiency exceeding 70% could be attained by employing suitable combinations of kinematic parameters [30].
Studies have shown that dual flapping foils exhibit excellent hydrodynamic performance under appropriate motion parameters. Most of the studies have been related to energy harvesting and underwater propulsion, while relatively few studies have been focused on pumping water to enhance the water body flow. This paper proposes a bionic pumping device based on dual flapping foils to enhance water body mobility in river network areas. To further enhance the pumping performance, a comprehensive analysis of the oscillation mode is conducted. In addition, the study also pointed out that the oscillation mode of the dual flapping foils has a crucial effect on the performance of the bionic pumping device, mainly in the difference of the wake vortex structure. [24]. Therefore, this paper focuses on two typical oscillation modes, namely in-phase and out-of-phase oscillation. We conduct numerical simulations and experimental validations to compare and analyze the impact of the dual flapping foil on pump performance in these two modes. This paper sets out a guideline for optimizing the structural design of the bionic pumping device.

2. Motion Model

2.1. Motion Description

The study of hydrofoils is divided into two types: flexible hydrofoils and rigid hydrofoils. The flexible hydrofoil has more degrees of freedom, complex motion, and advantages in the higher flutter frequency region. In contrast, the motion of the rigid hydrofoil is simple, easy to control, low cost, and has more practical engineering significance, so this paper selects the rigid hydrofoil as the research object. This study chooses the NACA0012 airfoil as the subject of investigation, with its corresponding profile depicted in Figure 1.
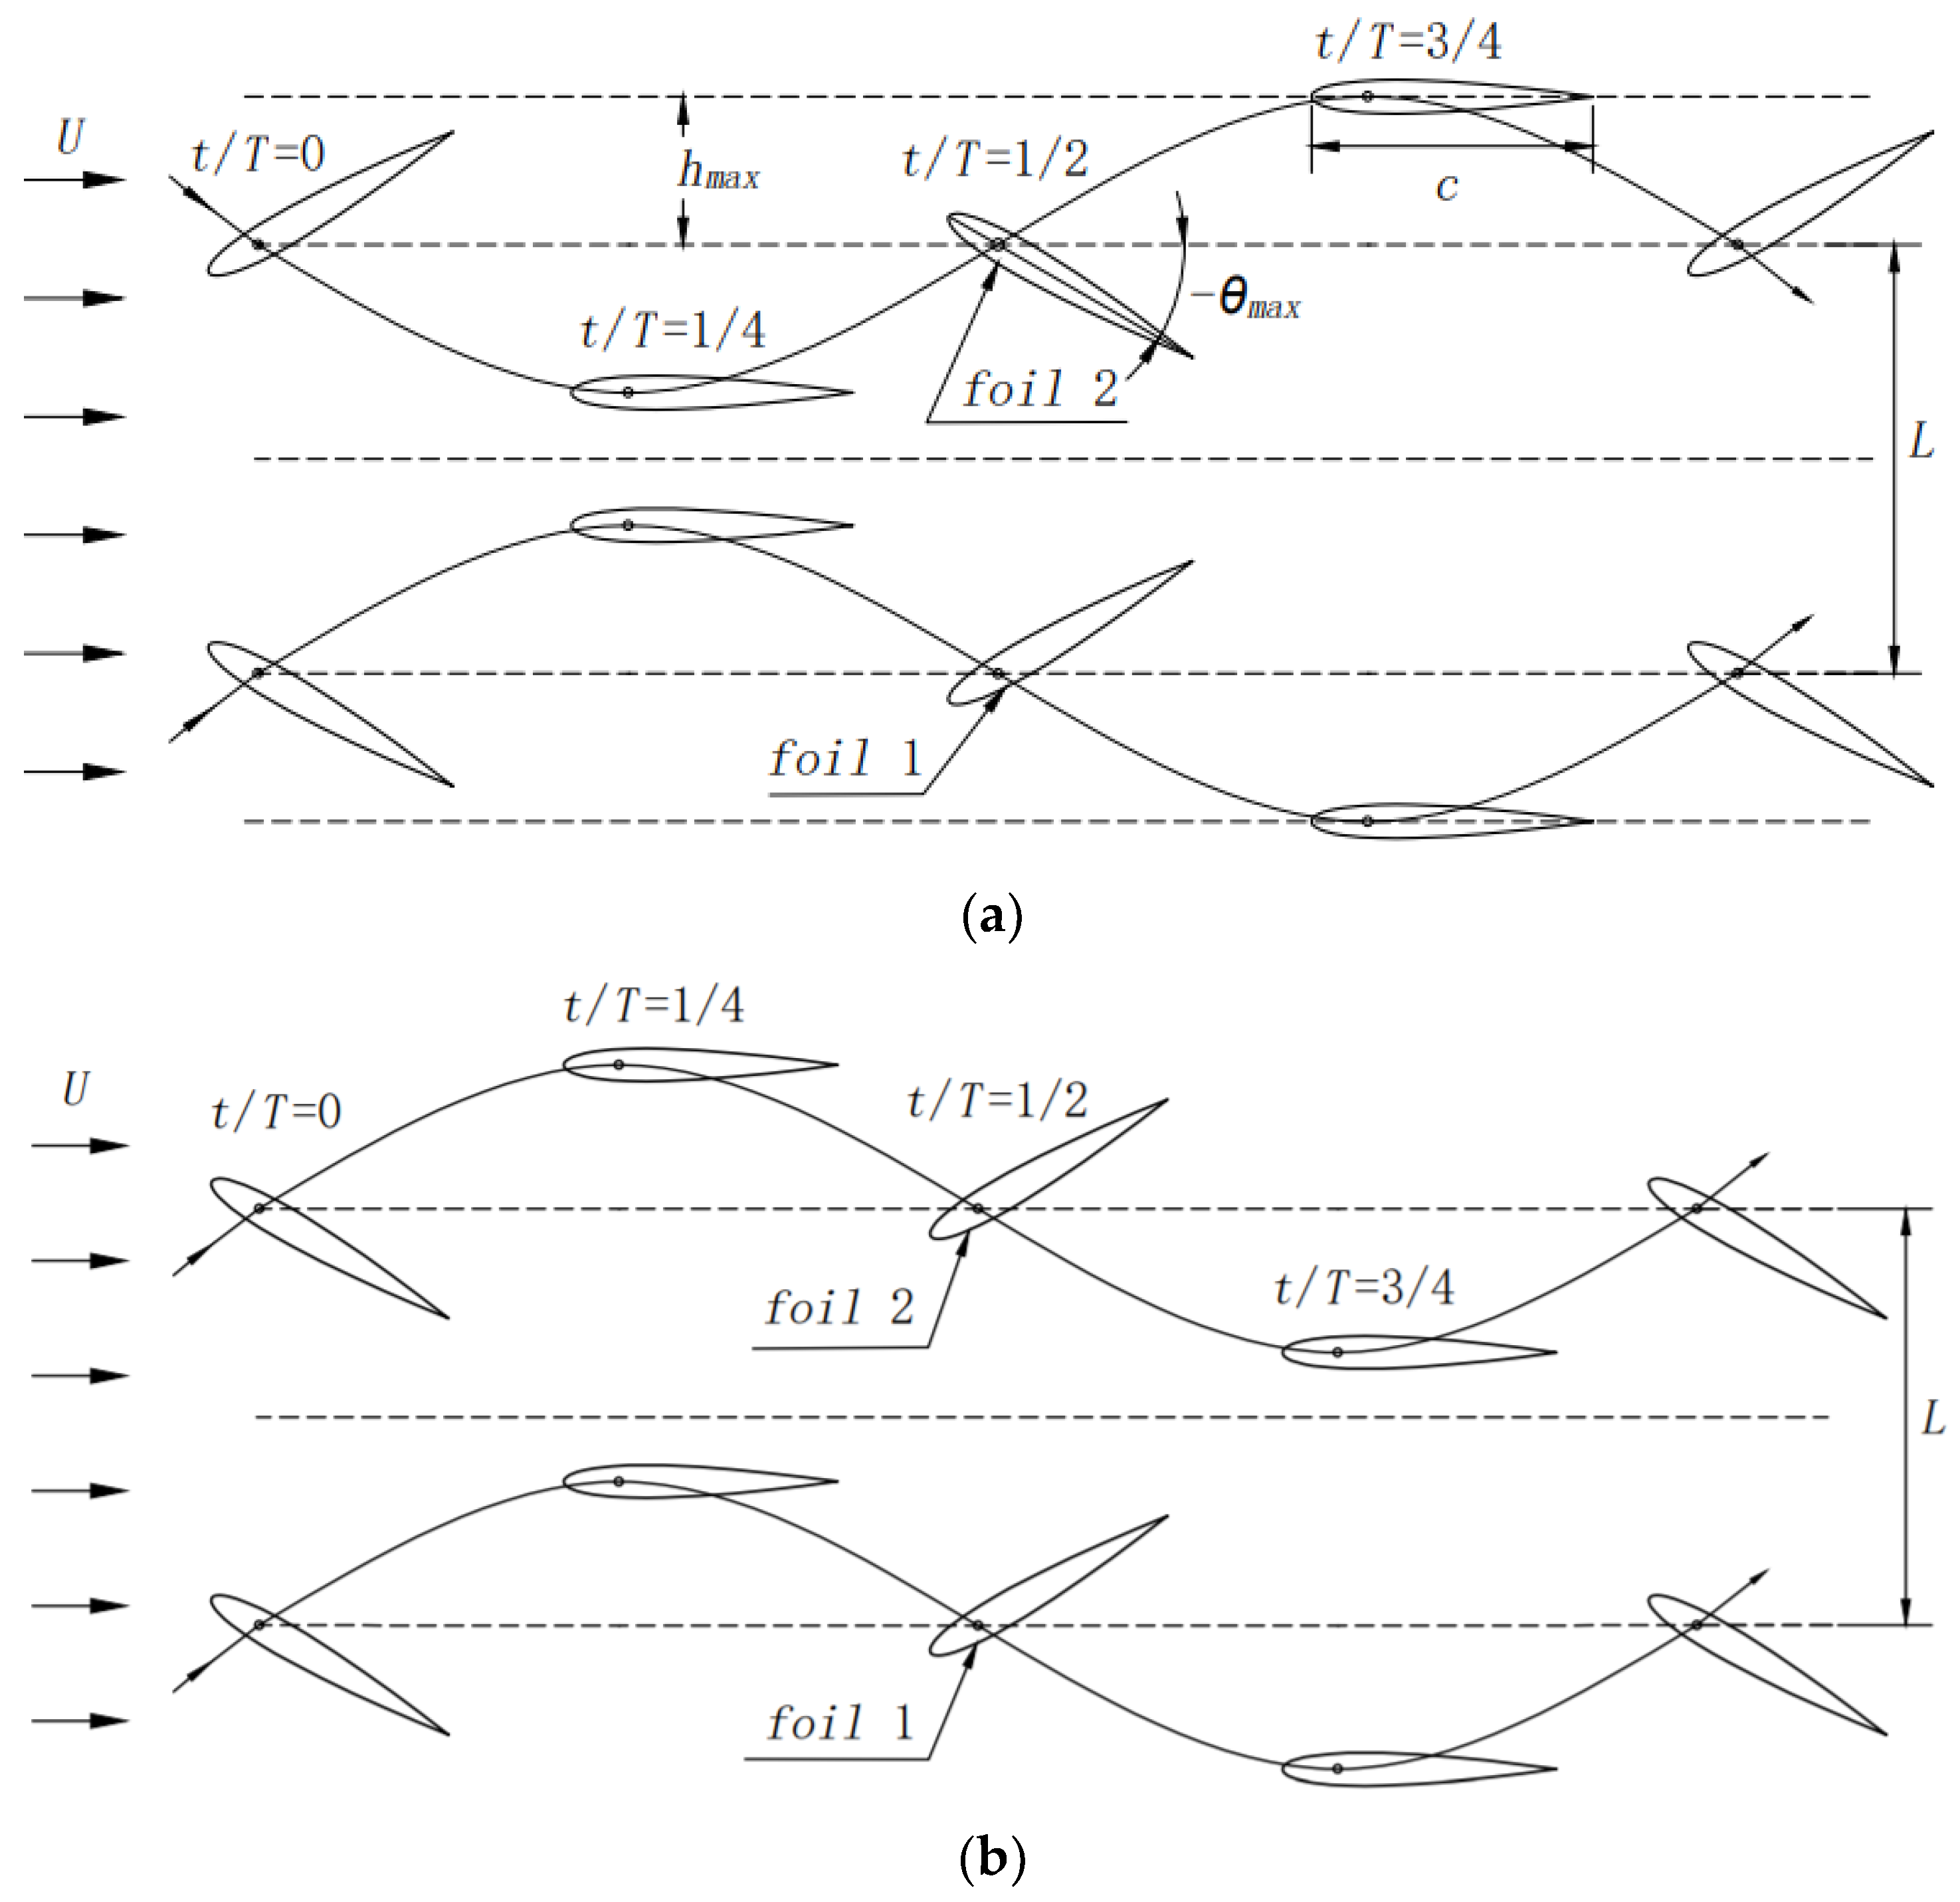
In this paper, the motion is a synchronous pitch and lift motion of the dual flapping foils according to the simple harmonic law. The motion of both parts varies by sinusoidal law, as shown in Figure 2. Figure 2 illustrates the motion of the dual flapping foils, exhibiting both in-phase and out-of-phase oscillation.
In Figure 2, h max represents heaving amplitude and θ max represents pitching amplitude, which is 30° in this study. T represents the period of motion. L represents the distance between two foils. The equation describing the motion of dual flapping foils is given by:
{ h 1 ( t ) = h max sin ( 2 π f t ) θ 1 ( t ) = θ max sin ( 2 π f t + ϕ ) h 2 ( t ) = h max sin ( 2 π f t + φ ) θ 2 ( t ) = θ max sin ( 2 π f t + ϕ + φ ) ,
where h 1 ( t ) and h 2 ( t ) are the heave displacement of foil 1 and foil 2, respectively. θ 1 ( t ) and θ 2 ( t ) are the pitch displacement of foil 1 and foil 2, respectively. f is the frequency of the motion, ϕ is the phase angle between heave and pitch, φ is the phase difference between the two foils. To illustrate this, φ = 0 represents the in-phase oscillation; φ = π represents the out-of-phase oscillation.
The velocity equation is derived by differentiating the equation of motion provided as follows:
{ h 1 ( t ) = 2 π f h max sin ( 2 π f t + φ ) θ 1 ( t ) = 2 π f θ max sin ( 2 π f t + ϕ ) h 2 ( t ) = 2 π f h max sin ( 2 π f t + φ ) θ 2 ( t ) = 2 π f θ max sin ( 2 π f t + ϕ + φ ) ,
where h 1 ( t ) and h 2 ( t ) are the heave speed of foil 1 and foil 2, respectively. θ 1 ( t ) and θ 2 ( t ) are the pitch speed of foil 1 and foil 2, respectively.
In this study, chord length c = 0.3 m, span s = 1 m, the distance between two foils L = L / c = 1.8 , the separation between the location of the pivot and the leading edge l = 0.2 c , heave amplitude h max = 0.5 c , pitch amplitude θ max = π / 6 , phase angle ϕ = π / 2 , and the frequency of the motion f = 1 Hz. The Strouhal number S t = 2 f A max / U ¯ , where U ¯ is the average velocity at the outflow once the flow has stabilized.

2.2. Mechanical Parameters and Pumping Indicators

The evaluation of hydrodynamic performance in flapping hydrofoils primarily relies on the measurement of two crucial parameters. The formulas are defined as follows:
The instantaneous thrust coefficient is defined as:
C T ( t ) = 2 F T ( t ) ρ U ¯ 2 s c ,
The instantaneous lift coefficient is defined as:
C L ( t ) = 2 F L ( t ) ρ U ¯ 2 s c ,
The average thrust coefficient is defined as:
C T ¯ = 1 T t t + T C T ( t ) d t ,
The average lift coefficient is defined as:
C L ¯ = 1 T t t + T C L ( t ) d t ,
where ρ is the fluid’s density and s is the span of the foil.
The average input power of dual foils during one period of motion is defined as:
P in ¯ = 1 T ( | t t + T F L ( t ) h ( t ) d t | + | t t + T M ( t ) θ ( t ) d t | ) ,
where M ( t ) is the instantaneous torque around the shaft.
To facilitate a more comprehensive investigation into the pumping capabilities of the hydrofoil, a number of performance parameters were utilized for the study. The formulas are presented below:
The average flow rate of an outlet in a steady flow field is defined as:
Q ¯ = U ¯ b S ,
where b is the width of the river channel, taken as 1.4 m.
The average head is defined as:
H ¯ = Δ P ¯ ρ g ,
The pumping efficiency is defined as:
η = Δ P ¯ · Q ¯ P in ¯ ,
where Δ P ¯ is the mean pressure differential between the inlet and the outlet.

3. Numerical Method and Validation

3.1. Governing Equation and Turbulence Model’

This paper utilizes the finite volume method as well as using Fluent 2022 simulation software (Ansys, Canonsburg, PA, USA) to perform numerical simulations. To describe the characteristics of a flow field that exhibits incompressibility, two equations are employed, which are shown in the previous study [14].
The equation governing motion control can be expressed as follows:
u i ¯ x i = 0 ,
u i ¯ t + u j ¯ u i ¯ x j = 1 ρ p ¯ x i + x j [ ( γ + γ t ) ( u i ¯ x j + u j ¯ x i ) ] ,
where u i ¯ (i = 1, 2) is the fluid’s average velocity, x i (i = 1, 2) is the space coordinate, P is the fluid’s pressure, γ is the kinematic viscosity coefficient, γ t = c μ k 2 / ε is the turbulent viscosity coefficient, k is the turbulent kinetic energy, ε is the dissipation rate of the turbulent energy, and c μ is the constant.
Throughout the process of motion, vortices are generated, moved, and shed by the hydrofoil’s edges. The Realizable turbulence model is capable of effectively capturing the intricate flow field information. Additionally, the computational burden associated with this model is of moderate magnitude. Hence, the Realizable k-ε turbulence model has been chosen for this study. The relevant equations for this model can be found in the previous work [31].

3.2. Computational Domain and Mesh Generation

The utilization of computing capabilities and the mitigation of negative volume in the mesh are critical considerations in the numerical simulation of hydrofoil motion. To address these concerns, the overlapping mesh technique is employed.
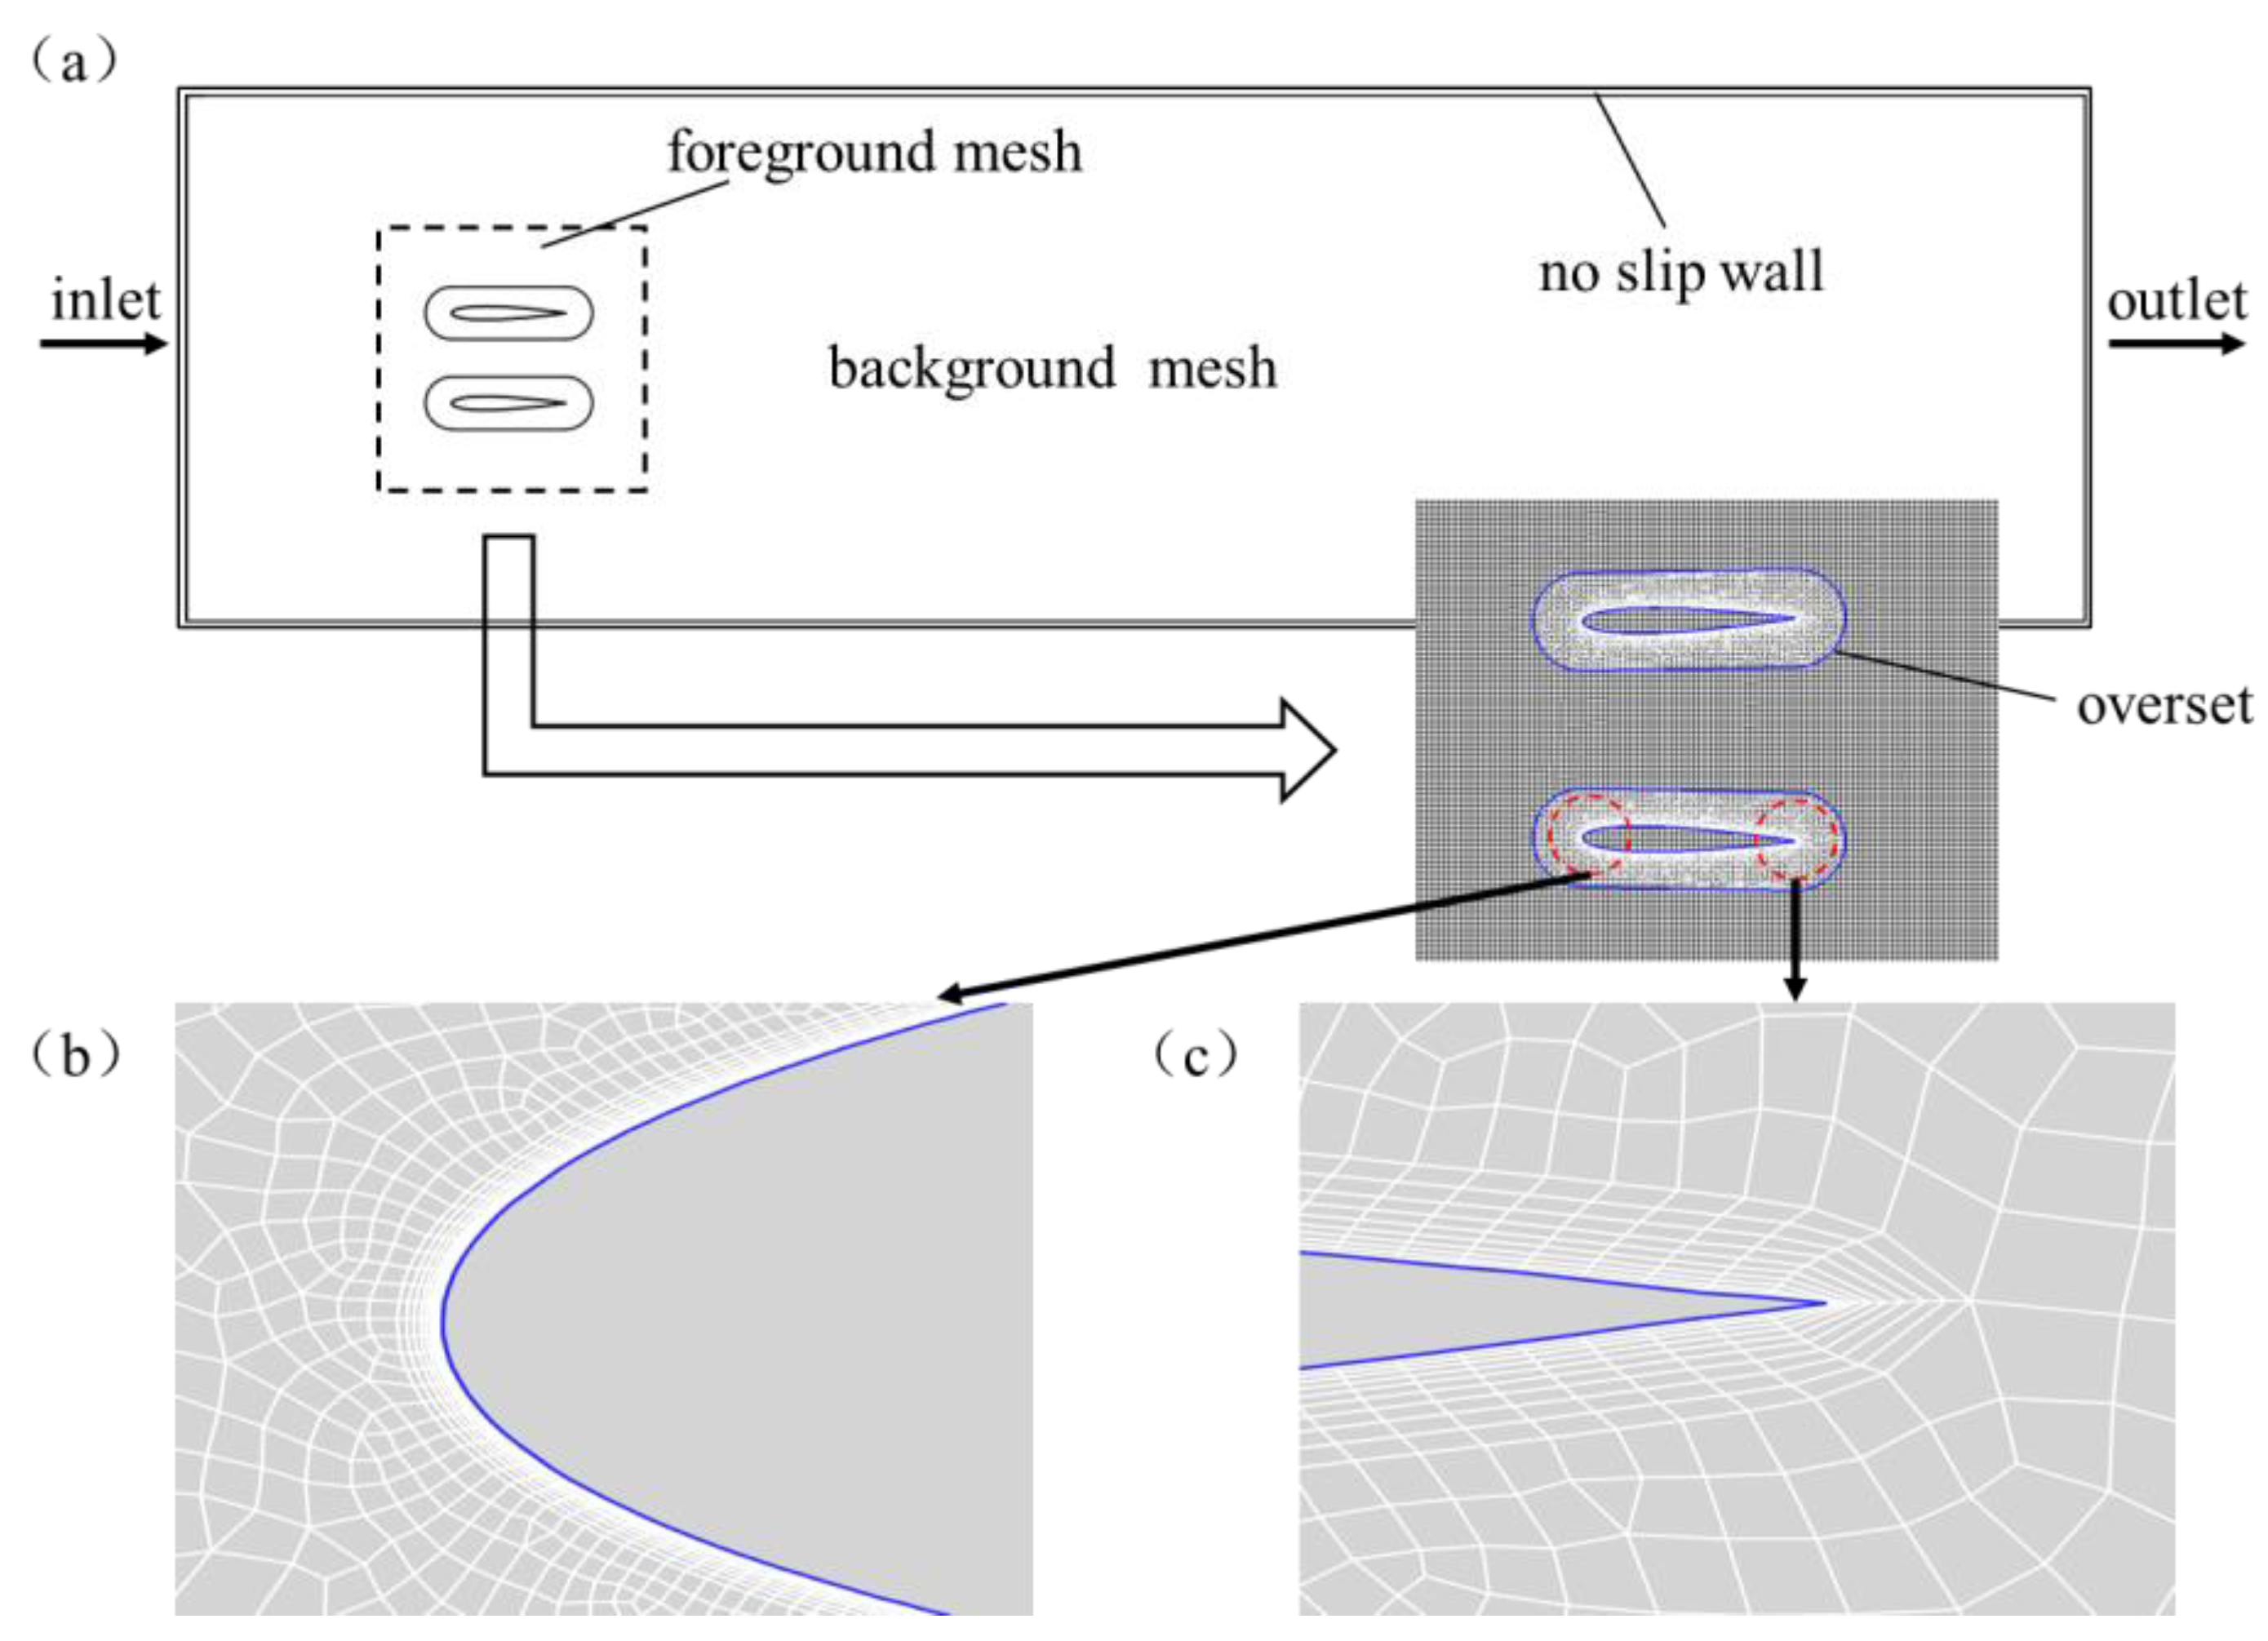
In order to acquire a comprehensive wake flow field of the dual flapping foils, a fluid domain with dimensions of 5 m in length and 1.4 m in width was selected. In Figure 3, the computational domain comprises a foreground and background grid. The primary grid, referred to as the foreground grid, consists of a hybrid grid configuration. Due to the curved shape and complex geometry of the flapping foil used in this paper, the structured grid is not applicable, so a hybrid grid is chosen. In contrast, the secondary grid, known as the background grid, is constructed utilizing a structured grid format featuring a uniform global size of 0.008 m. The two sets of grids are numerically calculated by removing the area in the background grid corresponding to the foreground grid. Then, the adjacent grid cells are interpolated to transfer the data. Hence, in order to enhance the accuracy of calculations, the global dimensions of both grids are configured to be identical.
Different turbulence models and different wall functions require different grid Y+ values. To enhance the accurate representation of the dynamic wall characteristics and mitigate numerical dispersion, it is imperative to build boundary layers on both sides of the flow channel and hydrofoil wall. Hence, the initial mesh size of the boundary layer adjacent to the hydrofoil surface is established at 0.03 mm, satisfying Y+ < 1 and a growth rate of 1.2.

3.3. Boundary Conditions and Parameter Settings

In this paper, in the context of boundary condition configuration, the left boundary is assigned the pressure-inlet condition, while the right boundary is assigned the pressure-outlet condition. The hydrofoil boundary and the walls flanking the flow channel are designated as no-slip walls. The outermost boundary line of the foreground grid is designated as an overset boundary, while the overlapping region between the foreground grid and the background grid is designated as a grid overlap region, as shown in Figure 3.
The oscillation mode of the hydrofoil is given via the User Defined Functions (UDF). Within the solution settings, it is necessary to choose a transient solver. The corresponding parameter settings are given in the previous study [32].

3.4. Verification of the Irrelevance of the Time Steps and Grid Number

In the context of computational fluid dynamics (CFD), the accuracy and efficiency of numerical computations are influenced by the sparsity of the grid and the time step [33]. Hence, it is imperative to examine the correlation between the grid number, the time step, and the computational results. By verifying the independence of these factors, we can enhance the precision and dependability of the computed outcomes. The validation conditions are: heave amplitude, h max = 0.15   m ; pitch amplitude, θ max = 30 ° ; flapping frequency, f = 1 Hz; and inlet flow rate, U = 0.4   m / s .
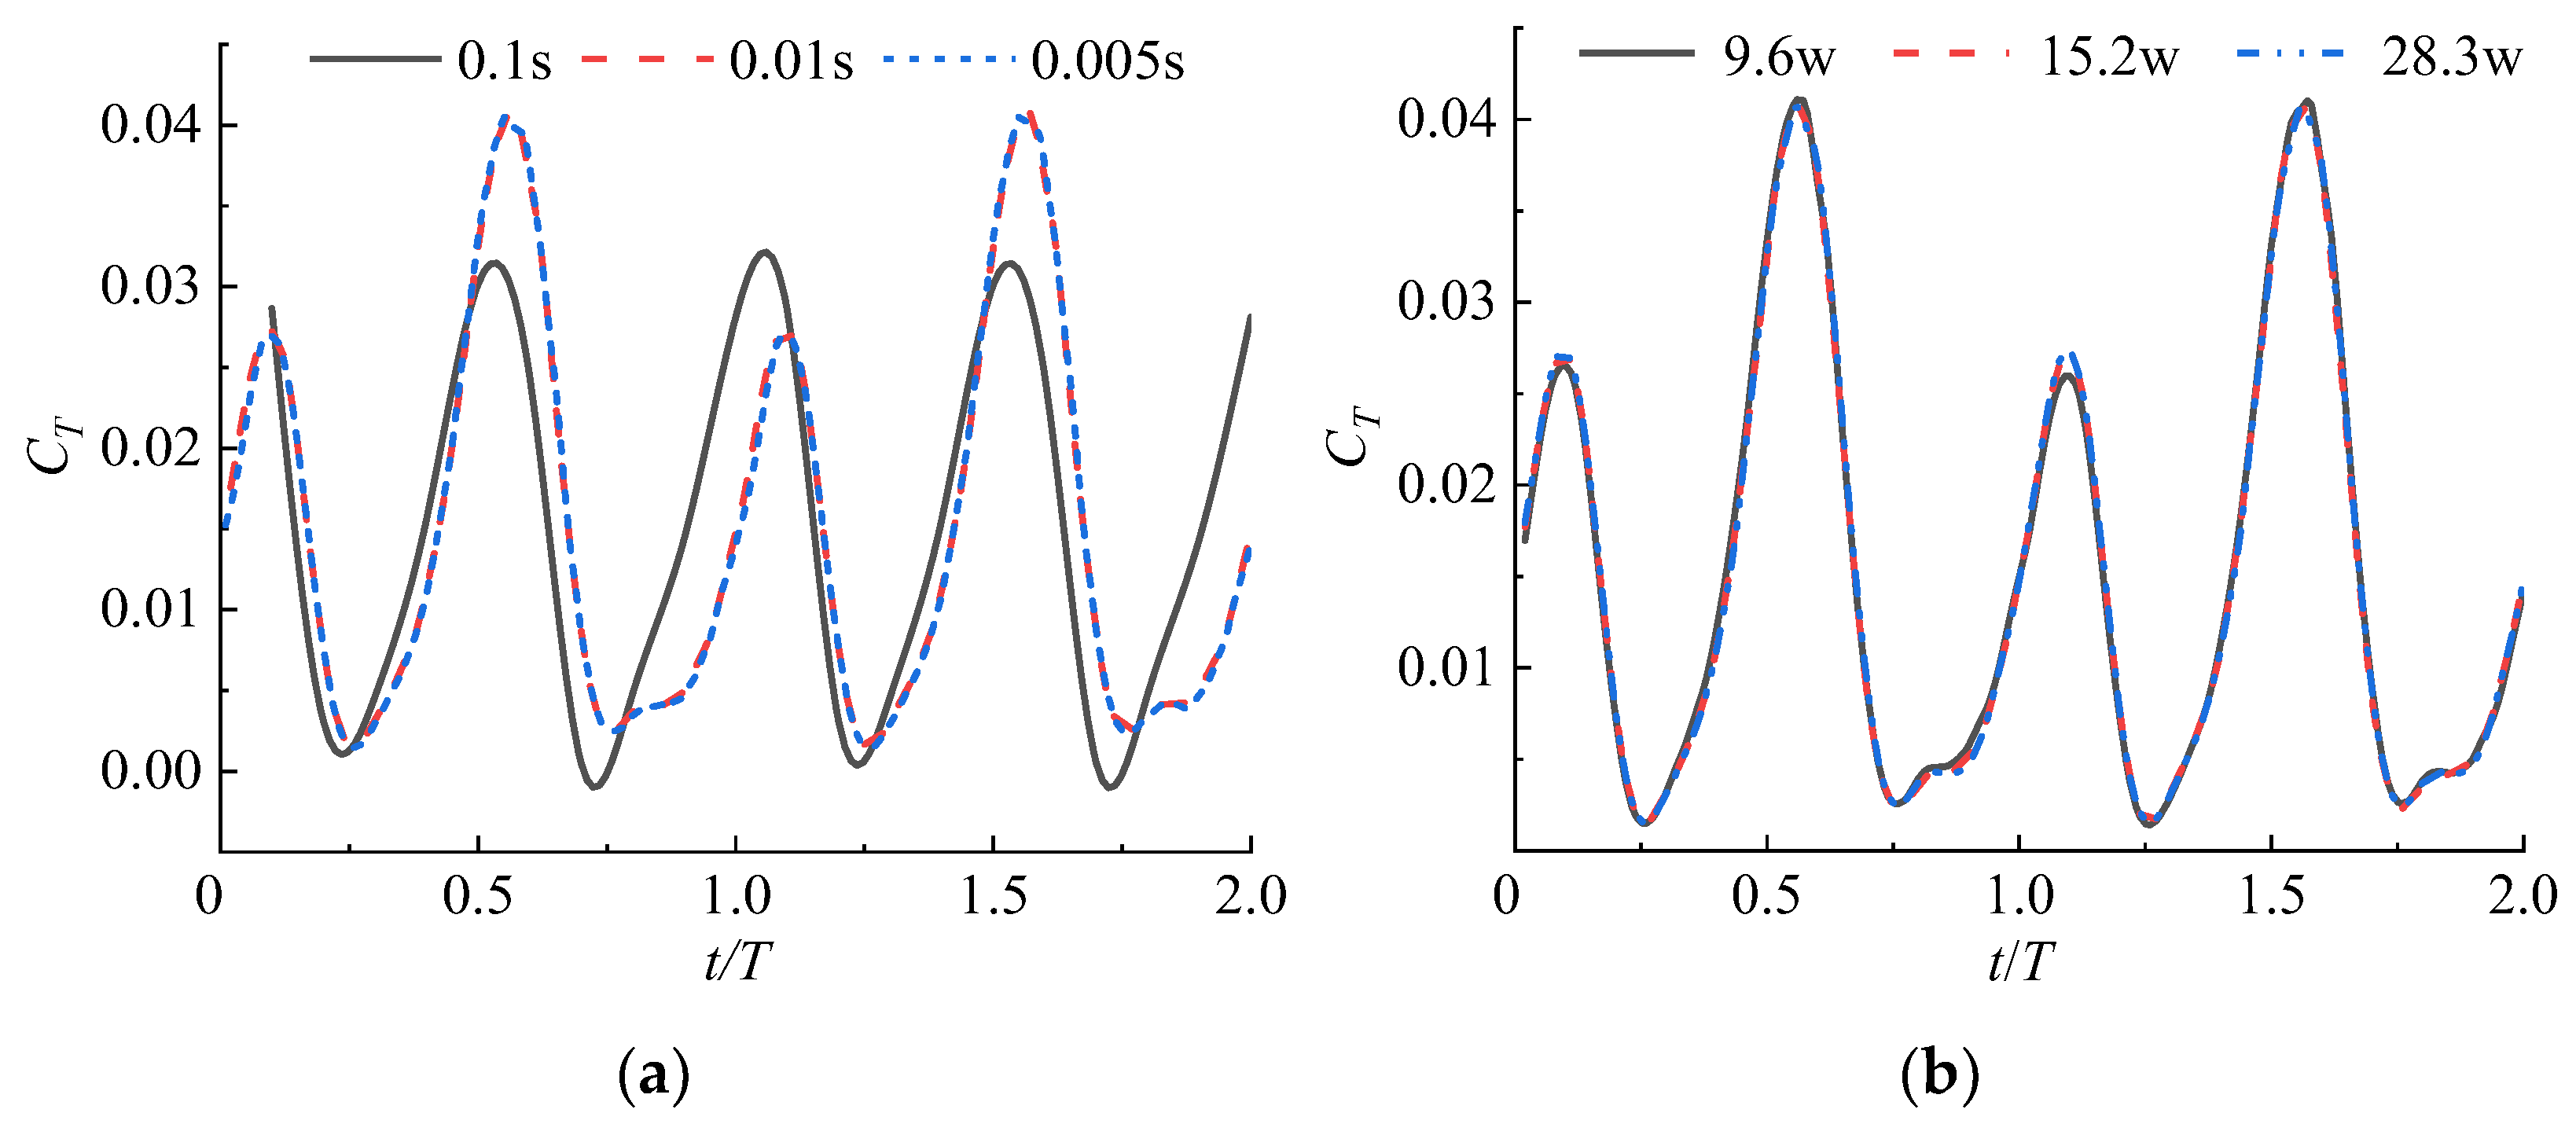
To validate the irrelevance of the time steps, we chose three sets of data, which are 0.1 s, 0.01 s, and 0.005 s. As shown in Figure 4a, through comparison it was found that when the time step was 0.1 s, the instantaneous thrust coefficient obtained from the simulation was more different than the other two, so 0.01 s was ultimately chosen for the following calculation considering the calculation accuracy and efficiency.
To validate the irrelevance of the grid number, three sets of grid numbers, 96,000, 152,000, and 283,000, were selected for numerical calculations. As shown in Figure 4b, through comparison it was found that the results obtained from the three sets of grids are similar, so the grid of 152,000 was ultimately chosen for the subsequent calculation considering the calculation accuracy and efficiency.

3.5. Validation

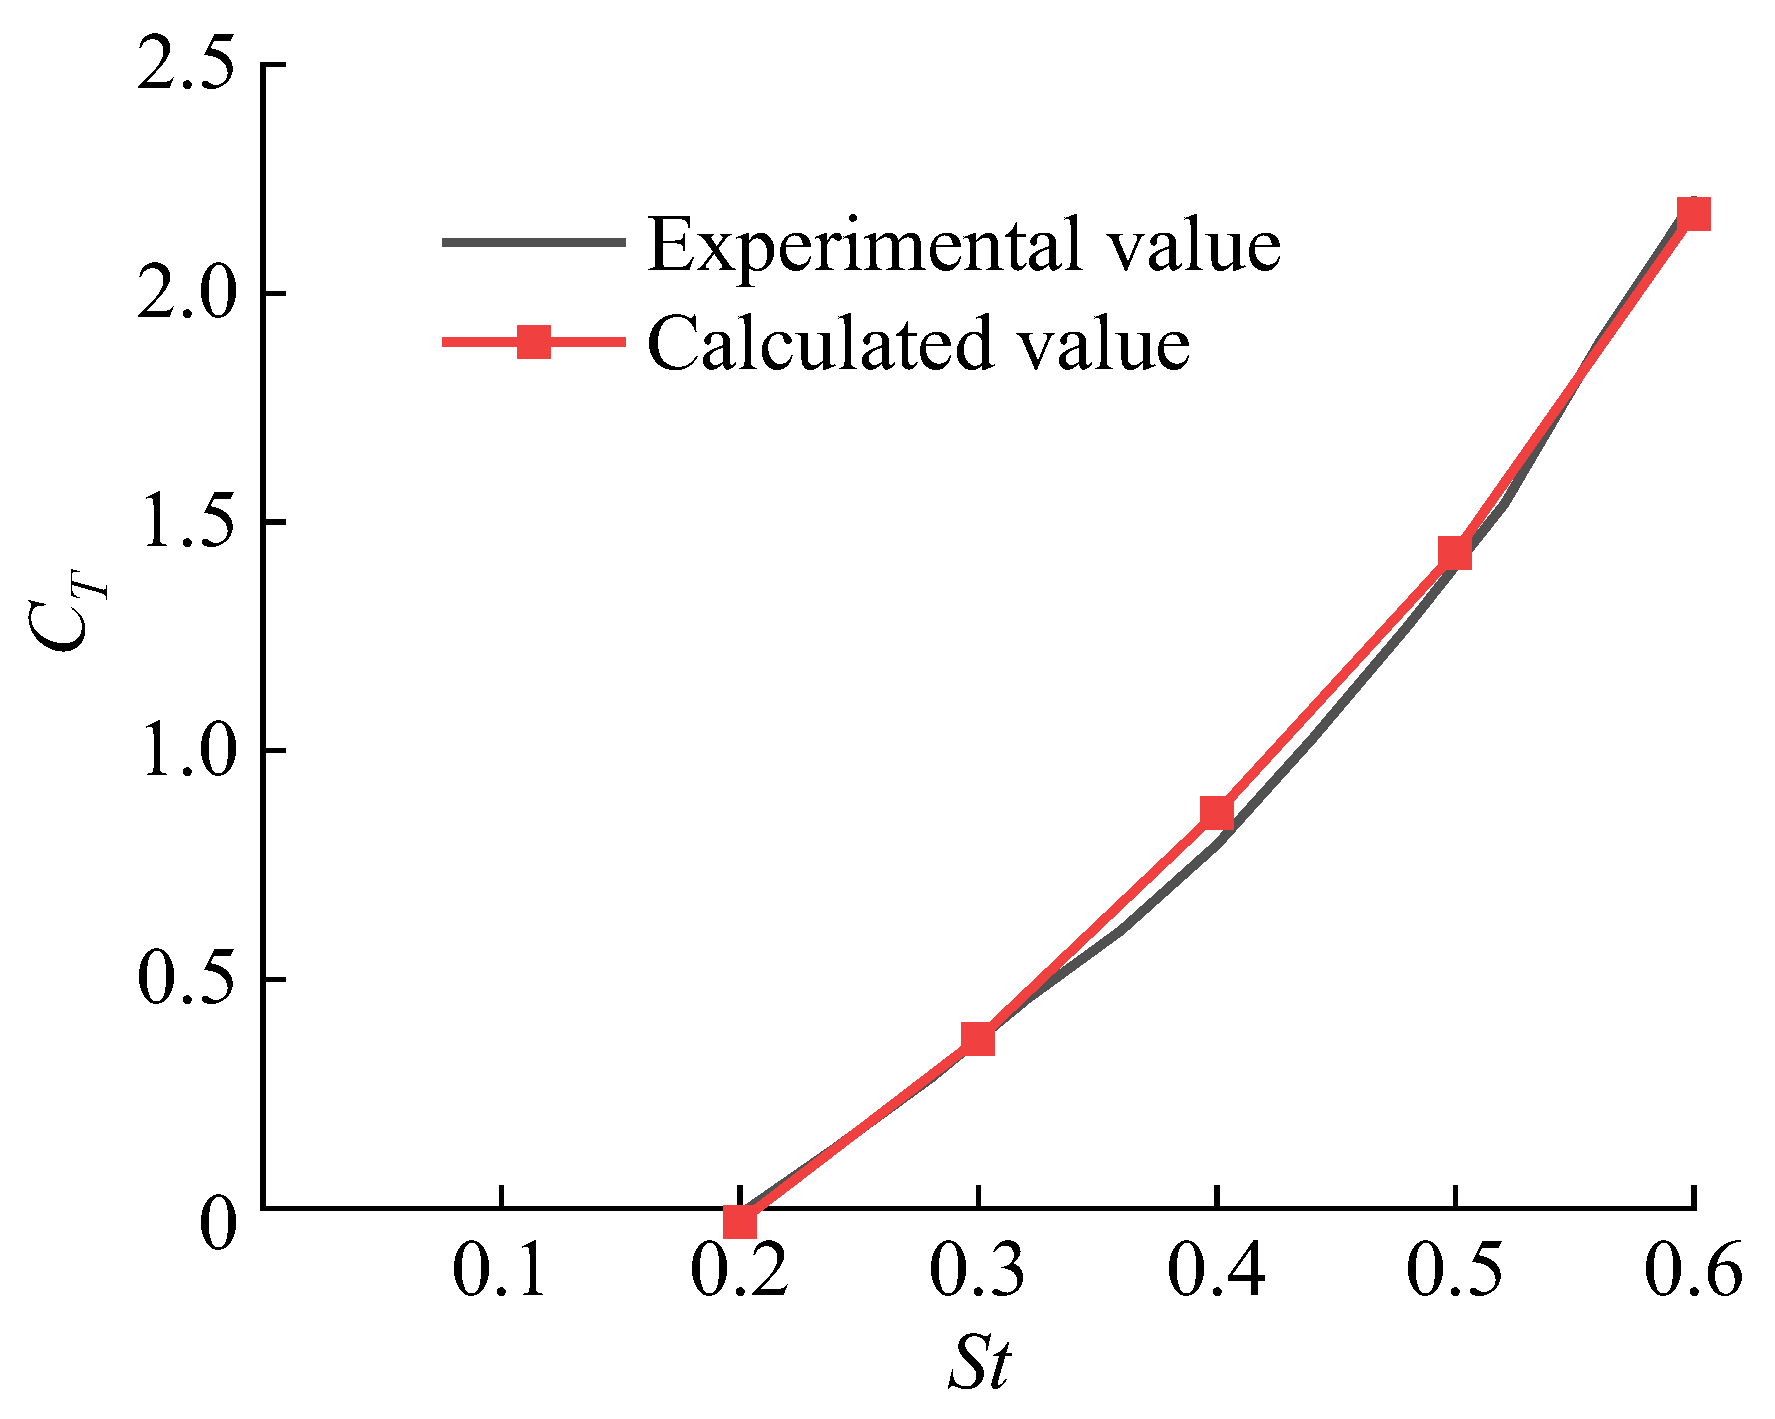
To authenticate the validity of the computational simulation method, a comparative analysis was conducted using the experimental data obtained from the towed tank laboratory at MIT (Cambridge, MA, USA) [33]. The computational model uses the NACA0012 hydrofoil with chord length c = 0.1   m . The simulation parameters were set in accordance with the experimental working parameters of the previous study [33]: The domain’s capacity was 20 c × 15 c ; inlet velocity U = 0.4   m / s ; phase angle ϕ = 90 ° ; heave amplitude and chord length h max = c = 0.1   m ; maximum angle of attack α max = 35 ° ; Strouhal number S t = 2 f h max / U ; and the frequency of the motion f = 1 Hz.
The findings are depicted in Figure 5. The outcomes of the simulations correspond to the observed patterns of variation in the experimental data from the previous study. Hence, the effectiveness of the computational method utilized has been shown.

4. Experimental Setup

4.1. Bionic Pumping Device

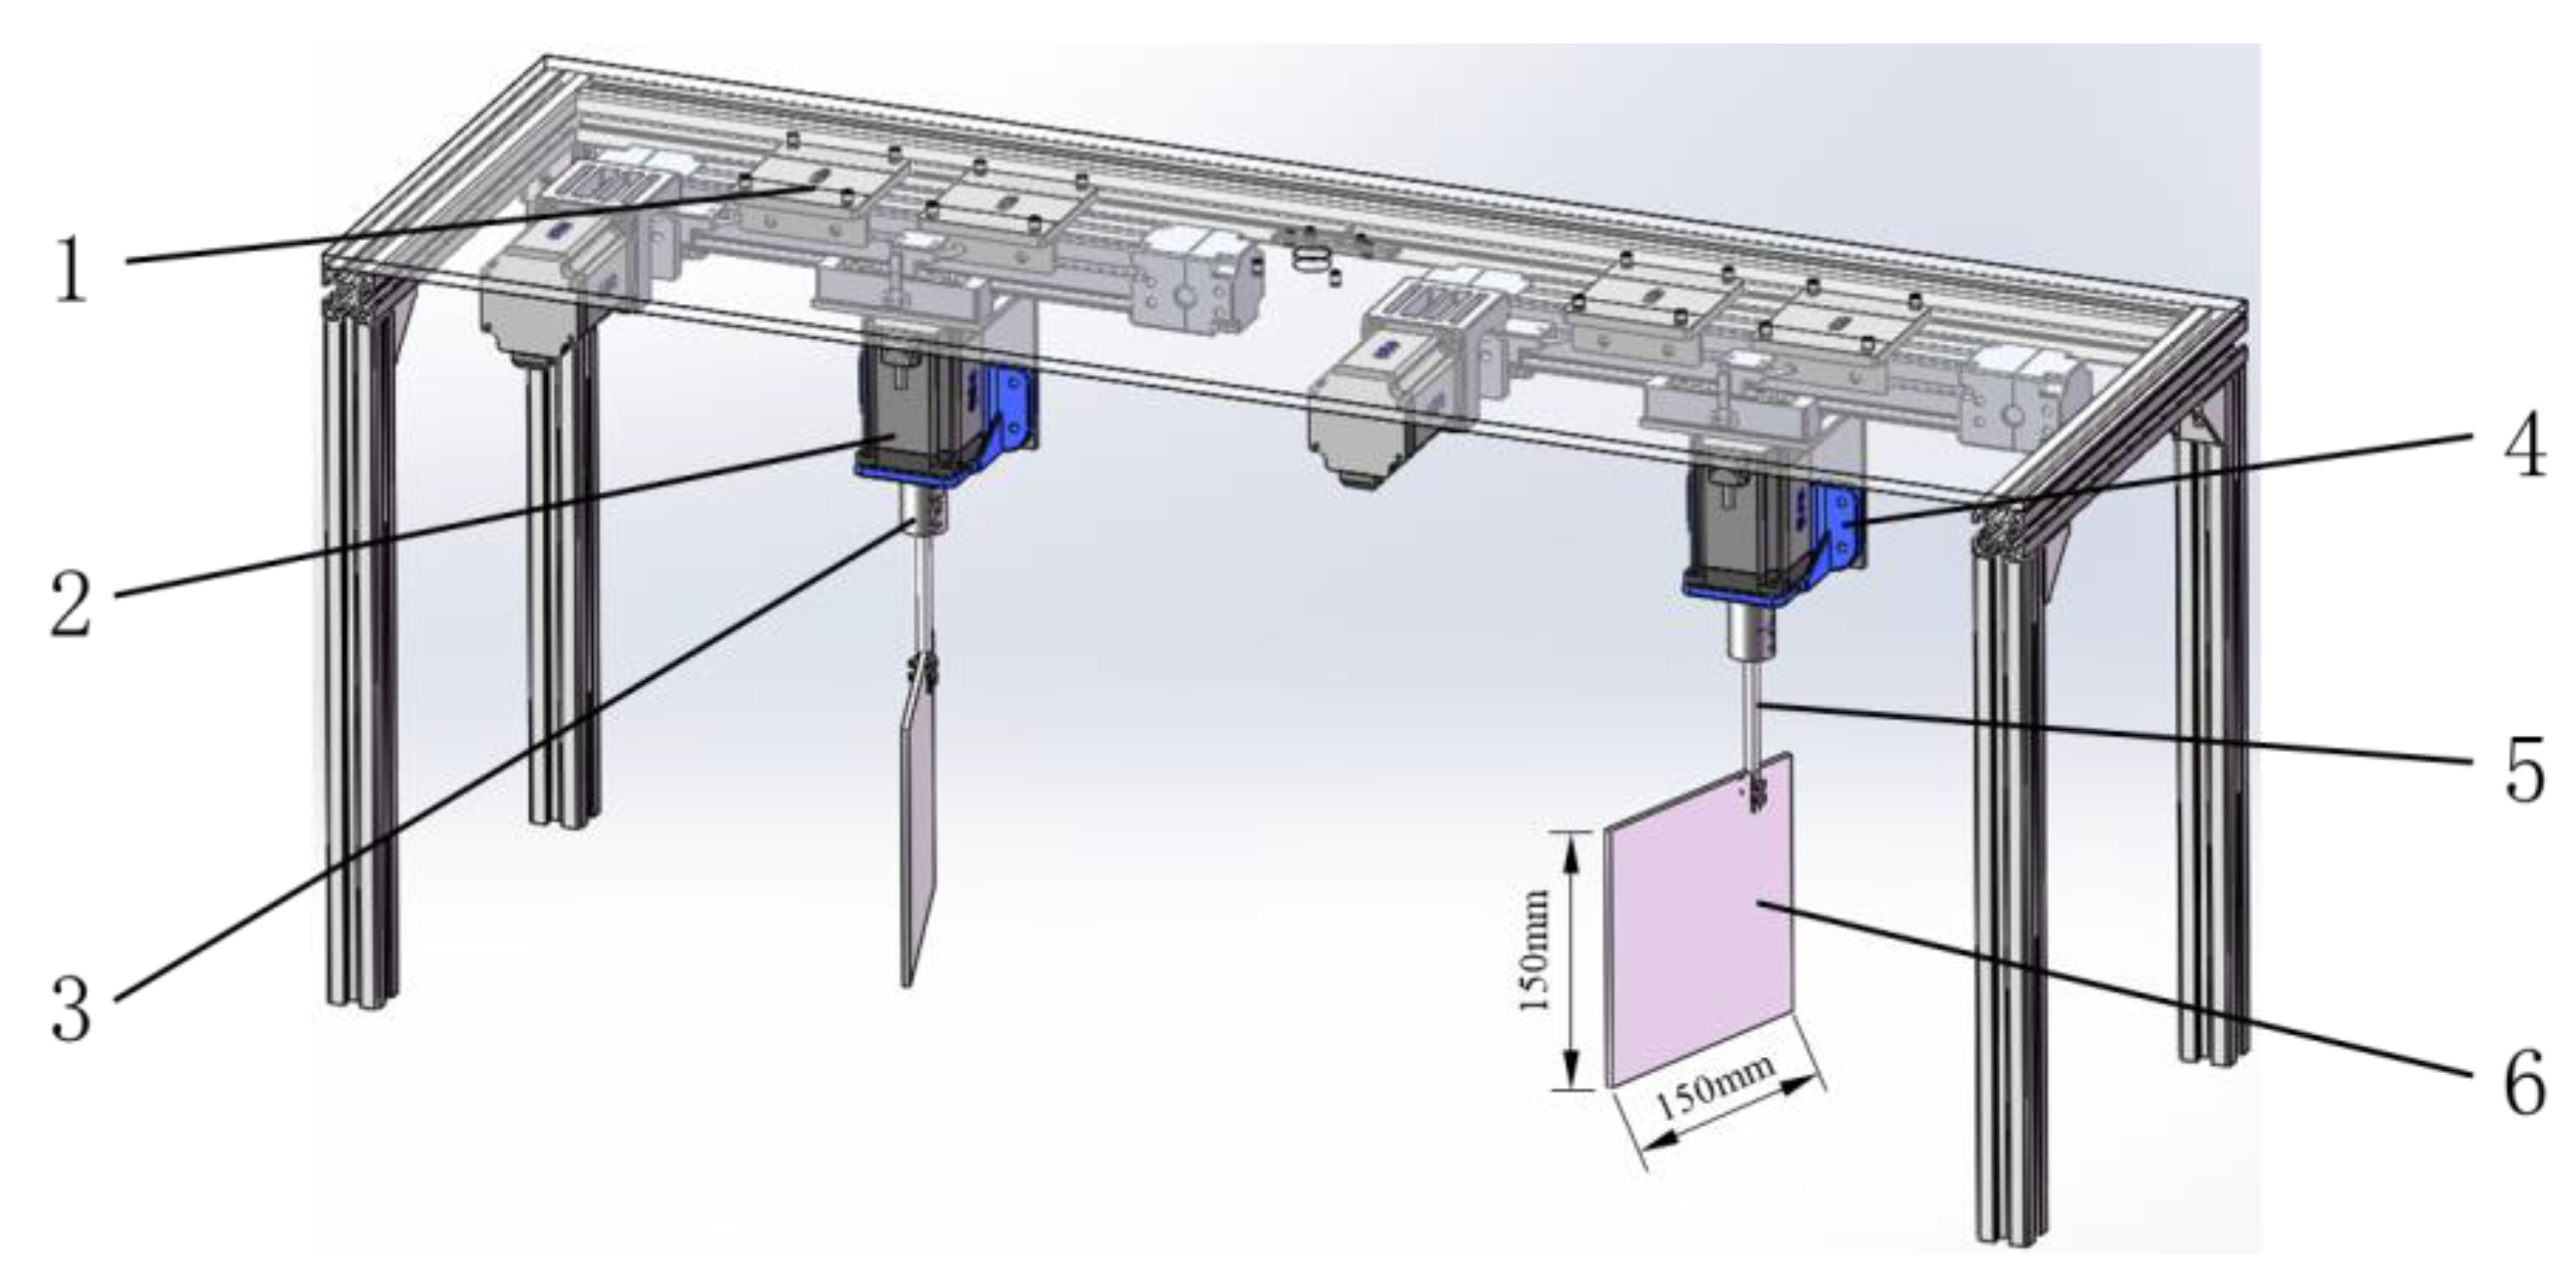
To verify the effects of the dual foil’s in-phase and out-of-phase oscillations on its pumping performance and to evaluate the accuracy of the numerical calculations, a bionic pumping device incorporating dual flapping foils was developed. The experimental apparatus was created using two sets of synchronous belt linear modules and motors, both motor-driven and controlled by actuators, to meet the demand for the compound harmonic motion of the dual flapping foils. Figure 6 illustrates the schematic diagram of the dual flapping foils device in three dimensions.
In this study, the dual flapping foils bionic pump included passage and water flapping foils. The hydrofoil’s chord length was 150 mm and clearance between the hydrofoils and the top and bottom sides of the passage was 5 mm. Figure 7 shows a dual flapping foil device test bench. The test set was built on a 2.5 m × 0.7 m × 0.16 m rectangular passage, as illustrated in Figure 7a. In addition, Figure 7b illustrates the internal schematic diagram of the experimental flow passage.
This study employs the WIM-@ADV acoustic Doppler flowmeter (Beijing, China) for the purpose of experimental data acquisition. The flowmeter is utilized to monitor the average flow velocity at the outlet section. It has a flowmeter velocity measurement range from 0 to 3 m/s, with a measurement accuracy of 0.005 m/s, and a maximum sampling frequency of 50 Hz. The differential pressure sensor (Jiangsu, China) was set on the flow passage’s inlet and outlet side panels, with a measuring range up to 300 Pa and a minimal scale of 0.2 Pa. In addition, the input power of the power supply side of the motor was measured via the electrical measurement method using a clamp power meter (Shanghai, China).

4.2. Uncertainty Analysis

The synthesis error of the test includes systematic and random errors, which are calculated as follows:
E η = ± E η S 2 + E η R 2 ,
E η , S = ± E Q S 2 + E H S 2 + E P S 2 ,
E η , R = ± E Q R 2 + E H R 2 + E P R 2 ,
where E η S and E η R are the systematic errors and the random errors; E Q S , E H S , and E P S are the systematic error of the Doppler flowmeter, differential pressure sensor, and clamp power meter, respectively; E Q R , E H R , and E P R are the random error of flow testing, head testing, and torque speed testing. These systematic error parameters are shown in Table 1.
Through the model test data, the total random error is counted using probabilistic statistical methods, and finally the total uncertainty of the experiment is calculated, for which the E η was ±4.05%.
To ensure the test bench’s reliability, the bionic pumping device underwent multiple tests in the out-of-phase oscillation mode. These tests were conducted at a flapping frequency ranging from 0.1 to 0.8 Hz, using consistent test methods and working conditions. The findings, presented in Table 2, demonstrate that the flow rate pattern of the device remains consistent across the three tests. Moreover, the information gathered under comparable workplace circumstances is extremely similar, confirming that the test results are reliable.

5. Results and Analysis

5.1. Influence of Two Oscillation Modes on Mechanical Properties

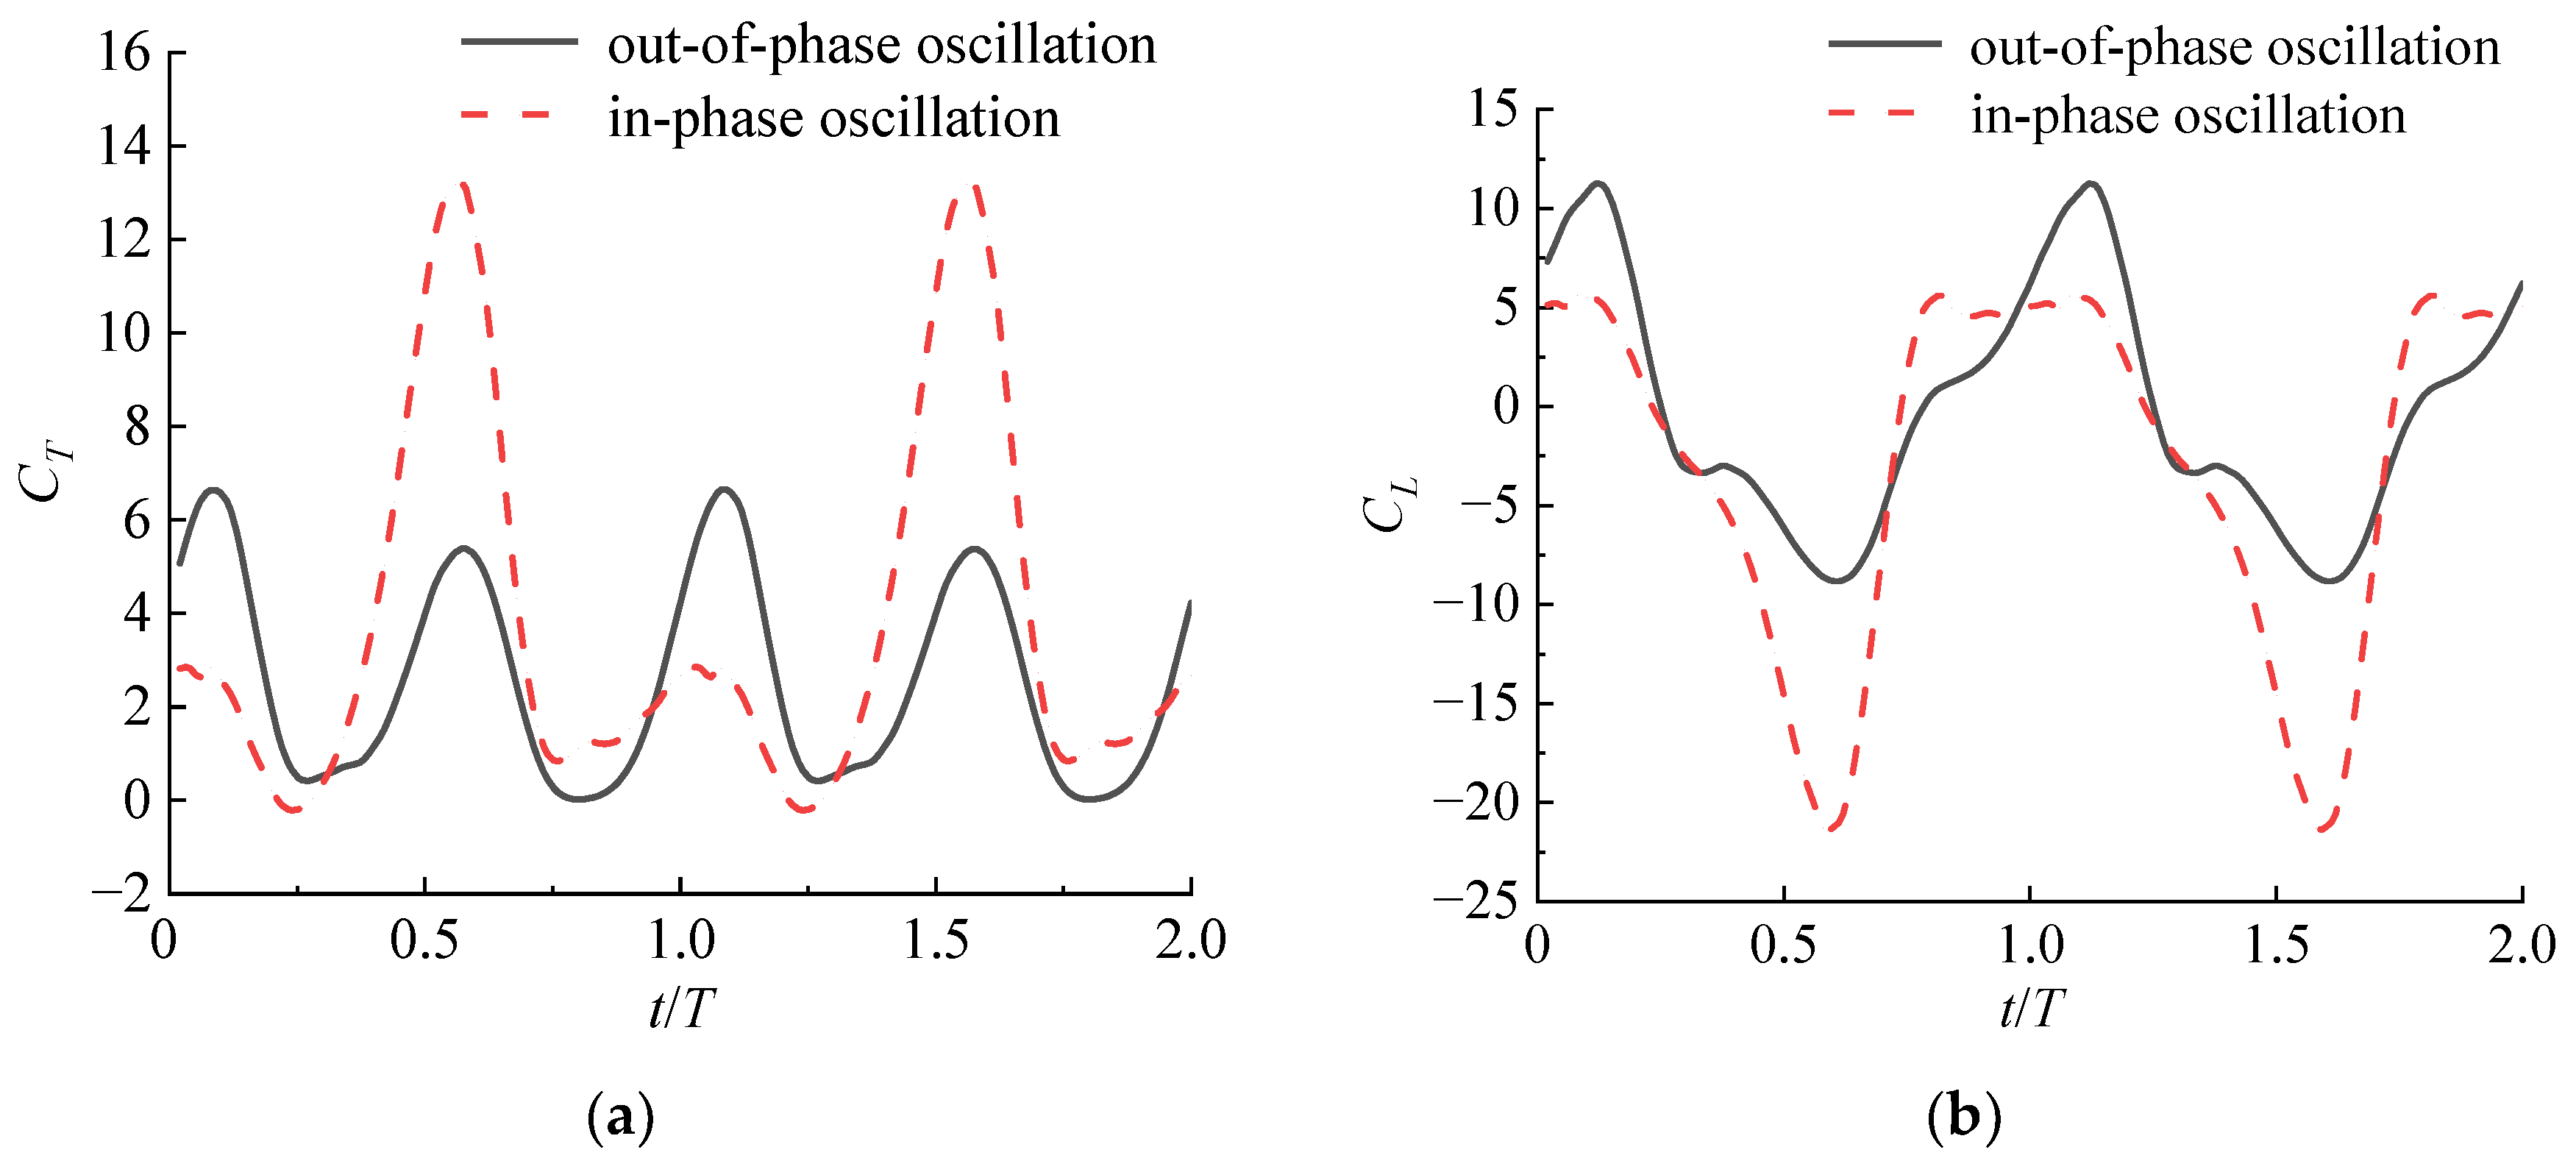
To investigate the effect of the two oscillation modes on the mechanical characteristics of the foils, the corresponding instantaneous thrust and lift coefficients were calculated and plotted for the oscillation frequency f = 1 Hz. Both were analyzed for foil 1; Figure 8 shows the results.
To enable a comprehensive comparison, the horizontal coordinate was established by taking into account the values of the dimensionless time for each corresponding period. Figure 8a shows the instantaneous thrust coefficient curves corresponding to the two oscillation modes. Figure 8a shows that the curves are periodic, with two peaks and two valleys per motion cycle. In the in-phase oscillation mode, when combined with the relative motion form of the dual flapping foils, the motion direction of the upper and lower foil is identical. In contrast, the motion is in the opposite direction in the out-of-phase oscillation mode. For the out-of-phase oscillation mode, when the foil starts to flap upward from the initial position, the thrust gradually increases and then decreases, and reaches a valley when the motion reaches the maximum heave amplitude, and when the foil starts to flap downward in the opposite direction, the thrust keeps increasing and reaches a peak after reaching the initial position, and then keeps decreasing and reaches a second valley in the amplitude position. For the in-phase oscillation mode, the thrust decreases gradually and reaches a valley when the foil begins to flap upward from the original position, then flap downward, and the thrust increases and reaches a peak after crossing the initial position.
The comparison reveals a distinct difference between the peaks and valleys of the waves for both oscillations. The thrust peaks and valleys fluctuate more in the in-phase oscillation than in the out-of-phase oscillation. In addition, the instantaneous thrust coefficient produces negative values in the in-phase oscillation mode, indicating that the oscillating motion can at times impede the motion of the water body during a motion cycle. In contrast, the instantaneous thrust coefficient for the out-of-phase oscillation mode is always positive, indicating that the oscillating motion can propel the motion of the water body throughout the entire motion cycle.
Figure 8b shows the instantaneous lift coefficient curves corresponding to the two oscillation modes. As shown in Figure 8b, in the out-of-phase oscillation mode, the instantaneous lift coefficient curve has two peaks and two valleys in one motion cycle, both near the equilibrium position, and the curve is symmetrically distributed along the zero scale. In contrast, the instantaneous lift coefficient curve fluctuates more in the in-phase oscillation mode.
Through comparison it is found that the average lift coefficient of the out-of-phase oscillation is almost zero. In contrast, the average lift coefficient of the in-phase oscillation is negative. The instantaneous lift coefficient curve of the out-of-phase oscillation is more symmetrical than the in-phase oscillation, indicating that the flow field is more uniform.

5.2. Influence of Two Oscillation Modes on the Flow Field

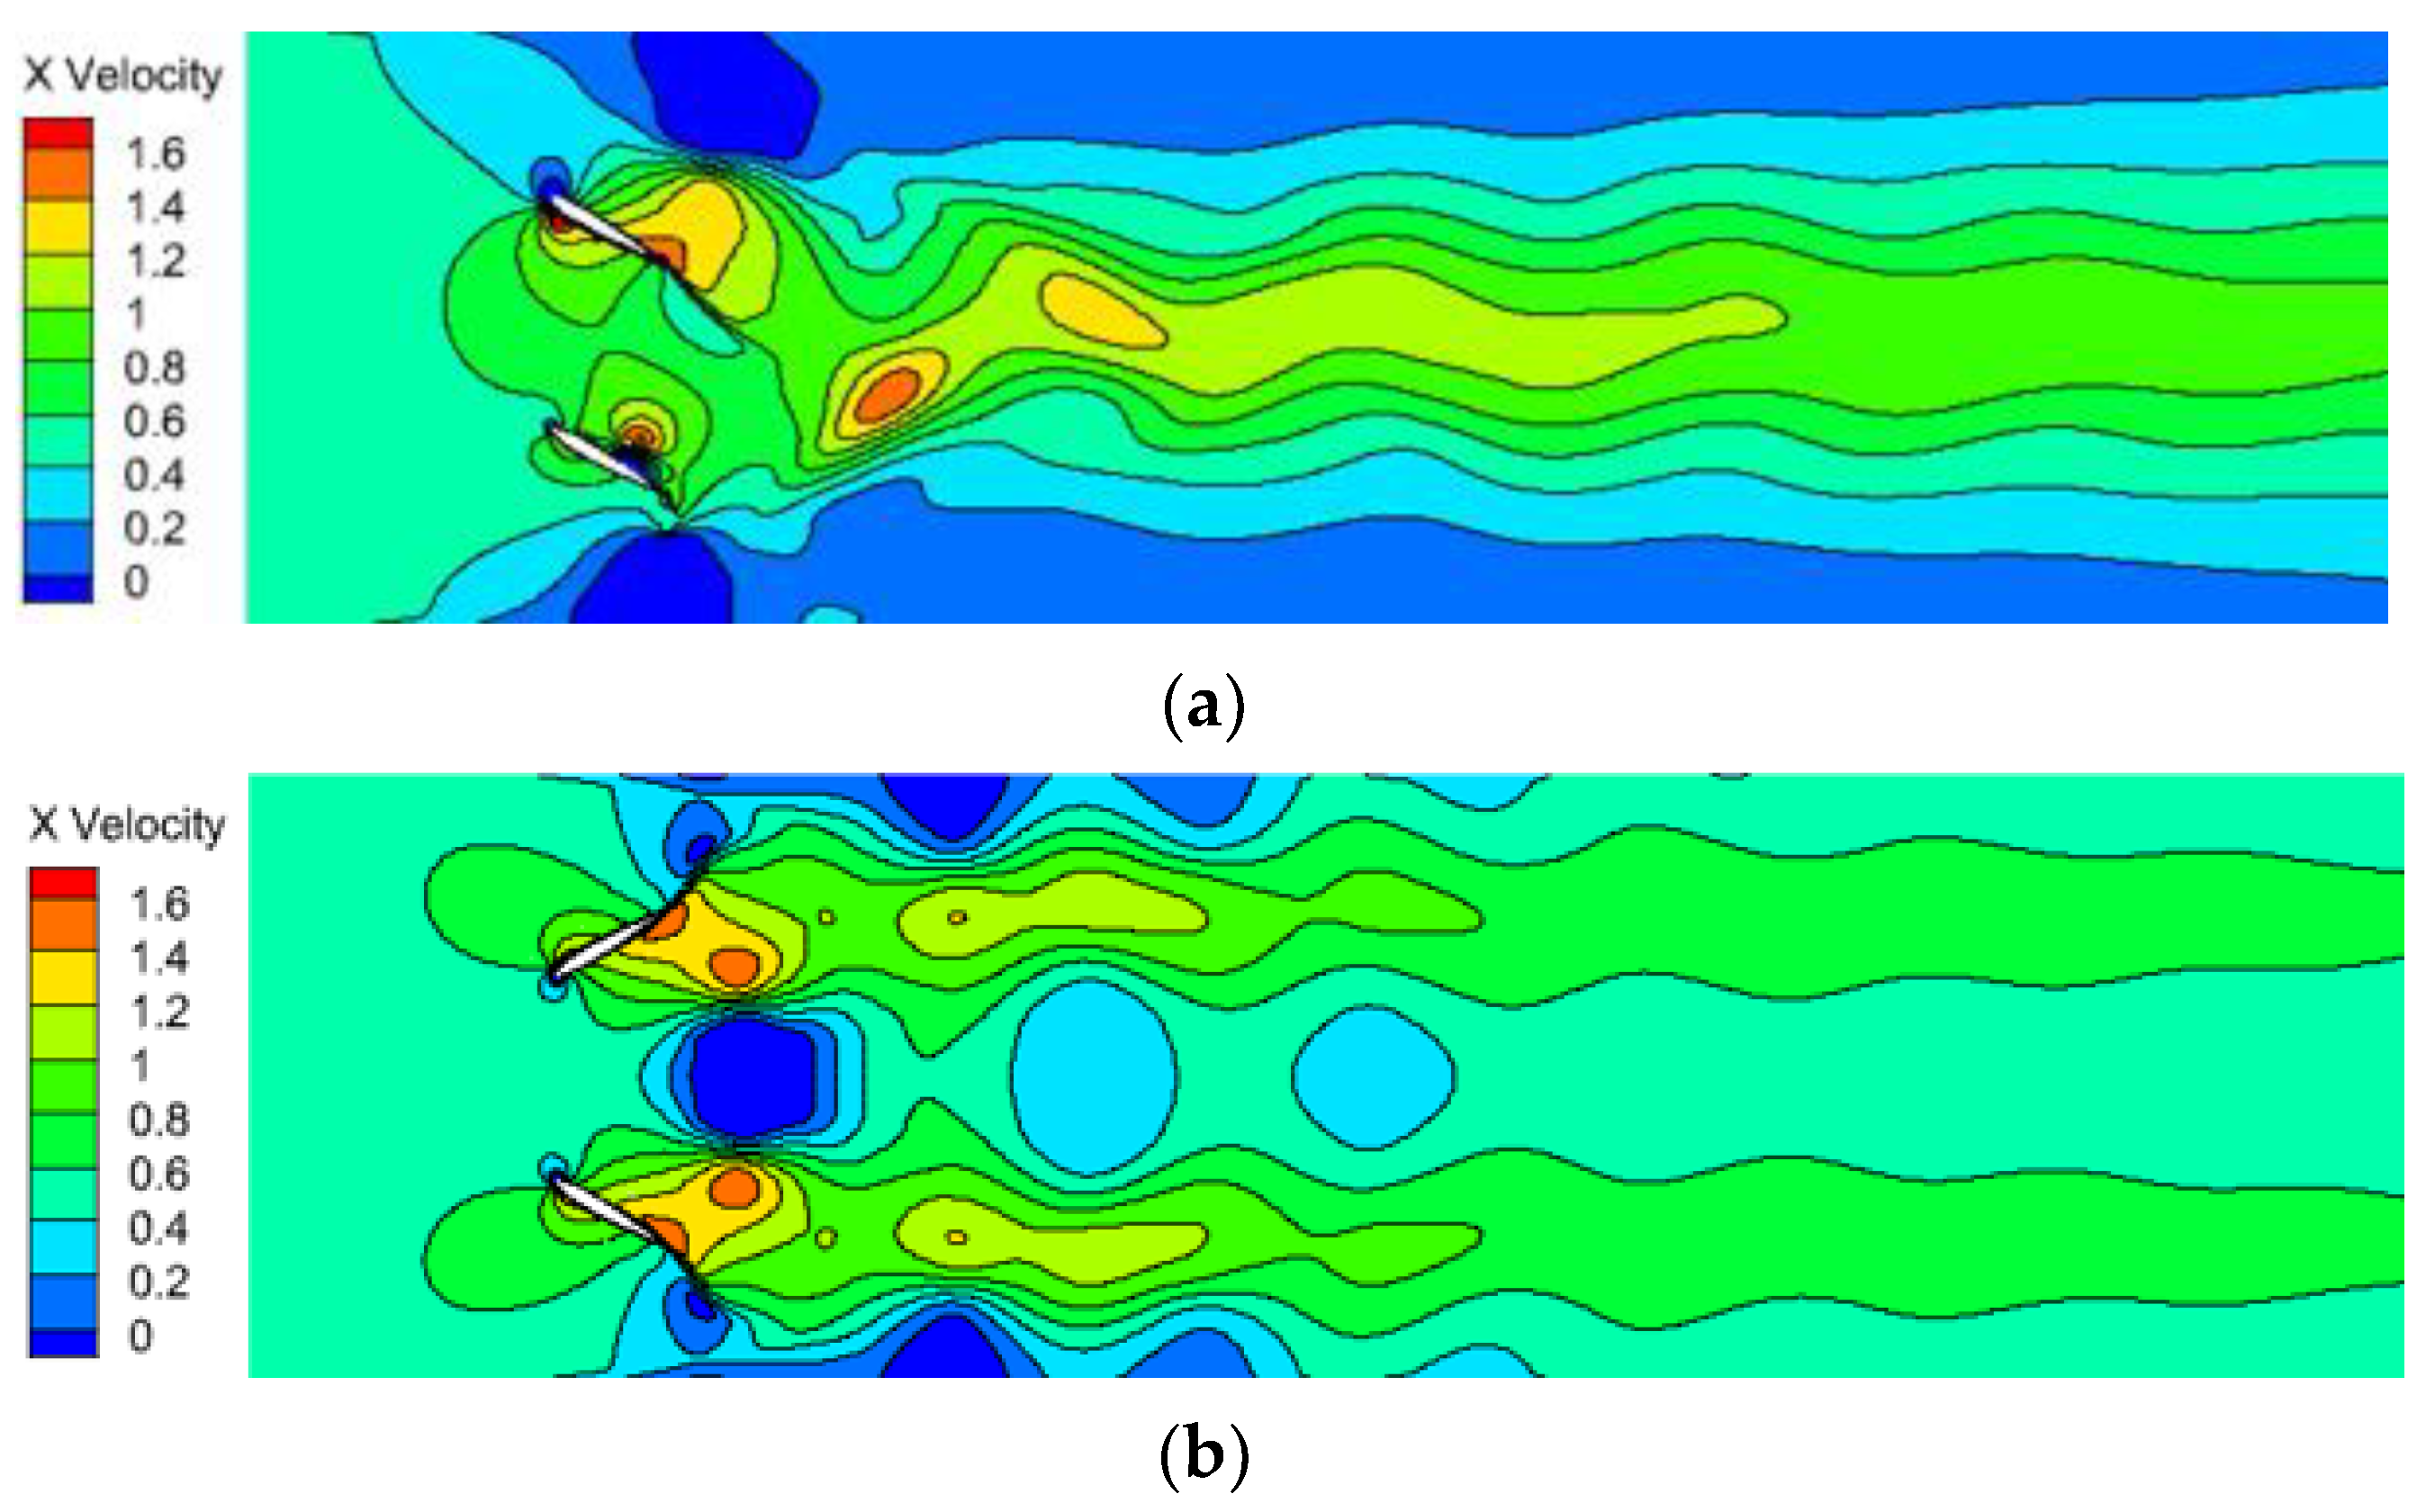
Since the propulsion effect of various oscillation modes on the water body is different, the velocity nephograms of the two oscillation modes are contrasted and examined to ascertain the disparities. Figure 9 depicts a comparison and analysis of the velocity nephograms of the two oscillation modes with the oscillation frequency f = 1 Hz.
Figure 9 presents the velocity nephograms of the two oscillation modes. Upon conducting a comparative analysis, it has been observed that the distribution patterns of the two flow fields exhibit noticeable differences. The hydrofoil’s left-side inlet exhibited a consistent and steady inflow. When the incoming flow enters, the in-phase oscillation mode moves toward the centerline of the wake between the dual flapping foils due to the interaction between the vortex pairs, forming a straight jet; at the same time, the out-of-phase oscillation mode has symmetry due to the opposite direction of the vortex formed by the two foils, forming two straight jets. In addition, the low-velocity region in the flow field near the wall area on both sides of the in-phase oscillation mode accounts for a more significant proportion of the whole region than that of the out-of-phase oscillation mode.
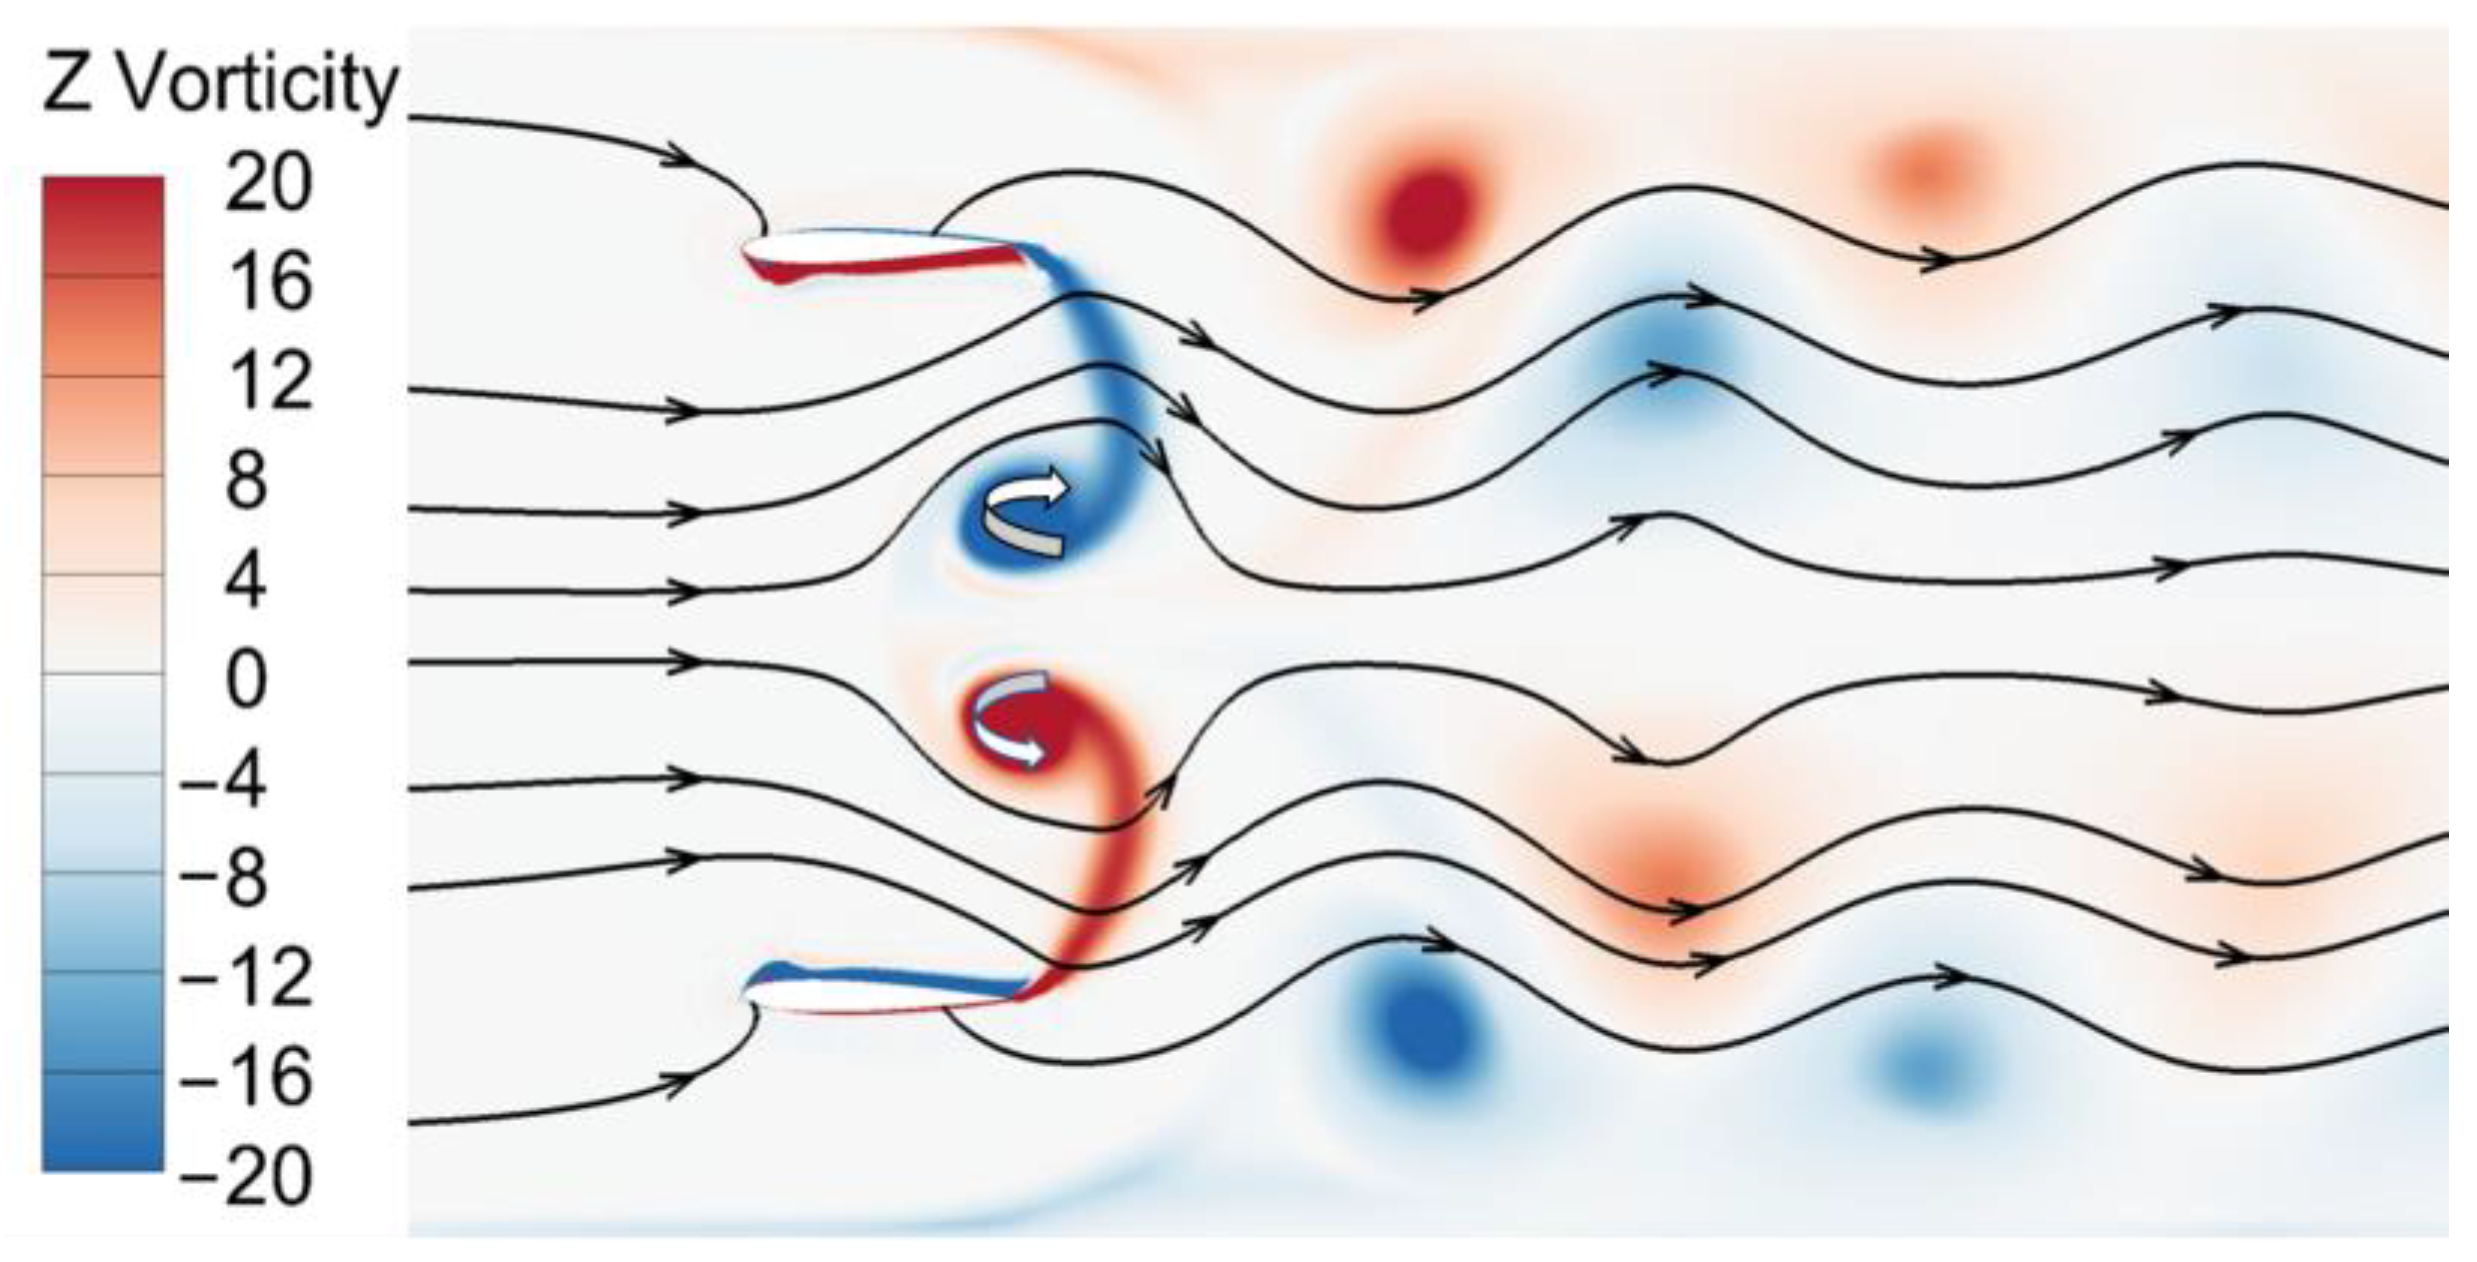
In the out-of-phase oscillation mode, the flow velocity in the middle region is reduced because, as depicted in Figure 10, when the flapping foils move to both sides, a low-pressure region is formed in the middle region, which generates a Karman vortex street, thereby creating a specific obstruction to the water flow. Figure 10 depicts the characteristics of the instantaneous flow field in the out-of-phase oscillation mode (t/T = 3/4). At this moment, two distinct vortices are formed in the trailing-edge trailing area of the dual flapping foil. The reason for this is that the upper and lower flapping foils move away from each other to produce a low-pressure region, thus forming a trailing-edge backflow.
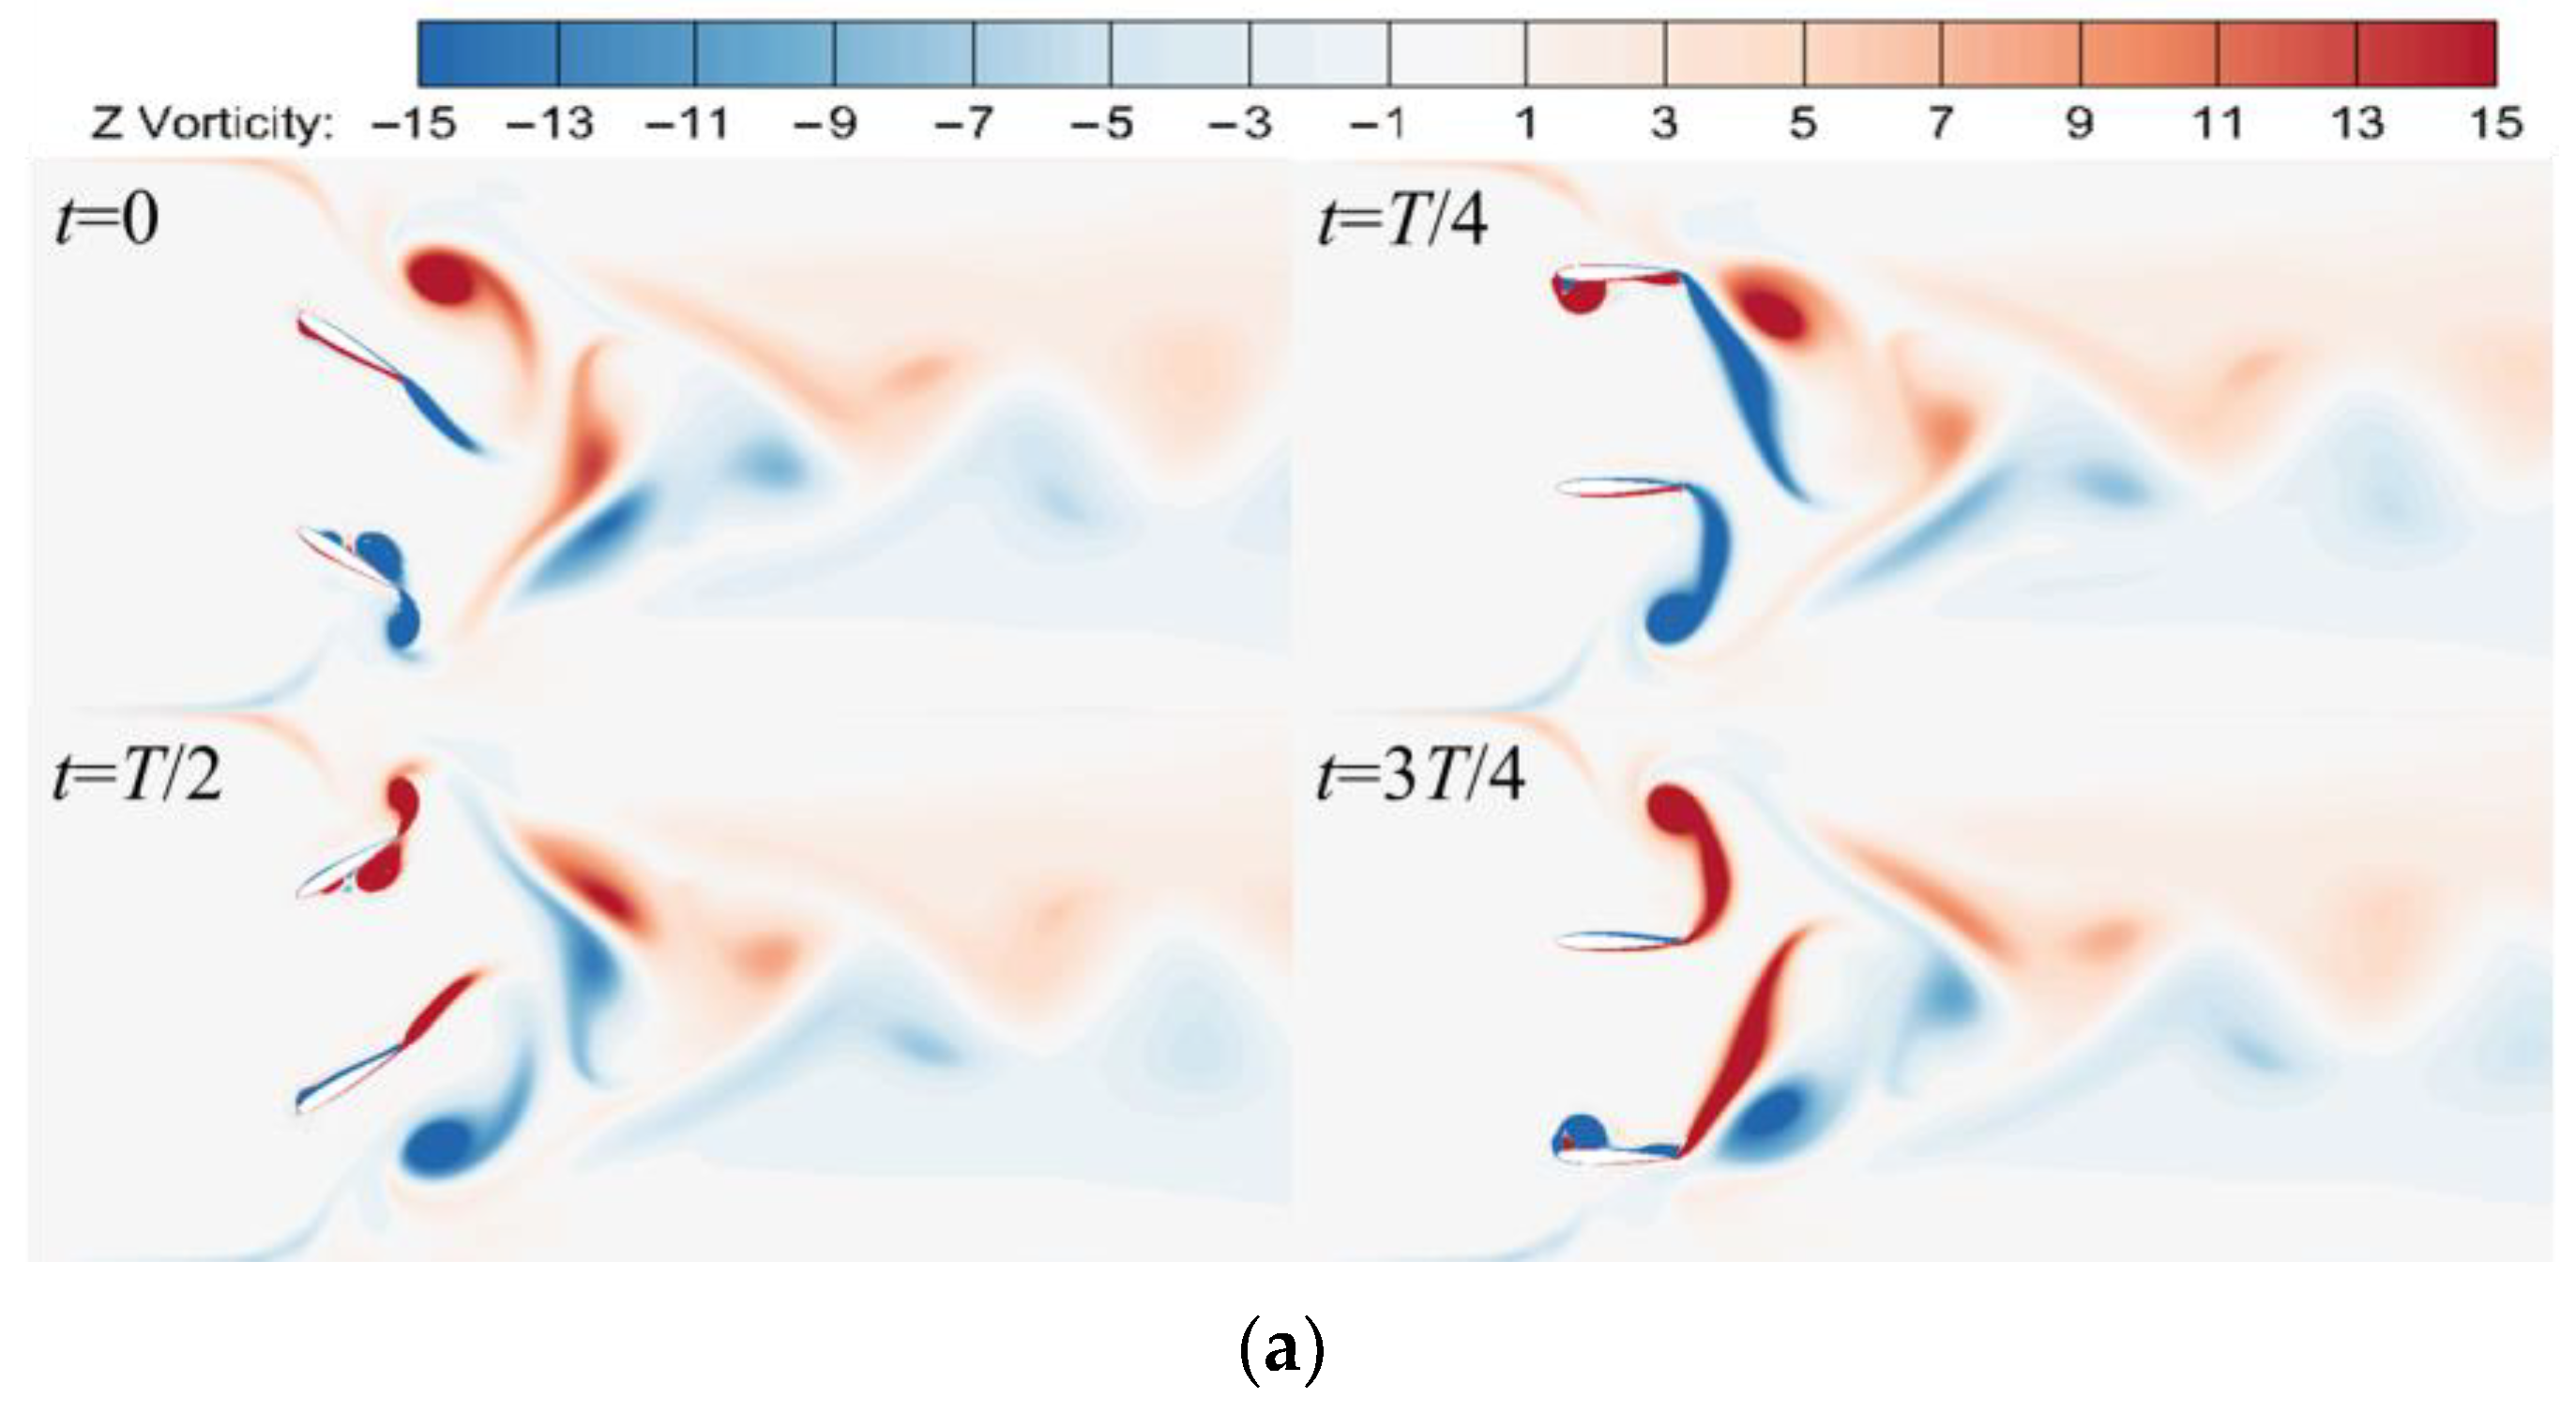
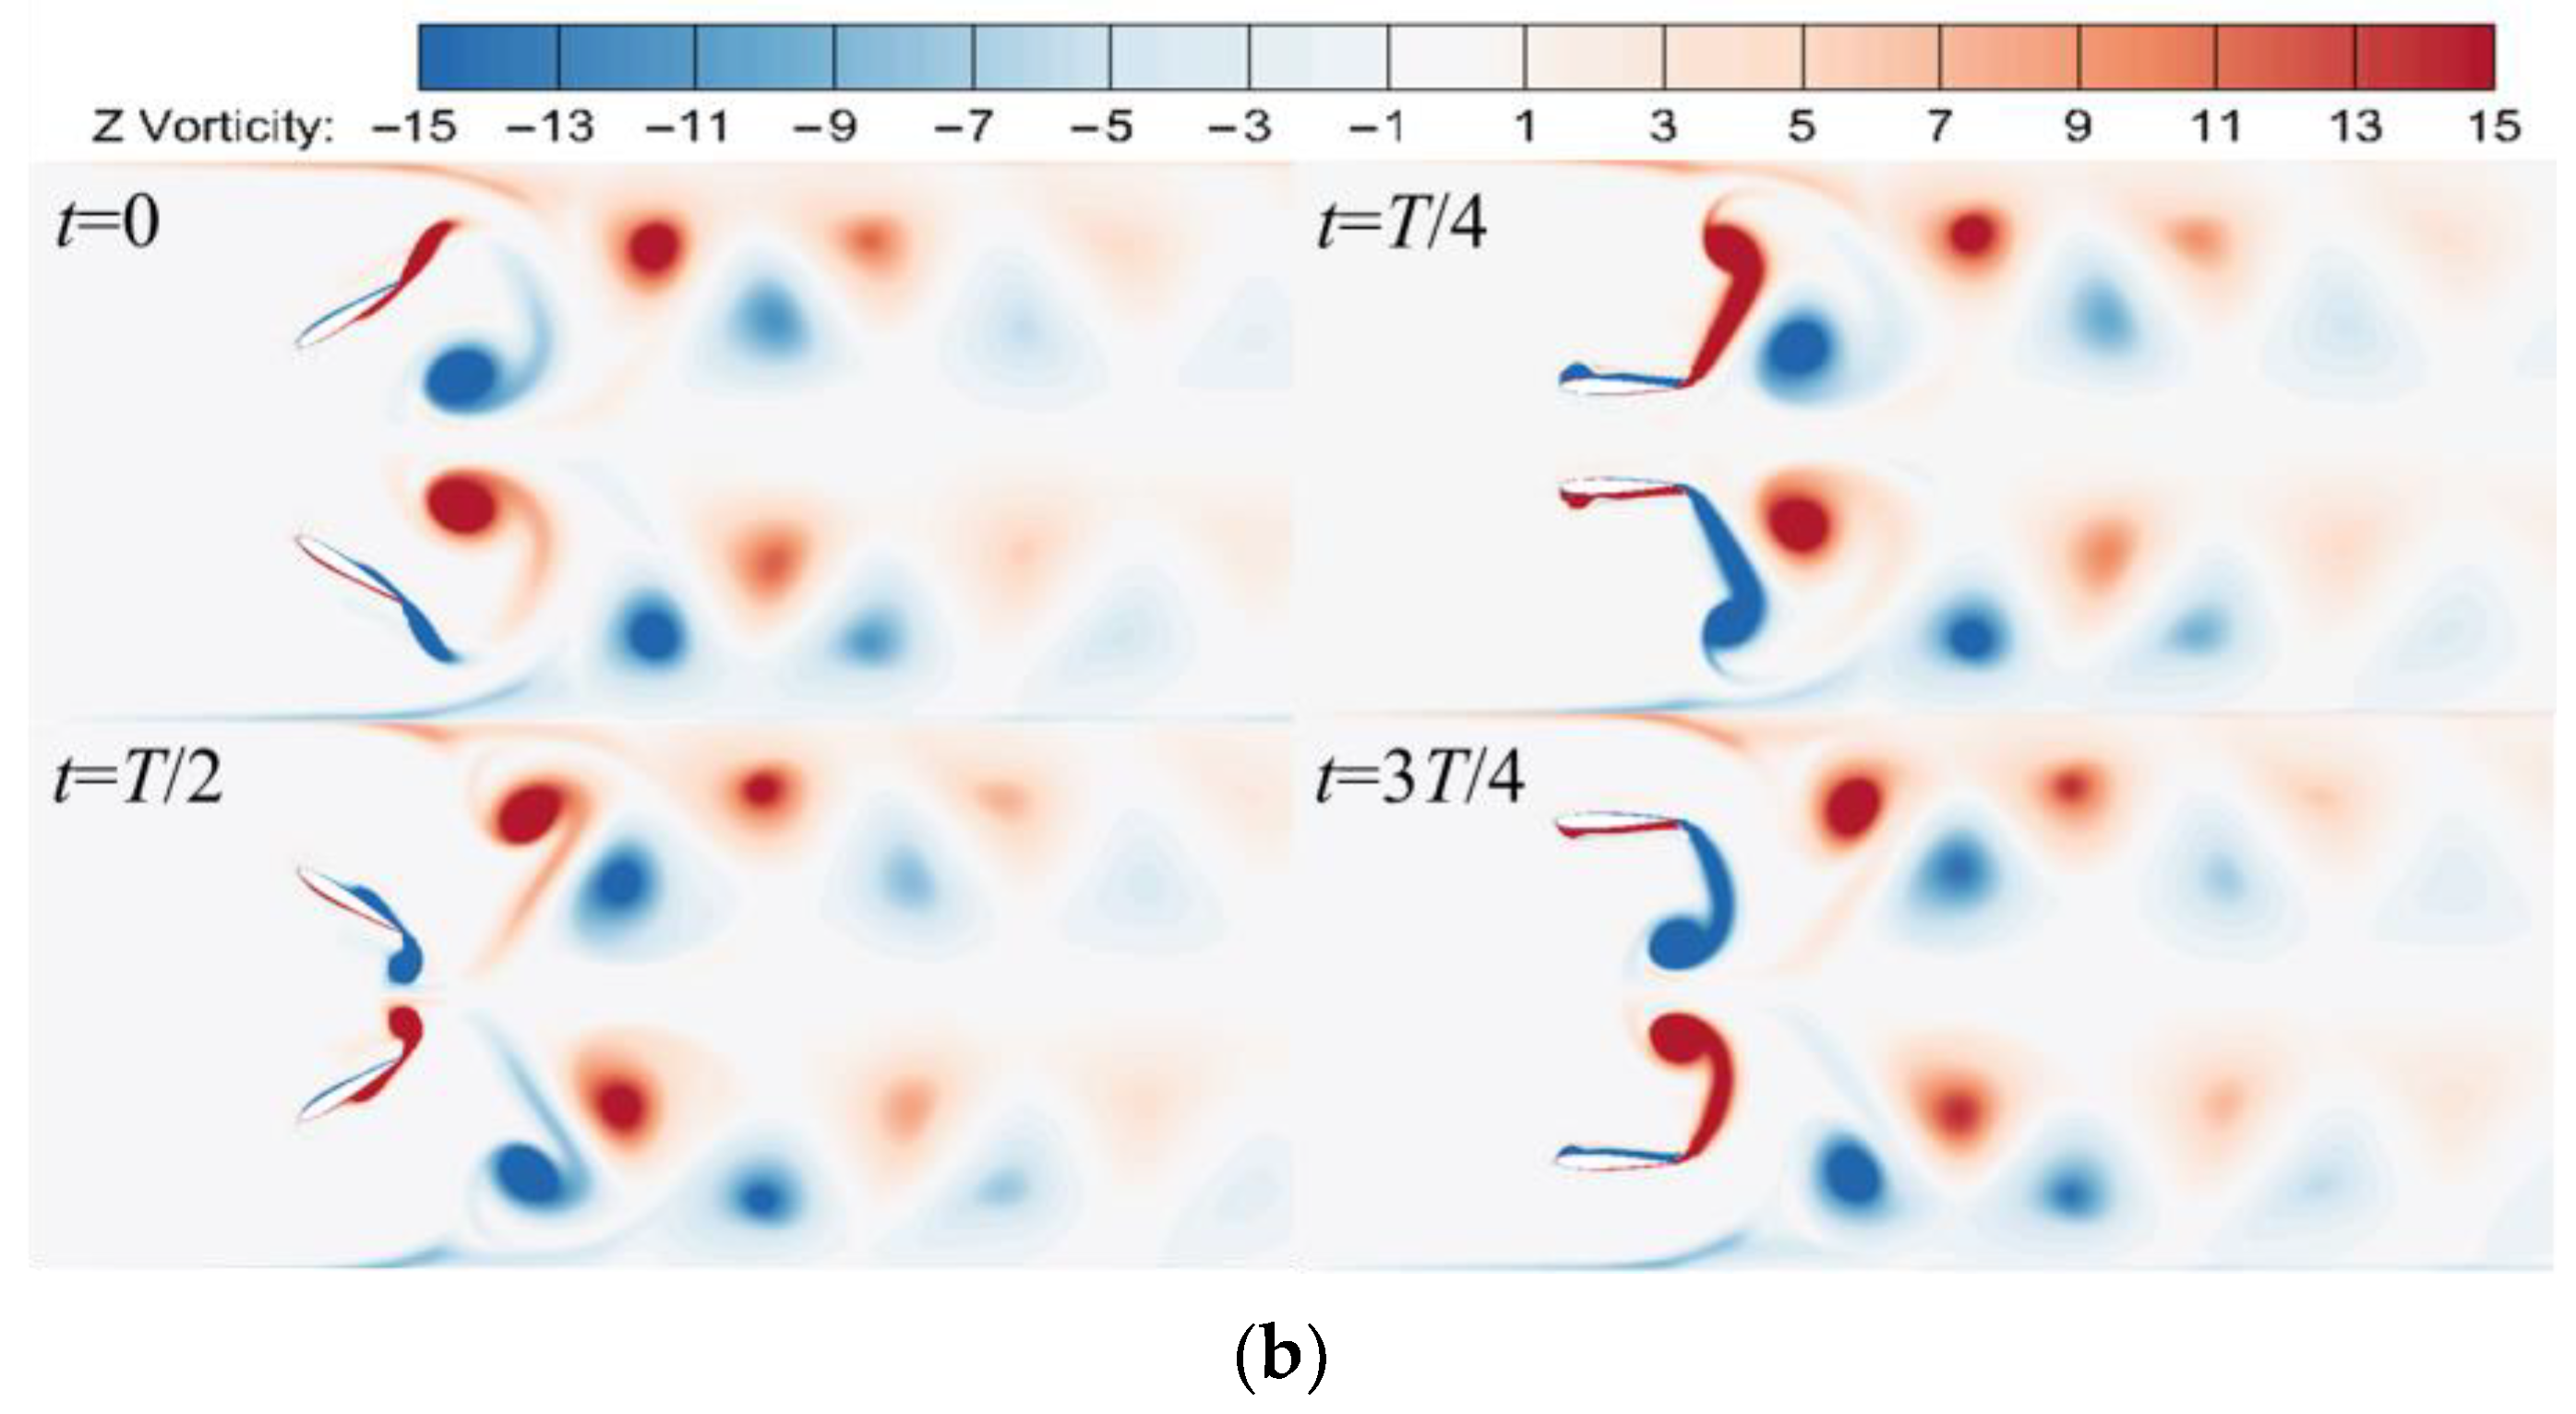
To further investigate the effect of the two oscillation modes on the flow field structure, the vorticity nephogram of the two oscillation modes was analyzed by taking the oscillation frequency f = 1 Hz, as shown in Figure 11.
To characterize the rotational flow in the wake of the hydrofoil, we have elected to calculate the z-direction component of spin, that is, the average angular velocity of the fluid micro-cluster rotating around the rotation axis (parallel to the z-axis), ω z , is used as the characteristic quantity.
ω z = 1 2 ( u y x u x y ) ,
where ω z is the angular velocity component of rotation about the z-axis and u x and u y are the velocity components in the x-axis and y-axis directions.
Figure 11 shows the vorticity nephogram for the two oscillation modes during one cycle. From Figure 11a, it can be seen that in the in-phase oscillation mode, a downward-deflected top vortex pair and an upward-deflected bottom vortex pair are formed during the motion, and these vortex pairs will move along the trailing-edge centerline and eventually merge to form a pair of vortex streets. Throughout the entire cycle, both the leading and trailing edges of the dual oscillating foils generate vortices, with the leading edge vortices moving along the hydrofoil surface toward the trailing edge, combining with and shedding the trailing-edge vortices. During the movement, the vortices of the same type formed by the dual flaps combine to create an enormous vortex and stagger above and below the centerline of the trailing edge to form a pair of vortex streets. In addition, the vortices formed by the up-flap and down-flap motions are flattened at T/4 and 3T/4 cycles. This is due to the different strengths of the wake vortices produced by the up-flap and down-flap motions, as well as the mutual influence of the walls. When these vortices are close to each other, they will become flattened.
Figure 11b shows that in the out-of-phase oscillation mode, two pairs of vortices are formed during the motion, with the bottom vortex street and the top vortex street parallel to each other. Taking Foil 1 as an example, when the foil moves from the initial position to the T/4 cycle, the negative vortex formed at the trailing edge of the flapping foil is shed along the upper surface of the foil, and moves to the T/2 cycle, at which time the positive vortex formed at the leading edge moves along the lower surface of the flapping foil to the trailing edge, and when it moves to the 3T/4 cycle, the positive vortex formed in the previous process is shed along the lower surface of the hydrofoil, and the previous negative vortex forms a pair of rotationally opposite and staggered anti-Karman vortex streets. The Foil 1 and Foil 2 transition processes for the tail vortex are identical.
Figure 8, Figure 9, Figure 10 and Figure 11 illustrate the close relationship between the instantaneous thrust coefficient and the tail vortex structure. In the in-phase oscillation mode, the tail vortex of the dual foils is deflected due to the interaction between vortex pairs, which suppresses the negative vortex formed by the upper surface of the upper flap and the positive vortex formed by the lower surface of the lower flap, forming a flattened vortex. Since the strength of the positive and negative vortices formed by a flapping foil is different, the force of the vortex on the hydrofoil during upward swing is different from that of the vortex on the hydrofoil during downward swing, which leads to a significant difference between the two peaks of the instantaneous thrust coefficients in the in-phase oscillation mode. In addition, the vortices formed by dual flapping foils are of comparable strength in the out-of-phase oscillation mode. Hence, the difference between the two peak instantaneous thrust values in the out-of-phase oscillation is smaller.

5.3. Influence of Two Oscillation Modes on the Pumping Performance

Due to their various oscillations, the dual flapping foils have different effects on the pumping performance of the water body, as shown in Figure 12.
Figure 12 presents the pumping efficiency curves. Figure 12 demonstrates that pumping efficiency gradually increases as the oscillation frequency f increases, but the rate of increase gradually decreases.
Under the same operating conditions, the pumping efficiency of the out-of-phase oscillation mode is greater than that of the in-phase oscillation mode, mainly due to the following two reasons. First, the instantaneous thrust coefficient diagram shows that the out-of-phase oscillation has smoother thrust coefficient operating characteristics compared to the in-phase oscillation, with less energy loss. Hence, the pumping efficiency is relatively higher.
Secondly, according to the flow field structure analysis, the interaction between the vortex pairs generated by the in-phase oscillation mode is more substantial, and the direction of the vortex pairs is severely tilted, resulting in a stronger lateral jet in the front part and a rapid dissipation of the vortex energy in the wake. In contrast, the interaction between the vortex pairs in the out-of-phase oscillation mode is relatively weak, which reduces the vortex energy dissipation and improves the pumping efficiency.
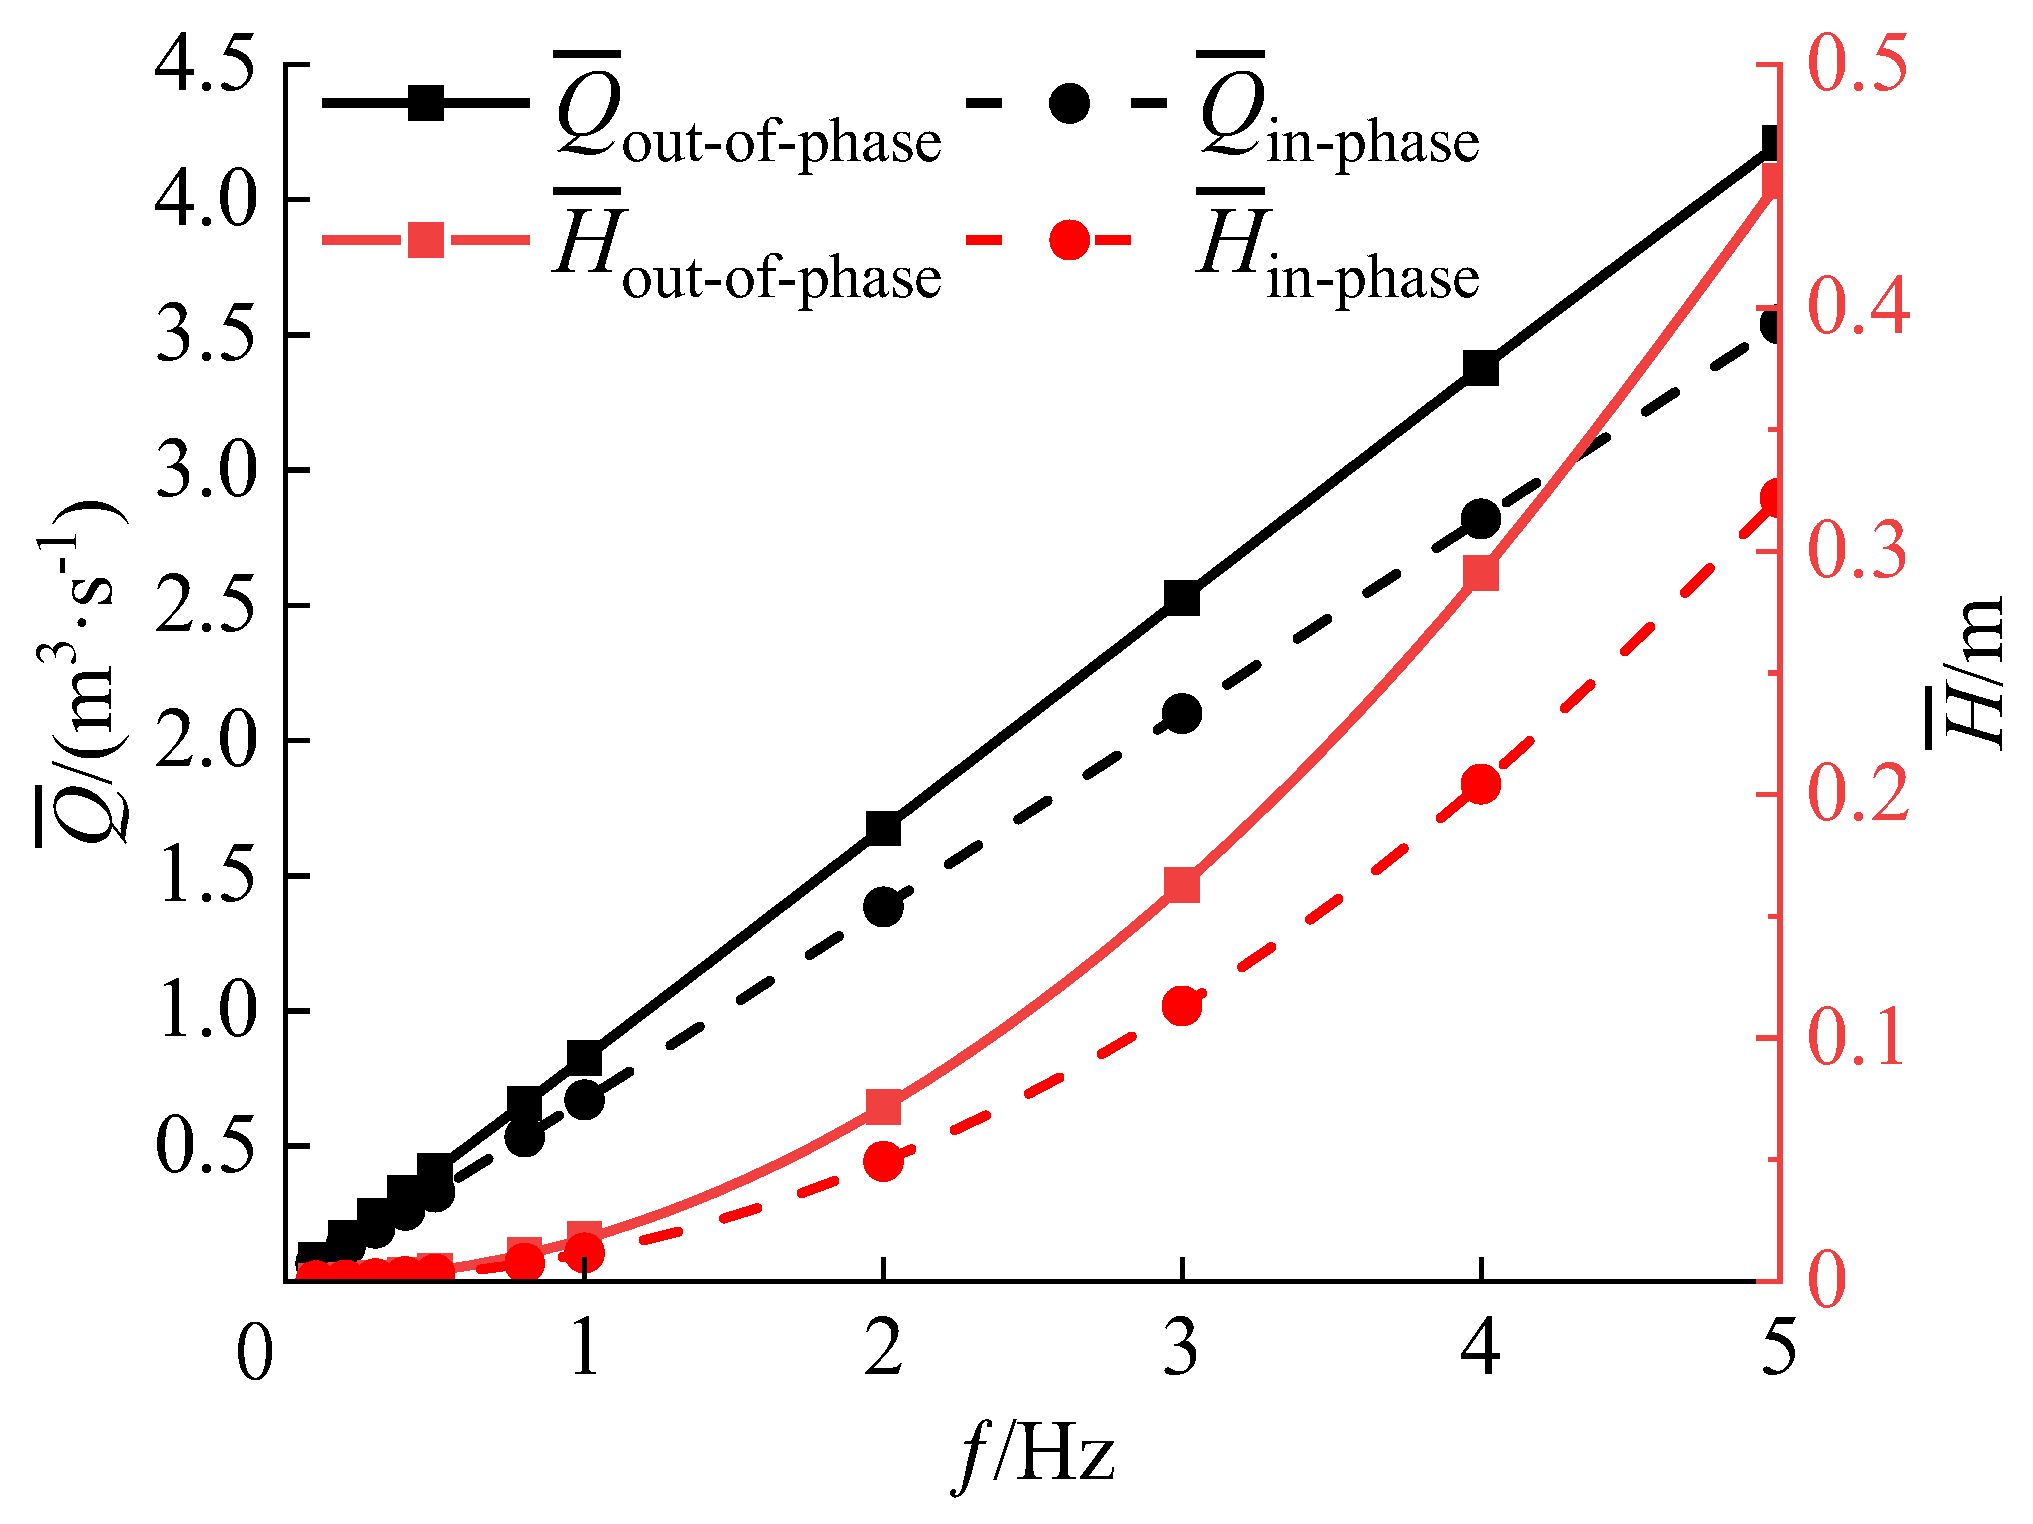
Figure 13 presents the flow and head change curves of the two oscillation modes. The figure illustrates that, when the oscillation frequency f is the same, the average flow and head of the out-of-phase oscillation mode are more significant than that of the in-phase oscillation mode. Furthermore, as the oscillation frequency f increases, the average flow demonstrates a direct proportionality to the oscillation frequency, while the average head exhibits a quadratic proportionality to the oscillation frequency.
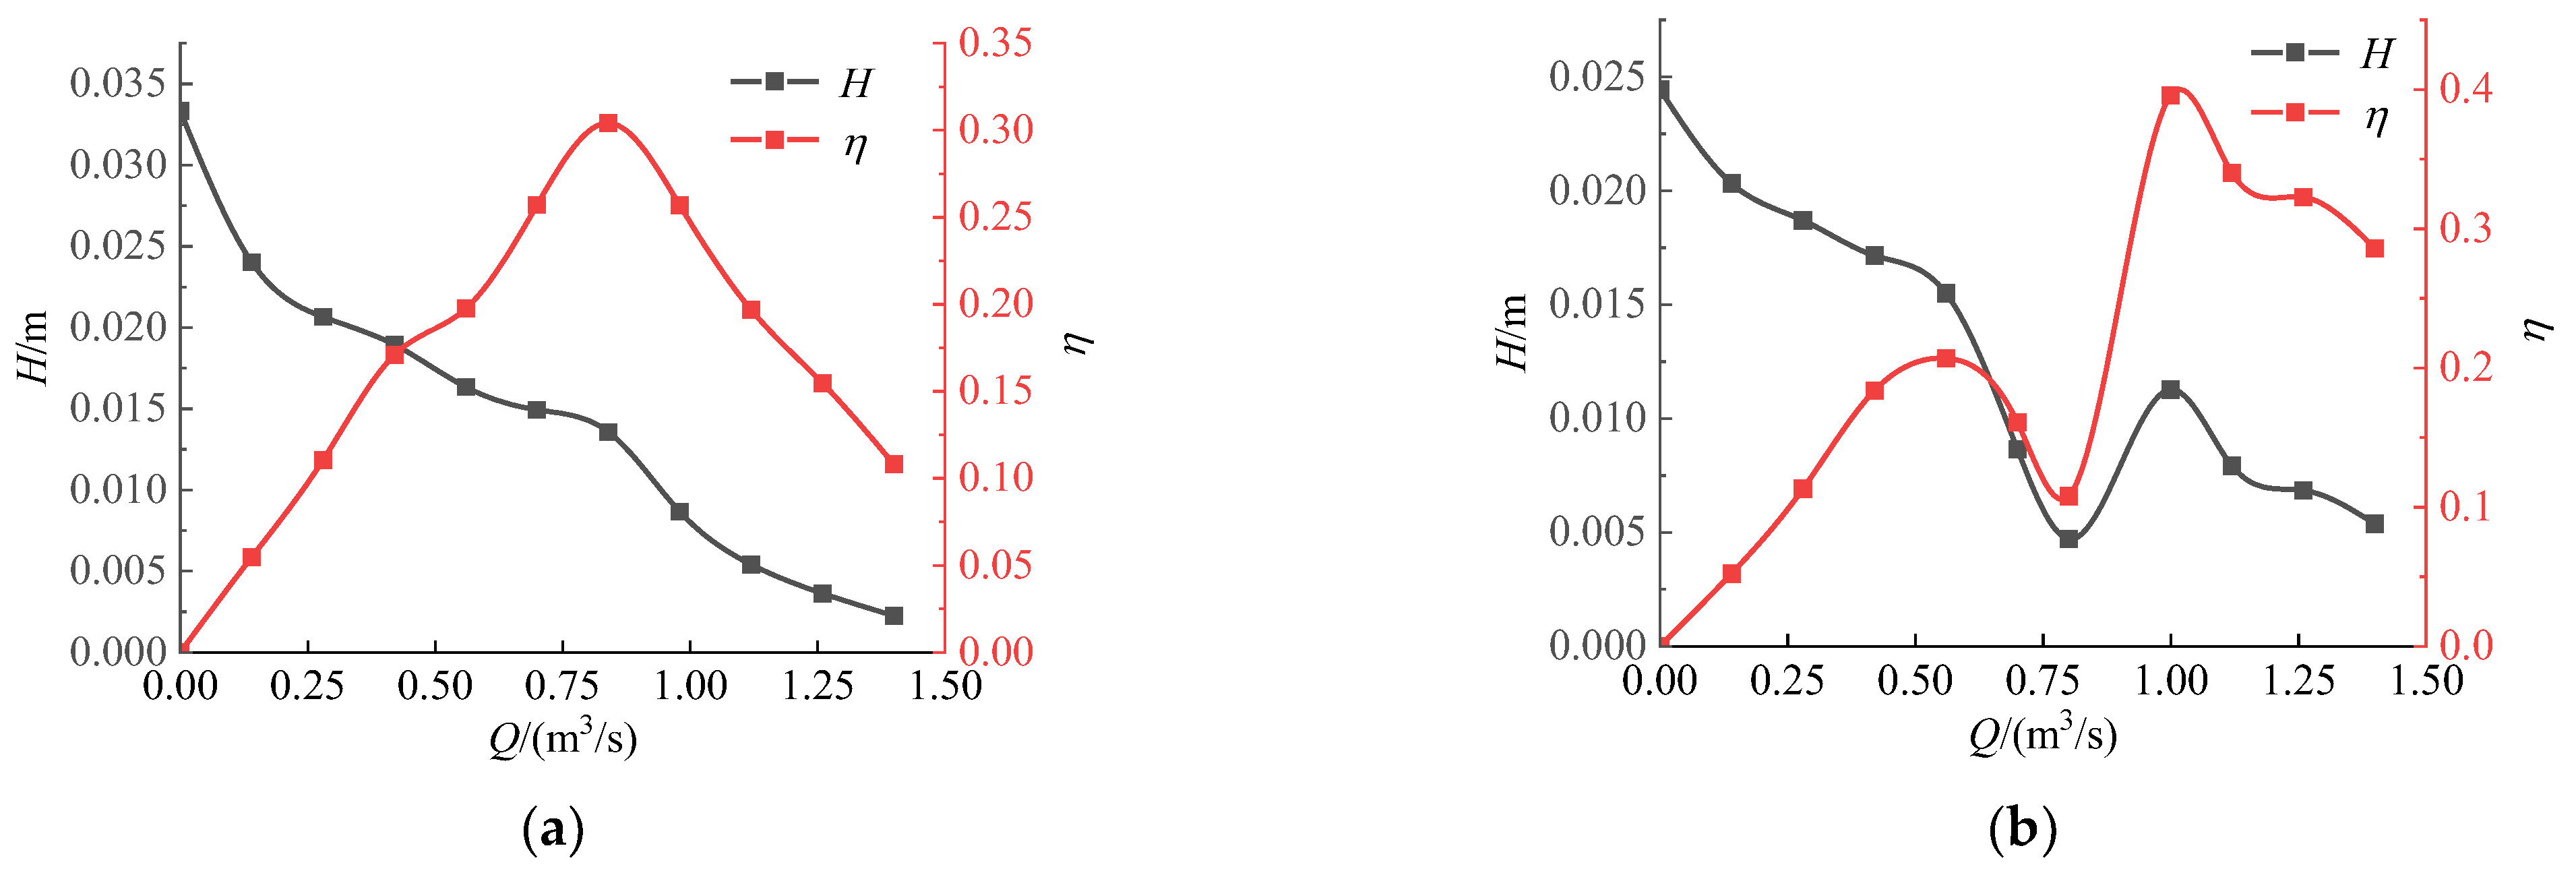
In order to investigate the effects of the two oscillation modes on the characteristic curves, the inlet boundary is set as the velocity inlet, and the velocity variation range is set from 0 to 1 m/s, with a variation of 0.1 m/s at each interval. In addition, the oscillation frequency f = 1 Hz is defined, as shown in Figure 14.
Figure 14 presents the characteristic curves of pump efficiency versus head for the two oscillation modes. Figure 14 illustrates that the characteristic curve of dual flapping foils exhibits a comparable trend of change compared to that of the conventional pump. As the flow rate increases, there is a gradual decrease in the head, while the pumping efficiency initially increases and subsequently decreases. Both variables exhibit an optimal efficiency point. The rationale behind this phenomenon lies in the fact that at low flow rates, the flapping foil assumes a propulsive function with respect to the surrounding water body. Nevertheless, it can be observed that there is a gradual decrease in the thrust exerted by the flapping foil on the water body as the flow rate increases. The propulsive function undergoes a gradual transition into an obstructive function, leading to a decline in pumping efficiency.
In addition, Figure 14b shows that the in-phase oscillation mode has a noticeable “S” type unstable oscillation phenomenon between the flow rate of 0.64~1 m3/s, namely the hump phenomenon. As shown in Figure 15, the graph shows that at a flow rate of 0.84 m3/s, the internal flow field under the corresponding operating conditions shows strong instability, which poses a significant threat to the safety, stability, and reliability of the bionic pumping device. Previous studies show that the humping phenomenon leads to the instability of the device [34,35,36,37]. Hence, the pumping device with the out-of-phase oscillation is more reliable compared with the in-phase oscillation. At the same time, the maximum head is smaller when the dual flapping foil is used to push water in the out-of-phase oscillation, which can meet the demand of ultra-low head conditions.

5.4. Performance Test

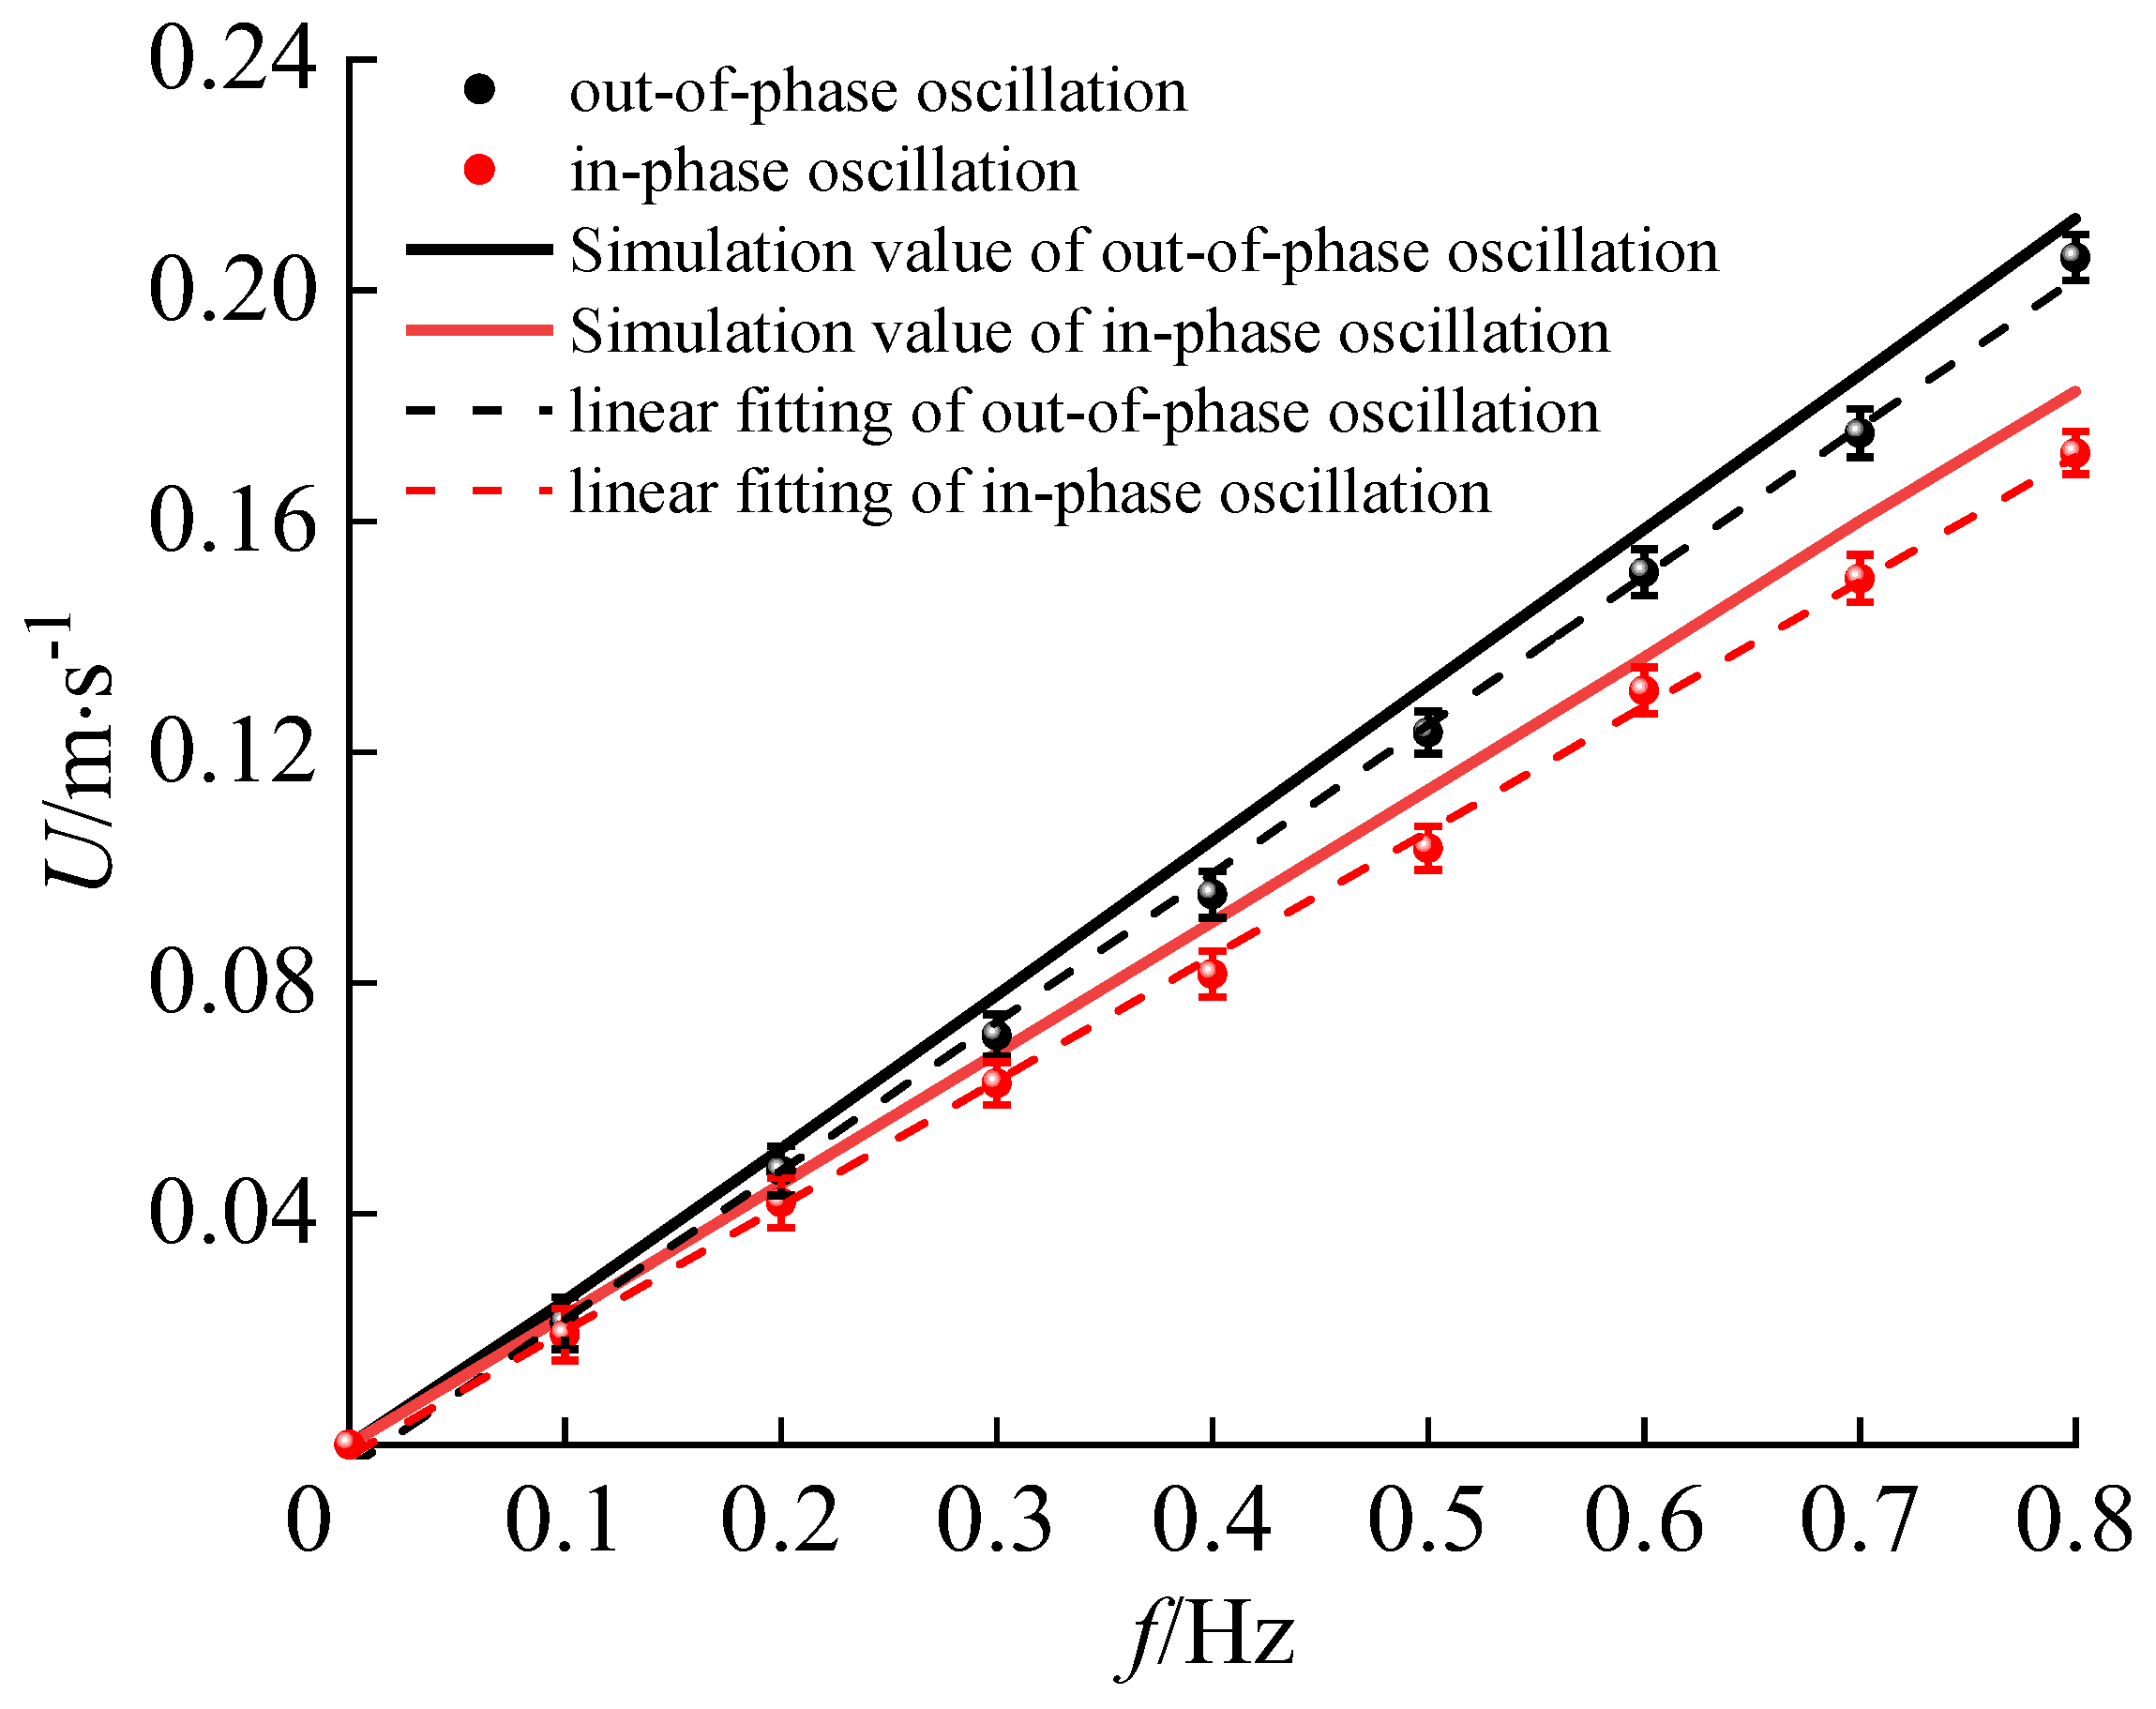
Experiments were conducted on dual flapping foils with various motion frequencies for the distinct oscillating modes. Experiments were conducted in both of the two oscillation modes for comparison, with the oscillation frequency of 0.1~0.8 Hz which changed in 0.1 Hz increments. The flow rate measurement requires six distinct sites at the exit of the rectangular flow channel for each group after 60 cycles of wing flapping, with the average value of the six data groups representing the exit flow rate under the given conditions. The results are shown in Figure 16.
Figure 16 contrasts the results and simulation values for the flow velocity of the dual flapping foils with the two oscillation modes. Figure 16 demonstrates that the out-of-phase oscillation mode has a greater exit flow velocity than the in-phase oscillation mode. With the oscillation frequency f = 0.8 Hz, the in-phase oscillation has an exit flow velocity of 0.174 m/s, and the out-of-phase oscillation has an exit flow velocity of 0.203 m/s, which is 16.6% greater. In addition, the outlet flow velocity was proportional to the frequency of hydrofoil motion.
Moreover, the numerical calculation results exhibit a similar variation trend as the experimental results. However, the flow velocity in the test is slightly low, which is primarily due to two factors: on the one hand, the linkage bar between the plate and the device has an effect on the flow field structure; and on the other hand, due to the limited computing power of the computing equipment, the numerical simulation is a two-dimensional calculation, and the three-dimensional outcome generated in the test has some effect on the results.

6. Conclusions

This paper establishes the motion model of dual flapping foils with in-phase and out-of-phase oscillations. The mechanical characteristics, flow field structure, and pumping performance are analyzed through simulation and experimentation. The findings indicate that the out-of-phase oscillation exhibits superior hydraulic performance compared to the in-phase oscillation, as evidenced by the following results:
(1)
The mechanical properties of the two oscillation modes exhibit notable distinctions. Out-of-phase oscillation consistently produces thrust throughout a motion cycle, whereas in-phase oscillation generates both thrust and drag forces. Furthermore, under the instantaneous lift coefficient curve, the out-of-phase oscillation is more symmetrical than the in-phase oscillation, indicating that the out-of-phase oscillation’s flow field is more uniform.
(2)
The form of the tail vortex structure is a crucial determinant affecting the hydraulic performance of the dual flapping foil. There is a significant difference in the tail vortex structure between the two oscillation modes, with in-phase oscillation forming a pair of vortex streets and out-of-phase oscillation forming two pairs of vortex streets. Furthermore, it influences the flow field, whereby in-phase oscillation results in the formation of a single straight jet, while out-of-phase oscillation led to the formation of two parallel straight jets.
(3)
Both oscillations have propulsive effects on the water body. The pumping efficiency of the out-of-phase oscillation is greater than that of the in-phase oscillation. Specifically, with the oscillation frequency f = 1 Hz, the pumping efficiency of the out-of-phase oscillation reaches 38.4%, which is 90.5% greater than that of the in-phase oscillation. Furthermore, it should be noted that the out-of-phase oscillation results in a greater outlet flow, a more uniform flow field structure, and a superior pumping effect. Experimental verification has demonstrated that the out-of-phase oscillation yields a greater outlet flow rate when compared to the in-phase oscillation.
(4)
The calculation results show that the dual flapping foil and conventional pumps have similar characteristic curves. However, in the flow rate range of 0.64~1 m3/s, the characteristic curve of the dual flapping foils with in-phase oscillation reveals an “S” type unstable oscillation phenomenon, namely the hump phenomenon, which will lead to the instability of the device. In contrast, out-of-phase oscillation does not exhibit this phenomenon, effectively extending its application range. In addition, the out-of-phase oscillating hydrofoil has a reduced applicable head, allowing it to better meet the requirements of ultra-low head conditions.

Author Contributions

E.H. presented the main idea of analyzing the hydrodynamic performance of dual flapping foils; L.Q. contributed to the overall composition and writing of the manuscript; R.X. conducted numerical theory research; Z.S. reviewed the manuscript; W.Z. provided writing ideas and revised the manuscript. All authors have read and agreed to the published version of the manuscript.

Funding

This research was funded by the National Natural Science Foundation of China (Grant No. 51976202, 61772469), the Zhejiang Provincial Key Research and Development Project (Grant No. 2021C03019), and the Zhejiang Provincial Key Laboratory of Rural Water Conservancy and Hydropower Resources Allocation and Control Key Technologies Open Fund Project (Grant No. UZJWEU-RWM-20200304B).

Data Availability Statement

Not applicable.

Conflicts of Interest

The authors declare no conflict of interest.

References

  1. Geng, J.; Wang, Y.; Hu, S.G. WQI based water quality assessment and spatial-temporal change in plain river network area of Jiashan county. Environ. Eng. 2023, 41, 187–193+209. [Google Scholar]
  2. Liu, J.; Ding, R.; Chen, Y.; Zhu, W.; Fan, Z.; Ma, J. Assessment and Optimization of Water Resources Regulation for River Networks in the Tidal Plain-A Case Study of the Qingsong Area in Shanghai. Water 2022, 14, 3523. [Google Scholar] [CrossRef]
  3. Wang, H.; Shen, Z.; Zeng, Y.; Yan, H.; Li, Y.; Yuan, W. Connection between Anthropogenic Water Diversion and Hydrodynamic Condition in Plain River Network. Water 2021, 13, 3596. [Google Scholar] [CrossRef]
  4. Ma, Y.Q.; Cao, W.; Zhao, Y.M. Eutrophication characteristics, cause analysis and control strategies in a typical plain river network region. Acta Sci. Circumst. 2022, 42, 174–183. [Google Scholar]
  5. Yuan, X.Z.; Xu, X.F.; Yu, L.L. Simulation analysis of sewage discharge in plain river network based on coupled hydrodynamic model. China Rural Water Hydropower 2022, 12, 39–46. [Google Scholar]
  6. Xiao, X.M.; Chen, D.Y.; Hu, H.P. Semi-closed Water Flowing Project Based on Joint Scheduling of Sluice & Pumping Station. China Water Wastewater 2022, 38, 113–116. [Google Scholar]
  7. Li, X.; Tang, H.W.; Wang, L.L. Simulation of water environment under joint operation of gates and pumps in plain river network area. J. Hohai Univ. Nat. Sci. 2016, 44, 393–399. [Google Scholar]
  8. Cao, W.; Li, W. Study on the Performance Improvement of Axial Flow Pump’s Saddle Zone by Using a Double Inlet Nozzle. Water 2020, 12, 1493. [Google Scholar] [CrossRef]
  9. Mu, T.; Zhang, R.; Xu, H.; Zheng, Y.; Fei, Z.; Li, J. Study on improvement of hydraulic performance and internal flow pattern of the axial flow pump by groove flow control technology. Renew. Energy 2020, 160, 756–769. [Google Scholar] [CrossRef]
  10. Zheng, Y.; Chen, Y.J.; Zhang, R. Analysis on unsteady stall flow characteristics of axial-flow pump. Trans. Chin. Soc. Agric. Mach. 2017, 48, 127–135. [Google Scholar]
  11. Wu, X.; Zhang, X.; Tian, X.; Li, X.; Lu, W. A review on fluid dynamics of flapping foils. Ocean Eng. 2020, 195, 106712. [Google Scholar]
  12. Feng, Y.K.; Su, Y.M.; Su, Y.Y. Study on hydrodynamic performance of oscillating wing under simulated fish swimming mode. J. Huazhong Univ. Sci. Technol. Nat. Sci. Ed. 2019, 12, 38–43. [Google Scholar]
  13. Hua, E.R.; Chen, W.Q.; Tang, S.W.; Xie, R.S.; Guo, X.M.; Xu, G.H. Study on the characteristics of pushing flow of flapping hydrofoil device in small channel. J. Agric. Mach. 2022, 53, 9. [Google Scholar]
  14. Hua, E.R.; Luo, H.T.; Xie, R.S.; Chen, W.Q.; Tang, S.W.; Jin, D.Y. Investigation on the Influence of Flow Passage Structure on the Performance of Bionic Pumps. Processes 2022, 10, 2569. [Google Scholar] [CrossRef]
  15. Ma, P.; Wang, Y.; Xie, Y.; Liu, G. Behaviors of two semi-passive oscillating hydrofoils with a tandem configuration. Energy 2021, 214, 118908. [Google Scholar] [CrossRef]
  16. Moreira, D.; Mathias, N.; Morais, T. Dual flapping foil system for propulsion and harnessing wave energy: A 2D parametric study for unaligned foil configurations. Ocean Eng. 2020, 215, 107875. [Google Scholar] [CrossRef]
  17. Xu, W.; Xu, G.; Duan, W.; Song, Z.; Lei, J. Experimental and numerical study of a hydrokinetic turbine based on tandem flapping hydrofoils. Energy 2019, 174, 375–385. [Google Scholar] [CrossRef]
  18. Mannam, N.P.B.; Krishnankutty, P.; Vijayakumaran, H.; Sunny, R.C. Experimental and Numerical Study of Penguin Mode Flapping Foil Propulsion System for Ships. J. Bionic Eng. 2017, 14, 770–780. [Google Scholar] [CrossRef]
  19. Wang, Y.L.; Jiang, W.; Xie, Y.H. Numerical Investigation Into the Effects of Motion Parameters on Energy Extraction of the Parallel Foils. J. Fluids Eng.-Trans. ASME 2019, 141, 061104. [Google Scholar] [CrossRef]
  20. Dahmani, F.; Sohn, C.H. Effect of convergent duct geometry on the energy extraction performance of tandem oscillating hydrofoils system. J. Fluids Struct. 2020, 95, 102949. [Google Scholar] [CrossRef]
  21. Kinsey, T.; Dumas, G. Optimal Tandem Configuration for Oscillating-Foils Hydrokinetic Turbine. J. Fluids Eng.-Trans. ASME 2012, 134, 031103. [Google Scholar] [CrossRef]
  22. He, G.; Yang, H.; Mo, W.; Zhao, Z.; Wang, W.; Ghassemi, H. Influence of inter-foil spacing on energy extraction of tandem oscillating hydrofoils. Ocean Eng. 2022, 259, 111953. [Google Scholar] [CrossRef]
  23. Bao, Y.; Zhou, D.; Tao, J.J.; Peng, Z.; Zhu, H.B.; Sun, Z.L.; Tong, H.L. Dynamic interference of two anti-phase flapping foils in side-by-side arrangement in an incompressible flow. Phys. Fluids 2017, 29, 033601. [Google Scholar] [CrossRef]
  24. Dewey, P.A.; Quinn, D.B.; Boschitsch, B.M.; Smits, A.J. Propulsive performance of unsteady tandem hydrofoils in a side-by-side configuration. Phys. Fluids 2014, 26, 041903. [Google Scholar] [CrossRef]
  25. Liu, H.B.; Wang, Y.; Ma, P.L. Coupling analysis of parameters based on parallel-oscillating hydrofoils hydrokinetic turbine. J. Zhejiang Univ. Eng. Sci. 2017, 51, 153–159. [Google Scholar]
  26. Gungor, A.; Hemmati, A. Wake symmetry impacts the performance of tandem hydrofoils during in-phase and out-of-phase oscillations differently. Phys. Rev. E 2020, 102, 043104. [Google Scholar] [CrossRef]
  27. Gungor, A.; Khalid, M.S.U.; Hemmati, A. Classification of vortex patterns of oscillating foils in side-by-side configurations. J. Fluid Mech. 2022, 951, A37. [Google Scholar] [CrossRef]
  28. Chao, L.-M.; Pan, G.; Zhang, D.; Yan, G.-X. On the thrust generation and wake structures of two travelling-wavy foils. Ocean Eng. 2019, 183, 167–174. [Google Scholar] [CrossRef]
  29. Huera-Huarte, F.J. Propulsive performance of a pair of pitching foils in staggered configurations. J. Fluids Struct. 2018, 81, 1–13. [Google Scholar] [CrossRef]
  30. Wang, J.; Liu, P.; Chin, C.; He, G.; Song, W. Parametric study on hydro-elasticity characteristics of auto-pitch wing-in-ground effect oscillating foil propulsors. Ocean Eng. 2020, 201, 107115. [Google Scholar] [CrossRef]
  31. Du, X.X.; Zhang, Z.D. Numerical analysis of the influence of four flapping modes on the propulsive performance of underwater flapping wing. Eng. Mech. 2018, 35, 8. [Google Scholar]
  32. Hua, E.R.; Zhu, W.; Xie, R.; Su, Z.; Luo, H.; Qiu, L. Comparative Analysis of the Hydrodynamic Performance of Arc and Linear Flapping Hydrofoils. Processes 2023, 11, 1579. [Google Scholar] [CrossRef]
  33. Read, D.A.; Hover, F.S.; Triantafyllou, M.S. Forces on oscillating foils for propulsion and maneuvering. J. Fluids Struct. 2003, 17, 163–183. [Google Scholar] [CrossRef]
  34. Wang, K.J.; Zhao, Y.; Wang, S.H. Analysis of pressure fluctuation and internal flow characteristics of axial flow pump under off design condition. J. Hydroelectric. Eng. 2023, 42, 86–96. [Google Scholar]
  35. Xie, R.S.; Hua, E.T.; Xu, G.H. Research on Double Hump Phenomenon of Axial Flow Pump. Trans. Chin. Soc. Agri. Mach. 2022, 53, 178–185. [Google Scholar]
  36. He, N.C.; Tang, M.G.; Liu, H.L. Test and analysis on pressure pulsation and hydraulic performance of saddle zone in axial flow pump. J. Drain. Irri. Mach. Eng. 2018, 36, 118–123. [Google Scholar]
  37. Ye, C.; An, D.; Huang, W.; Heng, Y.; Zheng, Y. Investigation on Stall Characteristics of Centrifugal Pump with Guide Vanes. Water 2023, 15, 21. [Google Scholar] [CrossRef]
Figure 1. Schematic diagram of the hydrofoil.
Water 15 03275 g001
Figure 2. Position relationship of dual-oscillating hydrofoils over one cycle: (a) out-of-phase oscillation; (b) in-phase oscillation.
Water 15 03275 g002
Figure 3. Computational domain mesh and boundary conditions: (a) grid overview; (b) leading edge grid; (c) trailing-edge grid.
Water 15 03275 g003
Figure 4. Verification of independence: (a) time steps; (b) grid number.
Water 15 03275 g004
Figure 5. Comparison between the numerical simulation outcomes and the experimental data in the previous study [33].
Water 15 03275 g005
Figure 6. Three-dimensional schematic diagram of flapping hydrofoil device: 1. synchronous belt linear module; 2. motor; 3. coupling; 4. support frame; 5. connecting rod; 6. foil.
Water 15 03275 g006
Figure 7. (a) Dual flapping foil device test bench; (b) internal schematic diagram of the experimental flow passage.
Water 15 03275 g007
Figure 8. Variation in the instantaneous thrust and lift coefficients for two oscillation modes: (a) instantaneous thrust coefficients; (b) instantaneous lift coefficients.
Water 15 03275 g008
Figure 9. Velocity nephograms of two oscillation modes: (a) in-phase oscillation; (b) out-of-phase oscillation.
Water 15 03275 g009
Figure 10. Characteristic diagram of the instantaneous flow field in the out-of-phase oscillation mode (t/T = 3/4).
Water 15 03275 g010
Figure 11. Vorticity nephogram of two oscillation modes during one cycle: (a) in-phase oscillation; (b) out-of-phase oscillation.
Water 15 03275 g011aWater 15 03275 g011b
Figure 12. Pump efficiency curves of two oscillation modes.
Water 15 03275 g012
Figure 13. Variation curves of flow and head in two oscillation modes.
Water 15 03275 g013
Figure 14. Pump efficiency and head characteristic curves of two oscillation modes: (a) out-of-phase oscillation; (b) in-phase oscillation.
Water 15 03275 g014
Figure 15. Vorticity nephogram of in-phase oscillation mode at a flow rate of 0.84 m3/s (t/T = 0).
Water 15 03275 g015
Figure 16. Comparison of flow velocity between experimental testing and simulation.
Water 15 03275 g016
Table 1. The main equipment of the experimental test system.
TermsEquipmentTypeSystematic Error
FlowDoppler flowmeterWIM-@ADV±1%
HeadDifferential pressure sensor3051±0.2%
CurrentClamp power meterVC6412D±2.5%
Table 2. Repeatability test.
f/Hz0.10.20.30.40.50.60.70.8
v / m s 1 Expeiment 10.0200.0470.0700.0970.1200.1520.1720.201
Expeiment 20.0210.0450.0750.0950.1250.1510.1700.207
Expeiment 30.0250.0500.0680.0960.1230.1470.1750.205
Disclaimer/Publisher’s Note: The statements, opinions and data contained in all publications are solely those of the individual author(s) and contributor(s) and not of MDPI and/or the editor(s). MDPI and/or the editor(s) disclaim responsibility for any injury to people or property resulting from any ideas, methods, instructions or products referred to in the content.