Article

A Field Investigation of Stability Characteristics of Pressure Fluctuation and Vibration in Prototype Pump Turbine at Multiple Working Points

1
Baishan Storage Power Station, State Grid Xinyuan Co., Ltd., Huadian, Jilin 132400, China
2
Department of Energy and Power Engineering, Tsinghua University, Beijing 100084, China
3
School of Water Conservancy and Hydropower Engineering, North China Electric Power University, Beijing 100084, China
*
Author to whom correspondence should be addressed.
Water 2023, 15(19), 3378; https://doi.org/10.3390/w15193378
Submission received: 4 September 2023 / Revised: 17 September 2023 / Accepted: 18 September 2023 / Published: 27 September 2023
(This article belongs to the Special Issue Advances in Hydrodynamics of Water Pump Station System)

Abstract

:
In practical operation, pump turbines typically operate far from their designed working points, which has a significant impact on the stability of the unit’s operation. In this paper, we conducted a field test to investigate the stability characteristics of prototype pump turbines at different working points. By adjusting the given power of the generator in a stepwise manner to control its working point, we obtained the statistical and spectral characteristics of pressure signals and acceleration signals. In turbine mode, the result shows that, at low, medium, and high power, the variation in pressure fluctuation characteristics is influenced by three different factors, while vibration generally reaches its maximum value at approximately 50 MW. In pump mode, variations in pressure were observed among different measurement points in the low-frequency range, and the characteristics of vibration acceleration were influenced by both the rotor–stator interaction (RSI) and the structural modal frequencies. We emphasized that the high-frequency bands have influences on the unit comparable in magnitude to those of the rotor–stator interaction, which has rarely been mentioned in previous studies. Through detailed testing and analysis of the unit’s actual operation, we can gain a better understanding of its behavior and performance in the turbine and pump modes, and these results hold significant importance for ensuring the stability and reliability of the unit.

1. Introduction

With the gradual depletion of fossil fuel reserves and increasing environmental concerns associated with their use, the development of renewable energy has been rapidly advancing. Renewable energy accounted for 47.3% of China’s total installed power capacity in 2022, among which wind and solar energy have seen continuous growth, accounting for 8.8% and 4.9% of total installed power capacity, respectively [1]. However, the inherent drawback of wind and solar energy lies in their short-term output instability, which can present challenges to grid stability [2]. Studies have shown that, when the combined share of wind and solar energy (also called Renewable Energy Penetration Level) exceeds 10% on the grid, without additional control measures, their short-term fluctuations can significantly impact grid security [3,4,5]. To address the issue of unstable output from renewable energy sources, pumped-storage hydropower plants play a crucial role as a relatively mature energy storage solution. The pump turbine is the key component of pumped-storage hydropower, and its operation principle is simple. During periods of excess electricity generation, water is pumped from a lower reservoir to an upper reservoir. During periods of electricity shortage, the stored water in the upper reservoir is released through turbines to generate electricity. This meets the usage needs of both the energy storage and power generation directions.
Due to the remote control center’s overall dispatch of the power grid, pumped-storage power stations often play a role in peak shaving and valley filling, leading pump turbines with frequent start–stop operations and wide operating ranges to encounter greater challenges in terms of stability compared to large-scale Francis units that maintain steady operation [6]. The frequent changes in working points can lead to severe hydraulic instability, such as pressure fluctuation and increasing vibrations [7,8], cavitation in the draft tube [9], and vortex-induced vibration due to multiphase flow [10,11], especially when the unit operates at low flow rates in turbine mode [12], referred to as an S-shaped characteristic. Many studies have been dedicated to analyzing the internal flow pattern and pressure fluctuation associated with the S-shaped characteristic [13,14]. In one study, model tests and numerical simulations were conducted on a model pump turbine [15], and some low-frequency components were found in the vaneless space, which may not originate from specific vortex structures [16], but rather from the combined effects of the rotating stall, circumferential propagation of fluid blockage, and vortex rope [17]. In terms of improving the stability of pump turbines, researchers have attempted jet injection in the vaneless space [18], but a more reliable approach is the use of misaligned guide vanes (MGVs), which can change the characteristics of the turbine brake and reverse pump regions in the four-quadrant performance curves of the pump turbine [19]. In recent years, research on splitter blades has become increasingly popular. This design alternates long and short blades within the runner, resulting in significant differences in pressure fluctuation characteristics compared to previously used pump turbines [20,21,22], and greatly improving the stability of the unit. In pump mode, the risk of extending the operating range will rise due to the hump characteristic [23,24], so the working points of most pump turbines in pump mode are completely fixed.
Most of the studies mentioned above have focused on comparing experimental data from model tests with numerical simulations. However, the flow characteristics of prototype units in engineering practice are often different from those of model units, especially in low-flow conditions [25]. Unlike laboratory experiments that employ visualization techniques such as PIV, field tests of prototypes typically involve the installation of high-stability sensors within the unit, such as pressure sensors, vibration sensors, acoustic sensors, strain gauges, etc. [26,27]. Through indirect analysis, these sensors enable the investigation of potential flow phenomena occurring inside the turbine unit. Currently, there is a limited amount of detailed field research on pump turbines [28,29,30]. Zhang et al. identified the cause of strong vibrations in a pumped-storage hydropower plant as rotor–stator interaction (RSI) by analyzing the pressure fluctuation at critical locations within the unit [31]. They proposed increasing the stay vaneless space as an improvement and verified the effectiveness of this measure through a model test. Hu et al. conducted a field test [30] and obtained pressure fluctuations at three key measurement points for subsequent frequency domain analysis. They identified high-frequency noise, possibly caused by the RSI, as well as low-frequency components in the draft tube, but these frequencies are not limited to typical blade-passing frequencies or draft tube vortex rope frequencies, and occur with greater randomness. Therefore, these phenomena are often difficult to capture, even with sufficiently refined grids, simulation duration, and short time steps in numerical simulation works. In fact, numerical simulations excel in capturing prominently periodic vortex structures [32] and may not be able discern whether there are any components in the signal-related generator electromagnetics.
In this study, we conducted a field test on a prototype pump turbine in Huadian, Jilin, China. Multiple pressure sensors were installed at the end of the pressure measurement pipeline, while accelerometers were installed at key points in structural components. This allowed for the assessment of differences in signal statistical indicators and spectral characteristics of the unit at different operating conditions, thus providing insights into the operating performance and stability of the pump turbine.

2. Experimental Methods and Data Acquisition

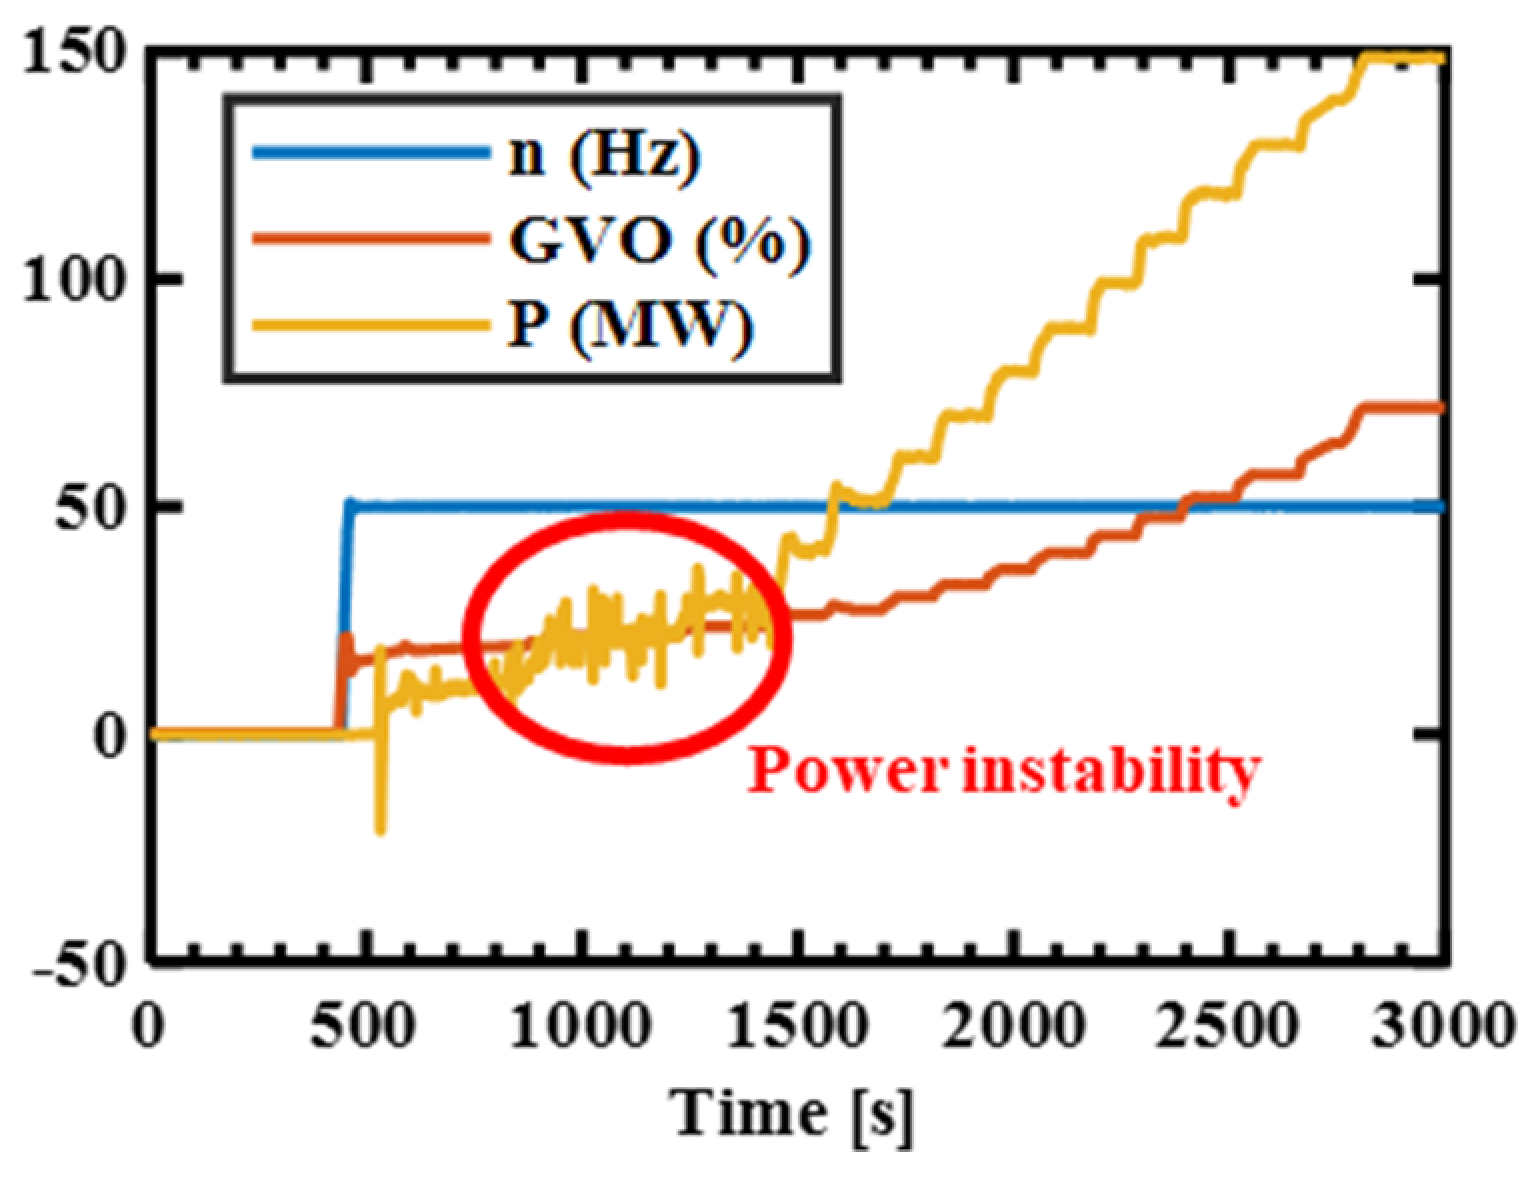
2.1. Experimental Design of Working Points

Typical parameters of the pump turbine are shown in Table 1. We conducted field tests on the pumped-storage hydropower unit under various working points to obtain pressure and vibration acceleration data. The turbine operating conditions are all power points, but at intervals of 10 MW, including typical power ranges representing low-load operating conditions (10–40 MW), medium-load operating conditions (70–90 MW), and near-full-load operating conditions (100–130 MW). The pump operating conditions also include zero-flow operating conditions and normal pumping operating conditions. All working points are listed in Table 2.

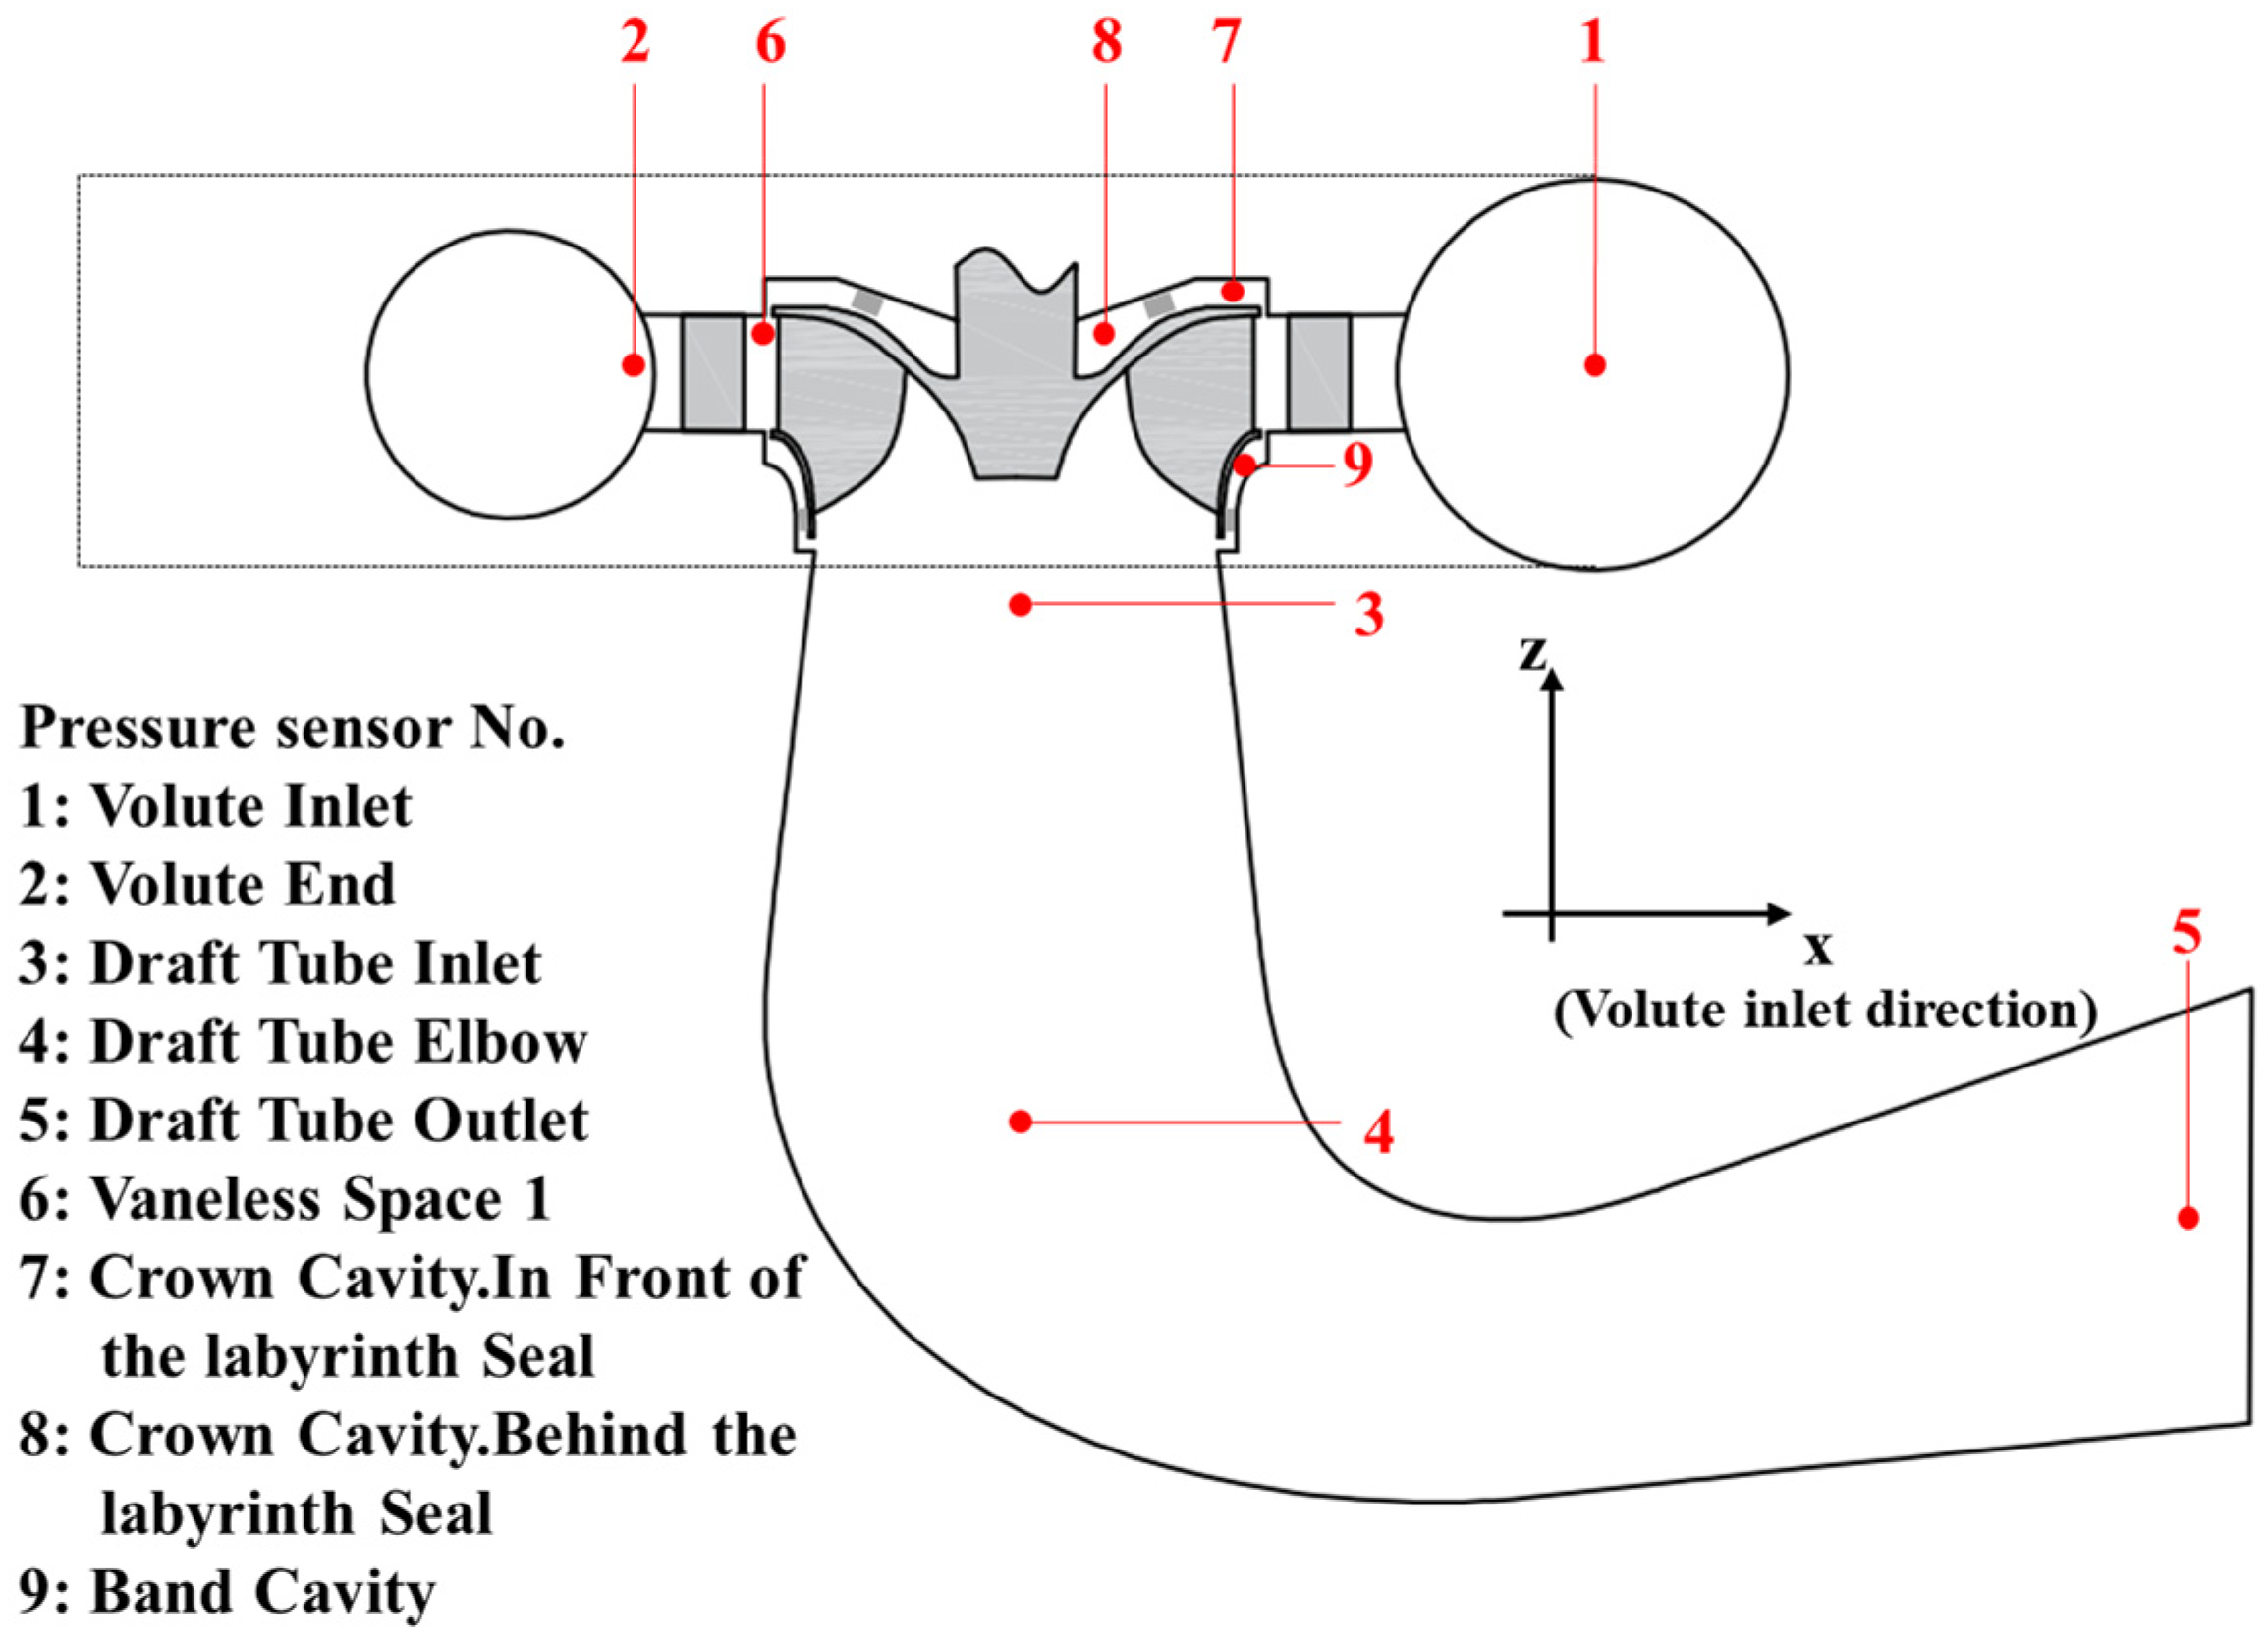
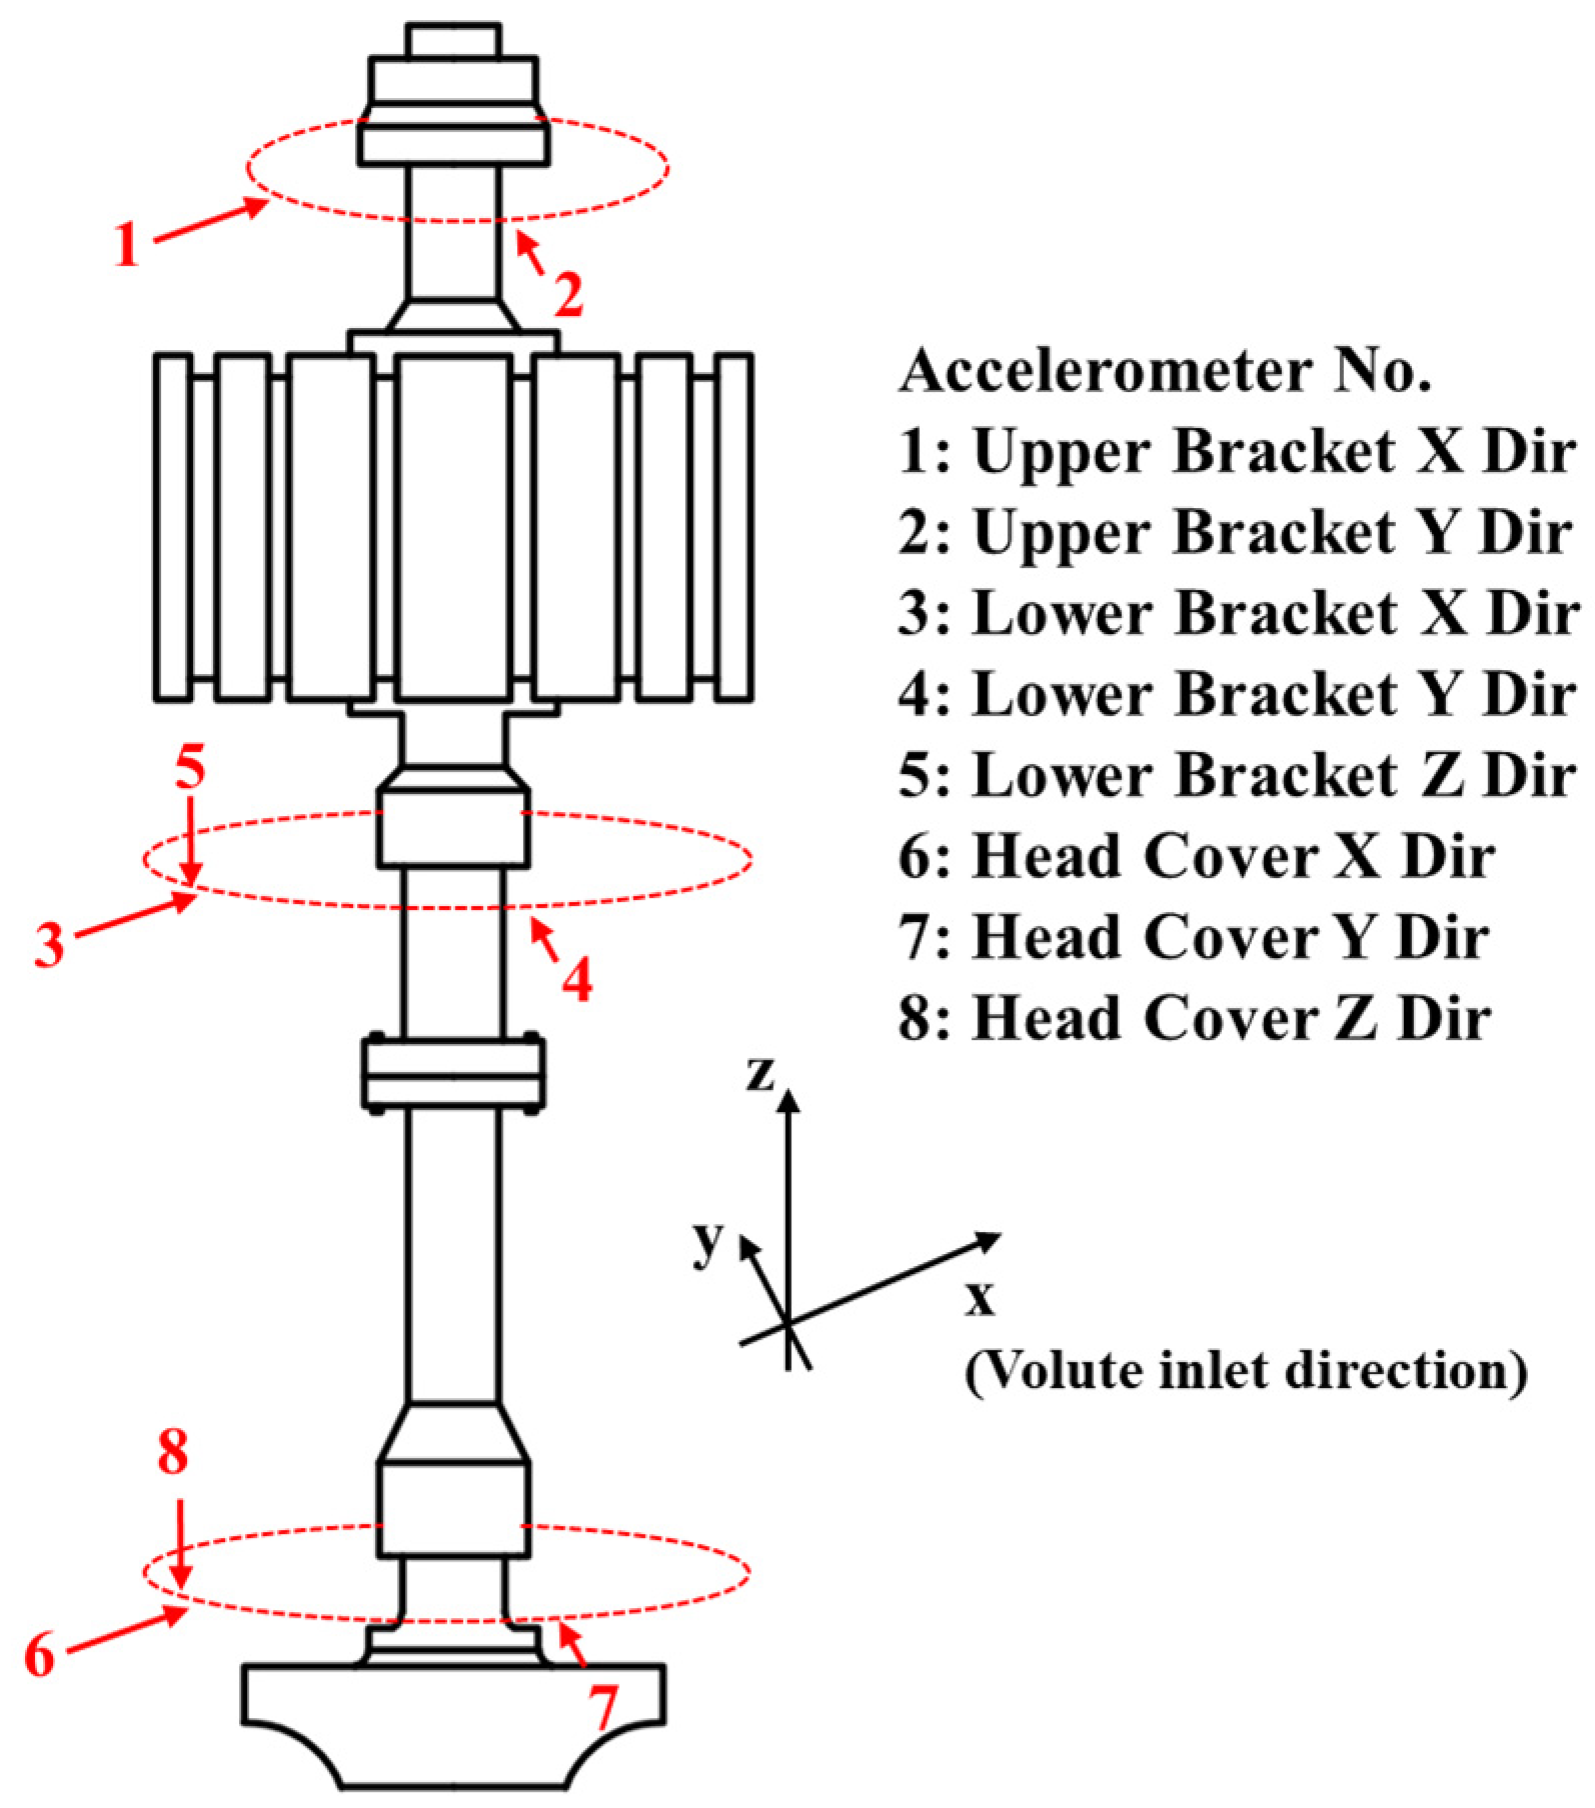
2.2. Experimental Equipment and Installation

To measure pressure, and potential pressure fluctuation, high-performance pressure sensors were installed at the end of the existing pressure measurement pipelines on the unit; the correspondence between the physical meaning of the signal and the serial number is shown in Figure 1. Meanwhile, we installed IEPE accelerometers near the upper, lower, and water guide bearings of the unit. The sensors were as close to the bearings as possible, but were inevitably placed on the bracket and head cover, as shown in Figure 2. All of these sensors were connected to their respective data acquisition units, and all of the acquisition units were time-aligned.

2.3. Data Acquisition Configuration

A continuous sampling method was utilized to acquire the vibration and pressure pulsation signals from the sensors installed on the pump turbine unit. The data was acquired with a high-speed A/D conversion system and stored directly on the computer for subsequent analysis. A sampling frequency of 4096 Hz was selected to ensure the frequency range analyzed (below 1600 Hz) was much higher than the frequencies of potential hydraulic instability phenomena, thus avoiding significant spectral leakage.
After 1 min of steady operation in each working point, we continuously collected data for at least 30 s. Since the unit rated speed is 3.33 Hz, we can achieve a frequency resolution of 0.01 times the rotational frequency when analyzing within the frequency domain. Since all signals were continuously collected over a long duration, there is no comparison of results from multiple measurements. However, prior to finalizing the signal samples to be used for spectrum analysis, we examined the coherence between different signal segments under the same working point to ensure that the unit is truly in a steady state of operation. Poor coherence results can also occur, especially in pump mode, which will be explained later in the text.

3. Results and Discussion

3.1. Turbine Mode

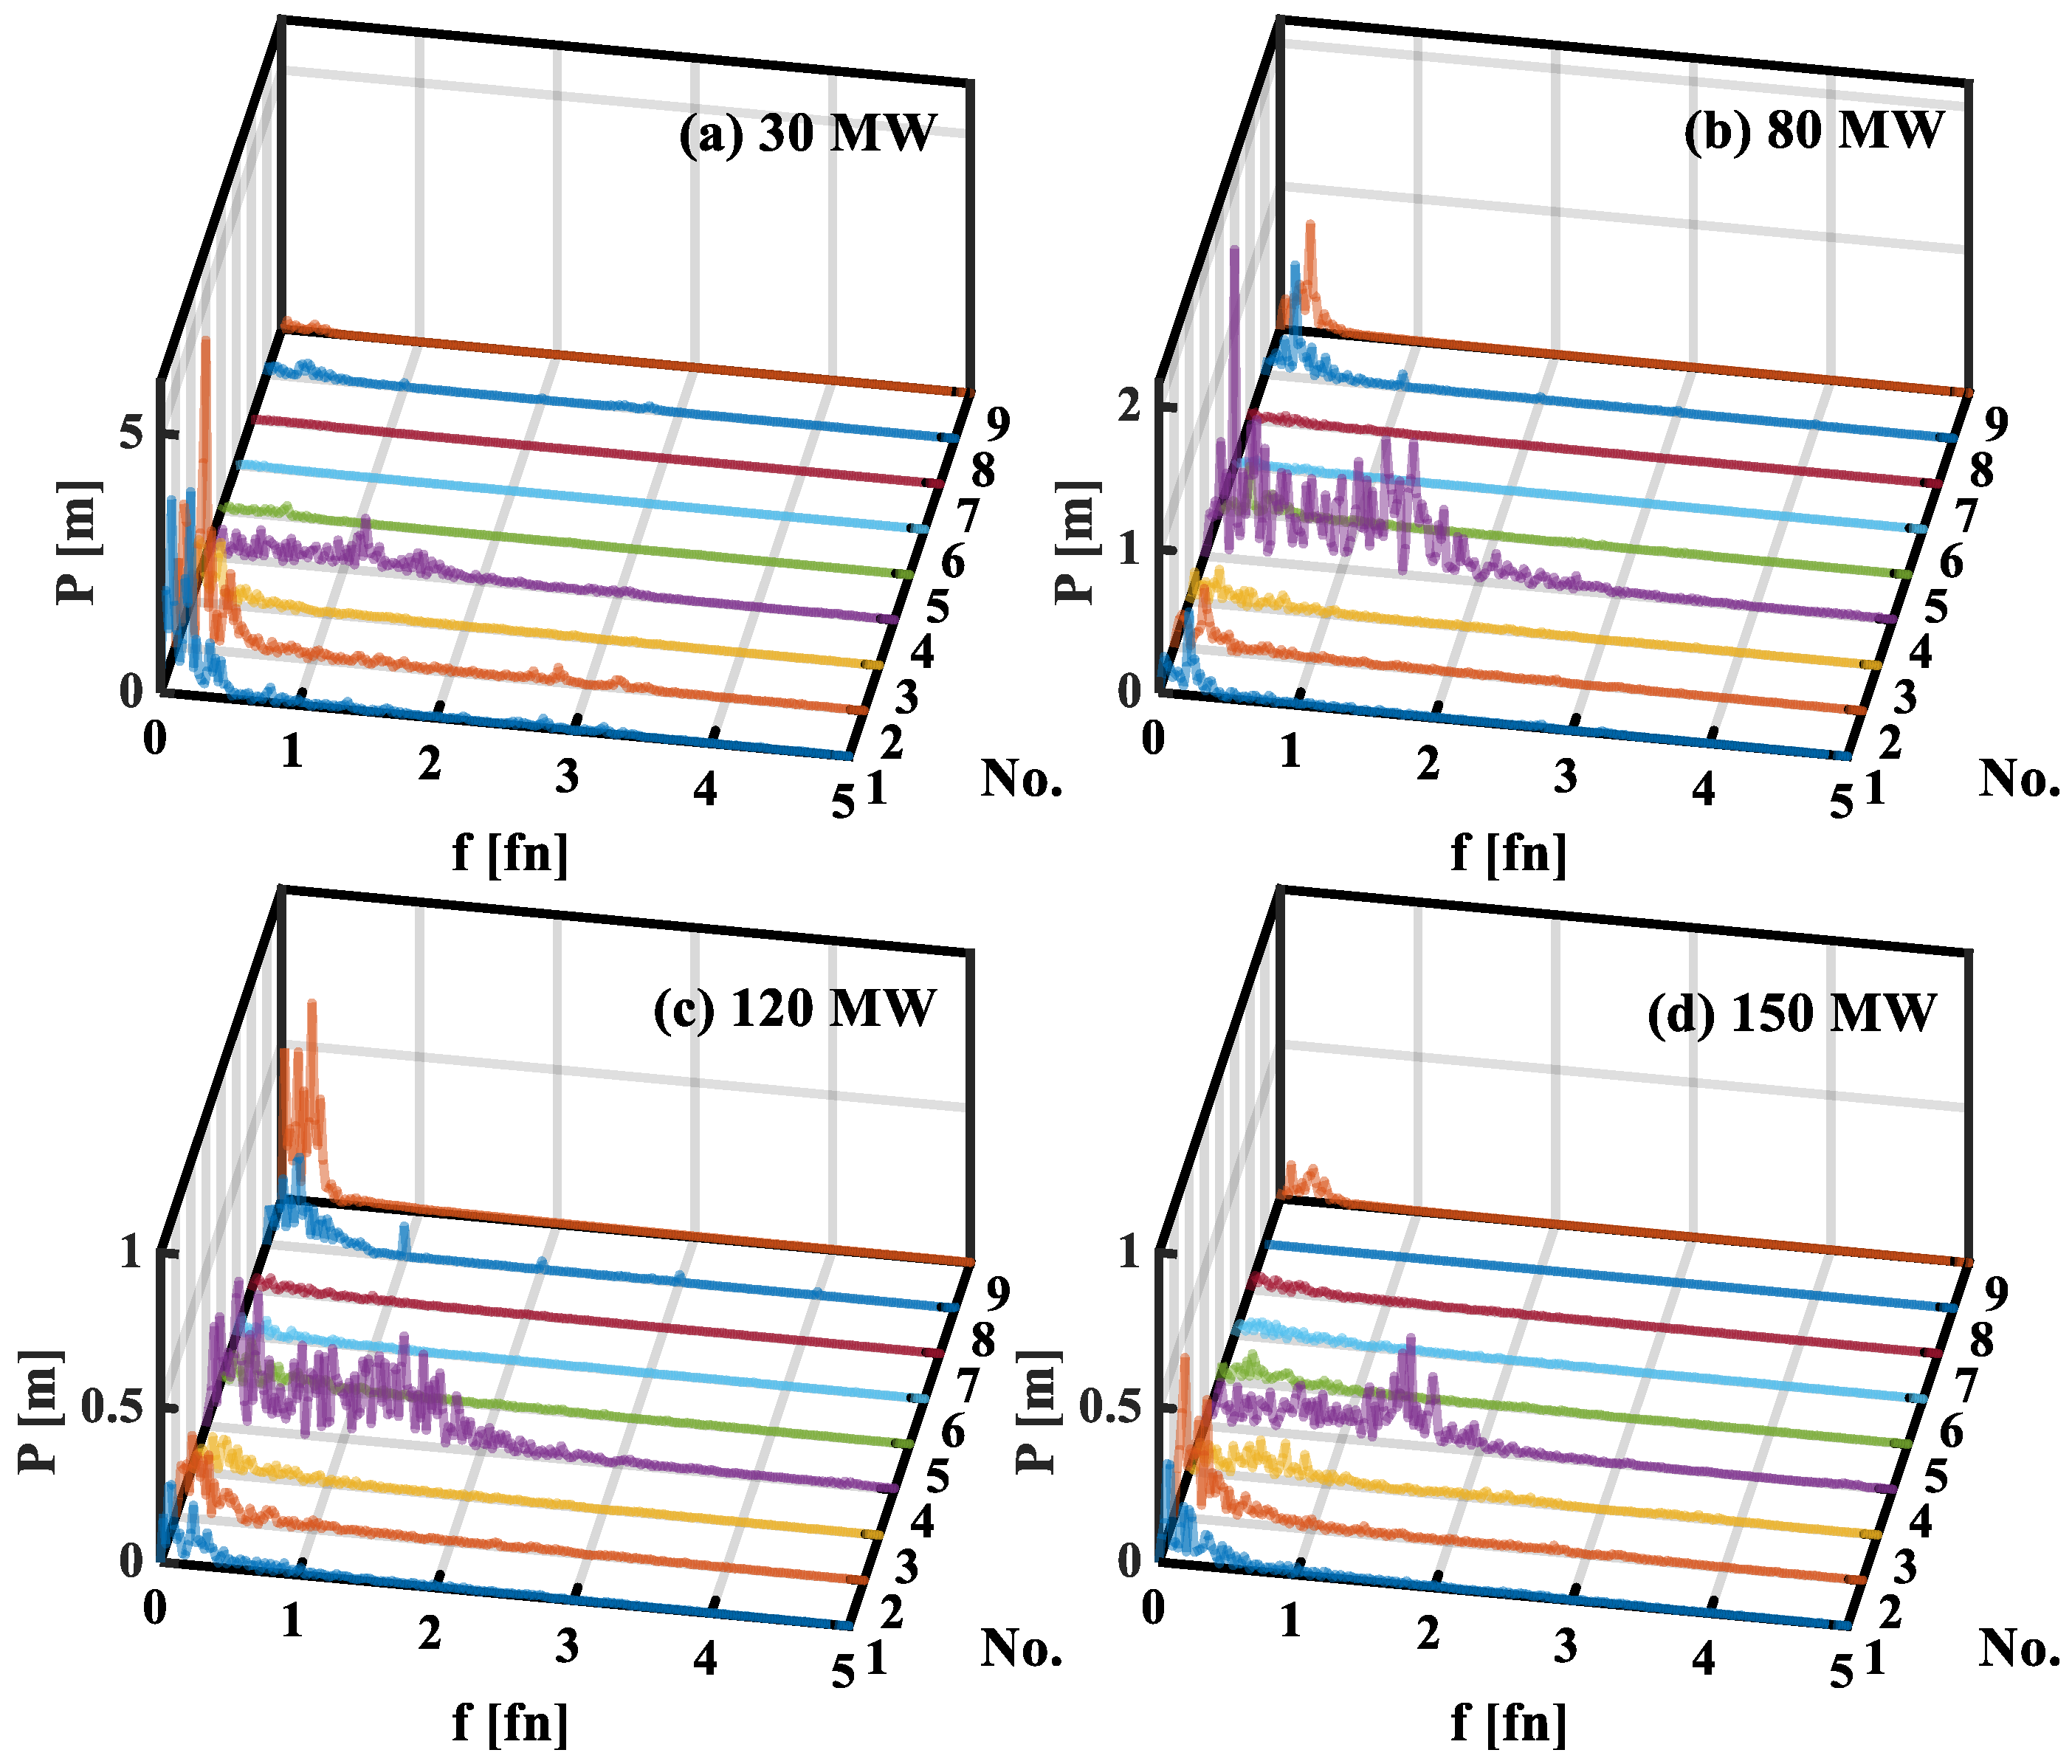
3.1.1. Pressure Fluctuation in Turbine Mode

In turbine mode, the amplitude of pressure fluctuation tends to decrease, and stability improves as the unit operates closer to its designed working point. The variation in pressure signal with output power is shown in Figure 3, and the signal spectra of all measured points at four representative working points are shown in Figure 4. The characteristics of pressure fluctuation show three stages of gradual rise in output power.
(1) Under low-load (10 MW–40 MW) conditions, significant pressure fluctuation was observed in the volute, with a 95% confidence peak-to-peak value of approximately 20 m, accounting for 20% of the unit’s head. Frequency spectrum analysis revealed that the intense pressure fluctuation was primarily dominated by low-frequency components (<0.5 fn) with unstable peak values and pronounced nonlinearity. The data from the slave computer for the governor also identified the phenomena of unstable output and difficulty in maintaining output power stability, as shown in Figure 5. Figure 5 also shows that the governor data changes throughout the test, where the power rises in steps. These observations may be attributed to the presence of flow blockages near the guide vanes, due to the rotating stall when the unit operates at lower flow rates and smaller guide vane openings [33].
(2) Under medium-load (70 MW–90 MW) conditions, pronounced pressure fluctuation was observed in the elbow section of the draft tube, with a 95% confidence peak-to-peak value exceeding 10 m, accounting for 10% of the unit’s head. It should be noted that the pressure fluctuation conditions in the draft tube were unfavorable across all operating conditions, with a 0–2 fn frequency band indicating the presence of intense broadband noise within the draft tube. In the process of checking the signal, we found that the coherence of this low-frequency band is poor; that is, when different signal fragments are selected, the relative relationship between the amplitudes of each frequency point in the low-frequency band is different. This may be related to the strong randomness of flow at the elbow of the draft tube. However, in the medium-load range, a distinct main peak emerged in this frequency band, around 0.23 fn, which slightly decreased as the power increased, exhibiting an increasing-then-decreasing trend in amplitude, as shown in Figure 6. This phenomenon can be attributed to the vortex rope in the draft tube. As the flow rate increases, the vorticity of the fluid near the outer wall of the draft tube gradually decreases, resulting in reduced rotating speed of the vortex rope inside the draft tube. Nevertheless, this component was not prominent in working points below 60 MW or above 110 MW, due to insufficient flow conditions for vortex rope generation and the presence of stronger pressure fluctuation from other sources [17], thereby demonstrating that the contribution of vortex-rope-induced pressure fluctuation is secondary.
(3) Under near-full-load (100 MW–130 MW) conditions, an enhanced pressure fluctuation was observed behind the upper crown cavity sealing. The dominant frequency primarily occurred in the low-frequency range (<1 Hz) and exhibited unstable behavior, with significant nonlinearity. That is, even if we choose different time signal pieces at the same working point, the low-frequency band is not the same. This can be attributed to the interaction between the newly generated frequencies caused by the flow passing through the labyrinth seal and the frequency of the vortex rope, which corresponds to the results of a simple study the authors previously conducted [34]. This phenomenon briefly emerged under near-full-load conditions, disappearing after 150 MW. Concurrently, the frequency distribution of draft tube pressure fluctuation became more concentrated as full load was attained, exhibiting a frequency band centered at 1.3 fn.
Overall, the characteristics of pressure fluctuation in turbine mode showed some similarities with those reported in reference [35]. However, under near-full-load conditions, the reference identified pressure modes corresponding to rotor–stator interaction (RSI), which were not distinctly observed in this study. One possible reason for this discrepancy is the attenuating effect of the pressure measurement pipelines. Nevertheless, information from the vibration signals can serve as a supplement at higher frequencies.

3.1.2. Vibration Acceleration in Turbine Mode

On the one hand, in terms of measurement location, the closer a measurement point is to the runner, the higher the vibration intensity, whatever the direction of the vibration. That is, the vibration in the upper bracket is the smallest, followed by the lower bracket, and the vibration in the head cover is the strongest. On the other hand, in terms of working points, lower unit output power corresponds to higher vibration levels in general. The vibration in the upper bracket is the highest at the no-load point, decreases as the power increases, and then increases again under a near-full load, but with a slight absolute value change. Vibrations in the lower bracket and head cover are generally higher at low power, with the maximum peak-to-peak value observed around 50 MW, reaching up to 50 m/s2 at head cover. Subsequently, the vibration intensity rapidly decreases and reaches a minimum value at 100 MW, with a slight increase during the load ramp-up process, from 100 MW to 150 MW. All of these characteristics can be found summarized in Figure 7. We selected two key measurement points for detailed discussion.
Low bracket Y direction (LBY): Owing to the pronounced amplitude fluctuations exhibited by the vibration sensor installed in the low bracket in the Y direction, this measurement location was selected as a representative case with which to perform an in-depth analysis on the spectral composition (Figure 8):
(1) Compared to other output power levels, the spectrum at 50 MW shows a prominent peak, located at the 140 fn frequency band, which is the main reason for the higher vibration near the lower guide bearing. Considering that the unit has 7 blades and 20 movable guide vanes, this frequency band is likely caused by pressure waves resulting from the interaction between the rotating and stationary components. With 7 × 20 = 140 being the simplest calculation, each blade excites the stationary component 20 times within one cycle, and the excitations of the seven blades are completely out of asynchronous. The phase of causes for these excitations is completely different, so resonance does not occur, leading to a relatively smaller amplitude and less stable frequency, eventually forming a frequency band near 140 fn.
(2) In most working points, there are distinct components at 21 fn, 36 fn, 48 fn, and 63 fn. Among these components, 21 fn and 63 fn are pressure modal rotation frequencies caused by the rotor–stator interaction (RSI). According to the formula from [36]:
ν = k Z b m Z s
For a 7/20 unit, the first, second, and third modal frequencies in the vaneless space are 21 fn, 42 fn, and 63 fn, respectively, as shown in Table 3. However, the sources of the 36 fn and 48 fn components remain unclear, and these two frequencies are also widely present in other measurement points.
(3) By comparing the variations in the 140 fn frequency band and those in the 21 fn band (and its sub-harmonics) under different loads, a shift in their dominance can be observed. The 140 fn band reached its maximum at 50 MW and rapidly decayed as power increased further. In contrast, the 21 fn peaked at 70 MW, bottomed out at 100 MW, and rebounded thereafter. Despite the 21 fn band having the highest amplitude, the 140 fn band contributed more to the signal power, due to its broad frequency distribution. Hence, the peak vibration at 50 MW was dominated by the 140 fn band, and the rapid decline from 50 to 100 MW also resulted from its attenuation. Above 100 MW, with the near-disappearance of the 140 fn band, vibrations were governed by the 21 fn band, exhibiting a mildly rising trend. In summary, contrary to previous studies, we emphasized the significance of high-frequency bands, which posed a greater threat to the unit compared to rotor–stator interaction under low-load conditions.
Head cover Z direction (HCZ): In practical operation, the plant staff perceived significant vibrations when working near the head cover. As evident from the vertical axis of Figure 7, compared to other locations, the peak-to-peak value of vibration near the head cover was extremely pronounced, with the average close to 40 m/s2. Therefore, the Z-direction vibration in the head cover was selected for additional analysis (Figure 9):
(1) Aside from the 140 fn frequency band, the main frequency component of the vibration is concentrated at 21 fn, with a small presence of 42 fn and 14 fn components. The 36 fn and 48 fn components are not obvious.
(2) At 50 MW, the 140 fn frequency band also exhibits higher vibration intensity, representing the working point with the strongest vibration. As the power continues to increase, both the 140 fn and 21 fn bands decrease, resulting in reduced vibration and reaching a minimum vibration level at 100 MW. At a near-full load, the 21 fn band increases again, but due to the near-disappearance of the 140 fn band, the peak-to-peak value of the vibration does not increase significantly. Due to the simpler frequency components of the head cover vibration, we can more easily draw a conclusion: in turbine mode, vibration is influenced by the 140 fn frequency band as simple excitation, and by the 21 fn band as pressure modal rotation, with a dominance in the 140 fn band over the 21 fn one.
(3) Compared to the LBY, the 21 fn (and its sub-harmonic) component at HCZ was significantly increased, being three times that of the LBY. This substantial growth in the 21 fn band also accounted for the higher vibration intensity observed in the HCZ. Meanwhile, the high-frequency band peak corresponding to 140 fn became less pronounced, overall resembling high-frequency random noise. However, the dominant relationships between the frequency components did not change.

3.2. Pump Mode

3.2.1. Pressure Fluctuation in Pump Mode

A comparison was made between zero-flow pumping and normal pumping. In the low-frequency range, the stability of pressure fluctuation is relatively worse after opening the guide vanes. After the guide vanes are opened, the 1fn component becomes more prominent, while higher amplitudes occur at 0.19 fn in the volute inlet, 0.09 fn in the volute end, and 0.37 fn in the draft tube inlet, as well as a frequency band near 1.3 fn in the elbow section of the draft tube and a noticeable 0.5 fn in the draft tube outlet. Inside the area behind the labyrinth seal at the upper crown cavity, a frequency component of 0.3 fn is observed, while the pressure fluctuation spectrum does not show significant changes in vaneless space, although this is somewhat against common sense, as shown in Figure 10. Due to the excessive length of the pressure measurement pipeline, the high-frequency components of the pressure fluctuation were not captured by the pressure sensors, but we can analyze vibration signals as a supplement to high-frequency information.

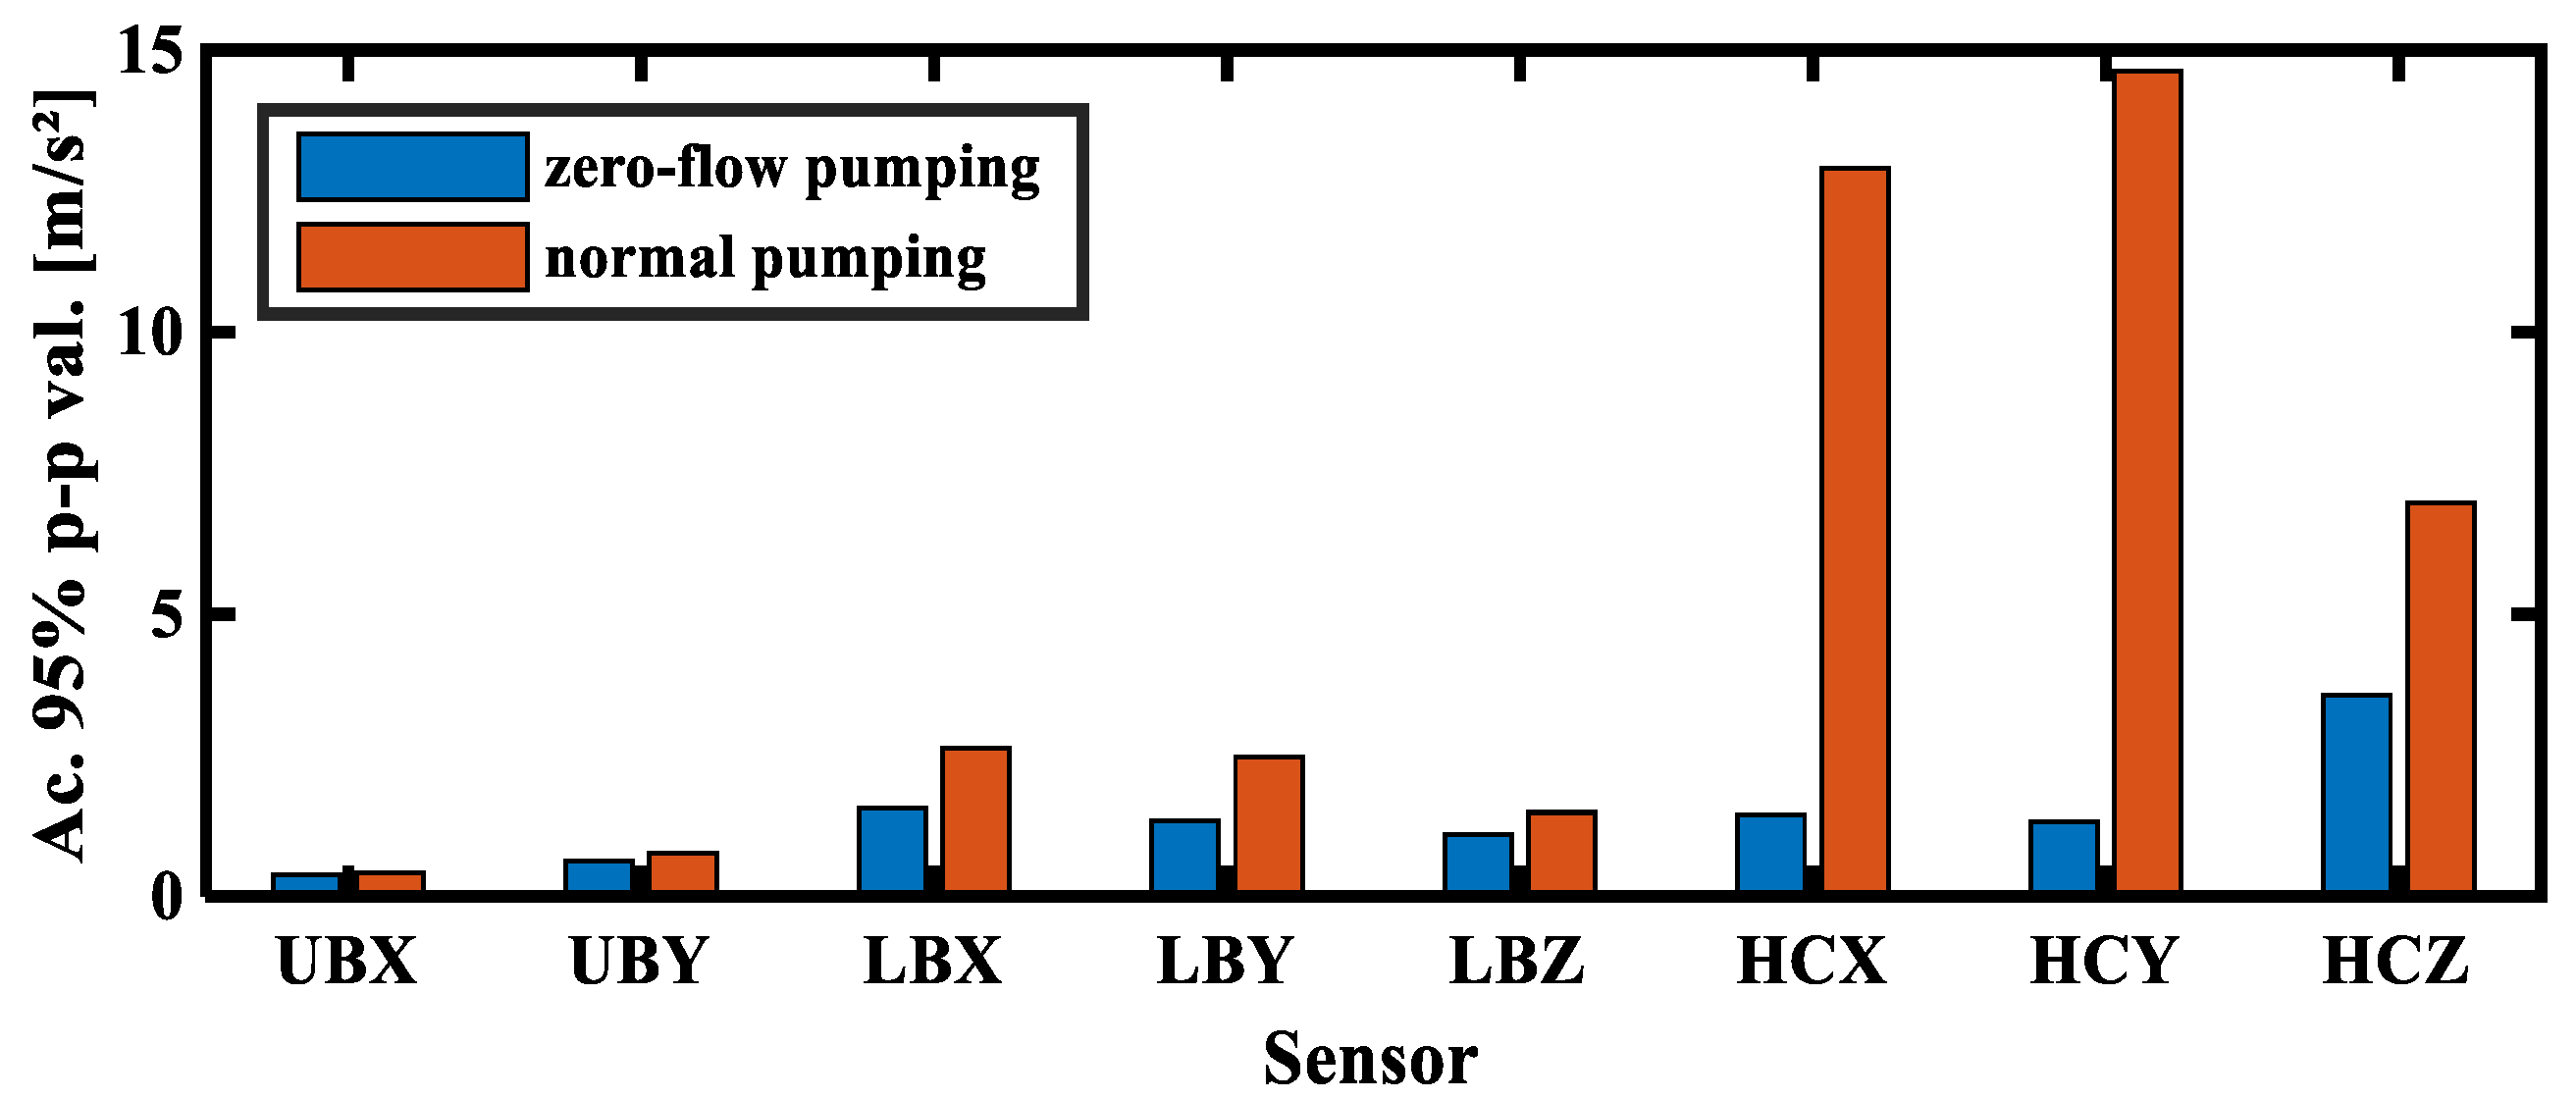
3.2.2. Vibration Acceleration in Pump Mode

In the normal pumping stage after the guide vanes were opened, the vibration in the unit significantly increased, and the vibration amplification near the water guide bearing was the most obvious. The peak-to-peak value of Y direction vibration at the head cover increased from 1.3 m/s2 to 14.36 m/s2, representing a 1004% increase, as shown in Figure 11. From the frequency spectrum analysis, the vibration at the upper bracket is mainly attributed to the 90 fn frequency component. Considering that the generator has 15 pole pairs, and this frequency does not appear at other locations, we attribute it to the generator. In addition, at all measurement points, the dominant frequency is 21 fn, which is the modal rotation frequency caused by the RSI.
At the lower bracket, the frequencies of 36 fn, 48 fn, 60 fn, and 72 fn are also noticeable, but there are no clues regarding the causes of these frequencies. During normal pumping operation, the amplitudes of these frequencies weaken, with a slight increase at 20 fn, which is the blade-passing frequency (BPF). For the vibration at the head cover, the 21 fn component during zero-flow pumping is significantly higher than that during normal pumping, but the high-frequency band components during normal pumping are higher compared to during the zero-flow pumping condition, as shown in Figure 12. Ultimately, the peak-to-peak value of vibration during normal pumping is stronger, indicating that the main factors enhancing the vibration near the water guide bearing are the high-frequency band components, rather than the 21 fn component. These high-frequency band components exhibit a continuous frequency band with several peaks, presenting a typical frequency response function (FRF) shape, especially in the HCX and HCY as two different directions to show a completely different shape, suggesting that the head cover is subjected to broad-frequency excitations that partially excite the natural frequencies of the structural components. Through the above analysis, it can be observed that the studied pump turbine experiences intense vibrations in the head cover, influenced by both the pressure mode generated by the RSI and the structural mode derived from the natural frequencies of the structural components. Each of these factors dominates under different working points of the unit.

4. Conclusions

In this study, a field measurement was conducted to investigate the stability characteristics of a pump turbine at multiple working points. Pressure sensors and accelerometers were installed to capture information in both the low-frequency and high-frequency ranges. The main research findings are summarized as follows.
In turbine mode, the pressure fluctuation stability of the unit presents three stages as the output power increases from 0 to 150 MW. At low, medium, and high loads, the main components of the pressure fluctuation come from the flow in the volute, the vortex rope of the draft tube, and the clearance flow in the crown cavity. The vibration in the unit is primarily affected by the RSI, leading to frequencies of pressure modal rotation (21 fn) and a simple pressure wave (140 fn). The 140 fn component induces a frequency band with higher power, and dominates at low loads. Most measurement points exhibit the highest vibration intensity at 50 MW and the lowest at 100 MW. This indicates that the design point (150 MW) is not the optimal solution in terms of operational stability, although it may have higher hydraulic efficiency.
In pump mode, the stability of normal pumping is worse than that of zero-flow pumping. The pressure fluctuation in the pressure measurement points exhibits distinct characteristics in the low-frequency range. The frequency spectrum shows the coexistence of the 21 fn band and continuous frequency bands with several peaks, which means that vibration characteristics are mainly affected by the pressure modal rotation caused by the RSI and the structural modal frequencies.
These experimental results will be further compared with the flow field results of CFD simulation and structural modal tests in future work to gain a better understanding of the specific causes and processes behind these frequencies.

Author Contributions

H.H. and X.S.: conceptualization, supervision, and field test command and propulsion; M.X.: data curation, formal analysis, and writing—original draft. W.Z.: investigation, methodology, and data acquisition. W.W.: writing—review and editing. Z.W.: methodology, validation, and funding acquisition. All authors have read and agreed to the published version of the manuscript.

Funding

This study was supported by the project “Research on Transient Intense Vibration in Head Cover During Transient Processes in Baishan Hydropower Station” (project no. 462132-9003001-F101).

Data Availability Statement

For the sake of information security, the original data used in this paper will not be disclosed.

Acknowledgments

The authors of this paper would like to express gratitude to the leadership and staff of Baishan Hydropower Station for their support in arranging the testing and installation of equipment. Special thanks are also extended to Shuhua Technology of Hunan Province, China for providing the acquisition modality and technical support for this research.

Conflicts of Interest

The authors declare no conflict of interest.

References

  1. China Renewable Energy Engineering Institute. China Renewable Energy Development Report 2022. 2023. Available online: http://www.creei.cn/web/content.html?id=5429 (accessed on 17 September 2023).
  2. Zhao, X.X.; Ren, Y.; Sha, Y.B.; Zhang, L.L.; Hou, S.C.; Xiao, F.M.; Chen, F.M.; Chen, S.D.; He, K.D.; Luo, L.J.; et al. Research on the Impact of Hydro-PV Complementary System Operation on Power Grid Based on New Energy Consumption. Math. Probl. Eng. 2022, 2022, 8459948. [Google Scholar] [CrossRef]
  3. Guerra, K.; Haro, P.; Gutierrez, R.E.; Gomez-Barea, A.A. Facing the high share of variable renewable energy in the power system: Flexibility and stability requirements. Appl. Energy 2022, 310, 118561. [Google Scholar] [CrossRef]
  4. Morabito, A.; Hendrick, P. Pump as turbine applied to micro energy storage and smart water grids: A case study. Appl. Energy 2019, 241, 567–579. [Google Scholar] [CrossRef]
  5. Heard, B.P.; Brook, B.W.; Wigley, T.M.L.; Bradshaw, C.J.A. Burden of proof: A comprehensive review of the feasibility of 100% renewable-electricity systems. Renew. Sustain. Energy Rev. 2017, 76, 1122–1133. [Google Scholar] [CrossRef]
  6. Zuo, Z.G.; Liu, S.H. Flow-Induced Instabilities in Pump-Turbines in China. Engineering 2017, 3, 504–511. [Google Scholar] [CrossRef]
  7. Asomani, S.N.; Yuan, J.P.; Wang, L.Y.; Appiah, D.; Zhang, F. Geometrical effects on performance and inner flow characteristics of a pump-as-turbine: A review. Adv. Mech. Eng. 2020, 12, 1687814020912149. [Google Scholar] [CrossRef]
  8. Egusquiza, E.; Valero, C.; Huang, X.X.; Jou, E.; Guardo, A.; Rodriguez, C. Failure investigation of a large pump-turbine runner. Eng. Fail Anal. 2012, 23, 27–34. [Google Scholar] [CrossRef]
  9. Yu, A.; Wang, Y.S.; Tang, Q.H.; Lv, R.R.; Yang, Z.P. Investigation of the vortex evolution and hydraulic excitation in a pump-turbine operating at different conditions. Renew. Energy 2021, 171, 462–478. [Google Scholar] [CrossRef]
  10. Li, L.; Tan, D.; Yin, Z.; Wang, T.; Fan, X.; Wang, R. Investigation on the multiphase vortex and its fluid-solid vibration characters for sustainability production. Renew. Energy 2021, 175, 887–909. [Google Scholar] [CrossRef]
  11. Li, L.; Xu, W.X.; Tan, Y.F.; Yang, Y.S.; Yang, J.G.; Tan, D.P. Fluid-induced vibration evolution mechanism of multiphase free sink vortex and the multi-source vibration sensing method. Mech. Syst. Signal Proces. 2023, 189, 110058. [Google Scholar] [CrossRef]
  12. Kim, S.J.; Suh, J.W.; Yang, H.M.; Park, J.; Kim, J.H. Internal flow phenomena of a Pump-Turbine model in turbine mode with different Thoma numbers. Renew. Energy 2022, 184, 510–525. [Google Scholar] [CrossRef]
  13. Lin, T.; Li, J.; Xie, B.F.; Zhang, J.R.; Zhu, Z.C.; Yang, H.; Wen, X.M. Vortex-Pressure Fluctuation Interaction in the Outlet Duct of Centrifugal Pump as Turbines (PATs). Sustainability 2022, 14, 15250. [Google Scholar] [CrossRef]
  14. Xia, L.S.; Cheng, Y.G.; Yang, J.D.; Cai, F. Evolution of flow structures and pressure fluctuations in the S-shaped region of a pump-turbine. J. Hydraul. Res. 2019, 57, 107–121. [Google Scholar] [CrossRef]
  15. Pang, S.J.; Zhu, B.S.; Shen, Y.D.; Chen, Z.M. S-shaped characteristics of pump turbine with large guide vane opening by experimental and numerical analysis. AIP Adv. 2023, 13, 015201. [Google Scholar] [CrossRef]
  16. Gentner, C.; Sallaberger, M.; Widmer, C.; Bobach, B.J.; Jaberg, H.; Schiffer, J.; Senn, F.; Guggenberger, M. Comprehensive experimental and numerical analysis of instability phenomena in pump turbines. In Proceedings of the 27th Iahr Symposium on Hydraulic Machinery and Systems (Iahr 2014), Montreal, QC, Canada, 22–26 September 2014; Volume 22. [Google Scholar] [CrossRef]
  17. Zhang, W.W.; Chen, Z.M.; Zhu, B.S.; Zhang, F. Pressure fluctuation and flow instability in S-shaped region of a reversible pump-turbine. Renew. Energy 2020, 154, 826–840. [Google Scholar] [CrossRef]
  18. Deniz, S.; Asaro, F. Improvements of Flow Control with Fluid Injection for the Suppression of Flow Instabilities in Pump-Turbines. In Proceedings of the Asme 2021 Fluids Engineering Division Summer Meeting (Fedsm 2021), Virtual, 10–12 August 2021; Volume 2. [Google Scholar]
  19. Liu, J.T.; Wu, Y.L.; Wang, L.Q. Instability Analysis of a Model Pump-Turbine with MGV Based on Nonlinear Partially Averaged Navier-Stokes Methods. Adv. Mech. Eng. 2013, 5, 710769. [Google Scholar] [CrossRef]
  20. Chen, H.; Lu, Y.; Liu, K.; Zhang, Z.; Li, H.; Huang, X.; Zhao, W.; Wang, Z. Study on the Internal Flow Characteristics of Long and Short Blade Runners of a 1000 MW Francis Turbine under Different Opening Conditions. Processes 2023, 11, 1796. [Google Scholar] [CrossRef]
  21. Hu, J.H.; Yang, J.B.; He, X.H.; Zeng, W.; Zhao, Z.G.; Yang, J.D. Transition of amplitude-frequency characteristic in rotor-stator interaction of a pump-turbine with splitter blades. Renew. Energy 2023, 205, 663–677. [Google Scholar] [CrossRef]
  22. Song, H.Q.; Zhang, J.F.; Huang, P.; Cai, H.K.; Cao, P.Y.; Hu, B. Analysis of Rotor-Stator Interaction of a Pump-Turbine with Splitter Blades in a Pump Mode. Mathematics 2020, 8, 1465. [Google Scholar] [CrossRef]
  23. Qin, Y.L.; Li, D.Y.; Zhu, Y.T.; Wang, H.J.; Wei, X.Z. Influence of geometric factors at runner outlet on the hump characteristics of a pump-turbine. Sustain. Energy Technol. Assess. 2022, 51, 101890. [Google Scholar] [CrossRef]
  24. Yang, G.; Shen, X.; Shi, L.; Meng, J.; Luo, W.; Zhang, D.; van Esch, B.P.M. Unsteady numerical investigations of the effect of guide vane openings on the hydrodynamic characteristics under stall conditions in a pump-turbine pump mode. Energy Convers. Manag. 2023, 293, 117499. [Google Scholar] [CrossRef]
  25. Barrio, R.; Fernandez, J.; Blanco, E.; Parrondo, J.; Marcos, A. Performance characteristics and internal flow patterns in a reverse-running pump-turbine. Proc. Inst. Mech. Eng. Part C J. Mech. Eng. Sci. 2012, 226, 695–708. [Google Scholar] [CrossRef]
  26. Valentin, D.; Presas, A.; Bossio, M.; Egusquiza, M.; Egusquiza, E.; Valero, C. Feasibility of Detecting Natural Frequencies of Hydraulic Turbines While in Operation, Using Strain Gauges. Sensors 2018, 18, 174. [Google Scholar] [CrossRef] [PubMed]
  27. Valentin, D.; Presas, A.; Valero, C.; Egusquiza, M.; Egusquiza, E. Detection of Hydraulic Phenomena in Francis Turbines with Different Sensors. Sensors 2019, 19, 4053. [Google Scholar] [CrossRef]
  28. Hu, J.H.; Yang, J.B.; Zeng, W.; Zhao, Z.G.; Yang, J.D. Hydraulic interaction of two parallel pump-turbines in constant-speed oscillation: Measurement, simulation, and sensitivity analysis. Renew. Energy 2021, 176, 269–279. [Google Scholar] [CrossRef]
  29. Zhang, Y.N.; Chen, T.; Li, J.W.; Yu, J.X. Experimental Study of Load Variations on Pressure Fluctuations in a Prototype Reversible Pump Turbine in Generating Mode. J. Fluid Eng. 2017, 139, 074501. [Google Scholar] [CrossRef]
  30. Hu, J.H.; Yang, J.D.; Zeng, W.; Yang, J.B. Transient Pressure Analysis of a Prototype Pump Turbine: Field Tests and Simulation. J. Fluid Eng. 2018, 140, 071102. [Google Scholar] [CrossRef]
  31. Zhang, F.; Lowys, P.Y.; Houdeline, J.B.; Guo, X.D.; Hong, P.; Laurant, Y. Pump-turbine Rotor-Stator Interaction Induced Vibration: Problem Resolution and Experience. In Proceedings of the 30th Iahr Symposium on Hydraulic Machinery and Systems (Iahr 2020), Lausanne, Switzerland, 21–26 March 2021; Volume 774. [Google Scholar] [CrossRef]
  32. Kim, S.J.; Suh, J.W.; Choi, Y.S.; Park, J.; Park, N.H.; Kim, J.H. Inter-Blade Vortex and Vortex Rope Characteristics of a Pump-Turbine in Turbine Mode under Low Flow Rate Conditions. Water 2019, 11, 2554. [Google Scholar] [CrossRef]
  33. Zhang, Y.N.; Zhang, Y.N.; Wu, Y.L. A review of rotating stall in reversible pump turbine. Proc. Inst. Mech. Eng. Part C J. Mech. Eng. Sci. 2017, 231, 1181–1204. [Google Scholar] [CrossRef]
  34. Hu, H.P.; Xia, M.; Qiao, M.; Wang, W.; Wang, J.Z.; Wang, Z.W. A Simulation Study of Hydraulic Vibration caused by Clearance Flow in a Pump Turbine. IOP Conf. Ser. Earth Environ. Sci. 2022, 1079, 012032. [Google Scholar] [CrossRef]
  35. Zheng, X.; Zhang, S.; Zhang, Y.; Li, J.; Zhang, Y. Dynamic characteristic analysis of pressure pulsations of a pump turbine in turbine mode utilizing variational mode decomposition combined with Hilbert transform. Energy 2023, 280, 128148. [Google Scholar] [CrossRef]
  36. Doerfler, P. On the role of phase resonance in vibrations caused by blade passage in radial hydraulic turbomachines. IAHRSection Hydraulic Machinery, Equipment, and Cavitation. In Proceedings of the 12th IAHR Symposium on Hydraulic Machineryand System, Stirling, UK, 27–30 August 1984. [Google Scholar]
Figure 1. Installation locations of pressure sensors.
Water 15 03378 g001
Figure 2. Installation locations of accelerometers.
Water 15 03378 g002
Figure 3. Pressure signal statistical indices at different power conditions.
Water 15 03378 g003
Figure 4. Pressure signal spectra under typical power conditions: (a) low load; (b) medium load; (c) near-full load; (d) full load.
Water 15 03378 g004
Figure 5. Governor slave computer monitoring data of whole test process.
Water 15 03378 g005
Figure 6. Pressure amplitude and frequency of vortex rope.
Water 15 03378 g006
Figure 7. Acceleration signal statistical indices at different power levels.
Water 15 03378 g007
Figure 8. Acceleration signal spectra of different power levels in the LBY: (a) all frequencies and (b) comparison of typical frequency amplitudes.
Water 15 03378 g008
Figure 9. Acceleration signal spectra of different power in the HCZ: (a) all frequencies and (b) comparison of typical frequencies amplitude.
Water 15 03378 g009
Figure 10. Comparison of pressure signal spectra between zero-flow pumping and normal pumping.
Water 15 03378 g010
Figure 11. Comparison of peak-to-peak value of acceleration between zero-flow pumping and normal pumping.
Water 15 03378 g011
Figure 12. Comparison of acceleration signal spectra between zero-flow pumping and normal pumping.
Water 15 03378 g012
Table 1. Typical pump turbine parameters.
Geometric parametersVolute inlet diameter~4200 mm
Runner inlet diameter (D1)~5200 mm
Runner outlet diameter (D2)~4100 mm
Turbine modeSpecific speed (ns)228
Rated head105.8 m
Rated output power150 MW
Rated speed200 rpm
Rated discharge148.7 m3/s
Pump modeDesign head126.7 m
Maximum discharge138 m3/s
Maximum input power157.95 MW
Table 2. Tested working points.
Turbine modelow load (10–40 MW)
medium load (70–90 MW)
full load (100–130 MW)
Pump modezero-flow
normal pumping
Table 3. Theoretical values of pressure modal rotation.
kmvMode Shape
3111 ND
6222 ND
9333 ND
Disclaimer/Publisher’s Note: The statements, opinions and data contained in all publications are solely those of the individual author(s) and contributor(s) and not of MDPI and/or the editor(s). MDPI and/or the editor(s) disclaim responsibility for any injury to people or property resulting from any ideas, methods, instructions or products referred to in the content.

