Article

Revelation and Projection of Historic and Future Precipitation Characteristics in the Haihe River Basin, China

1
School of Water Conservancy and Hydroelectric Power, Hebei University of Engineering, Handan 056038, China
2
Hebei Institute of Water Resources, Shijiazhuang 050051, China
3
Yellow River Engineering Consulting Co., Ltd., Zhengzhou 450003, China
*
Author to whom correspondence should be addressed.
Water 2023, 15(18), 3245; https://doi.org/10.3390/w15183245
Submission received: 15 July 2023 / Revised: 1 September 2023 / Accepted: 8 September 2023 / Published: 12 September 2023

Abstract

:
Precipitation, as one of the main components of the hydrological cycle, is known to be significantly impacted by global climate change. In recent years, the frequency of extreme precipitation has increased, resulting in greater destructiveness. Atmospheric circulation has a significant impact on extreme precipitation in a region. This study aims to investigate the prospective changes in extreme precipitation and their relationship with large-scale atmospheric circulation in the Haihe River Basin. The Haihe River Basin is located in the North China Plain. Mountains and plains can be found in both the eastern and western parts of the study region. The summer seasons experience the most precipitation. The monthly and extreme precipitation (based on daily precipitation) results from the Coupled Model Intercomparison Project Phase 6 (CMIP6) models were evaluated using observed precipitation data, which was utilized as a reference. The CMIP6 models were used to assess future changes in the characteristics of extreme precipitation in the study region. The relationship between extreme precipitation and large-scale atmospheric circulation was also analyzed using historical observation data. Remote sensing results regarding land cover and soil erosion were used to analyze the risks of extreme precipitation and their influences in the study region. According to the results, their multi-model ensembles (MME) and BCC-CSM2-MR models, respectively, outperformed all other CMIP6 models in simulating monthly and extreme (based on daily precipitation) precipitation over the study region. Extreme precipitation demonstrated a rising degree of contribution and future risk under numerous scenarios. The degrees of contribution of R95p and R99p are anticipated to increase in the future. BCC-CSM2-MR predicted that Rx1day and Rx5day would decline in the future. Generally, extreme precipitation increased to a greater degree under SSP585 than under SSP245. Both the El Niño–Southern Oscillation and the Pacific Decadal Oscillation displayed substantial resonance with the extreme precipitation from 1962 to 1980 and around 1995, respectively. This study not only improves our understanding of the occurrence of extreme precipitation, but it also serves as a reference for flood control and waterlogging prevention in the Haihe River Basin.

1. Introduction

Recent decades have witnessed an increase in the frequency and severity of extreme climatic events, which have had devastating impacts on the fragile environment and human society [1,2,3,4]. The Intergovernmental Panel on Climate Change, in its Special Report on Global Warming, estimated that the global mean temperature has increased by about 1.08 °C since the beginning of the Industrial Revolution [5]. Numerous studies also indicate that global warming will lead to more destructive, high-frequency, and unpredictable extreme climatic events [6,7]. Extreme weather precipitation deserves close attention as a type of destructive and uncertain extreme climatic event. As a result of global warming, extreme weather precipitation has been occurring more frequently and with greater intensity than ever before [4,7]. Extreme precipitation as a type of extreme weather often has a serious negative impact on agricultural production, the ecological environment, and the socioeconomic situation [3].
Extreme precipitation is commonly defined by indexes and occurrences [8,9]. These events are usually significant precipitation events, such as the once in a thousand years precipitation event in Zhengzhou on 20 July 2021 (the maximum hourly precipitation was 201.9 mm) [9] and the once in 50 years precipitation event in Wuhan on 23 July 2015 (the maximum hourly precipitation was 84.1 mm) [10]. Both the precipitation that occurred in Zhengzhou on 20 July 2021 and Wuhan on 23 July 2015 were caused by excessive atmospheric water vapor and were related with dynamic atmospheric factors [9,10]. The Expert Team on Climate Change Detection and Indices developed, employed, and recommended extreme precipitation indices [8,11]. These indices have been widely employed in numerous studies. Jeferson et al. [8] employed the PRCPTOT, R95p, and Rx5day indexes to define and estimate the Coupled Model Intercomparison Project’s simulated extreme precipitation. Wang et al. [12] used the R99p, R95P, Rx5day, and R10mm indexes to analyze the extreme precipitation change trend in permafrost-dominated Siberia. Yuan et al. [13] investigated long-duration extreme precipitation in China using Rx15day and Rx30day. Therefore, extreme precipitation indexes have been quantified according to previous studies. Historically, extreme precipitation risk has also been quantified in earlier studies. Wang et al. [12], for example, used the linear regression approach to analyze the trend change in extreme precipitation risk. Yuan et al. [13] described and evaluated the risk using the generalized extreme value distribution method. Li et al. [14] used the Weibull, two-parameter gamma, Pearson-III type, and Poisson distribution methods to investigate risk in different climate regions. Almazroui et al. [15] investigated the contribution of extreme daily precipitation to the Arabian Peninsula’s annual precipitation. The distribution function, trend analysis, and contribution degree may be extensively utilized in risk estimation studies. The risk of extreme precipitation will be of greater concern in the future than it has been in the past. The above-mentioned approaches will also be required to examine future extreme precipitation characteristics.
Previous studies indicated that large-scale air circulation could have an impact on regional hydrological and climatic characteristics [11,16]. Large-scale air circulation could circulate and disperse water vapor in a region. Some triggers (such as the convergence of cold and warm air) could result in extreme precipitation due to a huge volume of water vapor in a region [16]. Moreover, large-scale air circulation may also be linked to extreme precipitation in a region [16,17]. Liu et al. [11], for example, investigated the relationship between large-scale ocean atmospheric circulation patterns and precipitation in the Weihe River Basin. In addition, Ullah et al. [16] investigated the relationship between large-scale atmospheric circulation patterns and extreme monsoon precipitation in Pakistan. Large-scale atmospheric circulation could also have an impact on extreme precipitation.
The use of remote sensing technologies could aid in investigating the spatial impact of extreme precipitation in a region [18,19]. Huang et al. [19], for example, used a new approach to combine gauge precipitation observations and remote sensing precipitation outputs. Abuzaid et al. [18] used remote sensing technology to investigate the effect of precipitation on soil erosion. Liu et al. [17] also investigated flood peak responses to land use and landscape patterns under extreme precipitation scenarios in small catchments using remote sensing technology. Remote sensing technology was widely used in this extreme precipitation study.
Coupled Model Intercomparison Project Phase 6 (CMIP6) was widely utilized to forecast future precipitation changes [5,6,20]. Numerous studies also revealed that multi-model ensembles (MME) performed better than a single model in predicting monthly precipitation. Ding et al. [21], for example, discovered that MME performed better than 12 single models for monthly precipitation in the Yellow River Basin. Extreme precipitation is often described as an extreme event over a specific period of time [6,15]. However, the methods for calculating extreme precipitation and monthly precipitation differed. Typically, monthly precipitation is simply an accumulation of daily precipitation. Extreme precipitation often displayed extreme characteristics throughout the period of daily precipitation. Based on the findings of the above studies, we discovered that MME performed better than a single model for monthly precipitation. During a period of daily precipitation, data was frequently used to compute extreme precipitation. Extreme precipitation also exhibited regional characteristics in relation to climate and topography [22], etc. MME did not exhibit better performance than a single model in simulating extreme precipitation in a region [2,5]. Therefore, the goal of this research is to evaluate the CMIP6 model’s effectiveness in simulating monthly and extreme (based on daily precipitation) precipitation in the Haihe River Basin. Numerous studies revealed that precipitation was unevenly distributed across time, with the majority of precipitation and discharge occurring in the summer [23,24]. Numerous studies using CMIP6 found that precipitation showed an increasing trend, and that it would likely become more unpredictable in China [21,25]. The study area included a sizable population, as well as major cities such as Beijing, Tianjing, and Zhengzhou [23]. Additionally, the research area was traversed by the South–North Water Diversion Project’s Middle Route Project. As a result, the research area included many cities with major water conservation facilities. This study was also necessary to investigate future changes in extreme precipitation in the Haihe River Basin.
Generally, this study used daily precipitation, large-scale atmospheric circulation data, and land cover and soil erosion remote sensing data. We evaluated the precipitation performance of the CMIP6 models using the aforementioned data. We also examined the potential future changes and the impact of extreme precipitation. The periodicity of precipitation and the teleconnection relationship between extreme precipitation and large-scale atmospheric circulation in the study region were also analyzed. The following are the objectives of this study: (1) to assess the CMIP6 model’s performance in simulating monthly and extreme (based on daily precipitation) precipitation. This involves investigating whether the CMIP6 model is suitable for predicting extreme precipitation in the Haihe River Basin; (2) to analyze historical and future changes in extreme precipitation; and (3) to investigate the degree of impact and the once-in-a-century value of extreme precipitation. This study serves as a reference for future flood management and waterlogging basin planning, as well as for extreme precipitation research in the study region.

2. Data and Methods

2.1. Study Area

As shown in Figure 1a, the Haihe River Basin is located between 112°–120° E and 35°–43° N [26] in the North China Plain, East Asia. This river basin covers an area of approximately 3.28 million km2. The terrain of the Haihe River Basin is higher in the northwest and lower in the southeast. The Haihe River has five major tributaries (including the Chaobai River, the Yongding River, the Daqing River, the Ziya River, and the South Canal) and one small tributary (the North Canal). The annual maximum and minimum temperatures ranged from 1.5 °C to 14 °C (observation period from 1960 to 2020) [24,26], respectively. As shown in Figure 1b,c, the average annual precipitation was approximately 520 mm, with the majority of it occurring during the summer period (from June to August) [24]. According to Figure 1b, the spatial distribution of the Haihe River Basin precipitation was higher in the southeast and lower in the northwest.

2.2. Datasets in This Study

Observed precipitation data for this study were obtained from the Dataset of Gridded Daily Precipitation in China (DGDPC) (https://data.tpdc.ac.cn/ (accessed on 20 July 2020)). The dataset comprises daily precipitation observations from 2474 national-level ground stations for the years 1961 to 2014. The dataset had a spatial resolution of 0.5° × 0.5° and was established using the thin-plate spline method [19,27]. Many studies have used the precipitation dataset in related research [28,29]. Jiang [28], for example, used the DGDPC precipitation dataset to evaluate the ERA5 reanalysis precipitation data. Du [29] also used the DGDPC precipitation dataset to estimate other precipitation events in China. Additionally, the DGDPC dataset has been extensively used to investigate extreme precipitation in China [13,30] due to its reliability and accuracy.
CMIP6’s simulated precipitation data was also used to investigate prospective precipitation and evaluate historical precipitation among different models. The CMIP6 data was obtained from the Coupled Model Intercomparison Project (https://esgf-node.llnl.gov/search/cmip6/ (accessed on 22 July 2020)). As shown in Table 1, this study selected 19 CMIP6 models and their multi-model ensembles (MME). Numerous studies employed 19 CMIP6 models, which proved to be highly reliable [2,5,21,25]. We used the arithmetic mean method [2,21] to compute the MME on the selected 19 CMIP6 models. We used the bilinear interpolation [21,31] method to change the resolution in order to convert the spatial resolution from the CMIP6 model’s daily precipitation data into 0.5° × 0.5° grid cells for China, since the CMIP6 models used different spatial resolution. Numerous previous studies have examined future precipitation changes under different emission scenarios [32,33], with SSP585 and SSP245 representing very high and intermediate greenhouse gas emissions, respectively. Future CO2 emissions under the SSP585 scenarios were roughly double the current level, but CO2 emissions under the SSP245 scenarios remained roughly the same until the middle of the century. The SSP245 and SSP585 scenarios are considered realistic and pessimistic projections, respectively [33,34]. The two scenarios have been widely used in several studies [33,34,35] due to their higher reference values compared to those of other scenarios. The purpose of this study is to explore the features of extreme precipitation variations in the region and to evaluate both high and general disaster risks to develop disaster prevention plans for the future. Therefore, SSP245 and SSP585 scenarios were selected in this study to investigate changes in precipitation.
The observed El Niño–Southern Oscillation (ENSO) and Pacific Decadal Oscillation (PDO) data were obtained from the National Oceanic and Atmospheric Administration (https://psl.noaa.gov/data/climateindices/ (accessed on 23 July 2020)). The data covers the period from 1961 to 2014 and includes annual atmospheric and ocean time series.
Land use types and soil erosion data were obtained from the Data Center for Resources and Environmental Sciences, Chinese Academy of Sciences (http://www.resdc.cn (accessed on 25 July 2020)). These data were based on the remote sensing imaging and technology from Landsat in 2020 [18,34]. Land use types and soil erosion data used a 1 km × 1 km spatial resolution. It is important to note that the spatial resolution of land use types and soil erosion data differs from the DGDPC and CMIP6 simulated precipitation data. We conducted a qualitative analysis on land use types and soil erosion characteristics based on a regional map, as shown in Figure 1a. However, precipitation was analyzed quantitatively using DGDPC and CMIP6.

2.3. Methodology

2.3.1. Extreme Precipitation Indexes

In this study, we utilized a set of eight extreme precipitation indexes to characterize the occurrence of extreme precipitation events in the Haihe River Basin, as shown in Table 2. These indexes included PRCPTOT, R10mm, R20mm, R95p, R99p, Rx1day, Rx5day, and SDII. PRCPTOT [35] (unit: mm) described the annual cumulative precipitation (greater than 1mm of daily precipitation). R10mm and R20mm [35] (unit: day), respectively, described daily precipitation of more than 10 cm and 20 cm for the same number of days in the year. R95p and R99p [11] (unit: mm), respectively, described the total daily precipitation of more than the 95th and 99th daily precipitation percentiles annually. Rx1day and Rx5day [6,13] (unit: mm), respectively, described the maximum total precipitation in one and five consecutive days annually. SDII [20] (unit: mm/day) described the mean precipitation amount per wet day. The degree of contribution of extreme precipitation was defined as the proportion of extreme precipitation in relation to annual precipitation [15].

2.3.2. Evaluation Indicators of Precipitation Performance

Numerous studies used quantitative performance evaluation indicators for CMIP6 models [25,36]. In this study, Taylor [36] and tabular thermal [10] diagrams were used to evaluate monthly precipitation performance in the Haihe River Basin. The Taylor diagram used the correlation coefficient [21], root mean square error (RMSE) [36], and standard deviation between the observed and simulated precipitation. As shown in Formulas (1)–(5), extreme precipitation was evaluated using relative bias [2], RMSE, the correlation coefficient, and RMSE-observations standard deviation ratio (RSR) [8]. The relative bias, RMSE, and RSR vary between 0 and +∞. The closer the indicators were to 0, the better the performance of the model. The correlation coefficient ranged between −1 and 1. The closer the correlation coefficient was to 1, the better the model’s performance.
As shown in Formula (6), the comprehensive rating index (CRI) was extensively utilized to rank the CMIP6 models’ methods based on numerous studies [2,8]. In this study, four indicators were used to rank the capacity of the CMIP6 models by CRI, including relative bias, RMSE, correlation coefficient, and RSR.
R M S E = i = 1 n ( S i ¯ O i ¯ ) 2 n
R S R = R M S E O s d
C o r = i = 1 n ( S i S ¯ ) ( O i O ¯ ) i = 1 n ( S i S ¯ ) i = 1 n ( O i O ¯ )
R e l a t i v e   B i a s = i = 1 n S i ¯ O i ¯ i = 1 n O i ¯
C R I = 1 1 n m i = 1 n r a n k i
where Si and Oi were simulated and observed precipitation, respectively. S ¯ and O ¯ were simulated and observed mean values of precipitation, respectively. Osd represented the standard deviation of observed precipitation. n denotes the total number of simulated or observed precipitation data, and m denotes the number of models. Moreover, the rank indicated the order of each CMIP model on each index in a given performance metric. RMSE was the root mean square error. RSR was the RMSE-observations standard deviation ratio. Cor represents the correlation coefficient. CRI was the comprehensive rating index.

2.3.3. The Once-in-a-Century Precipitation Amount

The Log-Pearson Type III method [37,38] was used to calculate the once-in-a-century extreme precipitation. This calculation was based on the extreme precipitation time series before the current year. Examples included the extreme precipitation in 2015, which was calculated based on the 1961–2014 extreme precipitation time series by the Log-Pearson Type III method. The formula for the Log-Pearson Type III method is as follows:
f ( x ) = β α Γ α ( x a 0 ) α 1 e β ( x a 0 )
C v = σ x ¯ ,   C s = n i = 1 ( x x ¯ ) 3 σ 3 · n
α = 4 C s 2 ,   β = 2 x ¯ C v C s ,   a 0 = x ¯ 1 2 C v C s
where Γ α represents the gamma function of α. α, β, a0 were the shape, scale, and location parameters of the Log-Pearson Type III method, respectively. x and x ¯ denote the annual and mean values of extreme precipitation. C v and C s represent the skew and discrete coefficients of annual extreme precipitation, respectively. σ denotes the standard deviation of annual extreme precipitation. n is the number of time series of precipitation data.

2.3.4. Cross-Wavelet Transforms

The cross-wavelet transform method was extensively used to investigate the relationship between large-scale atmospheric circulation and meteorological factors (such as precipitation and drought) [11,39,40]. The method was introduced by the Torrence and Compo [41] study. The cross-wavelet transform (CWT) was more suitable for capturing time series with changing characteristics and coupled oscillations in time and frequency [41]. CWT decomposes time series from the time domain to the time frequency domain. For a time series x n ,   ( n = 1,2 , , N ) , the formula is as follows: [42].
W n ( s ) = n = 0 N 1 x n φ * [ ( n n ) δ t s ]
where n and n denote the localized time index and the time conversion index, respectively. s denotes the scale, δ t denotes the sampling period, N denotes the number of points in the time series, φ ( t ) was a mother wavelet function, and (*) represented the complex conjugate. The wavelet power spectrum in the time series reflects the fluctuations at various scales, as well as their strong characteristics as they change with different scales. The scale corresponding to the peak indicates the primary time scale of the time series used to reflect the main period of change. However, the significance of this main period must be tested. As geophysical time series often exhibit red noise characteristics, red noise is commonly used as the background for testing the wavelet spectrum [40,42].
In this study, extreme precipitation indexes and large-scale atmospheric circulation were entered as two time series into a MATLAB (Version number: MATLAB 9.5, Creator: MathWorks, Location: Natick, Massachusetts, USA) based program package of cross-wavelet transformations.

3. Results

3.1. Evaluating the Precipitation Performance of CMIP6 Models

3.1.1. Evaluating the Performance of Monthly Precipitation

Figure 2 and Figure 3 show the performance of the 19 CMIP6 models and their multi-model ensemble (MME) for the Haihe River Basin. According to Figure 2, we discovered that CMIP6 models exhibited relatively good performance for monthly precipitation in the Haihe River Basin. MME showed the best performance in regards to precipitation among the selected CMIP6 models. However, GFDL-CM4 showed very poor performance in regards to monthly precipitation among the selected CMIP6 models. According to Figure 3, we discovered that monthly precipitation was generally underestimated by most CMIPP6 models in July, August, and September in the Haihe River Basin. Monthly precipitation was generally lower in January, February, November, and December in the Haihe River Basin. Precipitation in the Haihe River Basin was clearly underestimated by the ACCESS-ESM1-5, GFDL-CM4, and MRI-ESM2-0 models in July and August. However, the INM-CM4-8, INM-CM5-0, KIOST-ESM, and MIROC6 models obviously overestimated precipitation in the Haihe River Basin in April, May, June, July, August, and September. In addition, the GFDL-CM4 model obviously overestimated precipitation in September in the Haihe River Basin. Among the CMIP6 models, MME exhibited the lowest precipitation error across different months.

3.1.2. Evaluating the Performance of Extreme Precipitation

According to Figure 3, extreme precipitation performance was assessed using relative bias, RMSE, correlation coefficient, and RSR. Relative bias, RMSE, and RSR demonstrated that the ACCESS-ESM1–5, INM-CM4–8, INM-CM5-0, and NESMS models exhibited very poor PRCPTOT and R10mm. Relative bias, RMSE, and RSR indicated that the KIOST-ESM model performed better in the PRCPTOT and R10mm extreme precipitation simulations. ACCESS-CM2, ACCESS-ESM1-5, MIROC6, and NESM3 showed very poor simulation performance in R20mm, based on the relative bias, RMSE, and RSR indexes. KIOST-ESM showed greater simulation performance in R20mm based on the relative bias, RMSE, and RSR indexes. The CMIP6 models showed similar simulation performance in R95p, R99p, Rx1day, Rx5day, and SDII, based on relative bias and RMSE. Selected CMIP6 models showed great simulation performance in Rx1day, Rx5day, and SDII based on relative bias and RMSE. Based on the Cor evaluation indicator, ACCESS-CM2 and KACE-1-0-G exhibited greater simulation performance in different extreme precipitation indexes. Based on the Cor evaluation indicator, EC-Earth3-VegGFDL-CM4 and GFDL-ESM4 also showed greater simulation performance in PRCPTOT, R10mm, and R20mm. Based on the Cor evaluation indicator, BCC-CSM2-MR showed greater simulation performance in R10mm, R20mm, Rx5day, and SDII. Based on the Cor evaluation indicator, KIOST-ESM showed greater simulation performance in R10mm, R20mm, Rx5day, and SDII.
As shown in Table 3, the CMIP6 models were ranked and compared using CRI. Based on a thorough analysis of the evaluation indicators, we discovered that BCC-CSM2-MR, KACE-1-0-G, GFDL-ESM4, GFDL-CM4, ACCESS-CM2, and MME had mean rankings of 2.88, 6.75, 7.00, 7.75, 8.50, and 8.75, respectively, with considerably satisfactory results for the Haihe River Basin. KIOST-ESM ranked first in PRCPTOT and R20mm. BCC-CSM2-MR ranked first in R10mm and Rx5day. ACCESS-ESM1–5 and ACCESS-CM2, respectively, ranked first in R95p and R99p. KACE-1-0-G ranked first in Rx1day. Generally, BCC-CSM2-MR exhibited the greatest simulation performance based on a comprehensive analysis of evaluation indicators in selected CMIP6 models.

3.2. Precipitation Change Characteristics

3.2.1. Precipitation Change Trend

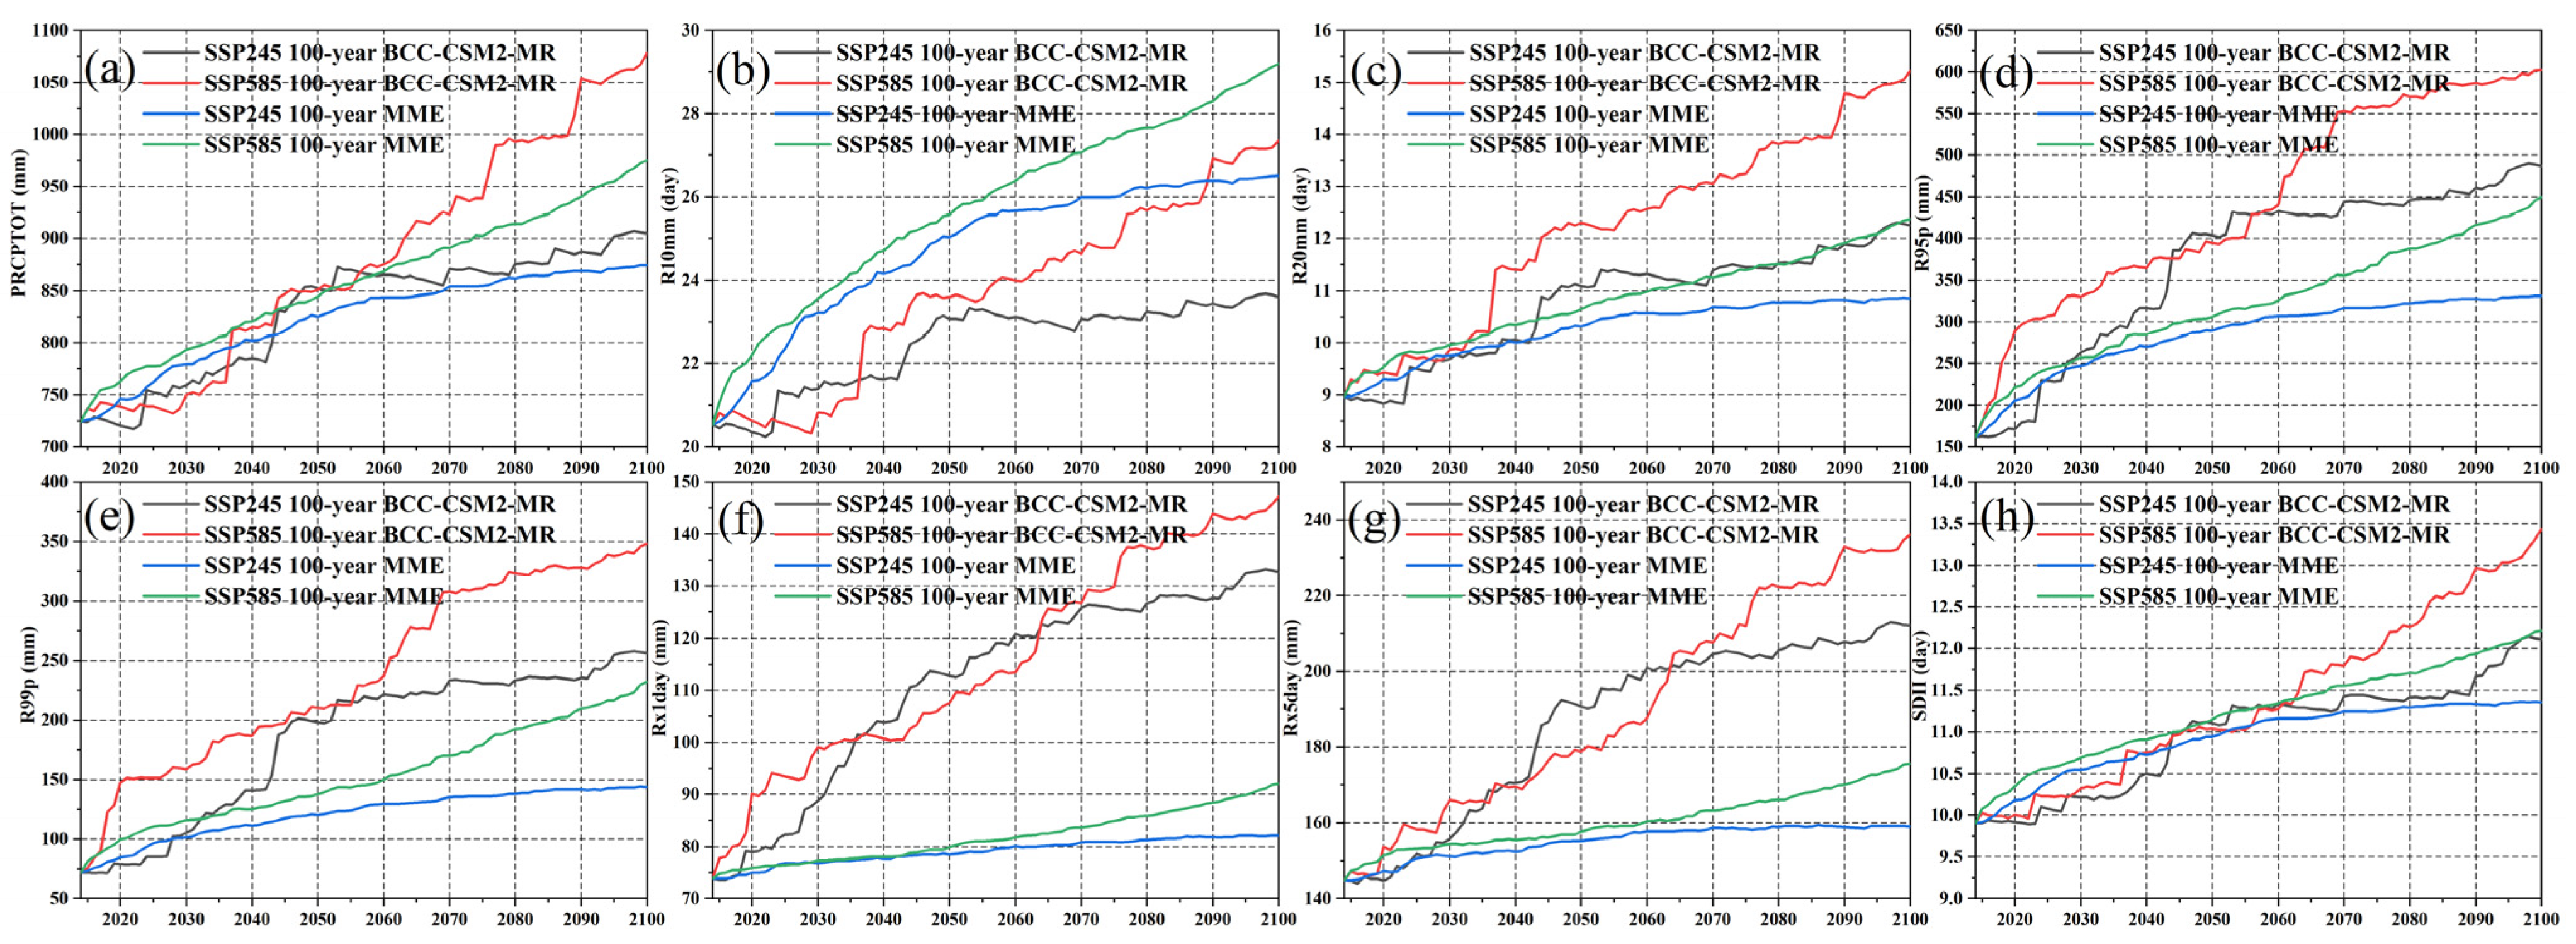
The precipitation trends of BCC-CSM2-MR and MME were analyzed based on the change trends shown in Figure 4. Figure 4a–h reveal that BCC-CSM2-MR predicts a clear increase in both annual and extreme precipitation over the Haihe River Basin in the future. The annual and extreme precipitation fluctuated significantly in the Haihe River Basin. In addition, annual and precipitation data in the BCC-CSM2-MR model demonstrated a similar increased trend between 2015 and 2050 under the SSP245 and SSP585 scenarios. The annual and extreme precipitation of the BCC-CSM2-MR model under the SSP585 scenario demonstrated a higher increasing trend than did the SSP245 scenario between 2050 and 2100. As shown in Figure 4d,e, R95p and R99p demonstrated clear peaks between 2050 and 2080 under the SSP585 scenario. Figure 4i–p shows that MME also predicts a clear increase in both annual and extreme precipitation over the Haihe River Basin in the future. The MME model predicted that annual and extreme precipitation would clearly increase in the future. The annual and extreme precipitation in the MME model demonstrated a similar increasing trend between 2015 and 2050 under the SSP245 and SSP585 scenarios. The annual and extreme precipitation of the MME model under the SSP585 scenario demonstrated a higher increasing trend than the SSP245 scenario between 2050 and 2100. Historical, annual, and extreme precipitation demonstrated stable fluctuations in the Haihe River Basin. Overall, both the BCC-CSM2-MR and MME models predict significant increases in precipitation in the Haihe River Basin in the future.
In Figure 5, we investigated once-in-a-century extreme precipitation changes in the Haihe River Basin. Both the BCC-CSM2-MR and MME models demonstrated that PRCPTOT and SDII showed a similar increasing trend for once-in-a-century extreme precipitation in the Haihe River Basin from 2015 to 2060. BCC-CSM2-MR showed that PRCPTOT and SDII showed higher once-in-a-century extreme precipitation than did MME from 2060 to 2100 under SSP245 and SSP585 emission scenarios. Generally, BCC-CSM2-MR showed that under SSP245 and SSP585 emission scenarios, R20mm, R95p, R99p, Rx1day, and Rx5day would show higher future once-in-a-century extreme precipitation than did the MME. However, MME showed that R10mm reveals a higher future once-in-a-century rate of extreme precipitation than does BCC-CSM2-MR. The MME model anticipates stable and increasing once-in-a-century extreme precipitation trends in the future. However, BCC-CSM2-MR showed that once-in-a-century extreme precipitation showed many unexpected years in the process of increasing, such as R99p under SSP585 in 2020 and 2069. Generally, both the BCC-CSM2-MR and MME models showed that once-in-a-century extreme precipitation would increase in the future under the SSP245 and SSP585 emission scenarios. Therefore, both the BCC-CSM2-MR and MME models showed a higher risk of future extreme precipitation over the Haihe River Basin.

3.2.2. Degree of Contribution of Extreme Precipitation

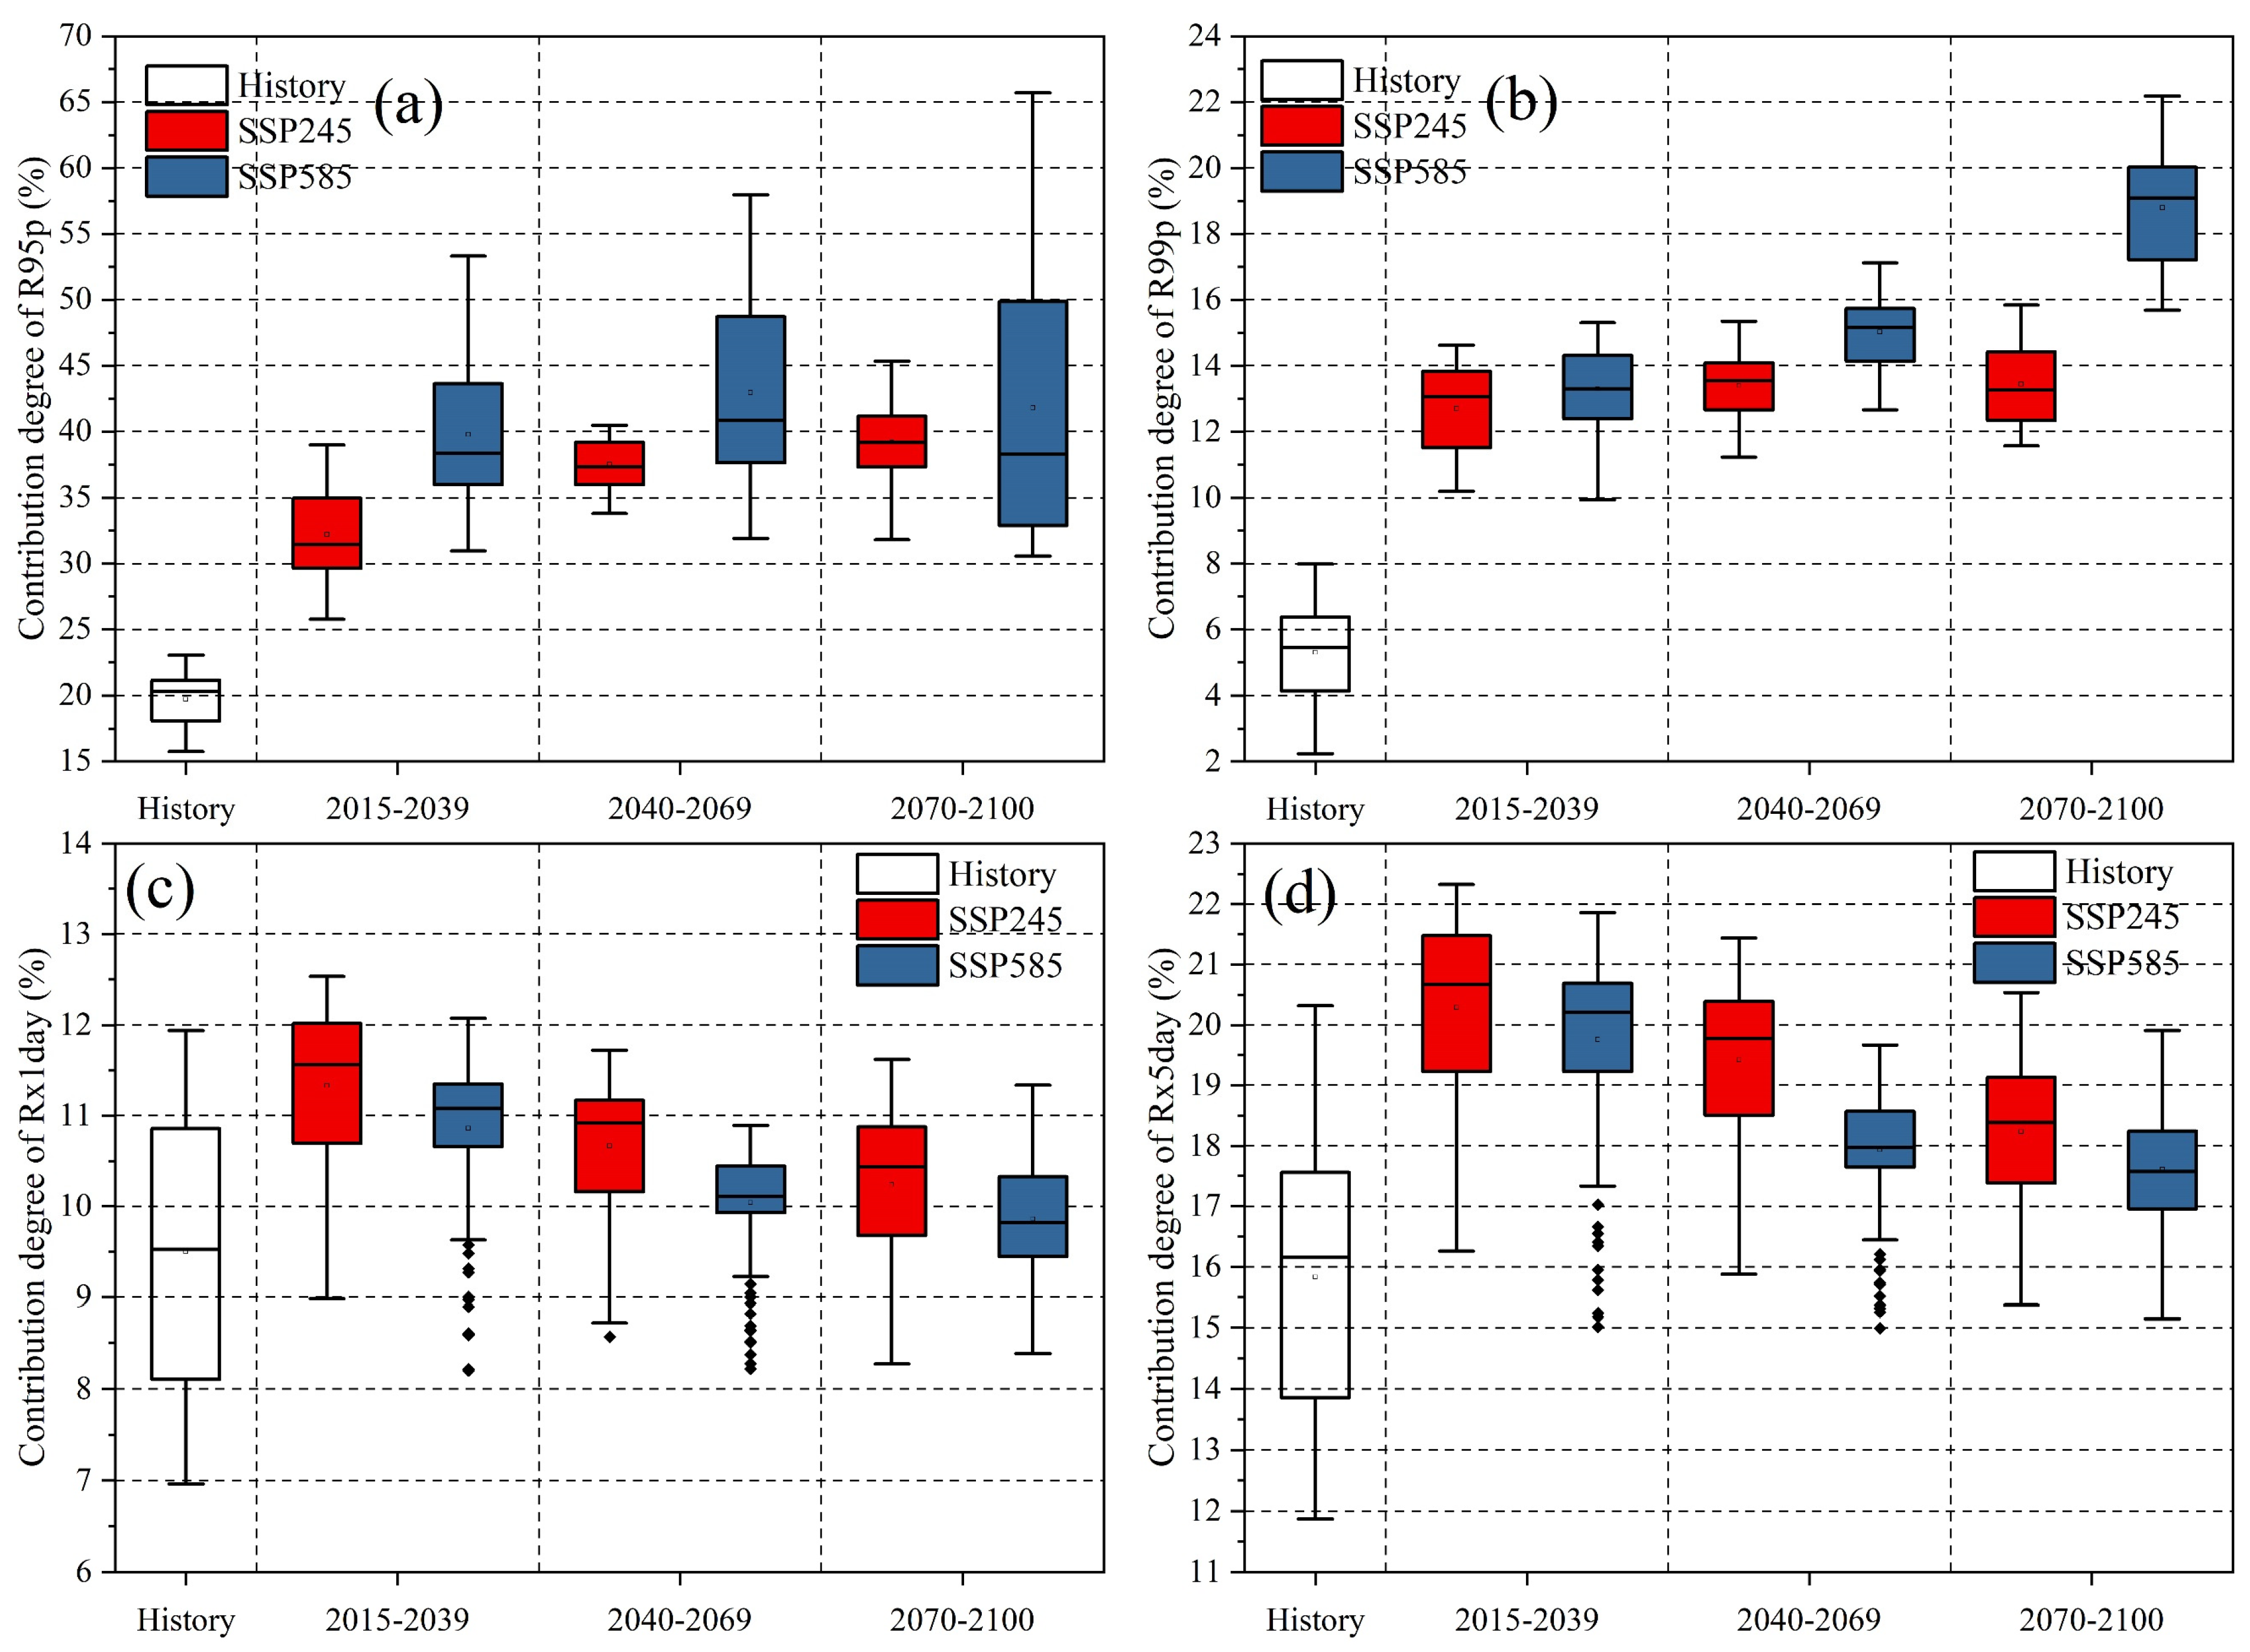
According to Figure 6, in the Haihe River Basin, the main range of the future degree of contribution of R95p was from 30% to 40%, and under SSP245 and SSP585, it was 32% to 50%, respectively. BCC-CSM2-MR showed that the main range of the future degree of contribution of R99p was from 11% to 15% and under SSP245 and SSP585, it ranged from 12% to 20%, respectively. BCC-CSM2-MR showed that the main range of the future degree of contribution for Rx1day ranged from 10% to 12% and under SSP245 and SSP585, it ranged from 9.5% to 11.5%, respectively. BCC-CSM2-MR showed that the main range of the degree of future contribution for Rx5day ranged from 17.5% to 21.5% and under SSP245 and SSP585, it ranged from 17% to 21%, respectively.
According to Figure 7, in the Haihe River Basin, the main range of the future degree of contribution for R95p was from 26% to 32% and under SSP245 and SSP585, it was from 26% to 40%, respectively. MME showed that the main range future degree of contribution for R99p was from 10% to 13% and under SSP245 and SSP585, it ranged from 11% to 19%, respectively. MME showed that the main range of the future degree of contribution for R99p was from 10% to 13% and under SSP245 and SSP585, it ranged from 11% to 19%, respectively. MME showed that the main range of the future degree of contribution for Rx1day was from 9% to 10% under SSP245 and SSP585. MME showed that the main range of the future degree of contribution for Rx5day ranged from 16% to 17.5% under SSP245 and SSP585.
In the Haihe River Basin, the main range for the historical degree of contribution for R95p, R99p, Rx1day, and Rx5day ranged from 18% to 22%, from 4% to 6%, from 8% to 11%, and from 14% to 17.5%, respectively. Both the BCC-CSM2-MR and MME models showed that R95p and R99p would increase in the future. Both BCC-CSM2-MR and MME showed that the degrees of contribution for R95p and R99p would increase in the future. BCC-CSM2-MR showed that Rx1day and Rx5day would decrease in the future. MME showed that Rx1day and Rx5day would be stable in the future. Generally, the future degree of contribution of extreme precipitation was higher than the past contribution. R95p and R99p degrees of contribution under SSP585 were higher than those under SSP245.

3.3. Periodicity of Precipitation

Figure 8 depicts the cross-wavelet transformation between ENSO and extreme precipitation in the Haihe River Basin, based on the changing characteristics of extreme precipitation. ENSO exhibited significant resonance periods with the PRCPTOT and R10mm, with similar periodicities (Figure 8a,b). During 1965–1975 and 1987–1992, ENSO exhibited a significant resonance period with the PRCPTOT and R10mm, which showed periodicities of 2–4 years. Moreover, ENSO also had a significant resonance period with the PRCPTOT and R10mm, which showed periodicities of 8–16 years around 1975 and 2000, respectively. ENSO had three major resonance periods with the R20mm, which showed periodicities of 2–4 years (during 1962–1968), 4 years (during 1970–1977 and 1985–1993), and 4–8 years (around 1995), as shown in Figure 8c. ENSO also showed significant resonance periods with the R95p and R99p, and the periodicities were similar (Figure 8d,e). ENSO showed a significant resonance period with the R95p and R99p, which showed periodicities of 2–4 years during 1963–1975. Moreover, ENSO shwoed a significant resonance period with the R95p and R99p, which had periodicities of 12–14 years during 1967–1975 and 1970–1984, respectively, as shown in Figure 8d. According to Figure 8f, ENSO showed no significant resonance periods with the Rx1 day. According to Figure 8g, ENSO showed a significant resonance period with the Rx5day, which had periodicities of 2–4 years (during 1962–1967). ENSO also showed four significant resonance periods with the SDII, which had periodicities of 3 years (around 1965), 4 years (during 1990), 4–6 years (during 1972–1984), and 8–12 years (during 1994–2003).
Figure 9 shows the cross-wavelet transforms between PDO and extreme precipitation in the Haihe River Basin. PDO showed significant resonance periods with the PRCPTOT, R10mm, and R20mm, and the periodicities were similar (Figure 9a–c). PDO showed a significant resonance period with the PRCPTOT, R10mm, and R20mm, with periodicities of 4–6 years during 1990–1997. PDO showed significant resonance periods with the R95p, Rx1day, and Rx5day, and the periodicities were similar (Figure 9d–g). As shown in Figure 8d,f,g, PDO showed two significant resonance periods with the R95p, Rx1day, and Rx5day, which had periodicities of 1–2 years and 4–6 years around 1995. As shown in Figure 9h, PDO showed a significant resonance period with the R99p, which showed periodicities of 1–2 years around 1995. As shown in Figure 9h, PDO exhibited two significant resonance periods with the SDII, which were periodicities of 3–6 years and 8–10 years during 1992–2000.
Generally, ENSO mainly showed significant resonance with the extreme precipitation in the Haihe River Basin from 1962 to 1980. PDO mainly showed two significant resonance periods with extreme precipitation, which were periodicities of 1–2 years and 4–6 years around 1995 in the Haihe River Basin.

4. Discussion

In Section 3.2, future extreme precipitation was investigated as a potential change in the characteristics of the Haihe River Basin. Numerous studies have identified a rise in temperature as one of the key factors contributing to future increased extreme precipitation [25,42,43,44]. Wasko et al. [44], for example, discovered that global temperature increases influenced the intensity of 1-day precipitation events. According to Clausius-Clapeyron, a 1 °C temperature rise could lead to an increase in extreme precipitation at an approximate rate of 6–7% around the globe [5,44]. Yang et al. [25] discovered that, in China, the temperature rise under SSP585 was generally greater than that under SSP245. This study also demonstrated that extreme precipitation under SSP585 was generally higher than that of SSP245 in the Haihe River Basin. However, both the BCC-CSM2-MR and MME models showed that extreme precipitation in the Haihe River Basin was similar between SSP245 and SSP585 from 2015 to 2050. Wang et al. [20] also discovered that, until the middle of this century, extreme precipitation was similar between SSP245 and SSP585, based on 27 CMIP6 models. In general, both this study and the studies mentioned above demonstrated that extreme precipitation amounts increased with rising temperatures and had a similar degree of increment under the SSP245 and SSP585 scenarios before the middle of this century. However, this study discovered that BCC-CSM2-MR performed exceptionally well in simulating extreme precipitation in the Haihe River Basin.
Numerous studies revealed that short-term intense precipitation could easily cause floods in the basin [45,46]. Deng et al. [45], for example, discovered that the frequency of extremely heavy rain had increased since 2000, resulting in flood-waterlogging disasters in the Hanjiang River Basin. Wang et al. [47] discovered a strong relationship between annual maximum 30-day precipitation and flood peak in the Lancang–Mekong River Basin’s Pakse station. Dottori et al. [46] also discovered that the probability of river floods might rise as a result of global warming, causing significant economic losses to Europe. Rx5day is defined as the maximum cumulative precipitation over five consecutive days within a year [20]. Consequently, Rx5day as an extreme precipitation index could contribute to flood-waterlogging disasters in a Basin [20,29]. According to Section 3.2, both BCC-CSM2-MR and MME predicted that Rx5day would increase in the future in the Haihe River Basin under SSP245 and SSP585. Overall, the aforementioned studies suggest that flood-waterlogging disaster risks will increase in the future due to extreme precipitation in the Haihe River Basin. In this study, we also saw a predicted rise in Rx5day over the study region. However, it is important to note that this study lacks research on flood-waterlogging. Therefore, we conducted a qualitative analysis of the potential flood-waterlogging risk associated with the extreme precipitation of Rx5day in the Haihe River Basin.
In Figure 10, we analyzed the change in extreme precipitation (Rx5day) and potential risks in the near future (from 2025 to 2035) in the Haihe River Basin. As shown in Figure 10, Rx5day exhibited varying degrees of increase in the western and eastern Haihe River Basins under different CMIP6 models and emission scenarios. Additionally, Figure 1a illustrates that the western and eastern Haihe River Basins consist mainly of mountains and plains. We can qualitatively analyze how different terrain types could affect flood peaks, based on the findings from Figure 10. For instance, Zhang et al. [48] discovered that flash floods were mostly caused by extreme precipitation in mountainous areas and were likely to increase in the future. As shown in Figure 1a, Pabi et al. [49] discovered that forests [24,26] could significantly reduce peak runoff. In addition, forests had a stronger ability to weaken flood peaks than did grassland and cropland [49]. Milazzo, et al. [50] also discovered that permanent grassland soils had a generally lower bulk density and higher hydraulic conductivity than cropland soils, resulting in less runoff and soil erosion [50]. Consequently, forest, grassland, and cropland ranked strongest to weakest in their capacity to reduce flood peaks [49,50,51]. We can qualitatively analyze the impact of floods and extreme precipitation in the Haihe River Basin with regard to different terrain types, based on the findings from Figure 10 and the study mentioned above. As shown in Figure 10e, we also found that the river basin land type was mainly grassland and cropland in the western Haihe River Basin. Therefore, upstream of the Yongding nad Ziya River, there was a high flood risk from 2025 to 2035, as indicated in Figure 10a–d. Lei et al. [52] found that floods and extreme precipitation would cause a certain degree of damage to buildings. Water conservancy facilities (such as dams and embankments) and riverside buildings would need to be strengthened in the future to prevent serious city and farmland waterlogging [10,48,49]. In Figure 10e, the eastern-southern Haihe River Basin is characterized by plains covered with farmland. Tan et al. [53] also discovered that population density and the number of cities were higher in the plain of the Haihe River Basin. As a result, in the future, urban and farmland flood prevention and drainage capabilities would be need to be enhanced. Soil erosion risk in the Haihe River Basin could be qualitatively examined, based on the type and severity of soil erosion shown in Figure 10. Based on Figure 10f, we also discovered that the western and northern Haihe River Basins exhibited serious soil erosion. However, the cropland and grassland showed weak abilities to resist soil erosion under extreme precipitation scenarios [50]. Therefore, in the future, planted forests could be used to resist soil erosion in the western and northern Haihe River Basins.
This study also reveals some limitations, as well as areas for further investigation. We used the bilinear interpolation method [21,31] to convert the spatial resolution of the CMIP6 models, which possessed varied spatial resolutions due to institutional variations. However, it is important to note that the bilinear interpolation method introduces a level of uncertainty when converting spatial resolutions, which could impact the results of this study. However, many studies have investigated future regional climate change based on less than 20 CMIP6 models [21,25,33]. Additionally, this study also could show some subjectivity, based on the 19 selected CMIP6 models. This study may not explain the reason why BCC-CSM2-MR shows outstanding performance based on dynamic climatic characteristics. Moreover, this study might not have explained the specific relationship and detailed impact mechanism between large-scale circulation and extreme precipitation in a region. The concerns raised above might be considered as limitations of this study. Furthermore, we conducted a quantitative study of flood and waterlogging events. Our major focus was on assessing precipitation performance and changes, as well as estimating the capabilities of the CMIP6 model under extreme precipitation conditions. Therefore, the quantitative analysis of flooding and waterlogging events remains an unexplored and intriguing avenue for future research. Analyzing the relationship between Rx1day and once-in-a-century daily precipitation in the past and future might also be an interesting research field. The above intriguing ideas will be implemented in future studies. The best model set would be created using the best-performing CMIP6 models from a particular region. Because the performance of the CMIP6 models was uncertain in different regions, the best model set would provide a relatively reliable reference for research regarding climate change.

5. Conclusions

In this study, we investigated the future changes in extreme precipitation and the teleconnection relationship between extreme precipitation, ENSO, and PDO. We employed evaluation indicators to assess the precipitation performance of CMIP6 models. The CMIP6 models BCC-CSM2-MR and MME were used to analyze anticipated changes in extreme precipitation. A cross-wavelet transform was used to illustrate the relationship between extreme precipitation and large-scale atmospheric circulation. However, the MME failed to produce the most accurate simulation of extreme precipitation in a particular region. The MME and BCC-CSM2-MR models, respectively, performed the best in simulating monthly and extreme (based on daily precipitation) precipitation among the selected CMIP6 models in the Haihe River Basin. BCC-CSM2-MR exhibited the best performance in simulating R10mm and Rx5day among the selected CMIP6 models. KIOST-ESM showed the best performance in simulating R20mm and PRCPTOT. ACCESS-CM2 and ACCESS-ESM1–5 performed best in simulating R99p and R95p, respectively. EC-Earth3-Veg performed the best in simulating SDII. Extreme precipitation was projected to increase in the future in the Haihe River Basin under the SSP245 and SSP585 scenarios. R95p and R99p are expected to make higher contributions to extreme precipitation in the future. Extreme precipitation under SSP585 exhibited a higher degree of increase than did SSP245. Once-in-a-century extreme precipitation results also demonstrated that the Haihe River Basin will be more vulnerable to catastrophic precipitation disasters in the future. Both BCC-CSM2-MR and MME showed that the degrees of contribution of R95p and R99p will increase in the future. However, the BCC-CSM2-MR model predicted that Rx1day and Rx5day would decrease in the future, while the MME model predicted that Rx1day and Rx5day would remain stable in the future. ENSO mainly showed a strong resonance with the extreme precipitation during the period 1962–1980. In the Haihe River Basin, the PDO exhibited two strong resonance periods with excessive precipitation, with periodicities of 1–2 years and 4–6 years around 1995.
In summary, our findings indicate a heightened risk of future extreme precipitation in the Haihe River Basin. Therefore, we should prioritize and strengthen flood-waterlogging disaster prevention. This study enhances our understanding of future extreme precipitation based on CMIP6. Furthermore, it serves as a reference for future planning and policy development for flood and waterlogging control in the Haihe River Basin.

Author Contributions

L.H. Conceptualization, L.H. Data curation, L.H. Funding acquisition, L.H. Methodology, L.H. and J.S. Writing—original draft, L.H. and J.S. Writing—review & editing. B.W. Supervision. B.W. Validation. G.L. and Q.M. Formal analysis. G.L., Q.M. and Y.D. Project administration. All authors have read and agreed to the published version of the manuscript.

Funding

This study was funded by the Hebei Provincial Key Research Projects (CN). Grant number: 21374201D.

Data Availability Statement

The data that support the findings of this study are available from the corresponding author, F.W., upon reasonable request.

Conflicts of Interest

The authors declare no conflict of interest.

References

  1. Madakumbura, G.D.; Thackeray, C.W.; Norris, J.; Goldenson, N.; Hall, A. Anthropogenic influence on extreme precipitation over global land areas seen in multiple observational datasets. Nat. Commun. 2021, 12, 3944. [Google Scholar] [CrossRef]
  2. Guo, H.; Bao, A.; Chen, T.; Zheng, G.; Wang, Y.; Jiang, L.; De Maeyer, P. Assessment of CMIP6 in simulating precipitation over arid Central Asia. Atmos. Res. 2021, 252, 105451. [Google Scholar] [CrossRef]
  3. Kotz, M.; Levermann, A.; Wenz, L. The effect of rainfall changes on economic production. Nature 2022, 601, 223–227. [Google Scholar] [CrossRef] [PubMed]
  4. Coumou, D.; Rahmstorf, S. A decade of weather extremes. Nat. Clim. Chang. 2012, 2, 491–496. [Google Scholar] [CrossRef]
  5. Li, C.; Zwiers, F.; Zhang, X.; Li, G.; Sun, Y.; Wehner, M. Changes in Annual Extremes of Daily Temperature and Precipitation in CMIP6 Models. J. Clim. 2021, 34, 3441–3460. [Google Scholar] [CrossRef]
  6. John, A.; Douville, H.; Ribes, A.; Yiou, P. Quantifying CMIP6 model uncertainties in extreme precipitation projections. Weather Clim. Extrem. 2022, 36, 100435. [Google Scholar] [CrossRef]
  7. Donat, M.G.; Lowry, A.L.; Alexander, L.V.; O’Gorman, P.A.; Maher, N. More extreme precipitation in the world’s dry and wet regions. Nat. Clim. Chang. 2016, 6, 508–513. [Google Scholar] [CrossRef]
  8. Jeferson de Medeiros, F.; Prestrelo de Oliveira, C.; Avila-Diaz, A. Evaluation of extreme precipitation climate indices and their projected changes for Brazil: From CMIP3 to CMIP6. Weather Clim. Extrem. 2022, 38, 100511. [Google Scholar] [CrossRef]
  9. Luo, Y.; Zhang, J.; Yu, M.; Liang, X.; Xia, R.; Gao, Y.; Gao, X.; Yin, J. On the Influences of Urbanization on the Extreme Rainfall over Zhengzhou on 20 July 2021: A Convection-Permitting Ensemble Modeling Study. Adv. Atmos. Sci. 2022, 40, 393–409. [Google Scholar] [CrossRef]
  10. Xiao, S.; Zou, L.; Xia, J.; Dong, Y.; Yang, Z.; Yao, T. Assessment of the urban waterlogging resilience and identification of its driving factors: A case study of Wuhan City, China. Sci. Total Environ. 2023, 866, 161321. [Google Scholar] [CrossRef]
  11. Liu, S.; Huang, S.; Huang, Q.; Xie, Y.; Leng, G.; Luan, J.; Song, X.; Wei, X.; Li, X. Identification of the non-stationarity of extreme precipitation events and correlations with large-scale ocean-atmospheric circulation patterns: A case study in the Wei River Basin, China. J. Hydrol. 2017, 548, 184–195. [Google Scholar] [CrossRef]
  12. Wang, P.; Huang, Q.; Tang, Q.; Chen, X.; Yu, J.; Pozdniakov, S.P.; Wang, T. Increasing annual and extreme precipitation in permafrost-dominated Siberia during 1959–2018. J. Hydrol. 2021, 603, 126865. [Google Scholar] [CrossRef]
  13. Yuan, Z.; Yang, Z.; Yan, D.; Yin, J. Historical changes and future projection of extreme precipitation in China. Theor. Appl. Climatol. 2015, 127, 393–407. [Google Scholar] [CrossRef]
  14. Li, L.; Yao, N.; Liu, D.L.; Song, S.; Lin, H.; Chen, X.; Li, Y. Historical and future projected frequency of extreme precipitation indicators using the optimized cumulative distribution functions in China. J. Hydrol. 2019, 579, 124170. [Google Scholar] [CrossRef]
  15. Almazroui, M.; Saeed, S. Contribution of extreme daily precipitation to total rainfall over the Arabian Peninsula. Atmos. Res. 2020, 231, 104672. [Google Scholar] [CrossRef]
  16. Ullah, W.; Wang, G.; Lou, D.; Ullah, S.; Bhatti, A.S.; Ullah, S.; Karim, A.; Hagan, D.F.T.; Ali, G. Large-scale atmospheric circulation patterns associated with extreme monsoon precipitation in Pakistan during 1981–2018. Atmos. Res. 2021, 253, 105489. [Google Scholar] [CrossRef]
  17. Liu, Y.; Han, J.; Jiao, J.; Liu, B.; Ge, W.; Pan, Q.; Wang, F. Responses of flood peaks to land use and landscape patterns under extreme rainstorms in small catchments—A case study of the rainstorm of Typhoon Lekima in Shandong, China. Int. Soil Water Conserv. Res. 2022, 10, 228–239. [Google Scholar] [CrossRef]
  18. Abuzaid, A.S.; El-Shirbeny, M.A.; Fadl, M.E. A new attempt for modeling erosion risks using remote sensing-based mapping and the index of land susceptibility to wind erosion. Catena 2023, 227, 107130. [Google Scholar] [CrossRef]
  19. Huang, C.; Zheng, X.; Tait, A.; Dai, Y.; Yang, C.; Chen, Z.; Li, T.; Wang, Z. On using smoothing spline and residual correction to fuse rain gauge observations and remote sensing data. J. Hydrol. 2014, 508, 410–417. [Google Scholar] [CrossRef]
  20. Wang, L.; Li, Y.; Li, M.; Li, L.; Liu, F.; Liu, D.L.; Pulatov, B. Projection of precipitation extremes in China’s mainland based on the statistical downscaled data from 27 GCMs in CMIP6. Atmos. Res. 2022, 280, 106462. [Google Scholar] [CrossRef]
  21. Ding, Y.; Jiang, C.; Zhou, Z.; Gao, T.; Wang, S.; Zhang, X.; Cai, H.; Shi, H. Evaluation of precipitation and its time series components in CMIP6 over the Yellow River Basin. Clim. Dyn. 2022, 60, 1203–1223. [Google Scholar] [CrossRef]
  22. Li, G.; Yu, Z.; Wang, W.; Ju, Q.; Chen, X. Analysis of the spatial Distribution of precipitation and topography with GPM data in the Tibetan Plateau. Atmos. Res. 2021, 247, 105259. [Google Scholar] [CrossRef]
  23. Martinsen, G.; Liu, S.; Mo, X.; Bauer-Gottwein, P. Joint optimization of water allocation and water quality management in Haihe River basin. Sci. Total Environ. 2019, 654, 72–84. [Google Scholar] [CrossRef] [PubMed]
  24. Zou, W.-Y.; Yin, S.-Q.; Wang, W.-T. Spatial interpolation of the extreme hourly precipitation at different return levels in the Haihe River basin. J. Hydrol. 2021, 598, 126273. [Google Scholar] [CrossRef]
  25. Yang, X.; Zhou, B.; Xu, Y.; Han, Z. CMIP6 Evaluation and Projection of Temperature and Precipitation over China. Adv. Atmos. Sci. 2021, 38, 817–830. [Google Scholar] [CrossRef]
  26. Ling, M.; Guo, X.; Shi, X.; Han, H. Temporal and spatial evolution of drought in Haihe River Basin from 1960 to 2020. Ecol. Indic. 2022, 138, 108809. [Google Scholar] [CrossRef]
  27. Johnson, F.; Hutchinson, M.F.; The, C.; Beesley, C.; Green, J. Topographic relationships for design rainfalls over Australia. J. Hydrol. 2016, 533, 439–451. [Google Scholar] [CrossRef]
  28. Jiang, Q.; Li, W.; Fan, Z.; He, X.; Sun, W.; Chen, S.; Wen, J.; Gao, J.; Wang, J. Evaluation of the ERA5 reanalysis precipitation dataset over Chinese Mainland. J. Hydrol. 2021, 595, 125660. [Google Scholar] [CrossRef]
  29. Du, Y.; Wang, D.; Zhu, J.; Lin, Z.; Zhong, Y. Intercomparison of multiple high-resolution precipitation products over China: Climatology and extremes. Atmos. Res. 2022, 278, 106342. [Google Scholar] [CrossRef]
  30. Ye, B.S.; Yang, D.Q.; Ding, Y.J.; Han, T.D.; Koike, T. A bias-corrected precipitation climatology for China. J. Hydrometeorol. 2004, 5, 1147–1160. [Google Scholar] [CrossRef]
  31. Chao, L.; Zhang, K.; Li, Z.; Zhu, Y.; Wang, J.; Yu, Z. Geographically weighted regression based methods for merging satellite and gauge precipitation. J. Hydrol. 2018, 558, 275–289. [Google Scholar] [CrossRef]
  32. Supharatid, S. Skill of precipitation projectionin the Chao Phraya river Basinby multi-model ensemble CMIP3-CMIP5. Weather Clim. Extrem. 2016, 12, 1–14. [Google Scholar] [CrossRef]
  33. Zhou, Z.Q.; Ding, Y.B.; Shi, H.Y.; Cai, H.J.; Fu, Q.; Liu, S.N.; Li, T.X. Analysis and prediction of vegetation dynamic changes in China: Past, present and future. Ecol. Indic. 2020, 117, 11. [Google Scholar] [CrossRef]
  34. He, Y.; Lee, E.; Warner, T.A. A time series of annual land use and land cover maps of China from 1982 to 2013 generated using AVHRR GIMMS NDVI3g data. Remote Sens. Environ. 2017, 199, 201–217. [Google Scholar] [CrossRef]
  35. Shi, X.; Chen, J.; Gu, L.; Xu, C.Y.; Chen, H.; Zhang, L. Impacts and socioeconomic exposures of global extreme precipitation events in 1.5 and 2.0 degrees C warmer climates. Sci. Total Environ. 2021, 766, 142665. [Google Scholar] [CrossRef]
  36. Zhu, Y.-Y.; Yang, S. Evaluation of CMIP6 for historical temperature and precipitation over the Tibetan Plateau and its comparison with CMIP5. Adv. Clim. Chang. Res. 2020, 11, 239–251. [Google Scholar] [CrossRef]
  37. Pilon, P.J.; Adamowski, K. Asymptotic variance of flood quantile in log Pearson Type III distribution with historical information. J. Hydrol. 1993, 143, 481–503. [Google Scholar] [CrossRef]
  38. Qin, X.; Dai, C. Comparison of different quantile delta mapping schemes in frequency analysis of precipitation extremes over mainland Southeast Asia under climate change. J. Hydrol. 2022, 606, 127421. [Google Scholar] [CrossRef]
  39. Zhou, Z.; Shi, H.; Fu, Q.; Li, T.; Gan, T.Y.; Liu, S.; Liu, K. Is the cold region in Northeast China still getting warmer under climate change impact? Atmos. Res. 2020, 237, 104864. [Google Scholar] [CrossRef]
  40. Zhou, Z.; Shi, H.; Fu, Q.; Li, T.; Gan, T.Y.; Liu, S. Assessing spatiotemporal characteristics of drought and its effects on climate-induced yield of maize in Northeast China. J. Hydrol. 2020, 588, 125097. [Google Scholar] [CrossRef]
  41. Torrence, C.G.; Compo, G.P. A Practical Guide to Wavelet Analysis. Bull. Am. Meteorol. Soc. 1998, 79, 61–78. [Google Scholar] [CrossRef]
  42. Aihaiti, A.; Jiang, Z.; Zhu, L.; Li, W.; You, Q. Risk changes of compound temperature and precipitation extremes in China under 1.5 °C and 2 °C global warming. Atmos. Res. 2021, 264, 105838. [Google Scholar]
  43. Wang, G.; Wang, D.; Trenberth, K.E.; Erfanian, A.; Yu, M.; Bosilovich, M.G.; Parr, D.T. The peak structure and future changes of the relationships between extreme precipitation and temperature. Nat. Clim. Chang. 2017, 7, 268–274. [Google Scholar]
  44. Wasko, C.; Nathan, R.; Stein, L.; O’Shea, D. Evidence of shorter more extreme rainfalls and increased flood variability under climate change. J. Hydrol. 2021, 603, 126994. [Google Scholar] [CrossRef]
  45. Deng, P.; Zhang, M.; Hu, Q.; Wang, L.; Bing, J. Pattern of spatio-temporal variability of extreme precipitation and flood-waterlogging process in Hanjiang River basin. Atmos. Res. 2022, 276, 106258. [Google Scholar] [CrossRef]
  46. Dottori, F.; Mentaschi, L.; Bianchi, A.; Alfieri, L.; Feyen, L. Cost-effective adaptation strategies to rising river flood risk in Europe. Nat. Clim. Chang. 2023, 13, 196–202. [Google Scholar] [CrossRef]
  47. Wang, S.; Zhang, L.; She, D.; Wang, G.; Zhang, Q. Future projections of flooding characteristics in the Lancang-Mekong River Basin under climate change. J. Hydrol. 2021, 602, 126778. [Google Scholar] [CrossRef]
  48. Zhang, Y.; Wang, Y.; Chen, Y.; Xu, Y.; Zhang, G.; Lin, Q.; Luo, R. Projection of changes in flash flood occurrence under climate change at tourist attractions. J. Hydrol. 2021, 595, 126039. [Google Scholar] [CrossRef]
  49. Pabi, O.; Egyir, S.; Attua, E.M. Flood hazard response to scenarios of rainfall dynamics and land use and land cover change in an urbanized river basin in Accra, Ghana. City Environ. Interact. 2021, 12, 100075. [Google Scholar] [CrossRef]
  50. Milazzo, F.; Francksen, R.M.; Zavattaro, L.; Abdalla, M.; Hejduk, S.; Enri, S.R.; Pittarello, M.; Price, P.N.; Schils, R.L.M.; Smith, P.; et al. The role of grassland for erosion and flood mitigation in Europe: A meta-analysis. Agric. Ecosyst. Environ. 2023, 348, 108443. [Google Scholar] [CrossRef]
  51. Wang, Y.; Wang, S.; Wang, C.; Zhao, W. Runoff sensitivity increases with land use/cover change contributing to runoff decline across the middle reaches of the Yellow River basin. J. Hydrol. 2021, 600, 126536. [Google Scholar] [CrossRef]
  52. Lei, Y.; Gu, H.; Cui, P. Vulnerability assessment for buildings exposed to torrential hazards at Sichuan-Tibet transportation corridor. Eng. Geol. 2022, 308, 106803. [Google Scholar] [CrossRef]
  53. Tan, M.; Li, X.; Li, S.; Xin, L.; Wang, X.; Li, Q.; Li, W.; Li, Y.; Xiang, W. Modeling population density based on nighttime light images and land use data in China. Appl. Geogr. 2018, 90, 239–247. [Google Scholar] [CrossRef]
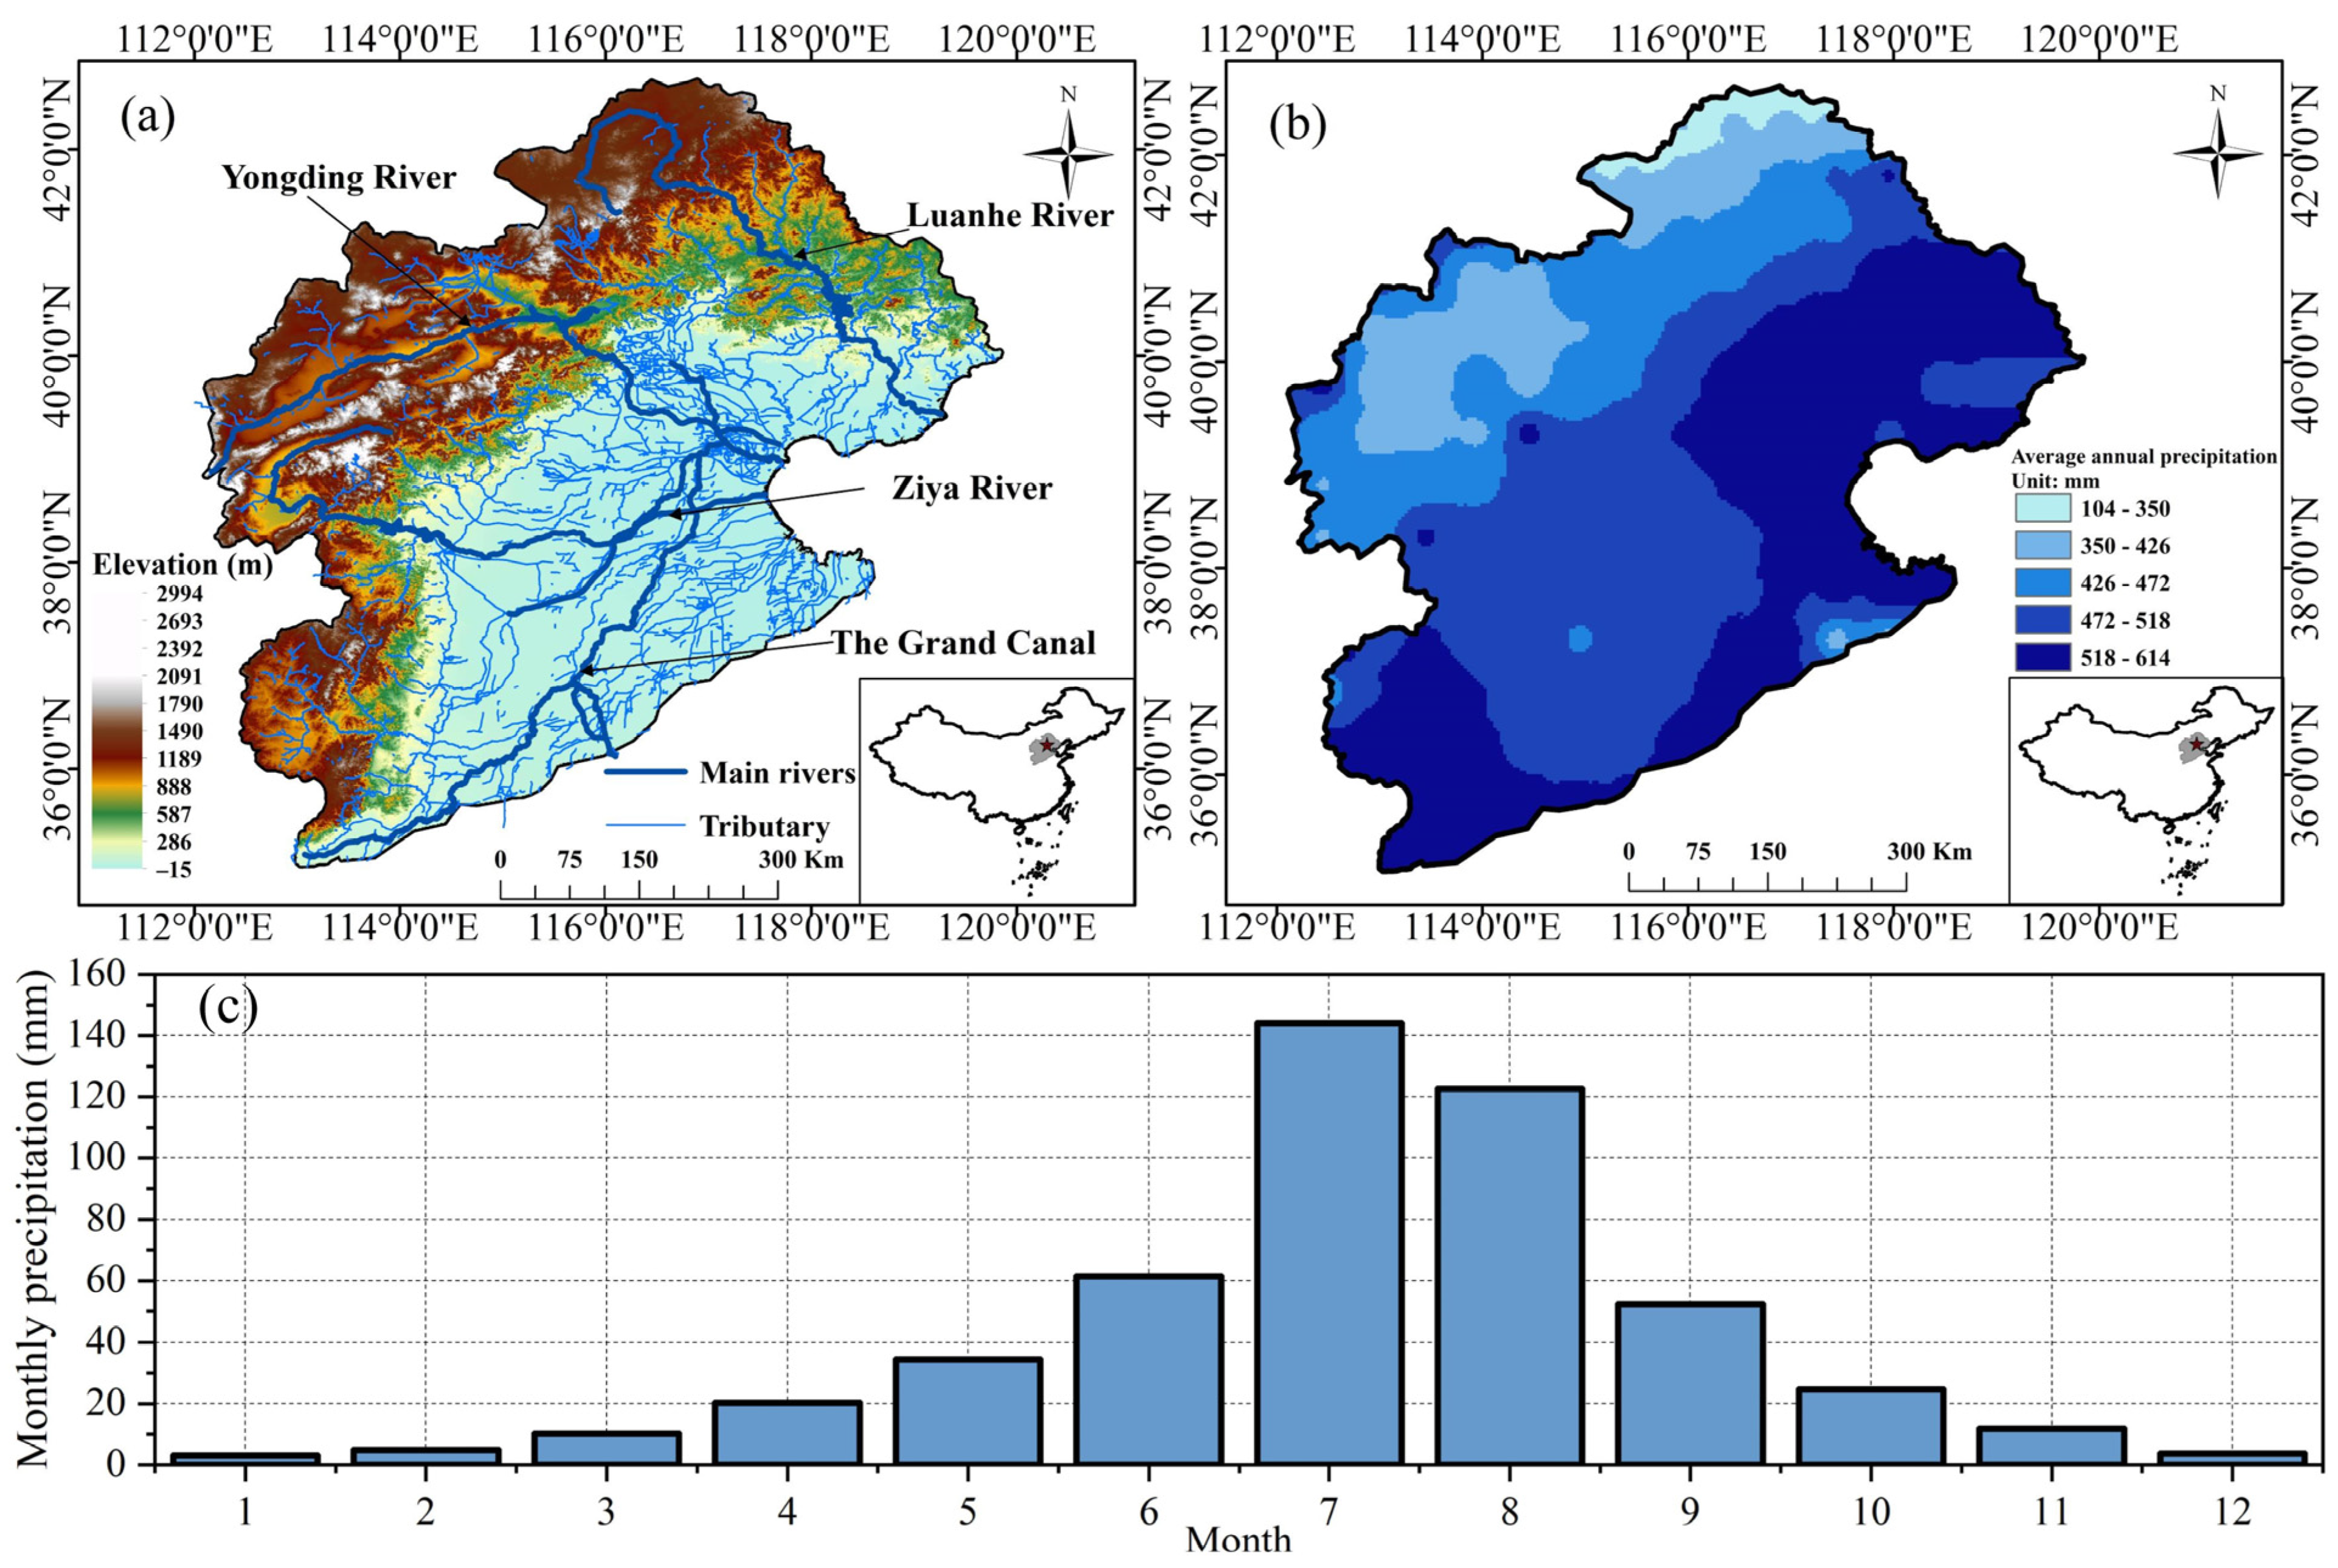
Figure 1. Topographic and geographic zones in the Haihe River Basin (a); spatial distribution of annual average precipitation in the Haihe River Basin (b); monthly precipitation in the Haihe River Basin (observation period from 1961 to 2014) (c).
Water 15 03245 g001
Figure 2. Statistical performance differences of observed and simulated precipitation in the Haihe River Basin from the CMIP6 models (including multi-model ensembles (MME)) based on Taylor diagrams (a). The error of precipitation in different months between the CMIP6 models and observations from 1961 to 2014 (b). Note: the darker the blue, the smaller the numerical value; The darker the yellow, the greater the numerical value.
Water 15 03245 g002
Figure 3. Statistical performance differences of observed and simulated extreme precipitation in the Haihe River Basin for CMIP6 models (including MME) based on the thermodynamic diagram. (ad) represent, respectively, Bias, RMSE, correlation coefficient, and RSR. Note: the darker the blue, the smaller the numerical value; The darker the yellow, the greater the numerical value.
Water 15 03245 g003
Figure 4. Historic and future extreme precipitation change trends in the Haihe River Basin. PRCPTOT (a), R10mm (b), R20mm (c), R95p (d), R99p (e), Rx1day (f), Rx5day (g), and SDII (h), based on the BCC-CSM2-MR model. PRCPTOT (i), R10mm (j), R20mm (k), R95p (l), R99p (m), Rx1day (n), Rx5day (o), and SDII (p), based on MME.
Water 15 03245 g004
Figure 5. The projected future once-in-a-century value of extreme precipitation. The extreme precipitation indexes include: PRCPTOT (a), R10mm (b), R20mm (c), R95p (d), R99p (e), Rx1day (f), Rx5day (g), and SDII (h).
Water 15 03245 g005
Figure 6. Degree of contribution of extreme precipitation in different time periods (historical: 1961–2014, and future: 2015–2039, 2040–2069, and 2070–2100), based on the BCC-CSM2-MR model in the Haihe River Basin, where (a), (b), (c), and (d) represent R95p, R99p, Rx1day, and Rx5day, respectively.
Water 15 03245 g006
Figure 7. Degree of contribution of extreme precipitation in different time periods (historical: 1961–2014, and future: 2015–2039, 2040–2069, and 2070–2100), based on MME in the Haihe River Basin, where (a), (b), (c), and (d) represent, R95p, R99p, Rx1day, and Rx5day, respectively.
Water 15 03245 g007
Figure 8. The cross-wavelet transforms between the ENSO and historically observed extreme precipitation in the Haihe River Basin. (a), (b), (c), (d), (e), (f), (g), and (h) represent, respectively, PRCPTOT, R10mm, R20mm, R95p, R99p, Rx1day, Rx5day, and SDII. The thick black contour denotes the relationships that are significant against the red noise at the 95% confidence level. The cone of influence (COI), where edge effects might distort the picture, is shown in lighter shades. The relative phase relationship is indicated by the arrow direction (with anti-phase pointing left and in-phase pointing right). The color bar on the right denotes the wavelet energy.
Water 15 03245 g008
Figure 9. The cross-wavelet transforms between the PDO and historically observed extreme precipitation in the Haihe River Basin. (a), (b), (c), (d), (e), (f), (g), and (h) represent, respectively, PRCPTOT, R10mm, R20mm, R95p, R99p, Rx1day, Rx5day, and SDII.
Water 15 03245 g009
Figure 10. Degree of Rx5day changes in extreme precipitation from 2025 to 2035 in the Haihe River Basin under SSP245 and SSP585. BCC-CSM2-MR model under SSP245 (a), BCC-CSM2-MR model under SSP585 (b), MME model under SSP245 (c), and MME model under SSP585 (d). Land-use type (e), and soil erosion (f) in the Haihe River Basin, based on remote sensing technology.
Water 15 03245 g010
Table 1. General information for the CMIP6 models used in this study.
NumberCodeModelCountryNumber of Grid Points
1AACCESS-CM2Australia192 × 144
2BACCESS-ESM1-5Australia192 × 145
3CBCC-CSM2-MRChina320 × 160
4DCanESM5Canada128 × 64
5EEC-Earth3Ireland512 × 256
6FEC-Earth3-VegIreland512 × 256
7GGFDL-CM4USA288 × 180
8HGFDL-ESM4USA288 × 180
9IINM-CM4-8Russia180 × 120
10JINM-CM5-0Russia180 × 120
11KKACE-1-0-GKorea192 × 96
12LKIOST-ESMKorea192 × 144
13MMIROC6Japan256 × 128
14NMME
15OMPI-ESM1-2-HRGermany384 × 192
16PMPI-ESM1-2-LRGermany192 × 96
17QMRI-ESM2-0Japan320 × 160
18RNESM3China192 × 96
19SNorESM2-LMNorway144 × 96
20TNorESM2-MMNorway288 × 192
Table 2. Extreme precipitation indexes in this study.
Extreme Precipitation IndexExplanationUnit
PRCPTOTAnnual summed precipitation (more than 1 mm)mm
R10mmDaily precipitation of more than 10 cm for the same number of days in the yearday
R20mmDaily precipitation of more than 20 cm for the same number of days in the yearday
R95pThe total daily precipitation of more than the 95th daily precipitation percentile annuallymm
R99pThe total daily precipitation of more than the 99th daily precipitation percentile annuallymm
Rx1dayThe maximum total precipitation in one consecutive day annuallymm
Rx5dayThe maximum total precipitation in five consecutive days annuallymm
SDIIMean precipitation amount per wet daymm/day
Table 3. Comprehensive ranking of CRI for extreme precipitation climate indices at the annual scale of observations and the selected CMIP6 multi-model, as well as MME, in the Haihe River Basin.
ModelPRCPTOTR10mmR20mmR95pR99pRx1dayRx5daySDII
ACCESS-CM21110172121415
ACCESS-ESM1-51716181262010
BCC-CSM2-MR31265313
CanESM5109139951016
EC-Earth3554181618175
EC-Earth3-Veg233151920181
GFDL-CM444910131248
GFDL-ESM466588864
INM-CM4-82020105715137
INM-CM5-0191815339196
KACE-1-0-G88144411117
KIOST-ESM121191513162
MIROC6181720764719
MME121211111011211
MPI-ESM1-2-HR91361717161518
MPI-ESM1-2-LR16198202019912
MRI-ESM2-077714111059
NESM3151512121414320
NorESM2-LM141419161817814
NorESM2-MM131116131271213
Disclaimer/Publisher’s Note: The statements, opinions and data contained in all publications are solely those of the individual author(s) and contributor(s) and not of MDPI and/or the editor(s). MDPI and/or the editor(s) disclaim responsibility for any injury to people or property resulting from any ideas, methods, instructions or products referred to in the content.