Article

An Algebraic Non-Equilibrium Turbulence Model of the High Reynolds Number Transition Region

Independent Researcher, Trubadurens Väg 8, 423 41 Göteborg, Sweden
Water 2023, 15(18), 3234; https://doi.org/10.3390/w15183234
Submission received: 14 August 2023 / Revised: 6 September 2023 / Accepted: 7 September 2023 / Published: 11 September 2023
(This article belongs to the Section Hydraulics and Hydrodynamics)

Abstract

:
We present a mixing length-based algebraic turbulence model calibrated to pipe flow; the main purpose of the model is to capture the increasing turbulence production-to-dissipation ratio observed in connection with the high Reynolds number transition region. The model includes the mixing length description by Gersten and Herwig, which takes the observed variation of the von Kármán number with Reynolds number into account. Pipe wall roughness effects are included in the model. Results are presented for area-averaged (integral) quantities, which can be used both as a self-contained model and as initial inlet boundary conditions for computational fluid dynamics simulations.

1. Introduction

The impetus for this paper came from an invited presentation on boundary conditions for turbulence modelling [1]. Based on an observed variation of the turbulence production-to-dissipation ratio with Reynolds number, a corresponding variation of the turbulence model constant C μ was discussed. Previously, Princeton Superpipe measurements [2,3] of streamwise mean and fluctuating velocities have been analysed in detail [4,5].
We present a new algebraic (zero-equation) turbulence model based on the Prandtl mixing length concept [6,7] to improve our understanding of the observed high Reynolds number transition region. It is important to note that this transition is not related to the laminar–turbulent transition, which takes place at much lower Reynolds numbers. The model can be used both standalone and to provide the initialisation of inlet boundary conditions for computational fluid dynamics (CFD) simulations [8,9]. Our approach is similar to the “LIKE” algorithm in [10], where the letters in the abbreviation represent the integral turbulent Length scale, turbulence Intensity, turbulent Kinetic energy and turbulent dissipation rate ε (E).
The paper is organised as follows: In Section 2, we summarise previous relevant findings, followed by a model overview in Section 3. Model details can be found in the Supplementary Information (SI) document [11]. Results from our new model are provided in Section 4 and discussed in Section 5. We conclude and propose future research directions in Section 6.

2. The High Reynolds Number Transition Region

In this section, we summarise earlier findings which prompted this study.
We begin by defining the friction Reynolds number:
R e τ = u τ δ ν kin ,
where u τ is the friction velocity, δ is the boundary layer thickness (pipe radius R for pipe flow) and ν kin is the kinematic viscosity.
The normalised mean velocity U is given by the log-law [4,12]:
U g , mean ( z ) u τ = 1 κ g log ( z + ) + A g , mean ,
where the subscript “g” indicates “global”, A g , mean = 1.01 [4] and the global von Kármán number κ g is a function of R e τ [11]; z is the distance from the wall and z + = z u τ / ν kin is the normalised distance from the wall. Note that z / δ = z + / R e τ .
We use an equation for the square of the normalised fluctuating velocity u, including the viscous term V as formulated in [13]:
u g , fluc 2 ¯ ( z ) u τ 2 = B g , fluc A g , fluc log ( z / δ ) + V ( z + )
= B g , fluc A g , fluc log ( z / δ ) C g , fluc ( z + ) 1 / 2
= B g , fluc A g , fluc log ( z / δ ) C g , fluc R e τ δ z ,
where the subscript “fluc” indicates “fluctuating”. Overbar is time averaging; A g , fluc , B g , fluc and C g , fluc are functions of R e τ [5]; see the left-hand plot in Figure 1. Note that we show C g , fluc / R e τ instead of C g , fluc . These functions are assumed to be identical for smooth and rough pipe flows.
For all figures including results from the model developed in this paper, we include both smooth and rough pipe plots. For many cases, these will be identical, but for several important quantities, they will differ. To make it absolutely clear to the reader when wall roughness impacts the model, we have chosen to include both plots throughout. Details on the smooth and rough pipe settings are provided in Section 4.
As discussed in [5], we combine our results with findings from [14] to derive an area-averaged (AA) turbulence production-to-dissipation ratio:
P ε AA = exp ( 1.49 B g , fluc / 0.91 ) ,
with asymptotic limits:
lim R e τ 0 P ε AA = 0.99
lim R e τ P ε AA = 1.55 ,
see the right-hand plot in Figure 1. The AA definition can be found in [11].
If turbulence production matches dissipation, the flow is said to be in (local) equilibrium. This assumption is usually made for standard turbulent (eddy) viscosity models. As can be seen in the right-hand plot in Figure 1, the AA production-to-dissipation ratio is close to one for low Reynolds numbers, which can be considered as a flow in (global) equilibrium. However, as the Reynolds number increases, the turbulence production becomes much larger than the turbulence dissipation, which means that the flow will not be in equilibrium. This leads to a need for an investigation on how non-equilibrium flows can be included in turbulence models. A first step in this direction—an algebraic turbulence model—is the main topic of this paper.
In the remainder of the paper, we will primarily use the expressions for the fluctuating part of the velocity; therefore, we drop the subscript “fluc”; however, the subscript “mean” will be used when we are treating the mean velocity.

3. Model Overview

Here, we summarise the main components of our model; for details and derivations, we refer to the SI [11].

3.1. Basic Model

Simple shear flow is treated, where the mean shear rate (mean velocity gradient) is given by:
S = U / z ,
which can be inverted to define a mean shear time scale:
τ S = 1 S
For equlibrium flows, we use the Prandtl (subscript “P”) characteristic velocity, and for non-equilibrium flows, we use the Kolmogorov–Prandtl (subscript “K-P”) characteristic velocity [11]. For the turbulent viscosity and the Reynolds (shear) stress of the streamwise fluctuating velocity u and the wall-normal fluctuating velocity v, we write:
ν t , K P = m 2 | S | P ε 1 / 2 = ν t , P P ε 1 / 2
u v ¯ K P = m 2 S | S | P ε 1 / 2 = u v ¯ P P ε 1 / 2 ,
where m is the mixing length, and the turbulent kinetic energy (TKE) production and dissipation rates are given by:
P = m 2 | S | 3 P ε 1 / 2
ε = m 2 | S | 3 P ε 3 / 2
The turbulence model constant C μ , which relates the turbulent viscosity, the TKE (k) and the dissipation of the TKE, can be written as:
C μ = m 4 S 4 k 2 P ε 2
A turbulent length scale can be defined from k and ε as:
L = k 3 / 2 ε ,
and the corresponding ratio between the mixing length and this new length scale is:
m L = C μ 3 / 4
A turbulent time scale can be defined as:
τ L = k ε = L k
The turbulent viscosity ratio is defined as the ratio between the turbulent and kinematic viscosities:
ν r = ν t ν kin

3.2. Turbulent Mixing Length Scales

In [11], we show that the global von Kármán number κ g transitions from a lower value to a higher value with increasing R e τ . Three mixing length definitions are considered and the decision is made to proceed with the Gersten–Herwig (subscript “G-H”) expression. Taking the AA of the local mixing length, we obtain:
m , G H AA = 0.14 κ g × δ
As a shorthand, we can also define the AA mean velocity as:
U m = U g , mean AA

3.3. Turbulence Intensity

We introduce the friction factor λ through an equation relating it to the friction velocity and the AA mean velocity:
u τ 2 = λ 8 × U m 2 ,
with λ = 4 C f , where C f is the skin friction coefficient. However, we note that Equation (22) is not completely accurate for the measurements used; see [5].
The TKE is equal to the sum of the contributions from streamwise, wall-normal and spanwise velocity fluctuations. We will assume that the TKE is proportional to the square of the streamwise velocity fluctuations:
k = β u 2 ¯ = β × u 2 ¯ u τ 2 × u τ 2 = β × u 2 ¯ u τ 2 × λ 8 × U m 2 ,
where β is a constant of proportionality, see Section 5.1 for more details.
The square of the AA turbulence intensity (TI) is defined as:
I AA 2 = u 2 ¯ AA U m 2 = u 2 ¯ AA u τ 2 × u τ 2 U m 2 = u 2 ¯ AA u τ 2 × λ 8
= B g + 3 2 A g 8 C g 3 R e τ × λ 8 ,
with a corresponding AA TKE:
k AA = β U m 2 I AA 2 = β u 2 ¯ AA
= β B g + 3 2 A g 8 C g 3 R e τ × λ 8 × U m 2

4. Model Results

We now apply the results from the preceding sections and the SI to the case of the Princeton Superpipe.
For the TKE, β = 1 and β = 1.5 will be compared; see Section 5.1 for a discussion of these choices.

4.1. Model Output

Outputs from our model will be shown for both smooth and rough pipes. The two initial quantities derived are the friction factor and the friction velocity:
  • λ from [15];
  • u τ from Equation (22),
where the friction velocity enables the calculation of the friction Reynolds number:
R e τ = R u τ ν kin ,
see the left-hand plot in Figure 2. It is clear that the smooth and rough pipe results begin to deviate above R e τ 10 4 .
Having calculated the friction factor, we can derive the AA TI as:
I AA 2 = B g + 3 2 A g 8 C g 3 R e τ × λ 8 ,
see the right-hand plot in Figure 2. Again, the smooth and rough pipe friction factor difference is reflected in the divergence of the TIs: The smooth-pipe TI continues to decrease, whereas the rough-pipe TI reaches a plateau.

4.1.1. Quantities Depending on TKE, but Not Mixing Length

Now, we split our analysis in two parts: in this section, expressions depend on β (TKE) but not on m , G H AA . In Section 4.1.2, we study the opposite case.
The TKE is defined as:
k AA = β B g + 3 2 A g 8 C g 3 R e τ × λ 8 × U m 2 ,
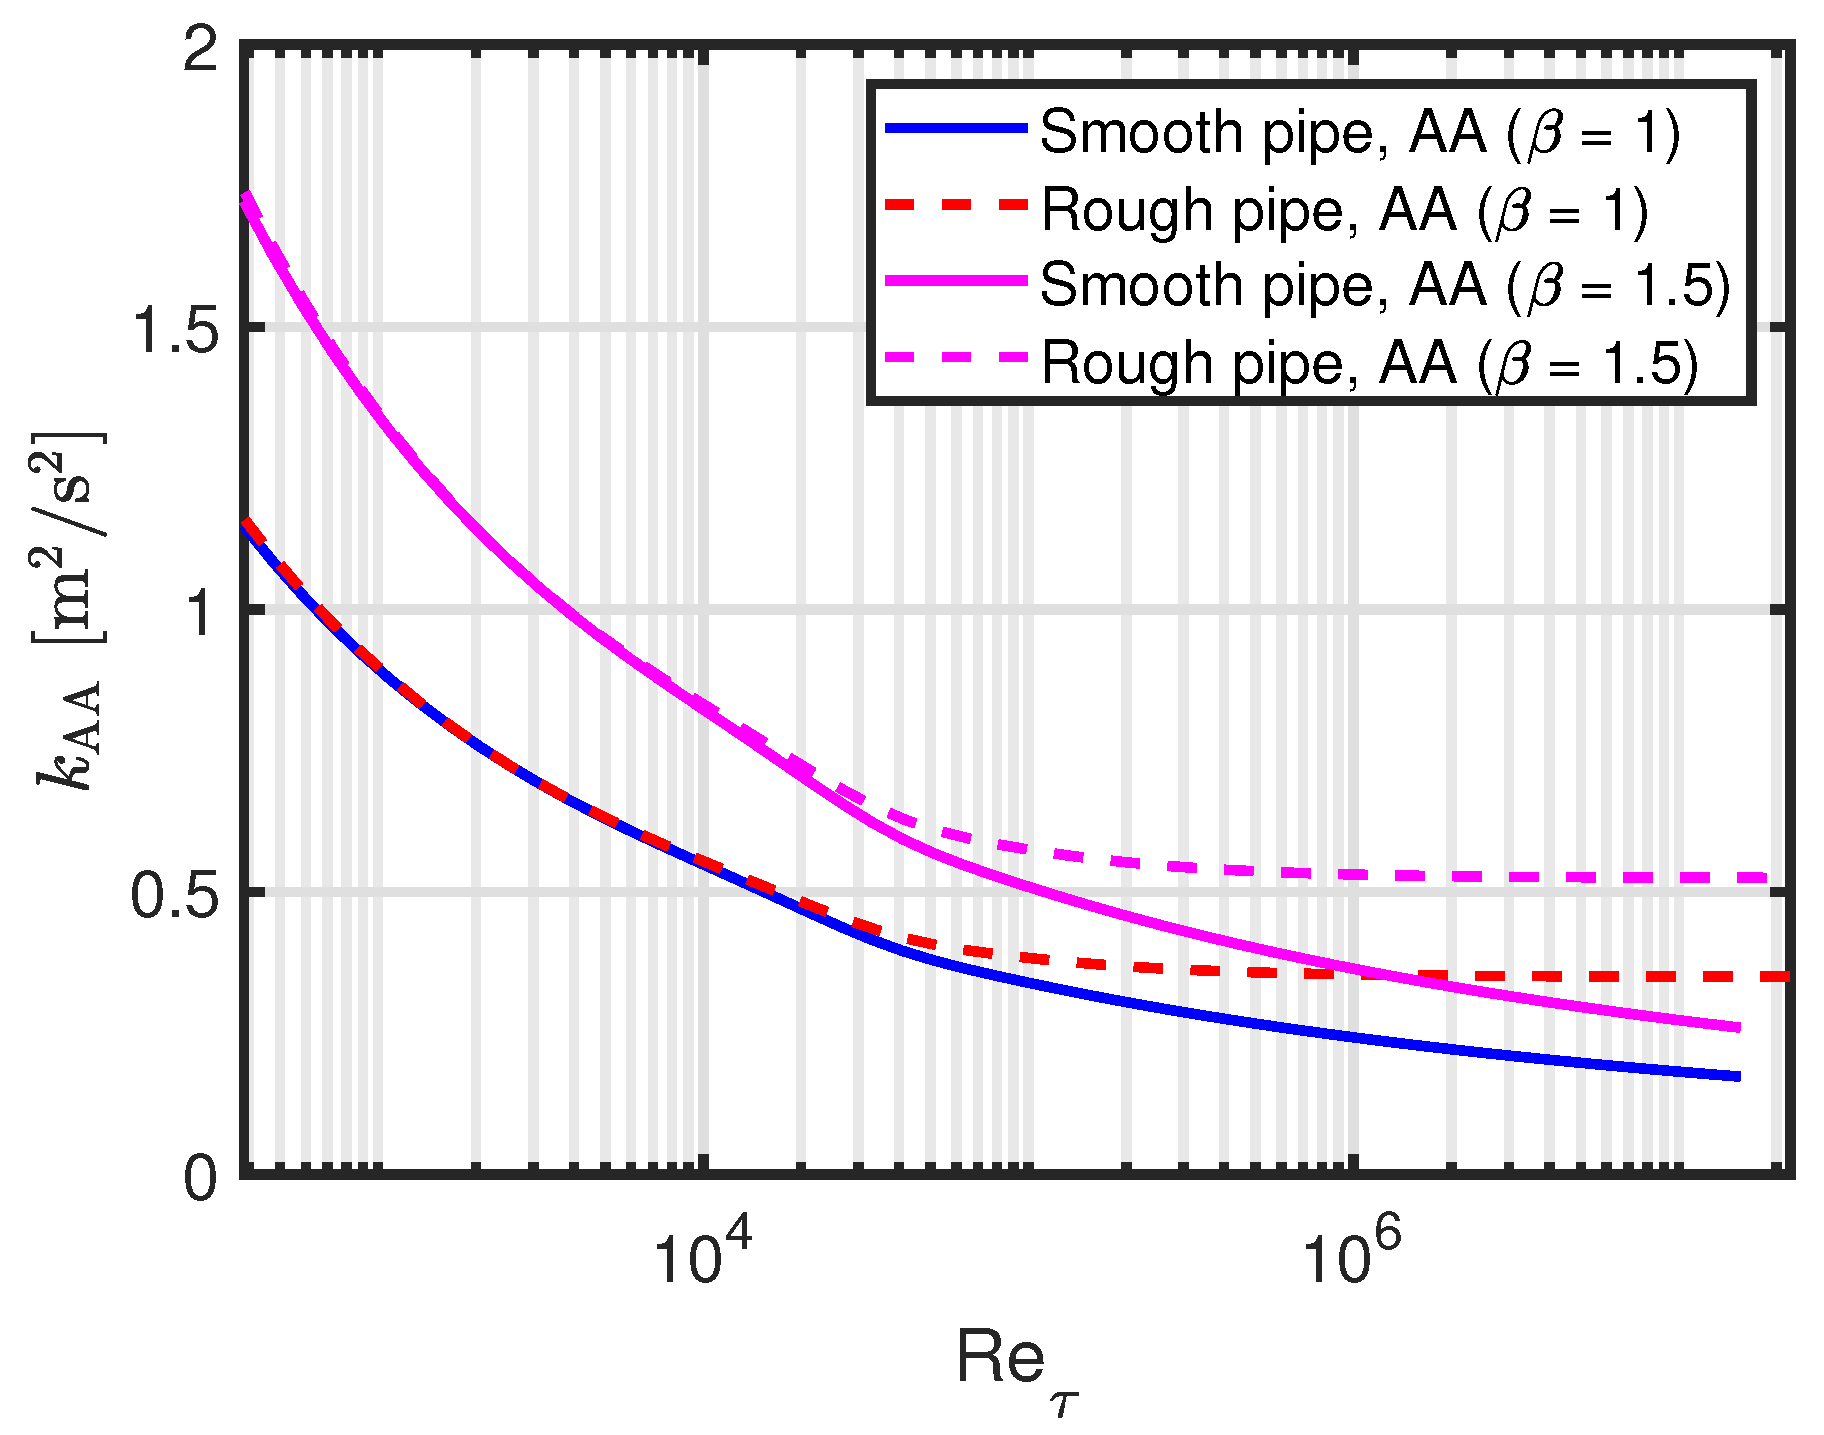
see Figure 3. The two different β values lead to an overall shift of the TKE. The rough-pipe TKE reaches a fixed value for high Reynolds numbers in contrast to the smooth-pipe TKE, which continues to decrease.
The ratio of the absolute value of the Reynolds stress to the TKE is:
| u v ¯ | AA k AA = u τ 2 k AA × P ε AA 1 / 2 = 1 β × B g + 3 2 A g 8 C g 3 R e τ × P ε AA 1 / 2 ,
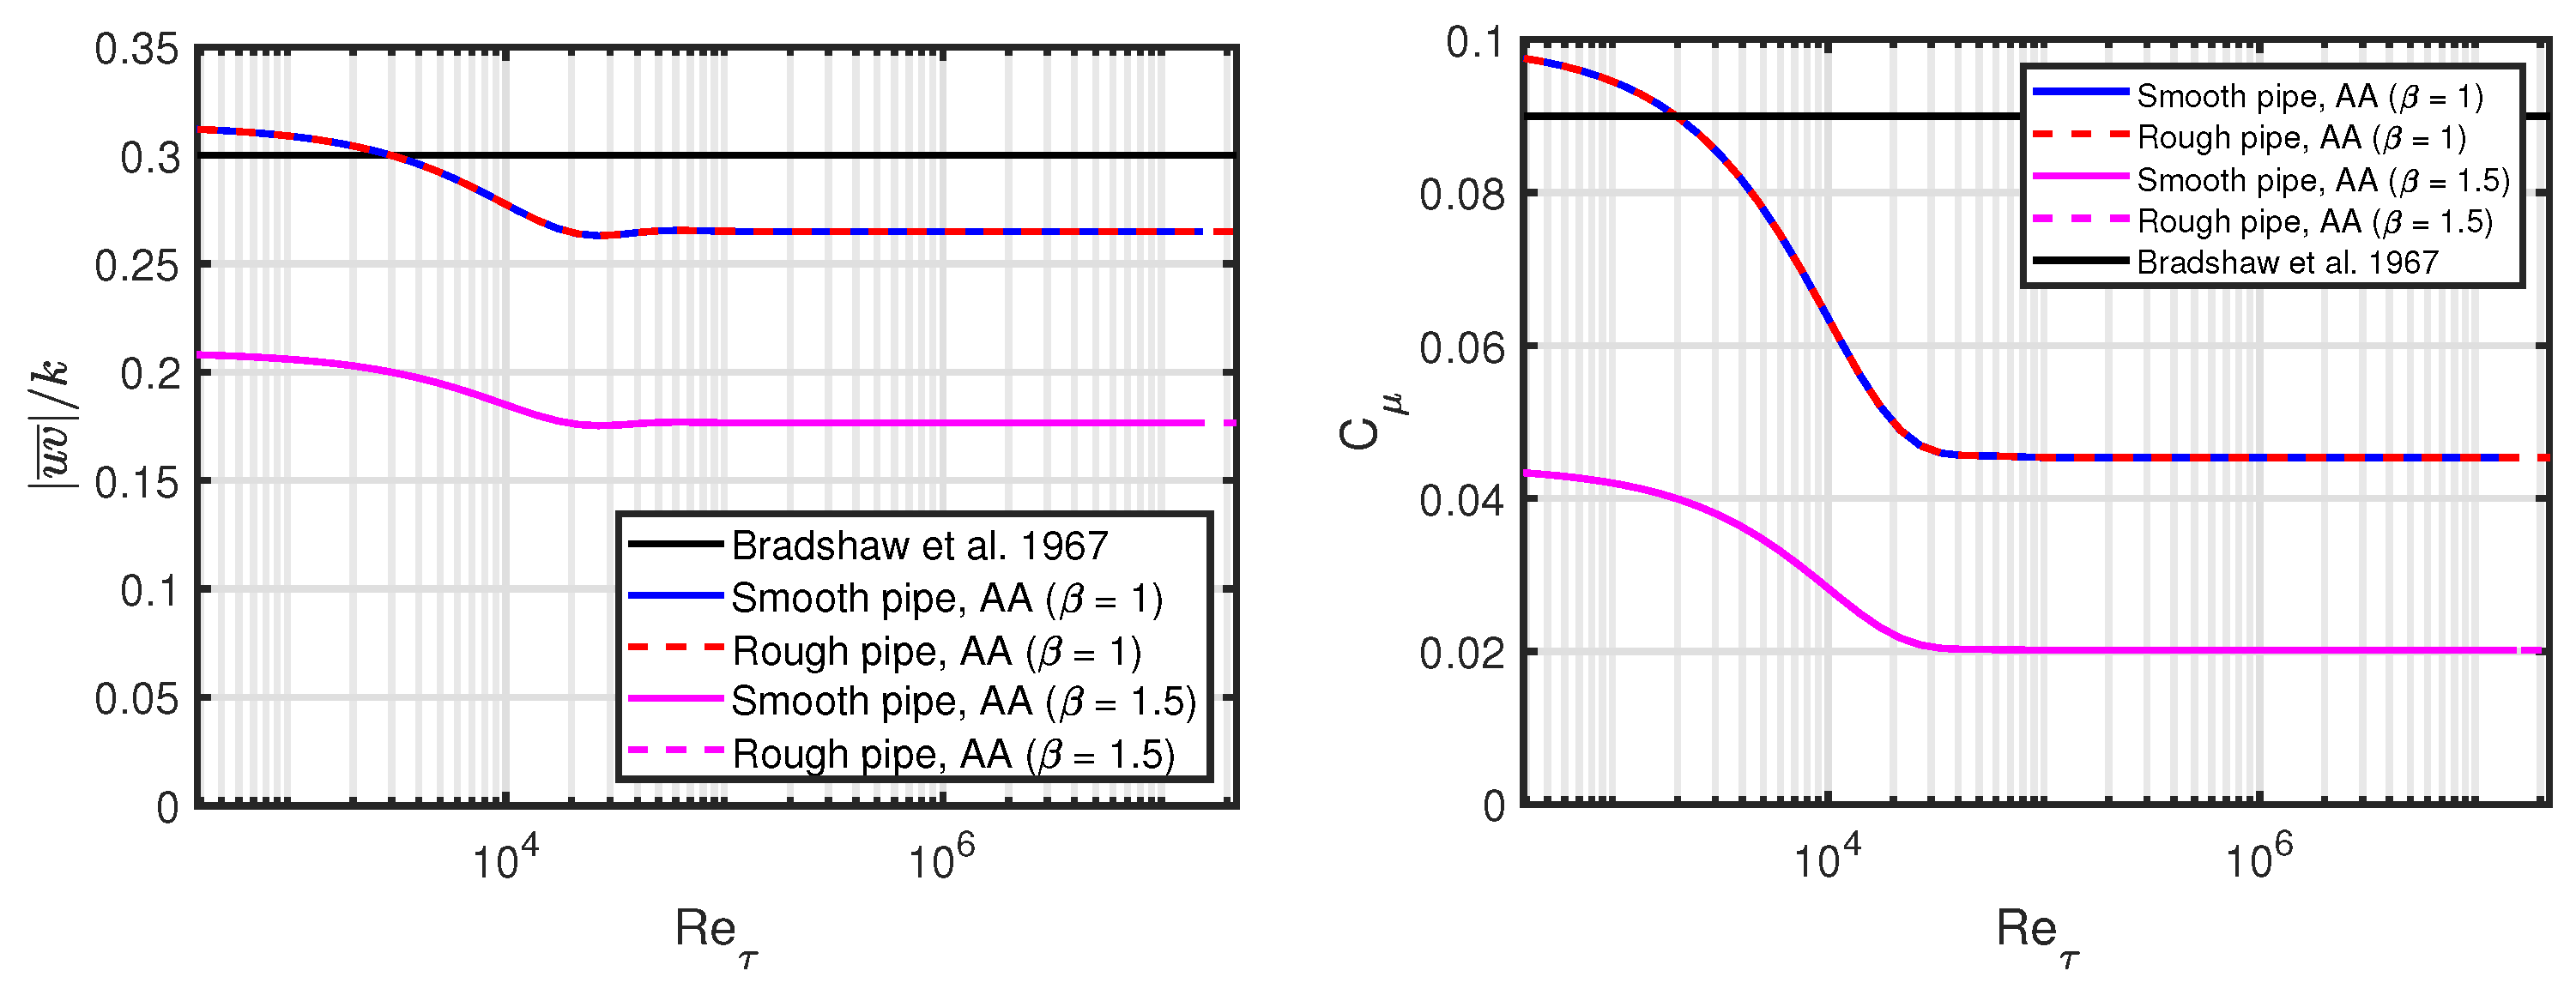
which is compared to the standard value of 0.3 [11,16] in the left−hand plot in Figure 4. The magnitude of our AA expressions match the standard value quite well for the β = 1 case, but it does decrease by 15% across the high Reynolds number transition region, mainly due to the scaling with the turbulence production-to-dissipation ratio. In contrast, the magnitude of our AA expressions with β = 1.5 is much smaller than the standard value. See Section 5.3 for a discussion on these findings.
Note also that there is no difference between the smooth and rough pipe models.
The AA turbulence model constant C μ is defined as:
C μ , AA = u τ 4 k AA 2 × P ε AA 2
= 1 β 2 × u 2 ¯ AA u τ 2 2 × P ε AA 2
= 1 β 2 × B g + 3 2 A g 8 C g 3 R e τ 2 × P ε AA 2 ,
see the right-hand plot in Figure 4. For β = 1 , the values at low Reynolds numbers are fairly close to the standard value of 0.09, but they decrease to around half of that value for high Reynolds numbers. An increase in β to 1.5 leads to a downward shift of C μ . As above, we refer to Section 5.1 for a discussion of these findings.
The AA definition of the turbulence-to-mean shear time scale ratio is:
τ L τ S AA = S AA k AA ε AA = L AA k AA u τ m AA = L m AA u τ β u 2 ¯ AA ,
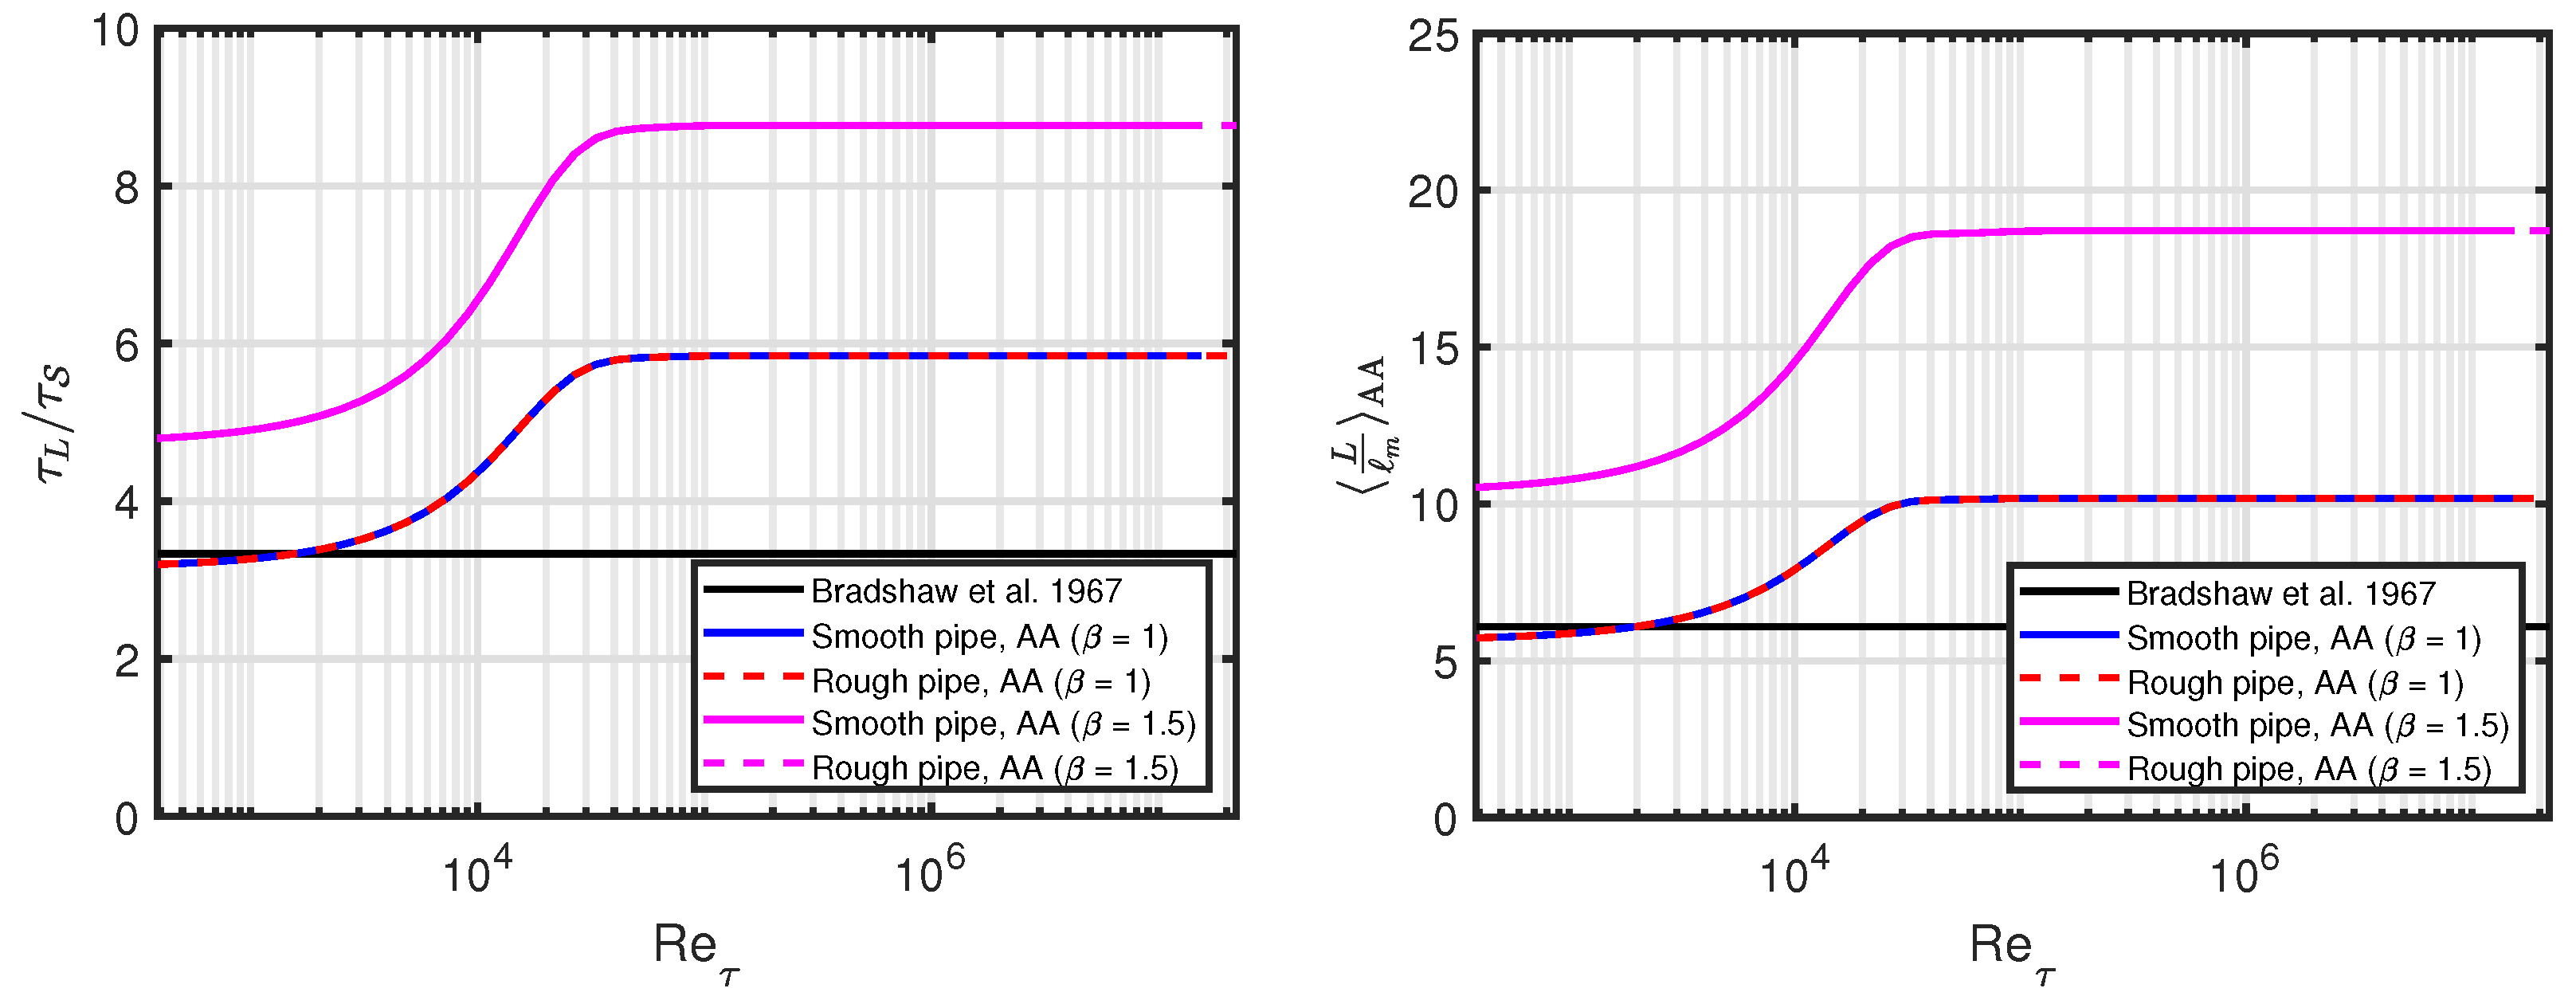
where we have used Equations (10) and (18); see the left−hand plot in Figure 5. The standard value of 10 / 3 [11] is included for reference. For β = 1 and low Reynolds number, the AA definition matches the standard value quite well, but increases for higher Reynolds numbers. For β = 1.5 , the AA definition is shifted upwards. Other time scales are discussed in Section 5.5.
Finally, we show the length scale ratio:
L m AA = C μ , AA 3 / 4 = β 3 / 2 × B g + 3 2 A g 8 C g 3 R e τ 3 / 2 × P ε AA 3 / 2 ,
see the right-hand plot in Figure 5. The standard value of 6.1 0 . 09 3 / 4 is included for reference. Overall, we conclude that L AA 6 19 × m AA , depending on the Reynolds number and β values. Specifically applied to the Gersten–Herwig mixing length, we have:
L G H AA 6 19 × m , G H AA 0.3 1 × δ ,
leading to an interpretation of L as being a characteristic length corresponding to the boundary layer thickness.

4.1.2. Quantities Depending on Mixing Length, but Not TKE

We now treat the inverse case of what was covered in Section 4.1.1, where the quantities depend on m , G H AA but not on β (TKE).
We start by writing expressions for the TKE production and dissipation rates:
P AA = u τ 3 m , G H AA × P ε AA 1 / 2
ε AA = u τ 3 m , G H AA × P ε AA 3 / 2
The TKE production and dissipation rates are shown in Figure 6. The dominating quantity is u τ 3 , which leads to a rapid decrease with increasing Reynolds number. Further, the smooth pipe values continue to decrease while the rough pipe values reach a constant number.
The turbulent viscosity is given by:
ν t , AA = u τ m , G H AA × P ε AA 1 / 2 = C μ , AA × k AA 2 ε AA ,
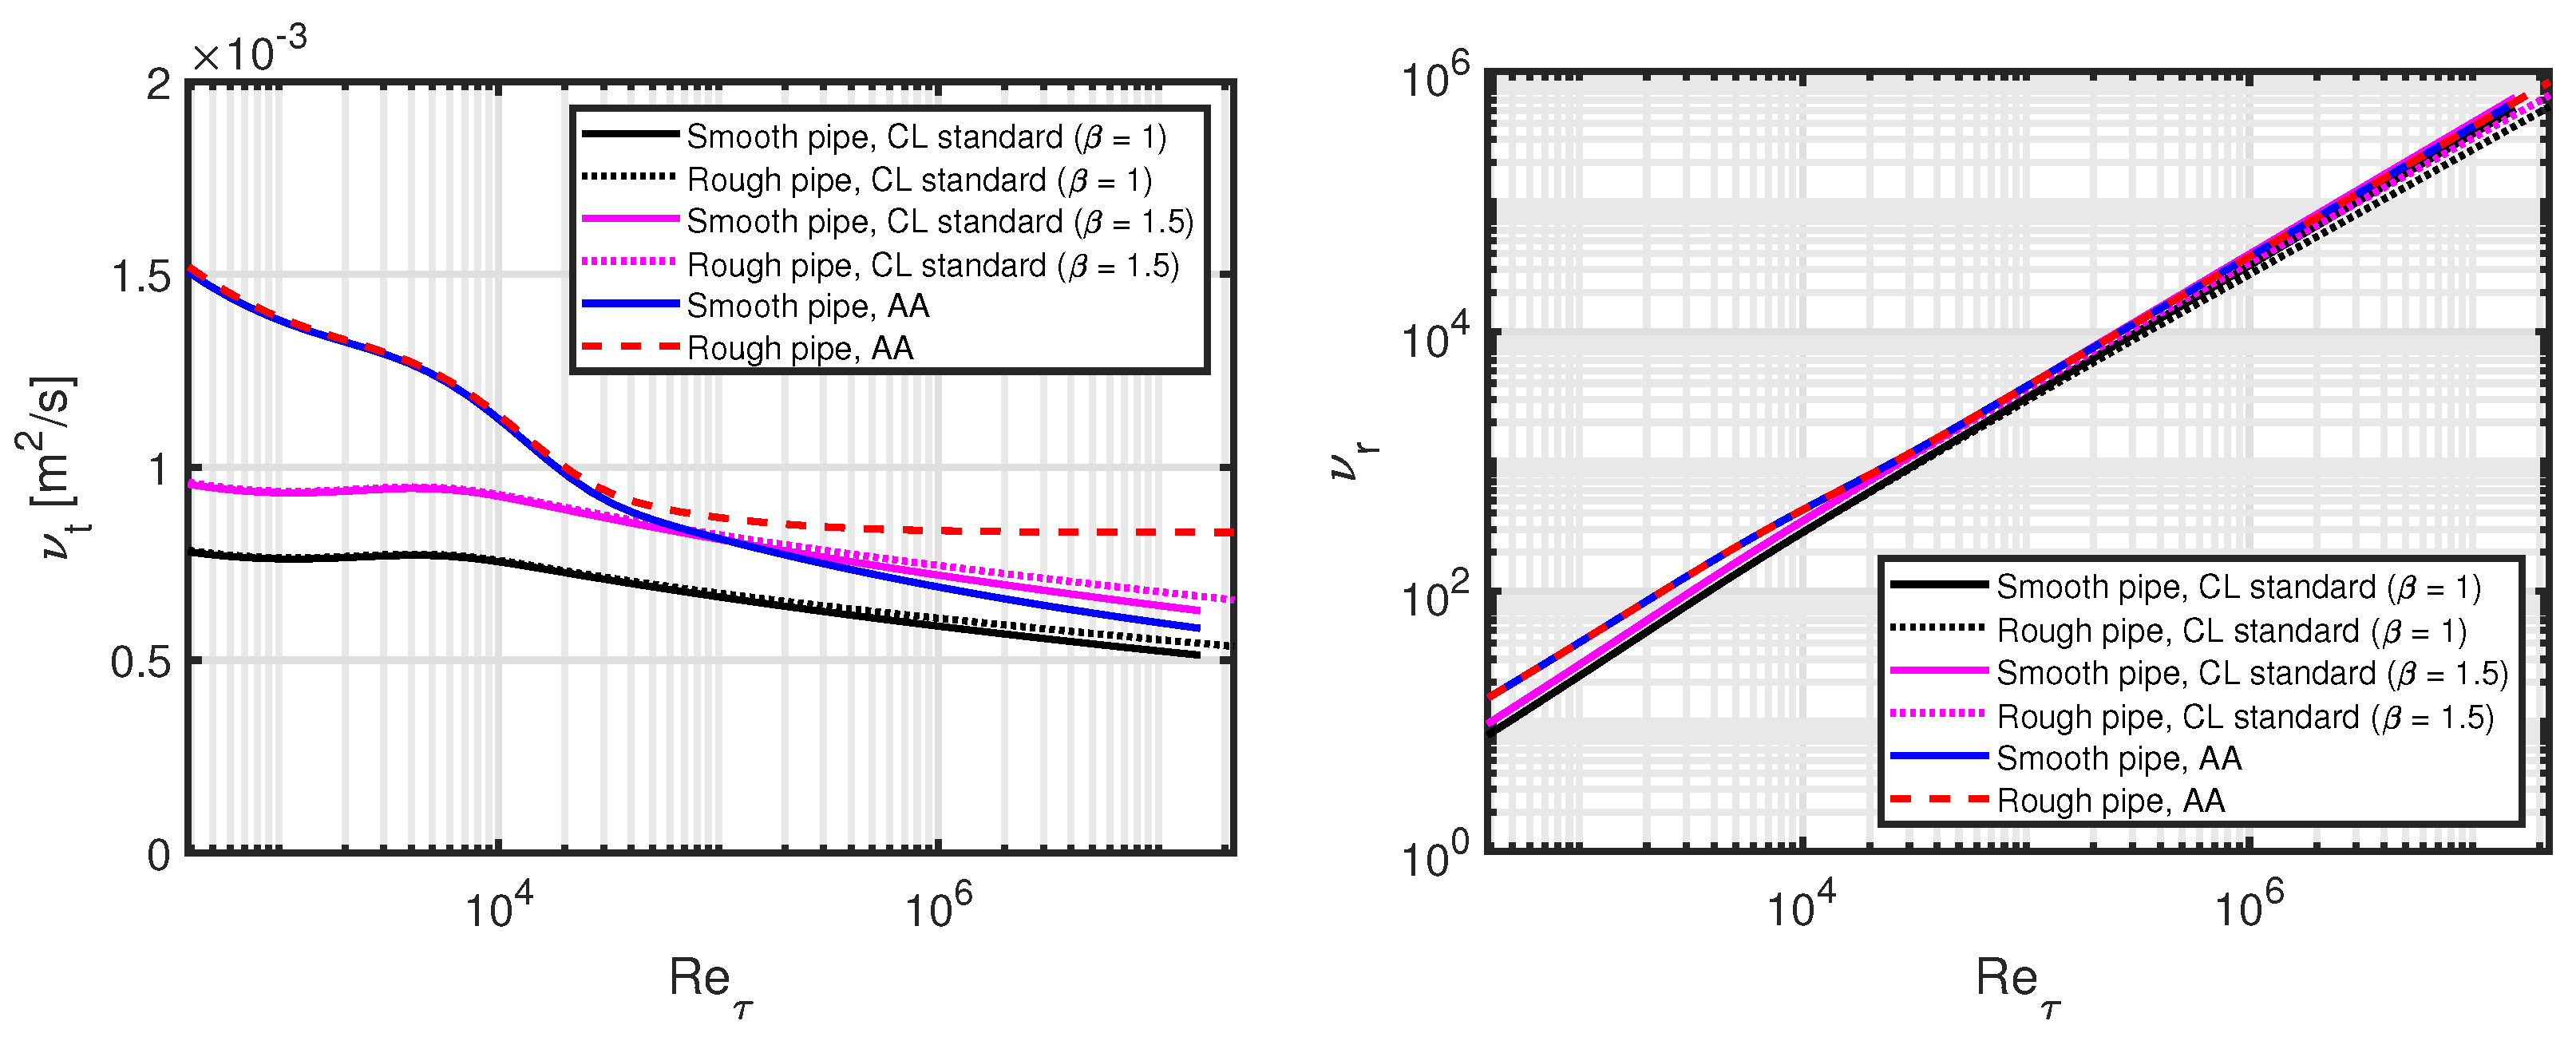
see the left-hand plot in Figure 7, with corresponding turbulent viscosity ratios in the right-hand plot in Figure 7. The values from our model do not depend on β , but for the lines marked “CL standard”, there is a dependency, which will be discussed in Section 5.4.
For our model at low Reynolds numbers, the turbulent viscosity decreases for increasing Reynolds numbers for both smooth and rough pipes. For high Reynolds numbers, the smooth-pipe turbulent viscosity continues to decrease, while the rough-pipe turbulent viscosity approaches a constant value. For both smooth and rough pipes, there is a transition region which is due to the combination of the Reynolds number dependency of the von Kármán number and the turbulence production-to-dissipation ratio.
The turbulent viscosity ratio covers a large range from about 10 to 10 6 , which is directly linked to the range of the kinematic viscosities [11].

5. Discussion

5.1. Turbulence Isotropy

β as defined in Equation (23) is 1.5 for isotropic turbulence, where each of the three fluctuating velocity components contribute equally. For actual flows, what is typically observed is that half of the TKE is in the streamwise fluctuations and the other half is in the sum of the wall-normal and spanwise fluctuations, which implies a β of 1 [17,18].
An open question is whether β is a function of R e τ or if variations in P / ε (based on streamwise fluctuations) are related to a change in β ?
We will use a Reynolds number independent β = 1 for all figures in Section 5, but note that this is an assumption which can, and should, be questioned.

5.2. Physical Mechanism

One explanation for the high Reynolds number transition region is an increase in large-scale structures in the wake region. This can be thought of as an analogy to the “drag crisis” [19].
The question is if these structures are active or inactive, i.e., if they contribute to the turbulent shear stress or not.
In [16], the ratio of the absolute value of the Reynolds stress to the TKE is discussed: “In the last-named paper, evidence is presented that the considerable variation in a 1 , observed experimentally is at least partly due to an ‘inactive’, quasi-irrotational component of the turbulent motion (Townsend 1961), which does not contribute to the shear stress or the dissipation and can therefore be disregarded; therefore, a 1 = constant is a much better approximation than at first appears.” In our notation, 2 a 1 = | u v ¯ | / k and it is thus argued that this quantity can be considered constant.
A similar interpretation is provided in [20], which cites results from [21]: “[…] which argued that the excess of turbulent production in the log layer feeds inactive motions that do not contribute to the turbulent shear stress, but transfer energy to other locations of the flow”.
An opposing view can be found in [22], where it is stated that very-large-scale motions (VLSM) “[…] can contain up to 60% of the cumulative fraction of the Reynolds shear stress […]”.
To summarise, it remains unclear to which extent the high-Reynolds-number structures contribute to the turbulent shear stress. A possible reconciliation of these views is presented in [23], where VLSM (or superstructures) are interpreted to be inactive structures formed as a concatenation of active eddies.
An additional uncertainty of our analysis is that it is based on the Princeton Superpipe measurements, where it has been found that the inner peak of the streamwise fluctuations is not resolved for all Reynolds numbers [24]. However, our main results should be robust, since the global (integral) treatment is not dominated by this inner peak.

5.3. Scaling of C μ

Scaling of C μ with P / ε has been discussed in [25]. We note that the definition of P / ε in [25] is different from our ours; in [25], P / ε is weighted with | u v ¯ | , whereas we use area-averaging. An expression for C μ as a function of P / ε , valid for P / ε > 1 , is given as:
C μ , R = 2 3 × 1 α 0 ω 0 × 1 1 ω 0 ( 1 α 0 P / ε AA ) 1 + 1 ω 0 ( P / ε AA 1 ) 2 ,
with:
α 0 = 2.8
ω 0 = 0.55 ,
where we use the subscript “R” for Rodi and have replaced the turbulence production-to-dissipation ratio from [25] with our area-averaged definition.
As written in [25], under certain conditions “[…] the mixing length hypothesis implies that P / ε is constant; but P / ε need not equal unity”.
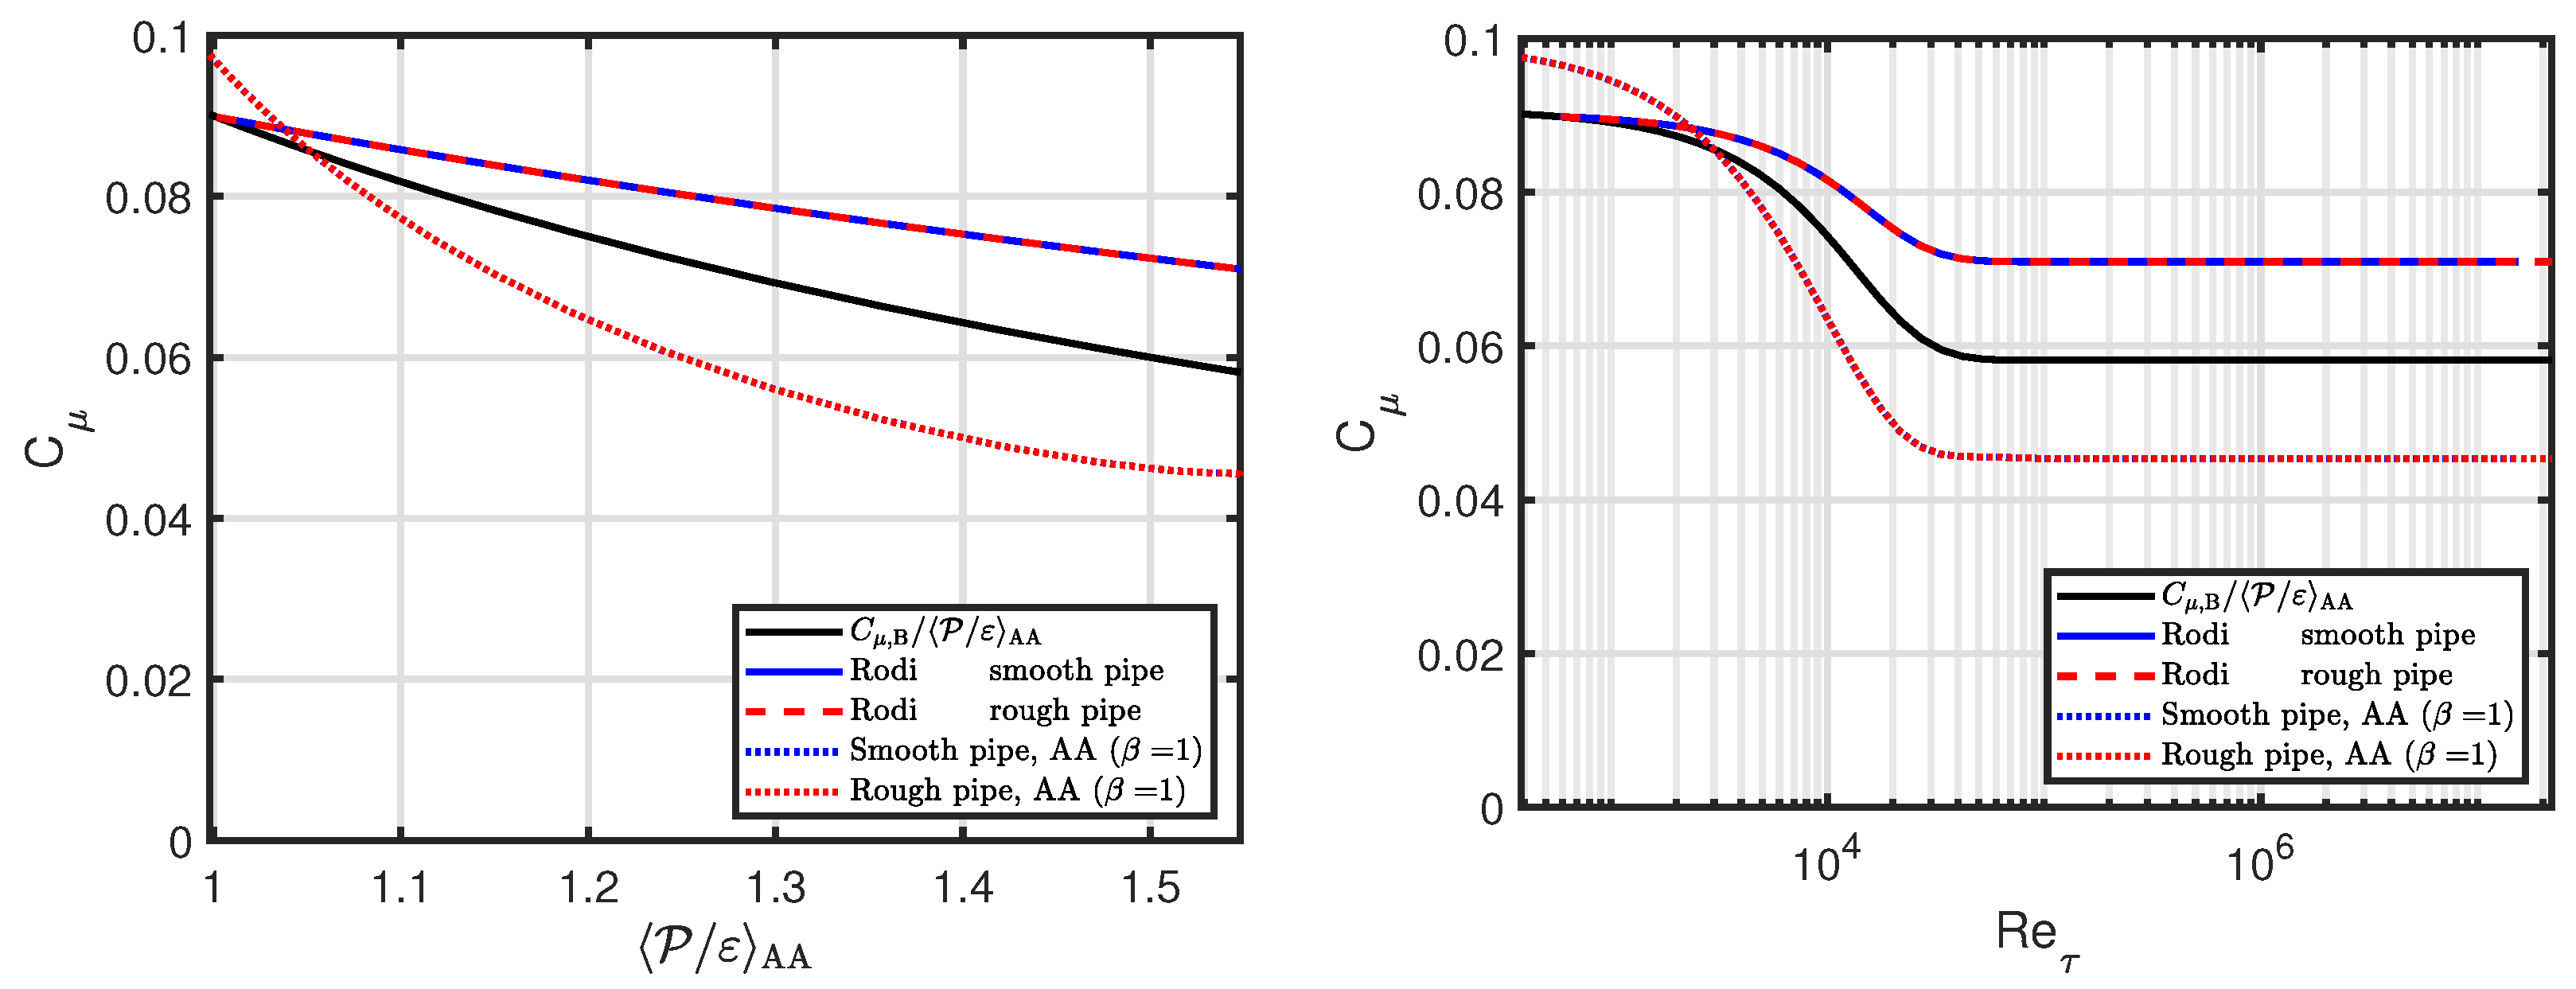
In Figure 8, C μ , R from [25] is compared to C μ , B / P / ε AA and our AA expressions.
The difference in scaling with P / ε between previous findings and our results originates from the assumption of whether | u v ¯ | scales with P / ε or not. Overall, previous findings predict a scaling of C μ with ( P / ε ) 1 , while our expressions imply a scaling of C μ with ( P / ε ) 2 . In [25], the weighting of P / ε with | u v ¯ | somewhat complicates the comparison.

5.4. Scaling of ν t and I

The scaling of the turbulent viscosity can be compared to the standard CL expression from [9], which we have modified to include β specifically:
ν t , CL = β C μ , B 1 / 4 × U CL I CL m , G H , CL ,
where we use [26]:
I CL = 0.055 × R e D 0.041
In Figure 7 (both plots), we have included the turbulent viscosity from Equation (44) and marked it “CL standard”. This does not match our model for the low Reynolds number range, but it does match the smooth pipe model expression quite well for the high Reynolds number range and β = 1.5 . There is no β dependency of the turbulent viscosity in our model.

5.5. Time Scales

From the log-law mean velocity, a single length scale is associated with the von Kármán mixing length, or rather, a continuum of length scales increasing from the wall.
In contrast, the mixing length expressions by Nikuradse and Gersten–Herwig can be considered as consisting of two different ranges, one close to the wall and another one towards the CL. These length scales can be used to define two time scales. A similar conclusion can be drawn from the fluctuations as defined in Equation (3), which also corresponds to two length scales as noted in [5].
Below, we will explore the idea of two time scales based on the assumption of two corresponding length scales. Note that a different time scale ratio for the turbulence-to-mean shear is contained in our model and has been treated in [11]; see also Figure 5.

5.5.1. k ε Turbulence Model with Two Time Scales

Turbulence models with multiple time scales have been treated in [27], with more recent further development to be found in [28]. We base our discussion on homogeneous flow, where equations for the time evolution of k and ε can be written as [29]:
d k d t = P ε c s
d ε d t = C ε 1 P C ε 2 ε c s ε k ,
where the standard values of the coefficients C ε 1 = 1.44 , C ε 2 = 1.92 [30] and:
c s = τ fluc τ mean
is the ratio of the turbulence and the mean flow time scales. Note that c s = 1 for the standard k ε model [31].
The evolution of the turbulence time scale τ fluc = τ L = k / ε (see Equation (18)) is given as [29]:
d ( k / ε ) d t = ( 1 C ε 1 ) P ε 1 c s ( 1 C ε 2 )
If k / ε does not vary with time, d ( k / ε ) / d t = 0 and we have:
c s = C ε 2 1 C ε 1 1 P ε 1 ,
which can be written for AA as:
c s AA = C ε 2 1 C ε 1 1 P ε AA 1 = 2.1 × P ε AA 1 ,
where the final equation assumes that C ε 1 and C ε 2 are constant, i.e., do not scale with R e τ (or, equivalently, with P / ε ). See the left-hand plot in Figure 9, where this k ε expression is equal to the 2.1 “Standard k ε ” value for low Reynolds numbers and decreases monotonically to 1.4 for high Reynolds numbers.

5.5.2. Eddy-Turnover Time Scales

An alternative time scale ratio can be defined by an eddy-turnover (ET) time, both for the fluctuations and for the mean flow [32]:
τ ET , fluc = m u 2 ¯
τ ET , mean = L U ,
along with their ratio:
c s , ET = τ ET , fluc τ ET , mean = m L U u 2 ¯
For AA, this can be rewritten to:
c s , ET AA = m L AA × 1 I AA 2 ,
see the left-hand plot in Figure 9 marked “ET”. The range of c s values is similar to the ones from Section 5.5.1, but not monotonic. The main difference is the increase in c s , ET AA for the smooth pipe, which is due to an increase in the fluctuating time scale, which in turn is due to a decreasing TKE.

5.5.3. Time Evolution of TKE

The time scale ratio from Section 5.5.1 can be used to define an equation for the time evolution of the TKE:
τ L k d k d t = P ε 1 c s ,
which has the solution:
k ( t ) = k ( 0 ) exp t τ L P ε 1 c s ,
where k grows if:
P ε > 1 c s
By defining normalised quantities k * ( t ) = k ( t ) / k ( 0 ) and t * = S t [33], we can rewrite Equation (57) to:
k * ( t * ) = exp t * × 1 τ L S P ε 1 c s
= exp t * × k C μ | u v ¯ | P ε 1 c s ,
where we have used Equation (18) for the second equation.
For c s = 2.1 and the definitions in [11], k C μ / | u v ¯ | = 0.3 , and we can add values to the equation:
k B * ( t * ) = exp 0.16 × t *
= exp c B * × t * ,
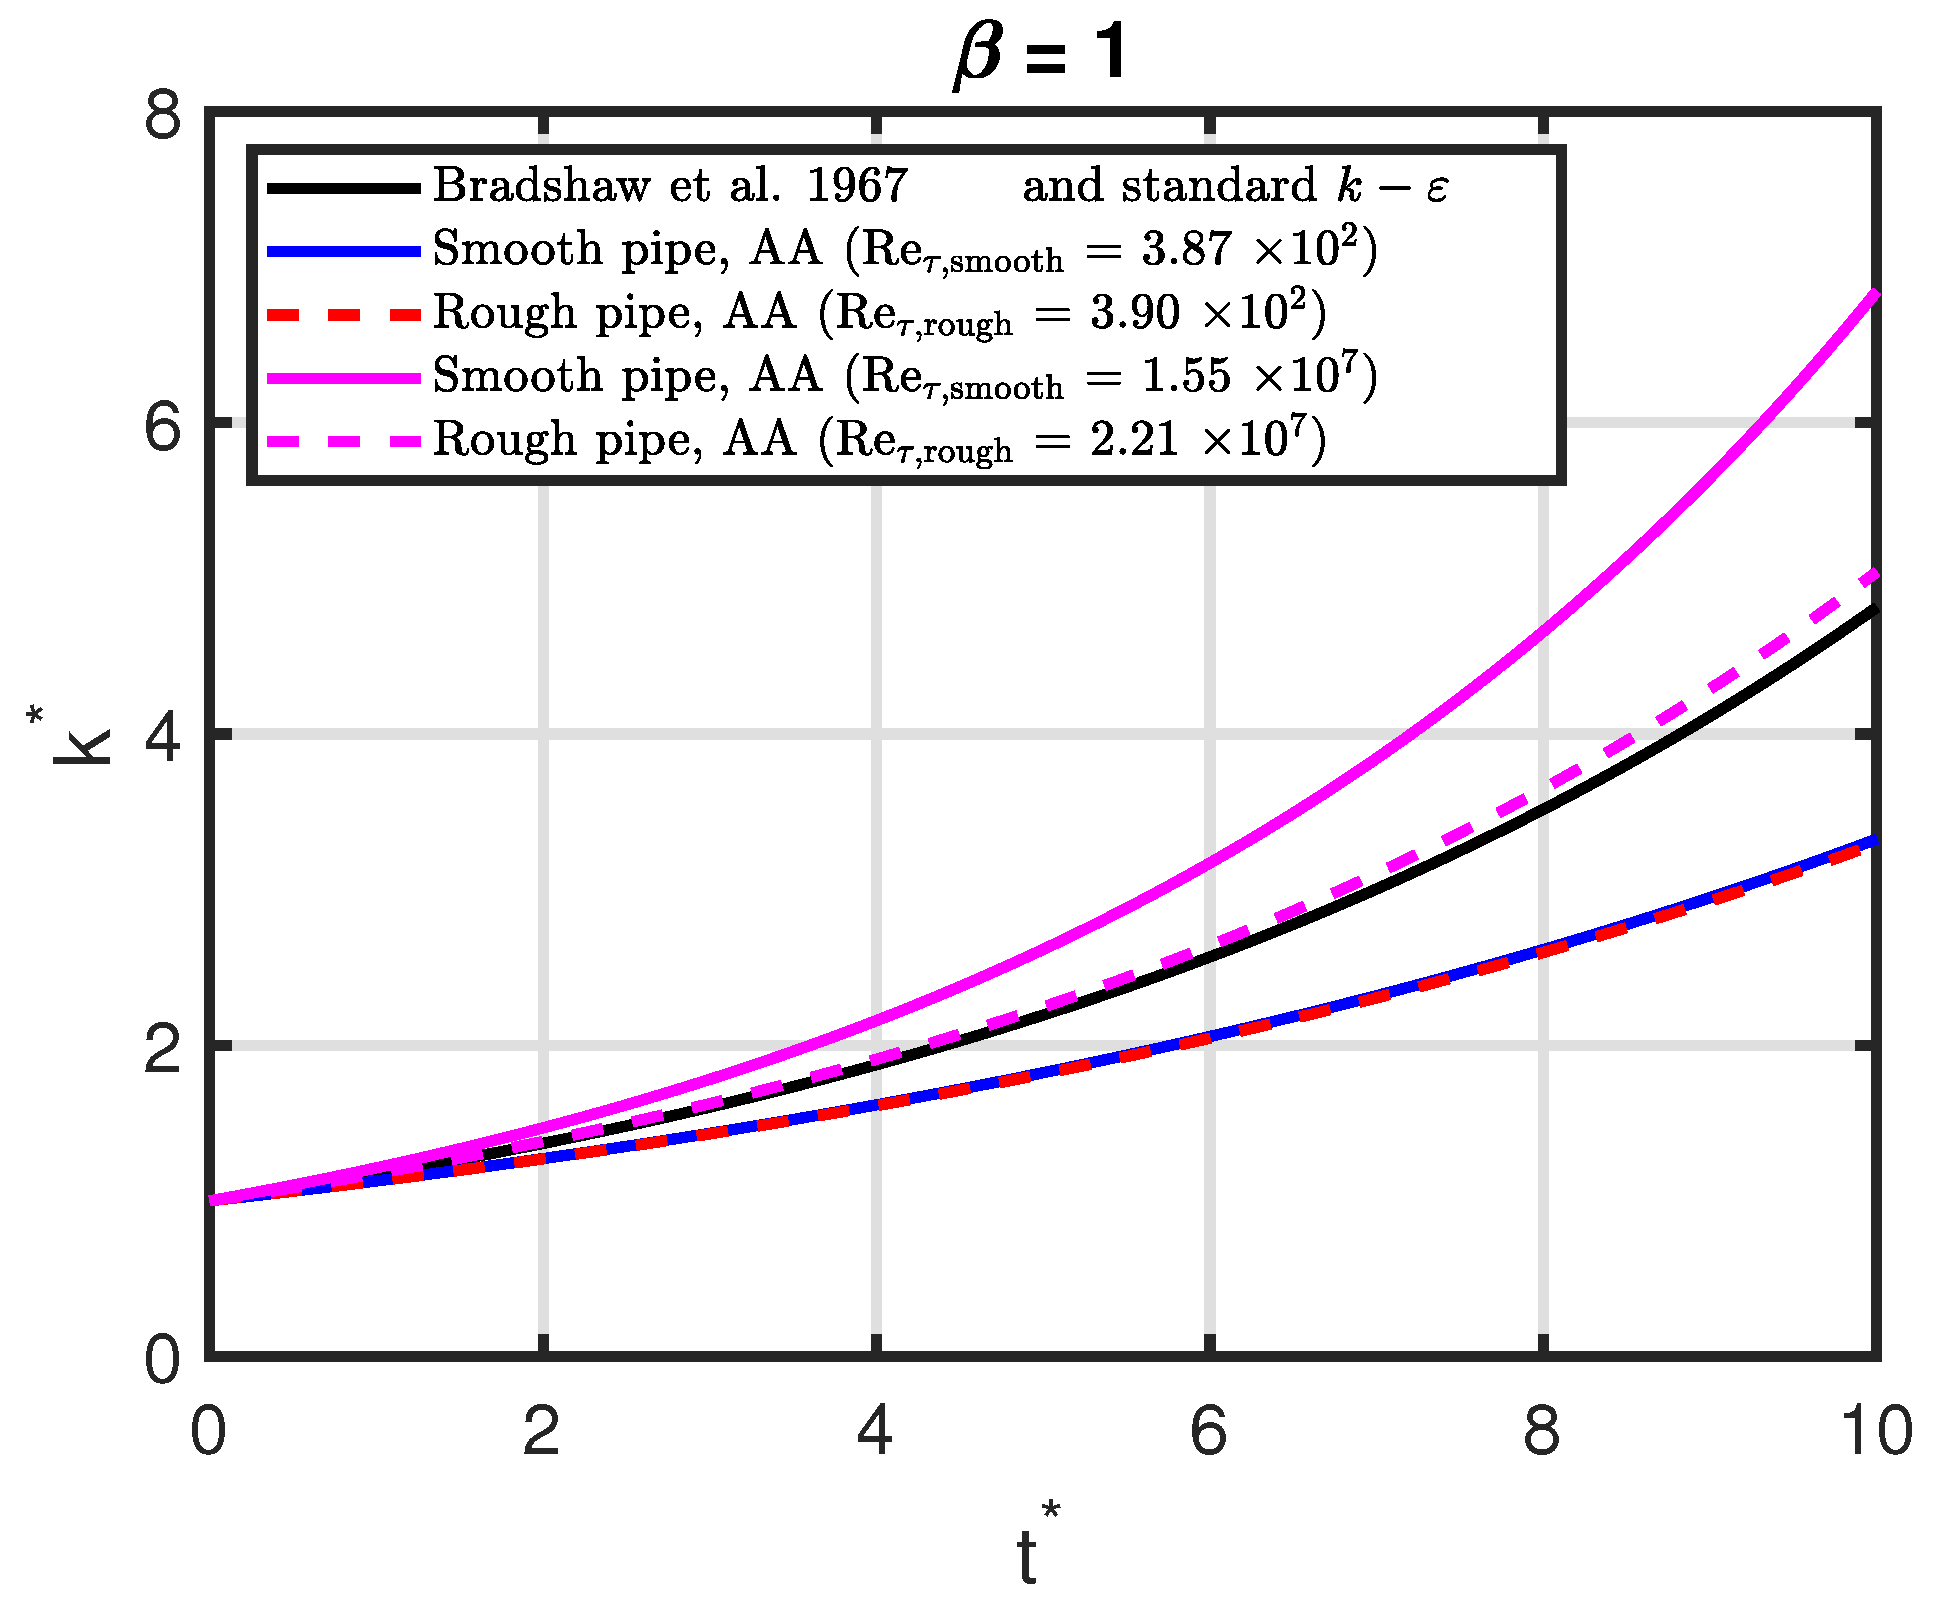
where c B * is shown in the right-hand plot in Figure 9 and k B * is shown in Figure 10.
As for the standard definitions, we can write the TKE as a function of time for our AA model with c s , ET :
k AA * ( t * ) = exp k AA C μ , AA | u v ¯ | AA P ε AA 1 c s , ET AA × t *
= exp c AA * × t * ,
also shown in the right-hand plot in Figure 9 ( c AA * ) and in Figure 10 ( k AA * ).
In the right-hand plot in Figure 9, we see that c AA * is a function of Reynolds numbers as opposed to c B * , which is independent of Reynolds numbers. The increase in c AA * for the smooth pipe is because of an increase in c s , ET AA . It is interesting to note that for high Reynolds numbers, k AA * increases faster for the smooth pipe than for the rough pipe.
  • Decaying Turbulence
If there is no turbulence production ( P = 0 ), both the TKE and the associated dissipation rate will decay. In this case, the solution to Equations (46) and (47) is [32]:
k ( t ) = k 0 t t 0 m
ε ( t ) = ε 0 t t 0 ( m + 1 ) ,
where:
t 0 = c s m k 0 ε 0
is the reference time ( k ( t 0 ) = k 0 and ε ( t 0 ) = ε 0 ) and the decay exponent is:
m = 1 C ε 2 1 ,
which is equal to 1.09 for the standard value of C ε 2 . The exponent observed in measurements is somewhat higher, i.e., around 1.3 [32].
For decaying turbulence, the turbulence time scale can thus be written as:
τ L = k ε = t k 0 ε 0 t 0 = t 1 c s m

5.6. A Plasma Physics Analogy

An analogy for the high Reynolds number transition is a controlled confinement transition in fusion plasmas [34]. Here, a change in the topology of the magnetic field triggers a transition from “good” to “bad” confinement, where the temperature gradient decreases and the core turbulence level increases [35].
In a similar fashion, the mean velocity gradient decreases (mixing length increases) and the CL velocity fluctuations increase with increasing Reynolds number [11].
Thus, the low (high) Reynolds number range corresponds to good (bad) confinement, respectively. One physical aspect which may play a part is the emergence of large structures for the pipe flow case and correlated density–magnetic fluctuations for the fusion plasma example.

5.7. Recommendations for CFD Practitioners

In addition to being used for inlet boundary conditions in CFD simulations, the model output can be used as a complete, self-consistent model. These two applications are described in the following two sections.
For both applications, we recommend to use β = 1 for the TKE, since this matches the standard turbulence model for low Reynolds numbers.

5.7.1. Equilibrium Usage as Inlet Boundary Conditions for CFD Simulations

The standard turbulence models in CFD simulations assume equilibrium flow; therefore we set the AA turbulence production-to-dissipation ratio to be equal to one. For this case, we compare the LIKE algorithm to our proposed equilibrium model in Table 1. Some comments are in order regarding the contents of the table:
  • L: The expressions are taken from [11]. Note that LIKE / AA = 1 / κ g 3 .
  • I: The mix power law expression is derived in [36] with more details provided in [1]. The equilibrium model formulation is from Equation (29).
  • K: The mix and equilibrium expressions are from [11] and Equation (26).
  • E: For the equilibrium model, we define C μ , AA 3 / 4 = B g + 3 2 A g 8 C g 3 R e τ 3 / 2 , see Equation (34). There is a difference of a factor C μ 1 / 4 between the TKE dissipation rates, which (partially) compensates for the difference between the length scales. Note that C μ , AA is a function of R e τ , whereas the LIKE algorithm uses the fixed standard value C μ , B [11].
We are of the opinion that consistent units must be used to define all turbulent quantities, i.e., either CL or AA. The mixed TI ( I mix ) is not straightforward to interpret and thus caution is advised for this definition.
The LIKE algorithm can be viewed as a CL model, since the used mean velocity U m cancels out for the TKE. However, I mix remains a mixture of CL and AA quantities. The LIKE algorithm could be made into a consistent CL model by replacing the existing mixed TI definition with the CL TI definition presented in [11].
Thus, the AA-based equilibrium model we propose is more consistent than what is presented in the LIKE algorithm. Another advantage of the equilibrium model is that wall roughness is taken into account through the friction factor.

5.7.2. Non-Equilibrium Usage as a Standalone Model

The recommendation for the use of the non-equilibrium model as a standalone model is to use the AA expressions in Section 4.1 with β = 1 .

5.8. Known Model Issues

Our model is not able to capture low Reynolds number effects such as the decrease in C μ [31,37]. This is because the hyperbolic tangent functions used can only describe a single transition, which, in our case, is the high Reynolds number transition.

6. Conclusions

An algebraic mixing length non-equilibrium turbulence model has been developed to capture the high Reynolds number transition observed in pipe flow. The model equations have been derived to take the turbulence production-to-dissipation ratio explicitly into account. We provide area-averaged (integral) quantities and examples to match the Princeton Superpipe measurements used to calibrate the model, both for smooth and rough pipes.
The impact of isotropic or non-isotropic turbulence is investigated and relevant figures-of-merit with area-averaged scaling are included, such as turbulent viscosity, C μ and time scales. We expect the predictions to be valid both for pipes and similar geometries such as closed (open) channel flow, see [38] ([39]), respectively. It is essential to validate the model performance in the future; however, we do not know of either direct numerical simulations or alternative measurements for relevant friction Reynolds numbers.
A next step could be to use a similar non-equilibrium approach for more complex one- or two-equation turbulent viscosity models.
Future research could focus on generalising to rotating flows, see, e.g., an extended expression for C μ , which has been proposed [40].

Supplementary Materials

The following supporting information can be downloaded at: https://www.mdpi.com/article/10.3390/w15183234/s1. References [41,42,43,44,45,46,47,48,49,50,51,52,53] are cited in the supplementary materials.

Funding

This research received no external funding.

Data Availability Statement

Data availability is not applicable to this article as no new data were created or analysed.

Acknowledgments

We thank Alexander J. Smits for making the Princeton Superpipe data publicly available.

Conflicts of Interest

The author declares no conflict of interest.

References

  1. Basse, N.T. Mind the Gap: Boundary Conditions for Turbulence Modelling. Available online: https://www.researchgate.net/publication/359218404_Mind_the_Gap_Boundary_Conditions_for_Turbulence_Modelling (accessed on 6 September 2023).
  2. Hultmark, M.; Vallikivi, M.; Bailey, S.C.C.; Smits, A.J. Logarithmic scaling of turbulence in smooth- and rough-wall pipe flow. J. Fluid Mech. 2013, 728, 376–395. [Google Scholar] [CrossRef]
  3. Smits, A.J. Princeton Superpipe Measurements. Available online: https://smits.princeton.edu/superpipe-turbulence-data (accessed on 6 September 2023).
  4. Basse, N.T. Scaling of global properties of fluctuating and mean streamwise velocities in pipe flow: Characterization of a high Reynolds number transition region. Phys. Fluids 2021, 33, 065127. [Google Scholar] [CrossRef]
  5. Basse, N.T. Scaling of global properties of fluctuating streamwise velocities in pipe flow: Impact of the viscous term. Phys. Fluids 2021, 33, 125109. [Google Scholar] [CrossRef]
  6. Prandtl, L. Bericht über Untersuchungen zur ausgebildeten Turbulenz. Z. Angew. Math. Mech. 1925, 5, 136–139. [Google Scholar] [CrossRef]
  7. Prandtl, L. Bericht über neuere Turbulenzforschung. In Hydraulische Probleme; VDI-Verlag: Berlin, Germany, 1926. [Google Scholar]
  8. Versteeg, H.K.; Malalasekera, W. An Introduction to Computational Fluid Dynamics, 2nd ed.; Pearson: London, UK, 2007. [Google Scholar]
  9. Greenshields, C.J.; Weller, H.G. Notes on Computational Fluid Dynamics: General Principles; CFD Direct Ltd.: Reading, UK, 2022. [Google Scholar]
  10. Rodriguez, S. Applied Computational Fluid Dynamics and Turbulence Modeling; Springer: Cham, Switzerland, 2019. [Google Scholar]
  11. Basse, N.T. Supplementary Information: An Algebraic Non-Equilibrium Turbulence Model of the High Reynolds Number Transition Region. Available online: https://www.researchgate.net/publication/373108195_Supplementary_Information_An_algebraic_non-equilibrium_turbulence_model_of_the_high_Reynolds_number_transition_region (accessed on 6 September 2023).
  12. von Kármán, T.H. Nachrichten von der Gesellschaft der Wissenschaften zu Göttingen, Mathematisch-Physikalische Klasse. Mech. Aenlichkeit Turbul. 1930, 1930, 58–76. [Google Scholar]
  13. Perry, A.E.; Henbest, S.; Chong, M.S. A theoretical and experimental study of wall turbulence. J. Fluid Mech. 1986, 165, 163–199. [Google Scholar] [CrossRef]
  14. Davidson, P.A.; Krogstad, P.-Å. A simple model for the streamwise fluctuations in the log-law region of a boundary layer. Phys. Fluids 2009, 21, 055105. [Google Scholar] [CrossRef]
  15. Basse, N.T. Turbulence intensity scaling: A fugue. Fluids 2019, 4, 180. [Google Scholar] [CrossRef]
  16. Bradshaw, P.; Ferriss, D.H.; Atwell, N.P. Calculation of boundary-layer development using the turbulent energy equation. J. Fluid Mech. 1967, 28, 593–616. [Google Scholar] [CrossRef]
  17. Gersten, K.; Herwig, H. Strömungsmechanik; Vieweg: Wiesbaden, Germany, 1992. [Google Scholar]
  18. Schlichting, H.; Gersten, K. Boundary-Layer Theory, 8th ed.; Springer: Berlin/Heidelberg, Germany, 2000. [Google Scholar]
  19. Prandtl, L. Der Luftwiderstand von Kugeln. Nachrichten der Gesellschaft der Wissenschaften zu Göttingen; Springer: Berlin/Heidelberg, Germany, 1914. [Google Scholar]
  20. Cogo, M.; Salvadore, F.; Picano, F.; Bernardini, M. Direct numerical simulation of supersonic and hypersonic turbulent boundary layers at moderate-high Reynolds numbers and isothermal wall condition. J. Fluid Mech. 2022, 945, A30. [Google Scholar] [CrossRef]
  21. Pirozzoli, S.; Romero, J.; Fatica, M.; Verzicco, R.; Orlandi, P. One-point statistics for turbulent pipe flow up to Reτ≈6000. J. Fluid Mech. 2021, 926, A28. [Google Scholar] [CrossRef]
  22. Chi, C.; Thévenin, D.; Smits, A.J.; Wolligandt, S.; Theisel, H. Identification and analysis of very-large-scale turbulent motions using multiscale proper orthogonal decomposition. Phys. Rev. Fluids 2022, 7, 084603. [Google Scholar] [CrossRef]
  23. Deshpande, R.; de Silva, C.M.; Marusic, I. Evidence that superstructures comprise self-similar coherent motions in high Reynolds number boundary layers. J. Fluid Mech. 2023, 969, A10. [Google Scholar] [CrossRef]
  24. Smits, A.J. Batchelor Prize Lecture: Measurements in wall-bounded turbulence. J. Fluid Mech. 2022, 940, A1. [Google Scholar] [CrossRef]
  25. Rodi, W. The Prediction of Free Turbulent Boundary Layers by Use of a Two-Equation Model of Turbulence. Ph.D. Thesis, Univerity of London, London, UK, 1972. [Google Scholar]
  26. Russo, F.; Basse, N.T. Scaling of turbulence intensity for low-speed flow in smooth pipes. Flow Meas. Instrum. 2016, 52, 101–114. [Google Scholar] [CrossRef]
  27. Hanjalić, K.; Launder, B.E.; Schiestel, R. Multiple-time-scale concepts in turbulent transport modelling. In Turbulent Shear Flows, 2nd ed.; Bradbury, L.J.S., Durst, F., Launder, B.E., Schmidt, F.W., Whitelaw, J.H., Eds.; Springer: Berlin/Heidelberg, Germany, 1980. [Google Scholar]
  28. Klein, T.S.; Craft, T.J.; Iacovides, H. The development and application of two-time-scale turbulence models for non-equilibrium flows. Int. J. Heat Fluid Flow 2018, 71, 334–352. [Google Scholar] [CrossRef]
  29. Hamlington, P.E.; Ihme, M. Modeling of non-equilibrium homogeneous turbulence in rapidly compressed flows. Flow Turbul. Combust. 2014, 93, 93–124. [Google Scholar] [CrossRef]
  30. Launder, B.E.; Spalding, D.B. The numerical computation of turbulent flows. Comput. Meth. Appl. Mech. Eng. 1974, 3, 269–289. [Google Scholar] [CrossRef]
  31. Jones, W.P.; Launder, B.E. The prediction of laminarization with a two-equation model of turbulence. Int. J. Heat Mass Transf. 1972, 15, 301–314. [Google Scholar] [CrossRef]
  32. Pope, S.B. Turbulent Flows; Cambridge University Press: Cambridge, UK, 2000. [Google Scholar]
  33. Speziale, C.G. Modeling non-equilibrium turbulent flows. In Modeling Complex Turbulent Flows; Salas, M.D., Hefner, J.N., Sakell, L., Eds.; Springer: Dordrecht, The Netherlands, 1999. [Google Scholar]
  34. Zoletnik, S.; Basse, N.P.; Saffman, M.; Svendsen, W.; Endler, M.; Hirsch, M.; Werner, A.; Fuchs, C.; The W7-AS Team. Changes in density fluctuations associated with confinement transitions close to a rational edge rotational transform in the W7-AS stellarator. Plasma Phys. Control. Fusion 2002, 44, 1581–1607. [Google Scholar] [CrossRef]
  35. Basse, N.P.; Michelsen, P.K.; Zoletnik, S.; Saffman, M.; Endler, M.; Hirsch, M. Spatial distribution of turbulence in the Wendelstein 7-AS stellarator. Plasma Sources Sci. Technol. 2002, 11, A138–A142. [Google Scholar] [CrossRef]
  36. Ansys Fluent User’s Guide, Release 2022 R2 (2022). Available online: https://support.ansys.com (accessed on 6 September 2023).
  37. Launder, B.E.; Sharma, B.I. Application of the energy-dissipation model of turbulence to the calculation of flow near a spinning disc. Lett. Heat Mass Transf. 1947, I, 131–138. [Google Scholar]
  38. Hoyas, S.; Oberlack, M.; Alcántara-Ávila, F.; Kraheberger, S.V.; Laux, J. Wall turbulence at high friction Reynolds numbers. Phys. Rev. Fluids 2022, 7, 014602. [Google Scholar] [CrossRef]
  39. Yao, J.; Chen, X.; Hussain, F. Direct numerical simulation of turbulent open channel flows at moderately high Reynolds numbers. J. Fluid Mech. 2022, 953, A19. [Google Scholar] [CrossRef]
  40. Pope, S.B. A more general effective-viscosity hypothesis. J. Fluid Mech. 1975, 72, 331–340. [Google Scholar] [CrossRef]
  41. Apsley, D.D. Turbulence Modelling. Available online: https://personalpages.manchester.ac.uk/staff/david.d.apsley/lectures/comphydr/index.htm (accessed on 6 September 2023).
  42. Boussinesq, J. Essai sur la théorie des eaux courantes. Mém. Présent Par Divers Savants l’Acad. Sci. 1877, 23, 1–680. [Google Scholar]
  43. Kolmogorov, A.N. The equations of turbulent motion in an incompressible fluid. Izv. Acad. Sci. USSR Phys. 1942, 6, 56–58. (In Russian) [Google Scholar]
  44. Prandtl, L. Über ein neues Formelsystem für die ausgebildete Turbulenz. Nachr. Akad. Wiss. Göttingen Math.-Phys. Klasse 1945, 6–19. [Google Scholar]
  45. Taylor, G.I. Statistical theory of turbulence, Parts I-IV. Proc. R. Soc. Lond. A 1935, 151, 421–478. [Google Scholar] [CrossRef]
  46. Wilcox, D.C. Turbulence Modeling for CFD, 3rd ed.; DCW Industries: La Canada Flintridge, CA, USA, 2006. [Google Scholar]
  47. Tennekes, H.; Lumley, J.L. A First Course in Turbulence; MIT Press: Cambridge, MA, USA, 1972. [Google Scholar]
  48. Nikuradse, J. Gesetzmäßigkeiten der turbulenten Strömung in Glatten Rohren. Vdi Forschungsheft 1932, 356, 1–36. [Google Scholar]
  49. Kármán, T.v. Mechanische Ähnlichkeit und Turbulenz. Nachrichten Ges. Wiss. Göttingen-Math.-Phys. Kl. 1930, 1930, 58–76. [Google Scholar]
  50. Cantwell, B.J. A universal velocity profile for smooth wall pipe flow. J. Fluid Mech. 2019, 878, 834–874. [Google Scholar] [CrossRef]
  51. Cantwell, B.J.; Bilgin, E.; Needels, J.T. A new boundary layer integral method based on the universal velocity profile. Phys. Fluids 2022, 34, 075130. [Google Scholar] [CrossRef]
  52. Greenshields, C. Private Communication, 2021.
  53. Basse, N.T. Extrapolation of turbulence intensity scaling to Reτ >> 105. Phys. Fluids 2022, 34, 075128. [Google Scholar] [CrossRef]
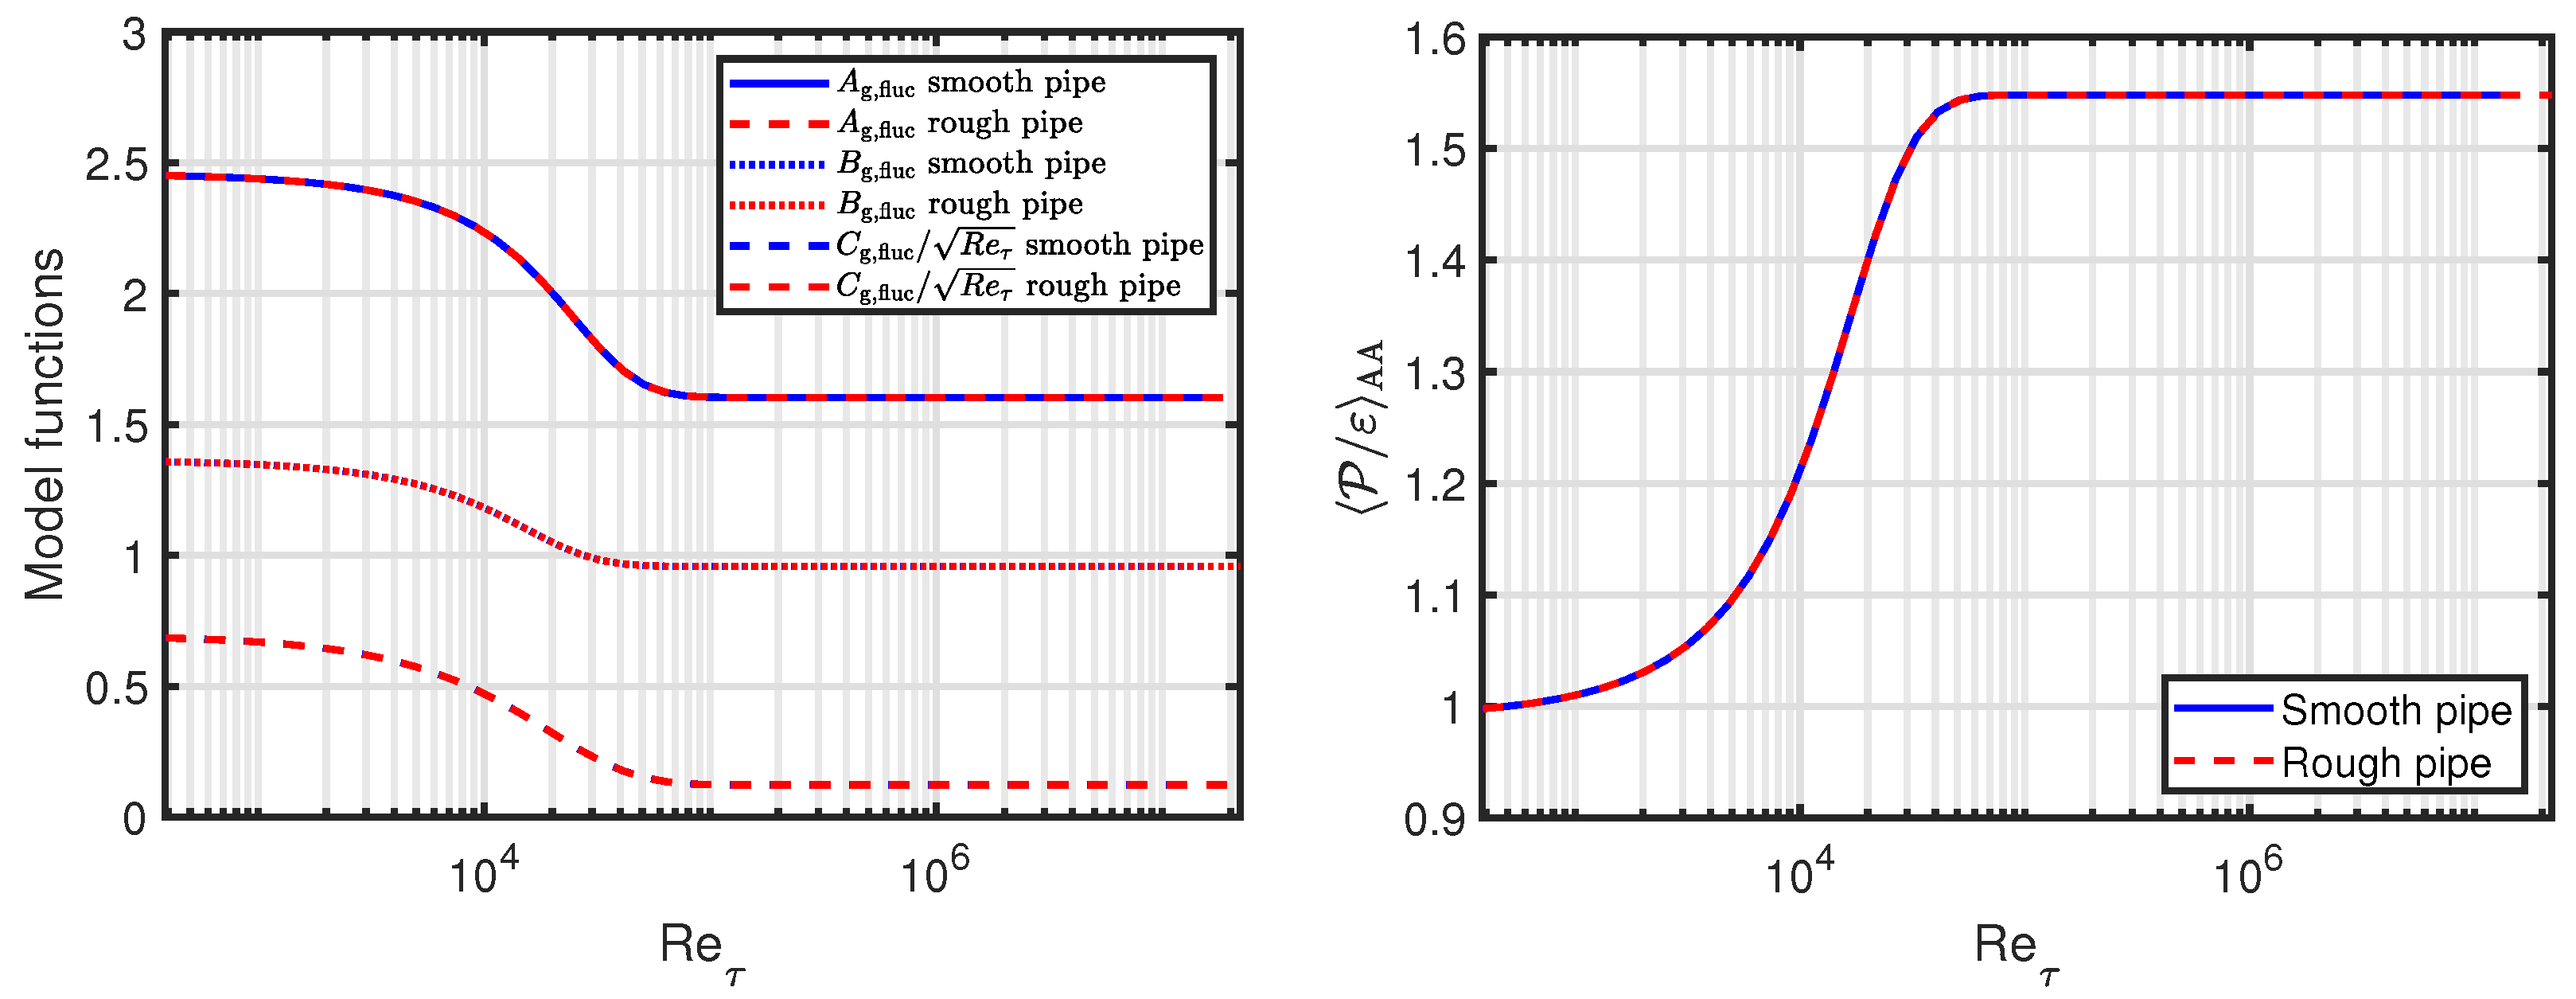
Figure 1. Left-hand plot: Functions for the square of the normalised fluctuating velocity as a function of friction Reynolds number; right-hand plot: area-averaged (AA) turbulence production-to-dissipation ratio as a function of friction Reynolds number. For both plots, the smooth and rough pipe lines are identical and cannot be distinguished.
Water 15 03234 g001
Figure 2. Left-hand plot: Friction factor and friction velocity as a function of R e τ . For the friction factor, Superpipe measurements are included; right-hand plot: AA turbulence intensity as a function of R e τ .
Water 15 03234 g002
Figure 3. Turbulent kinetic energy as a function of R e τ for β = 1 and β = 1.5 .
Water 15 03234 g003
Figure 4. Left-hand plot: The ratio of the absolute value of the Reynolds stress to the turbulent kinetic energy as a function of R e τ for β = 1 and β = 1.5 ; right-hand plot: C μ as a function of R e τ for β = 1 and β = 1.5 . For both plots, smooth and rough pipe lines are identical and cannot be distinguished [16].
Water 15 03234 g004
Figure 5. Left-hand plot: The turbulence-to-mean shear time scale ratio as a function of R e τ for β = 1 and β = 1.5 . Right-hand plot: AA length scale ratio as a function of R e τ for β = 1 and β = 1.5 . For both plots, smooth and rough pipe lines are identical and cannot be distinguished [16].
Water 15 03234 g005
Figure 6. Turbulent kinetic energy production and dissipation rate as a function of R e τ .
Water 15 03234 g006
Figure 7. Turbulent viscosity (left-hand plot) and turbulent viscosity ratio (right-hand plot) as a function of R e τ for β = 1 and β = 1.5 .
Water 15 03234 g007
Figure 8. C μ , R from [25] compared to C μ , B / P / ε AA and our AA expressions. Left-hand plot: As a function of P / ε AA . Right-hand plot: As a function of R e τ . Smooth and rough pipe lines are identical and cannot be distinguished.
Water 15 03234 g008
Figure 9. Left-hand plot: The ratio of the turbulence and the mean flow time scales as a function of R e τ . The smooth and rough pipe lines (for k ε ) are identical and cannot be distinguished. Right-hand plot: Exponential constant as a function of R e τ [16,31].
Water 15 03234 g009
Figure 10. Normalised turbulent kinetic energy as a function of normalised time for low and high friction Reynolds numbers [16,31].
Water 15 03234 g010
Table 1. A comparison between the LIKE algorithm [10] and the proposed equilibrium model.
SourceLIKE AlgorithmEquilibrium Model
L LIKE = m , N , CL = 0.14 × δ AA = m , G H AA = 0.14 κ g × δ
I I LIKE = I mix = 0.16 × R e D 1 / 8 I AA = B g + 3 2 A g 8 C g 3 R e τ × λ 8
K k LIKE = k mix = U m 2 I mix 2 k AA = U m 2 I AA 2
E ε LIKE = C μ , B × k LIKE 3 / 2 LIKE ε AA = C μ , AA 3 / 4 × k AA 3 / 2 AA = k AA 3 / 2 L AA
Disclaimer/Publisher’s Note: The statements, opinions and data contained in all publications are solely those of the individual author(s) and contributor(s) and not of MDPI and/or the editor(s). MDPI and/or the editor(s) disclaim responsibility for any injury to people or property resulting from any ideas, methods, instructions or products referred to in the content.