Article

Comprehensive Drought Vulnerability Assessment in Northwestern Odisha: A Fuzzy Logic and Analytical Hierarchy Process Integration Approach

1
Special Centre for Disaster Research, Jawaharlal Nehru University, New Delhi 110067, India
2
Department of Geography, University of Gour Banga, Malda 732103, India
3
Department of Geography, Institute of Science, Banaras Hindu University, Varanasi 221005, India
4
School of Environmental Sciences, Jawaharlal Nehru University, New Delhi 110067, India
5
Institute for Global Environmental Strategies 2108-11 Kamiyamaguchi, Hayama, Kanagawa 240-0115, Japan
*
Author to whom correspondence should be addressed.
Water 2023, 15(18), 3210; https://doi.org/10.3390/w15183210
Submission received: 5 July 2023 / Revised: 17 August 2023 / Accepted: 4 September 2023 / Published: 8 September 2023

Abstract

:
Crafting a comprehensive strategy to mitigate the impact of droughts, a complex geo-hazard profoundly affecting socio-economic aspects, entails the creation of a drought vulnerability map as a primary step. This study harmonizes geospatial techniques and the Fuzzy Analytical Hierarchy Process (fuzzy AHP) to formulate such a map for northwestern Odisha, India. From six principal drought-induced vulnerability parameters, namely physical attributes, water demand and usage, agriculture, land use, groundwater and population/development, 22 sub-parameters were selected. Spatial layers were generated for each sub-parameter, followed by their fuzzification using a fuzzy membership approach. Subsequently, AHP was employed to establish parameter weights through pair-wise comparisons. By applying the weighted overlay method, drought vulnerability maps were generated, classifying regions into five vulnerability levels: very high, high, moderate, low, and very low. The outcomes indicate that roughly 33% of the area is classified as having high drought vulnerability. Validation of the approach using statistical metrics, including accuracy, root mean square error and mean absolute error, demonstrates its efficacy in gauging drought vulnerability, thereby aiding planners in devising effective drought mitigation strategies.

1. Introduction

The frequency and severity of natural hazards are on the rise, necessitating enhanced resilience among communities to effectively manage these hazardous circumstances. Environmental hazards are causing escalating losses, with global economic damage from natural disasters tripling between the 1960s and 1980s, reaching USD 120 billion [1]. Subsequently, in the 1990s, economic losses surged to USD 400 billion [2]. Drought, a prominent climatic hazard, profoundly affects a substantial global population, often exceeding the impact of other disasters [3]. Despite its significance, drought remains a dynamically complex and poorly comprehended environmental crisis, impacting more individuals than any other hazard [4]. With the advent of global warming, drought occurrences are escalating, bearing consequences for millions worldwide [5]. In India, over 50% of the territory is susceptible to severe drought [6], and climate change is anticipated to reshape the nation’s vulnerability profile to drought [7]. According to Community Response to Extreme Drought (2016), nearly 1.3 billion people in India have been affected by drought between 1900 and 2016. The intensification of drought events in terms of severity and duration poses a direct threat to water availability and food security in the country [8]. In the present era, effective water resource management faces a significant challenge in the form of water scarcity, exacerbated by the imbalance in rainfall patterns and rising temperatures associated with climate change [9]. The escalating frequency and intensity of drought events pose a potential threat to both food security and water resources in the country. This underscores the critical importance of delineating drought-prone areas, particularly within India’s agro-economic context, with a specific focus on the monsoon season. Projections indicate a projected increase of approximately 32% in India’s overall water consumption by 2050 [10], with half of the agricultural land relying on rainfall for cultivation once the maximum irrigation capacity is reached [11]. The growing risk of drought jeopardizes the availability of freshwater resources and rain-fed agriculture [12].
The notion of vulnerability is intricate, encompassing elements such as exposure, sensitivity to external stresses and adaptive capacity [13]. The Intergovernmental Panel on Climate Change (IPCC) explains that vulnerability to climate-induced disasters hinges on factors such as the scale, speed of climate change and the system’s responsiveness and adaptability [14]. This multifaceted perspective of vulnerability also incorporates considerations of inequality and poverty [15]. The IPCC’s fifth assessment defines vulnerability as the inclination to experience adverse effects, particularly highlighting societal risks associated with disasters. This is influenced by the population’s ability to cope, encompassing their resource endowments and exemptions. The vulnerability and risk associated with drought are anticipated to amplify in the coming decades [16]. Given the evolving climatic circumstances, an effective approach is imperative to counter the increasing susceptibility, emphasizing a proactive stance across various levels [17]. Owing to an unforeseen escalation in global drought severity, there has been a noticeable surge in recent years in the recognition of the need for drought risk reduction and preparedness [18]. The extent of drought severity is contingent on the duration of prolonged arid conditions over a region and is gauged using diverse index thresholds [19]. Consequently, a comprehensive understanding of both drought severity and vulnerability is indispensable for devising impactful management strategies. Within this context, ‘vulnerability assessment’ emerges as a pivotal component of any drought mitigation scheme, serving as the foundation for identifying affected parties and underlying causes.
Over time, a diverse range of indices has been employed for analysing drought conditions, with their application varying across different regions. Various methods, including temperature, rainfall, vegetation index and soil moisture, have been utilized to model drought scenarios in distinct geographical areas [20,21]. As the nature of drought differs based on climatic conditions in different regions, measurement techniques also vary accordingly [22]. Drought parameters can exhibit both linear and nonlinear relationships with each other [23,24]. The probability density functions (PDFs) of drought indices have successfully demonstrated drought frequency and intensity [25,26,27]. Ref. [28] utilized geometric probability distribution to define drought conditions spanning a specific number of consecutive years with insufficient water supply. Ref. [29] introduced time series analysis and run theory to predict drought occurrences. Ref. [30] employed the Palmer Drought Index (PDI) and stochastic models to characterize the stochastic nature of monthly and yearly drought conditions. Ref. [31] employed probability distribution and relevant equations for forecasting drought duration and average length. Ref. [32] developed distribution functions for the probability of critical drought conditions and predicted their duration. Ref. [30] utilized an alternating renewal reward model for drought event prediction. Ref. [26] used PDSI and an early warning system, applying a non-homogeneous chain model to characterize the stochastic behaviour of draughts. Ref. [33] utilized low-order discrete autoregressive moving average (DARMA) models to estimate drought event probabilities. Ref. [34] applied PDSI in the Conchos River basin of Mexico for drought forecasting. Various aspects of drought, such as severity, intensity and duration, have been predicted in diverse models, employing indices such as the Soil Moisture Index (SMI), Standardized Precipitation Evapo-Transpiration Index (SPEI), Standardized Precipitation Index (SPI), Normalized Difference Vegetation Index (NDVI), and Moisture Adequacy Index [35,36,37,38]. Ref. [29] critically assessed various drought indices and their predictive capabilities, while [27] introduced the Integrated Drought Index (IDI) for drought monitoring and prediction in India. Physically based models utilizing the Palmer Drought Severity Index, ARMA model and pattern recognition techniques have also been utilized to assess and forecast drought vulnerability [39]. These research efforts have contributed valuable models and indices to mitigate the consequences of short-term hydrological and agricultural drought conditions.
A significant volume of research has been dedicated to predicting and forecasting drought conditions in various regions globally [40,41,42] with relatively fewer studies addressing the broader aspect of overall drought vulnerability. Limited efforts have focused on evaluating drought prediction within specific states [43,44]. The state of Odisha, India, is notably susceptible to drought, affecting approximately 50% of its areas [30]. Given this vulnerability and the densely populated nature of the region being heavily reliant on agriculture, assessing drought vulnerability is crucial for effective livelihood management. Notably, studies by [28,31,43] utilized the Analytical Hierarchical Process (AHP) to create drought risk maps, yielding favourable outcomes. However, research specifically focusing on drought vulnerability remains limited.
This study focused on evaluating drought vulnerability in Odisha, India, and considered various factors. The assessment employed a Fuzzy Analytical Hierarchical Process (fuzzy AHP) methodology, effectively producing a drought vulnerability map that logically portrayed the drought vectors. The integration of fuzzification and AHP facilitated the unidirectional representation of factors based on their significance, with AHP assigning essential significance to these factors. The combination of these techniques ensured a logical and scientifically informed assessment, further benefiting from the incorporation of expert opinions crucial for drought vulnerability evaluation. The final model’s validity was verified using Receiver Operating Characteristics (ROC), accuracy, mean absolute error (MAE) and root mean square error (RMSE) metrics. This research contributes valuable insights to academia and agricultural planning, offering a means to mitigate the impact of drought effectively.

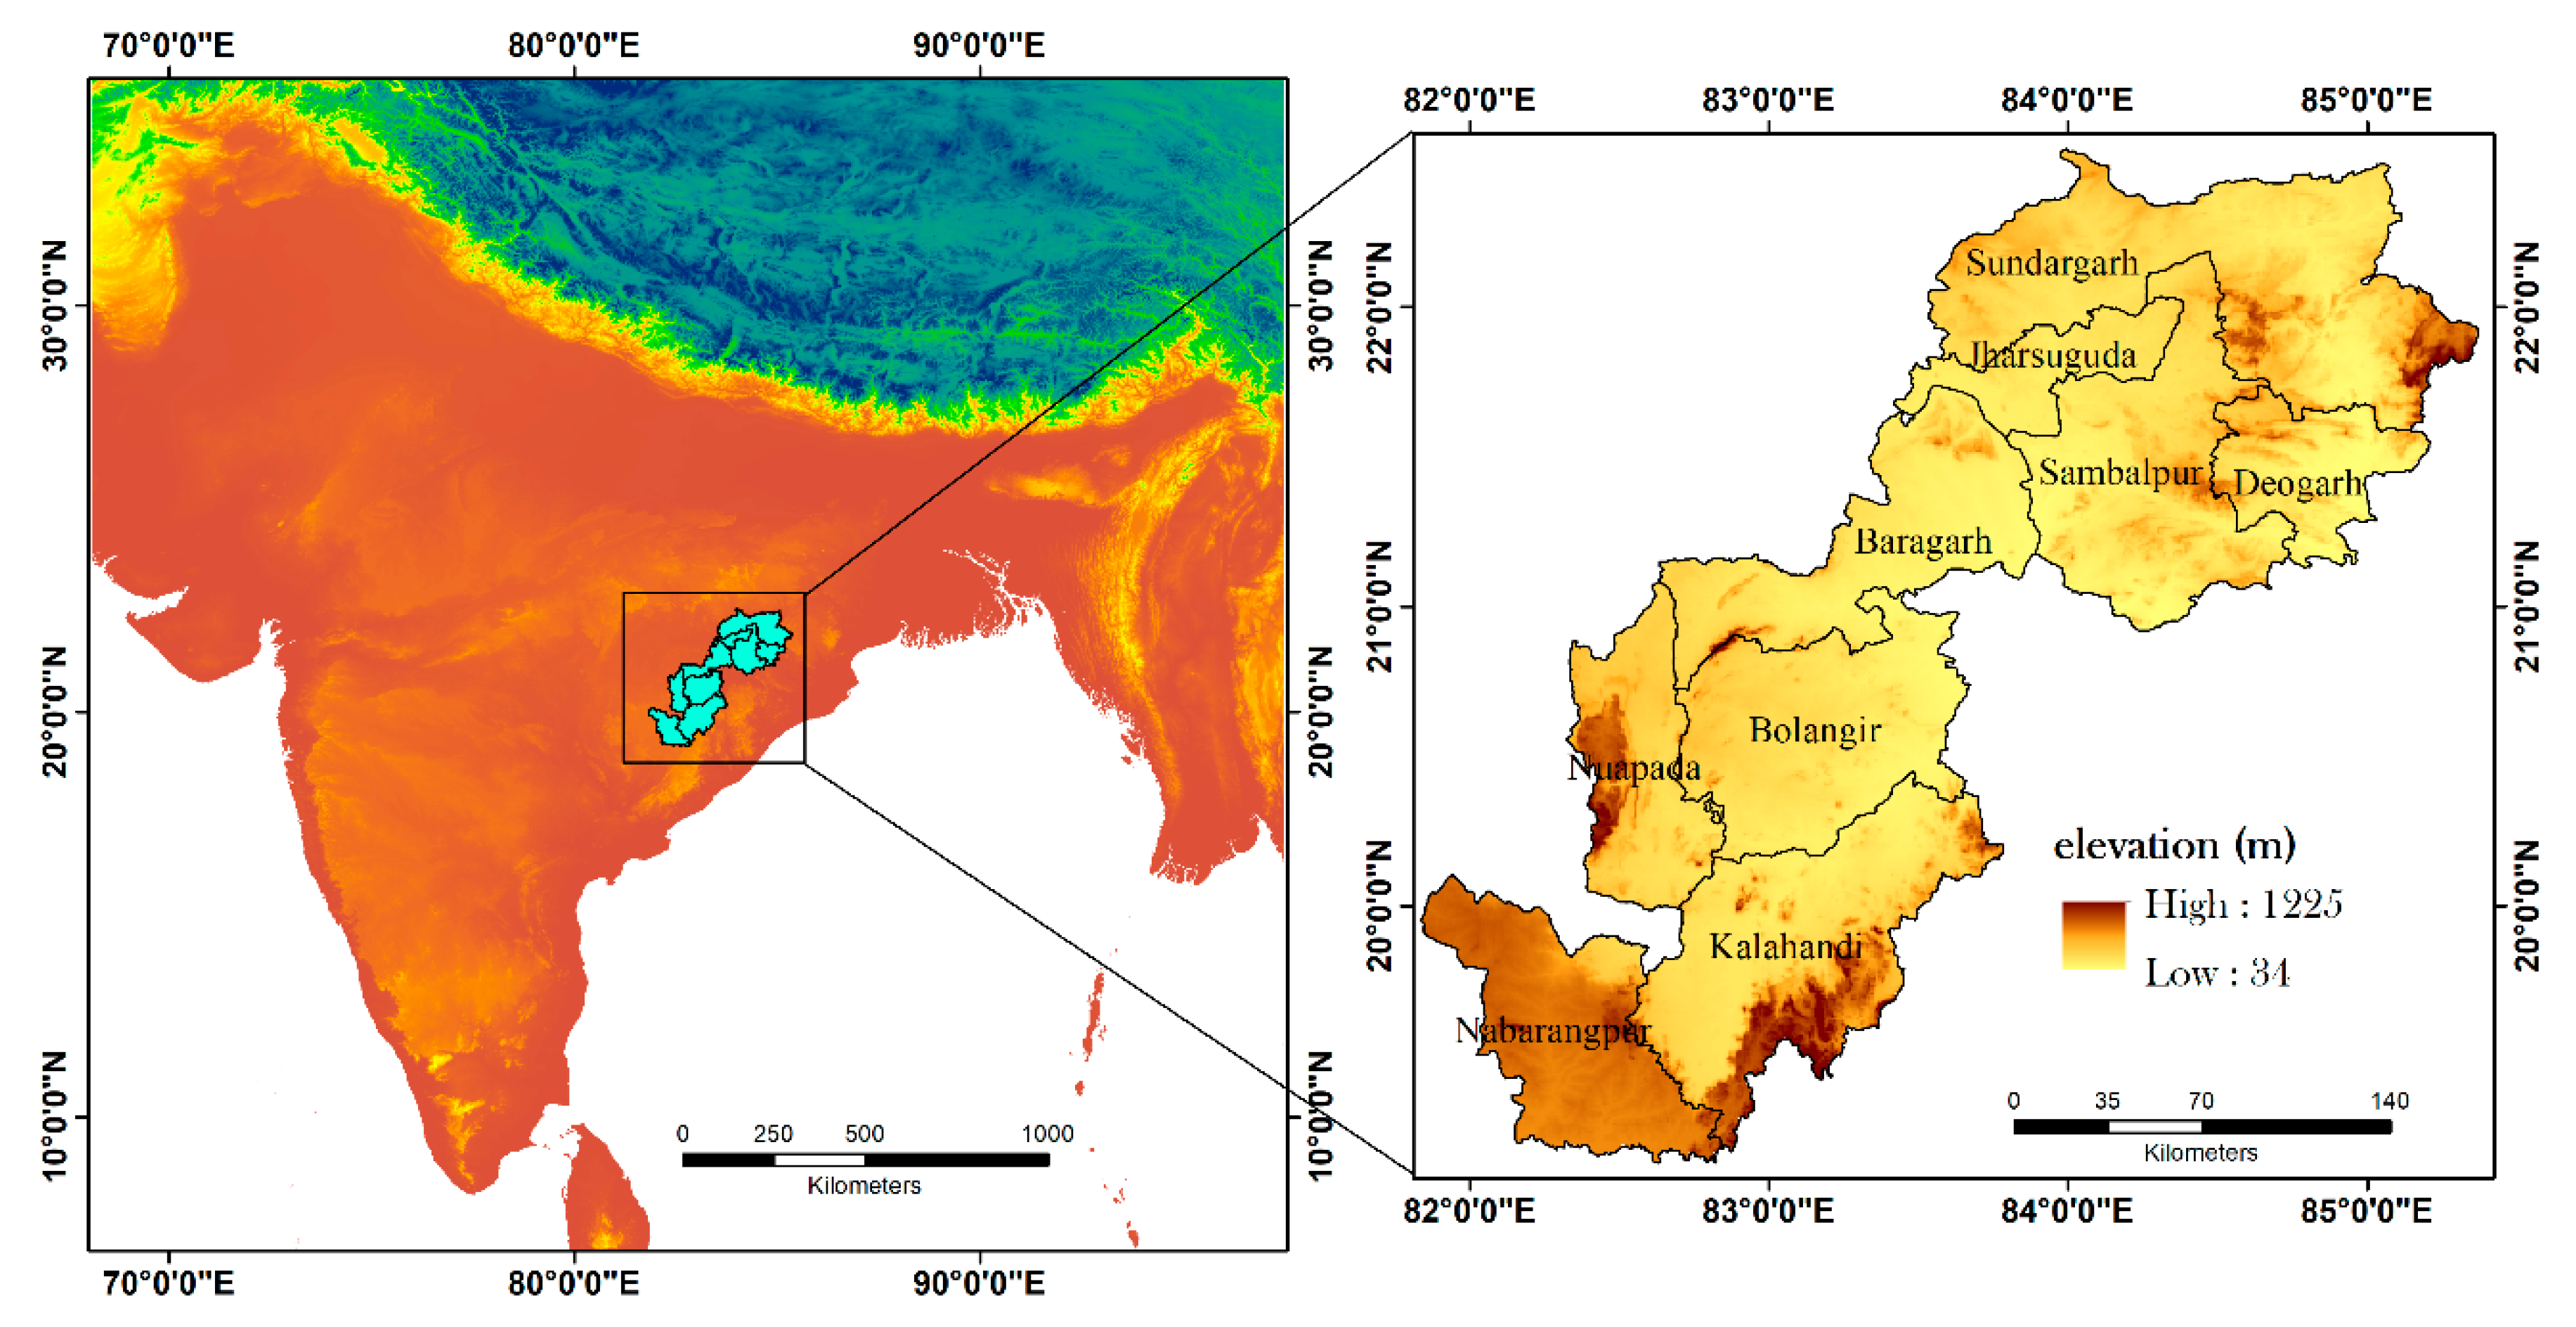
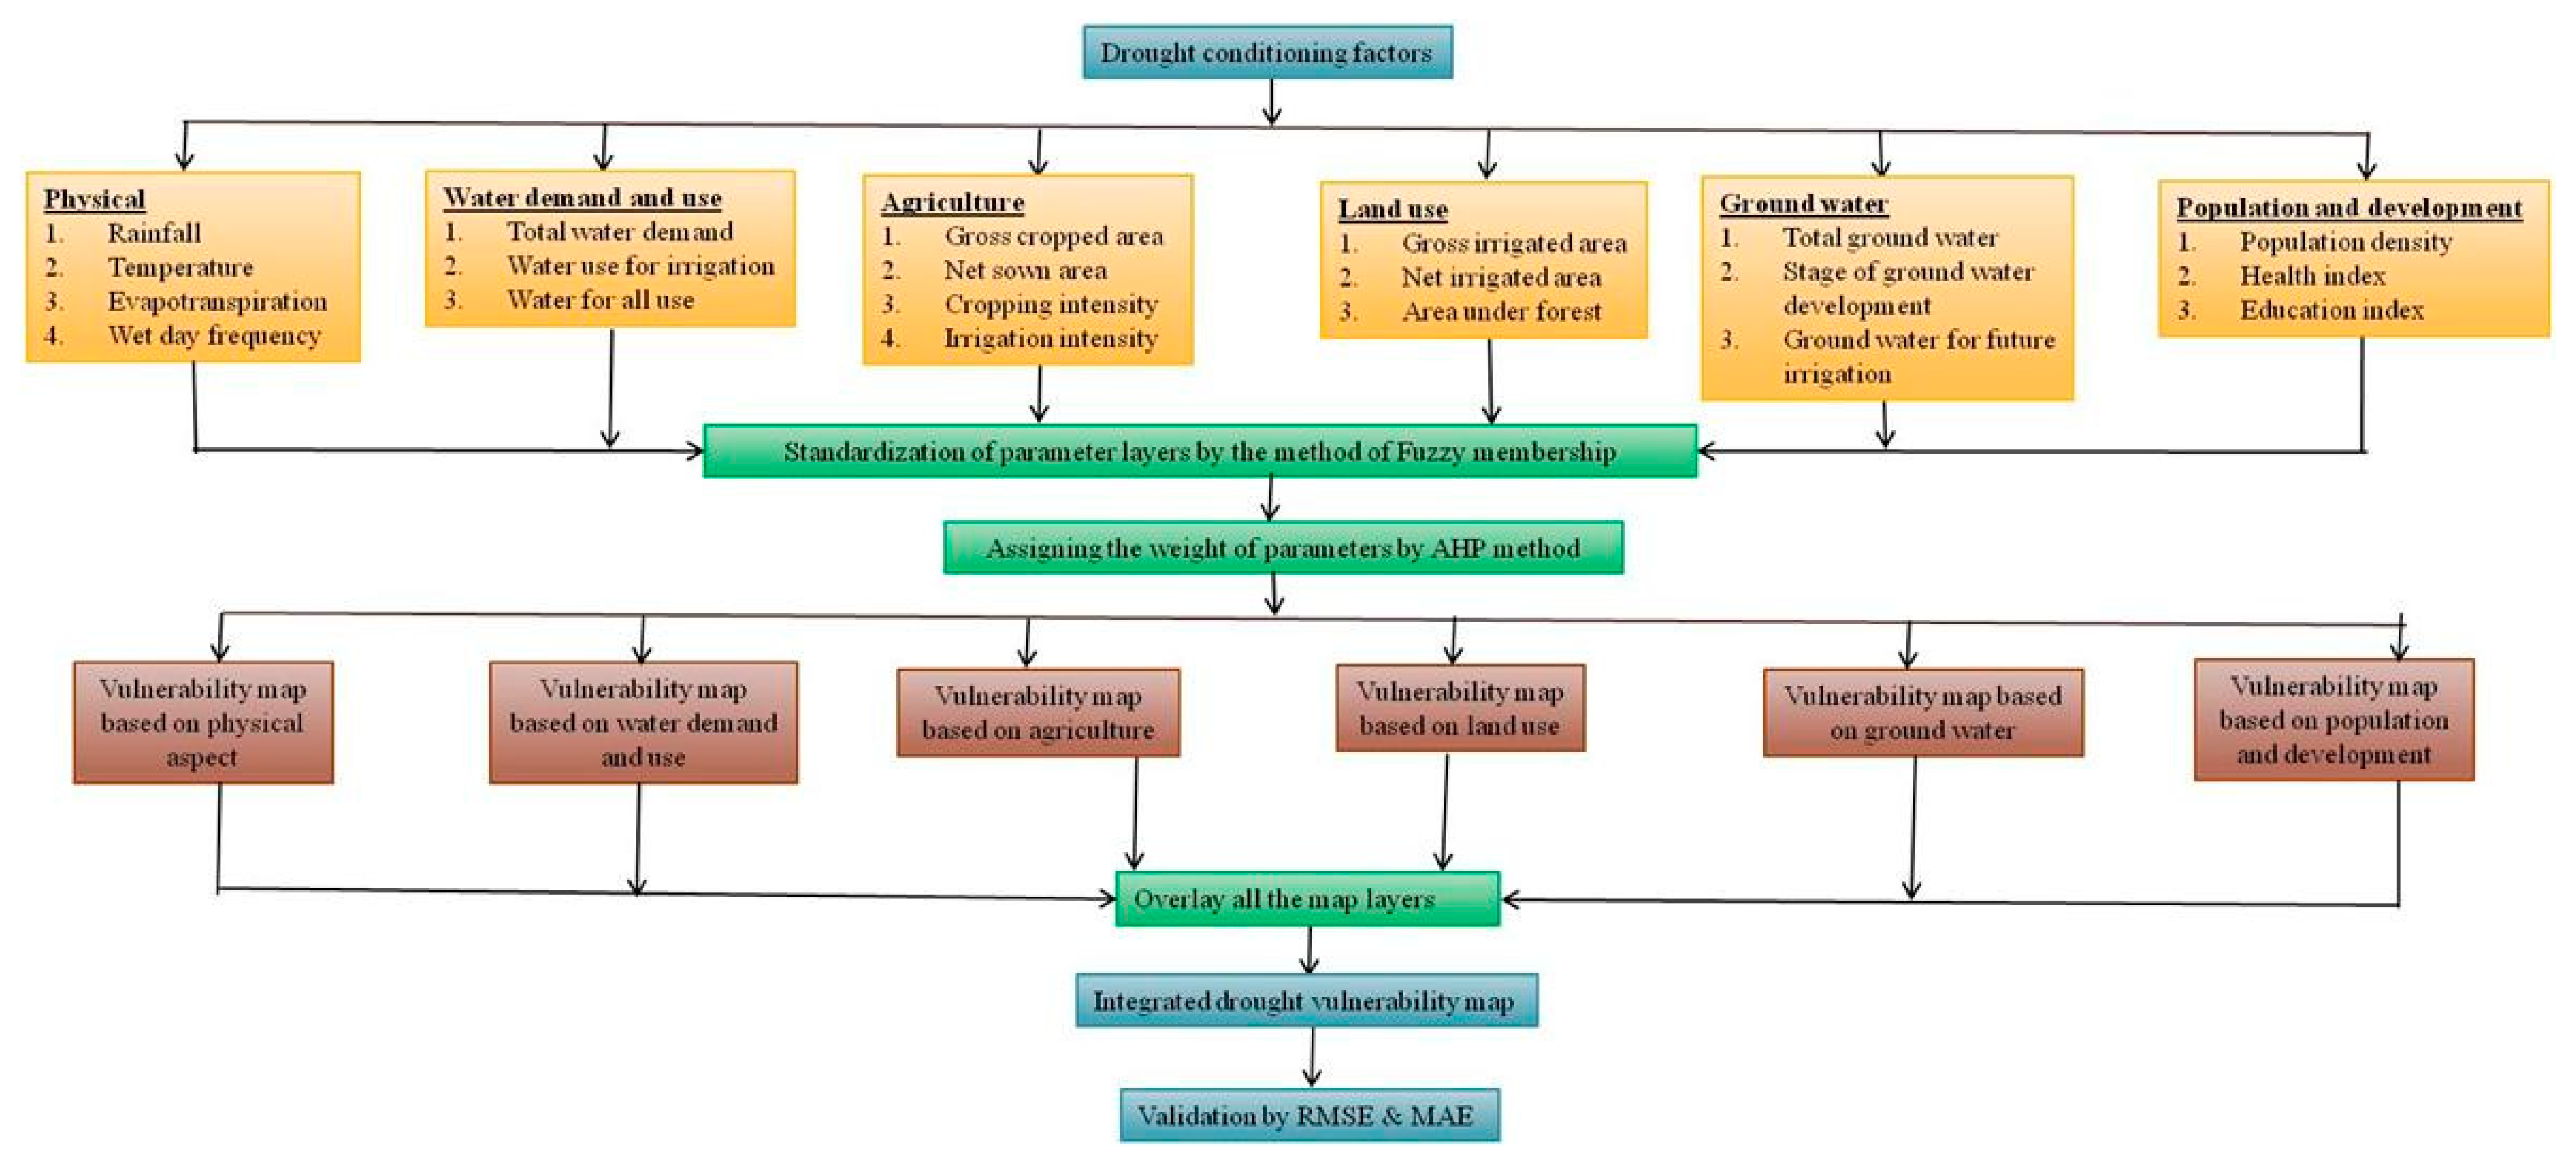
2. Materials and Methods

Odisha is located on the eastern coast of India, from 17.31° N to 22.31° N and from 81.31° E to 81.31° E. (Figure 1). The coastline of 485 km is connected to this state along with the Bay of Bengal. The temperature and humidity of this area are high, and the rainfall is moderate to low in nature, along with mild and brief winters. The climate in this state is tropical, 1451.2 mm of rainfall is the average of this state and rainfall primarily falls from June to September (Figure 2). Several climatic hazards, such as drought, cyclone and flooding, are very frequent in this state and occur every year in this state with varying severity. Five main divisions of physiography are correlated with this province, such as the Utkal plains, central plateaus, central mountains and highlands, western hills and floodplains. Mahanadi, Baitarani and Brahamni are the main rivers of this state which flow into the Bay of Bengal. About 3.47 percent of the population of India belongs to this state, which is 4.2 crores according to the Indian Census (2011). In the case of Odisha, the occurrence of drought is not a new phenomenon, and only the severity and extent of the drought varies from year to year [37]. Extreme drought happened for the first time in Odisha in the year 1866, accompanied by several droughts of mild to severe magnitude, and occurred 17 times so far. This means that there has been a serious drought in Odisha roughly every 8 years. The drought in 2000 and 2001 was the most severe occurrence, along with the other years of drought in 1866, 1919 and 1965. Essentially, the western portion of Odisha is synonymous with drought and the southern central part is also comfortable with drought.

3. Materials and Methods

3.1. Data Used and Their Sources

In this work, parameters from different categories were combined with the use of the fuzzy AHP method after that the final vulnerability map of the drought was created. In this analysis, to establish an ideal vulnerability map, 22 parameters were considered from various sources from different groups. The analysis on the methodological framework is seen in Figure 2. The thematic layers were produced from a variety of sources that were used in this analysis, along with the geospatial technique. The data sources are detailed in Table 1.

3.2. Drought Conditioning Factors

Parameters were considered for this study after analysing some of the previous literature and after checking the reliability and suitability of databases for drought [38]. After analysing some of the previous literature, the test of the efficiency and suitability of the drought databases considered the conditions for this analysis [38]. After that, the spatial layers were formed for each parameter. Under six groups, 22 spatial layers with a resolution of 30 m were created. The method was considered in this analysis for the classification of maps [39]. ArcGIS was used for the mapping of the vulnerability map of the drought in an effective way. The definitions of the other parameters are given in detail below.

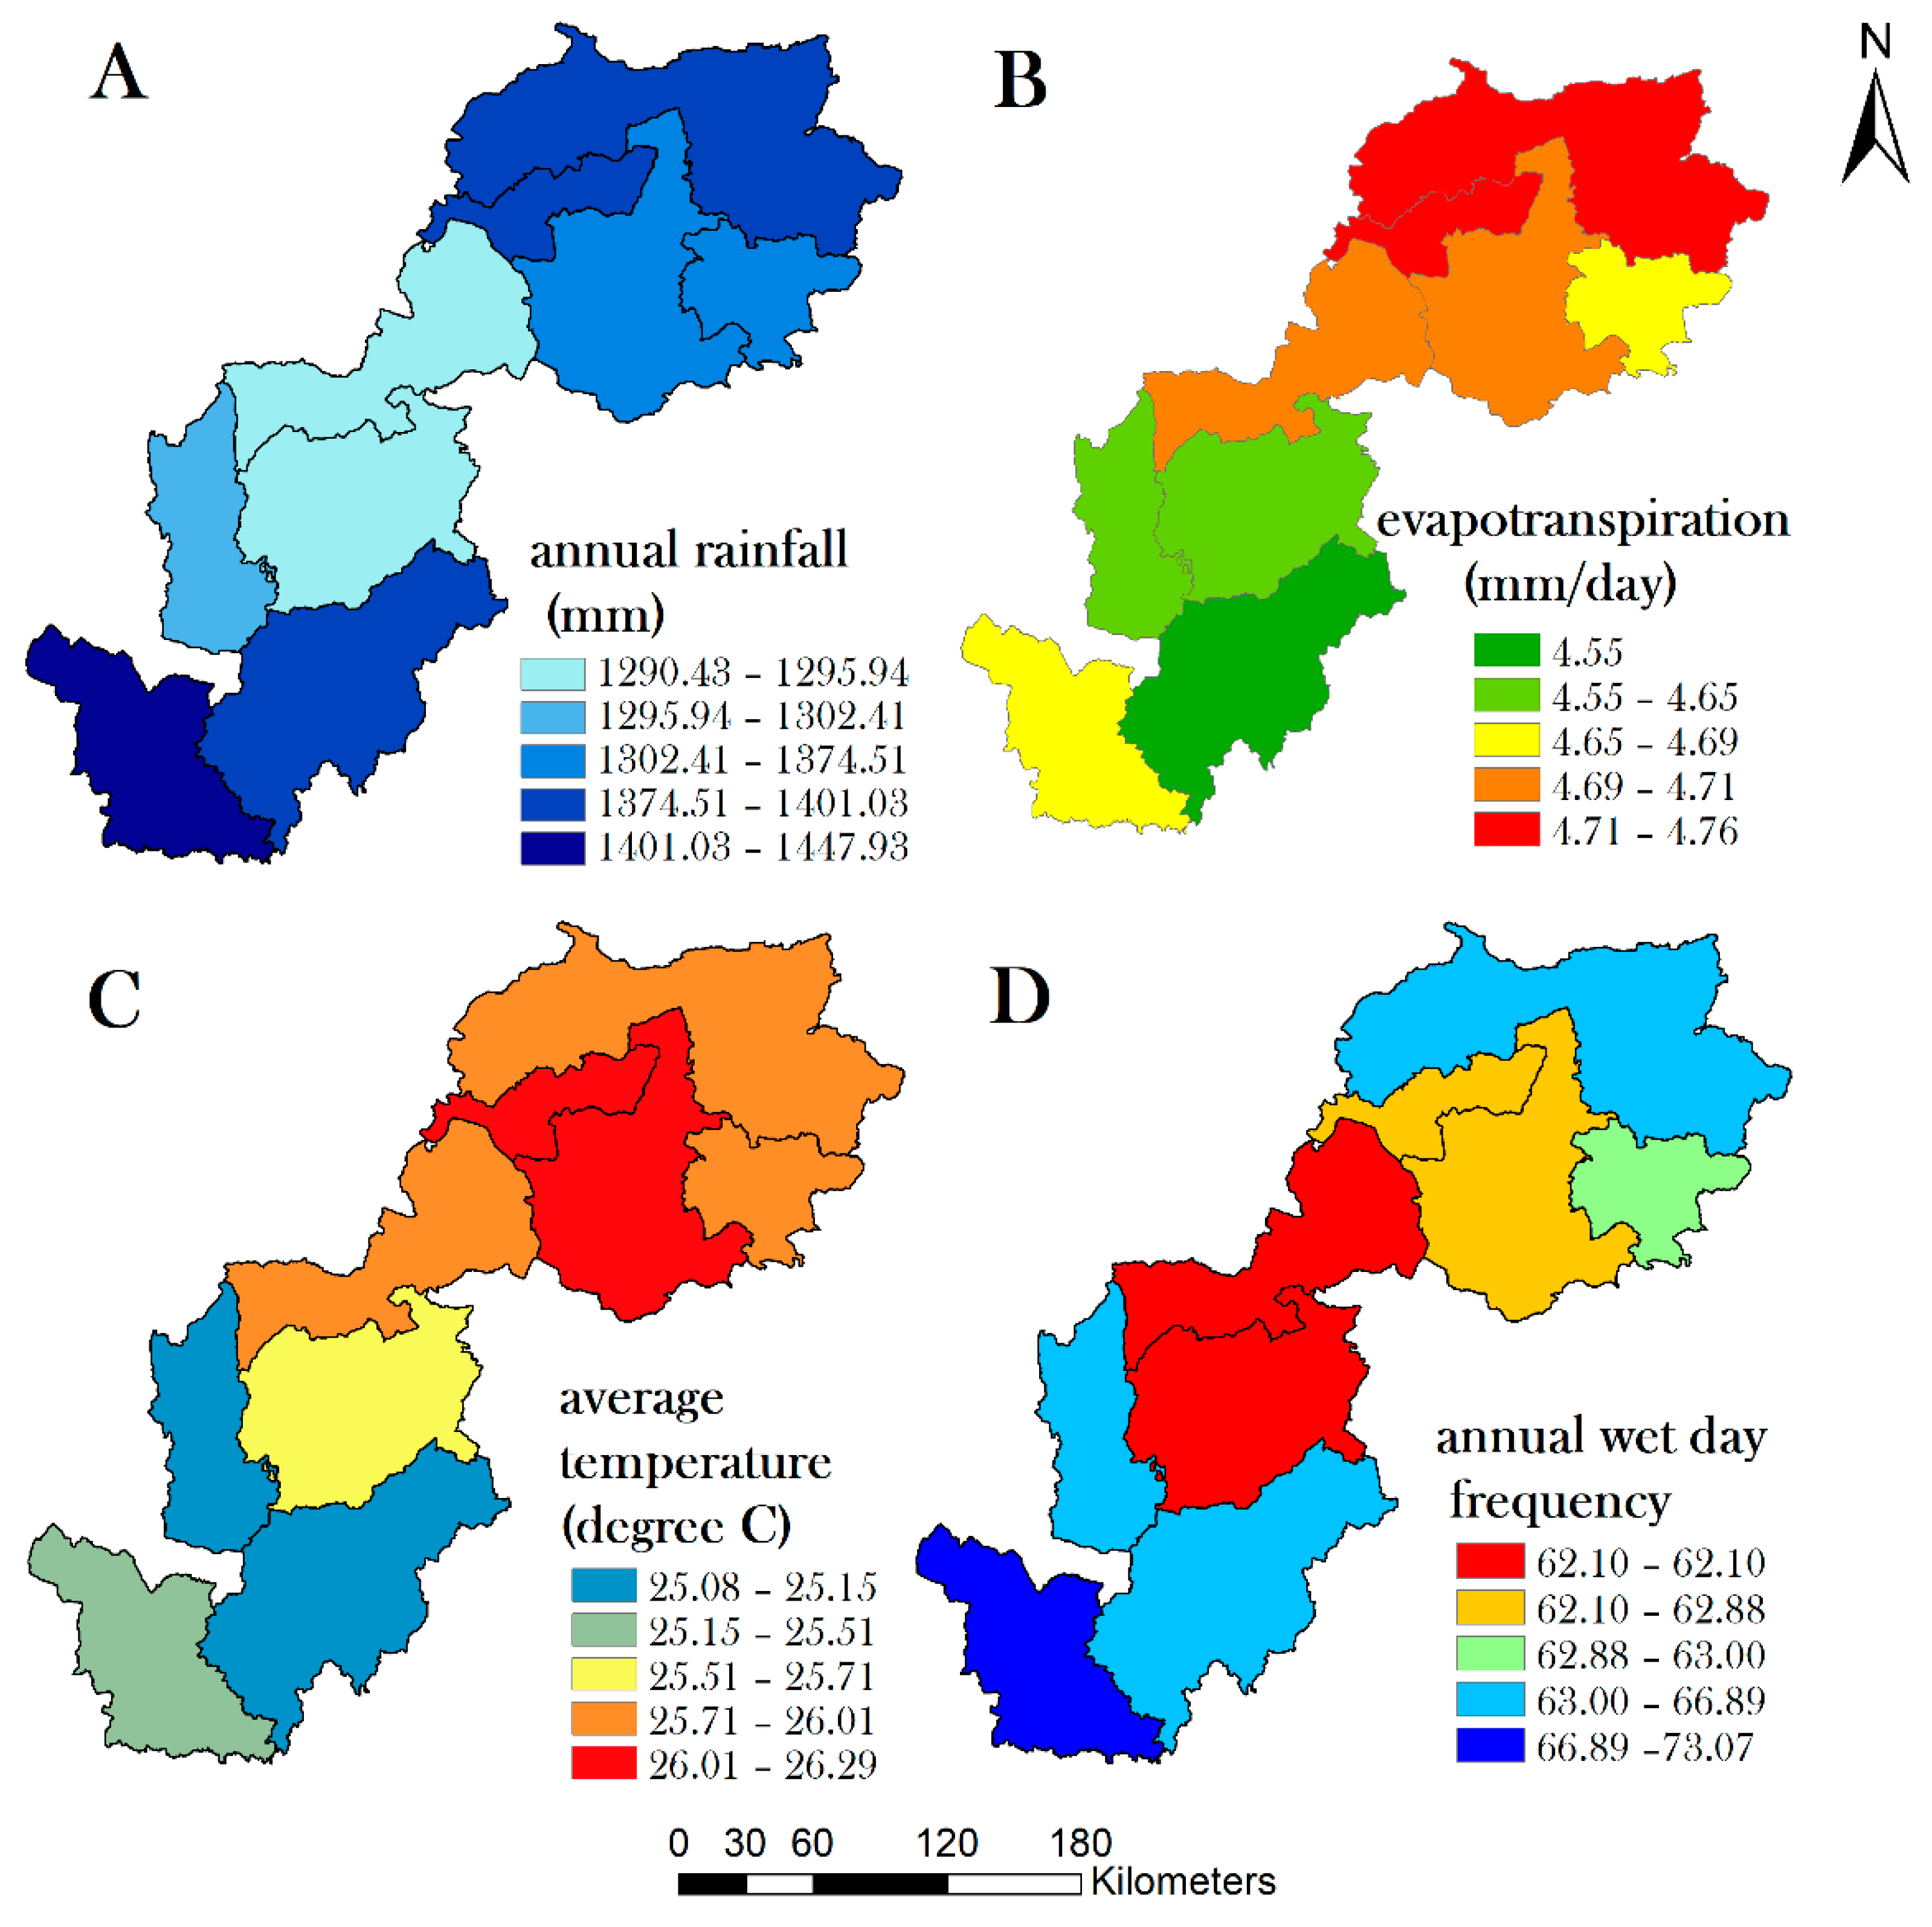
3.2.1. Parameters Used in Physical Drought Vulnerability

With the dry weather scenario, the vulnerability of the physical drought is fundamentally related. Four criteria for the vulnerability mapping of spatial drought were chosen for this analysis, as seen in Figure 3. The selected criteria of the physical drought are below (Figure 3).
Annual rainfall: The relationship between drought and annual rainfall is negative, which means that, with falling rainfall at a given area, the vulnerability of drought will increase [40]. The average annual rainfall was determined by considering the amount of the cumulative monthly rainfall of each district (Table 2).
Wet-day frequency: Frequency of rainy days is also a primary parameter for the mapping of drought vulnerability. Due to the rising number of rainy days, drought levels may decrease [41]. This ensures that more days of rainy weather will avoid a condition of drought.
Evapotranspiration: Evapotranspiration is one of the most important criteria for evaluating the vulnerability of drought [42]. Drought is positively related to this parameter. This means that the growing amount of evapotranspiration would be the source of the more severe drought in a given location [42].
Average temperature: The average temperature is another relevant parameter for assessing the vulnerability of droughts. This parameter is positively related to drought. In the case of an area, if the temperature increases, the drought will also increase with it [43].

3.2.2. Parameters Used in Water Demand and Use-Induced Vulnerability

Total water demand: Evaluating water demand is a fundamental aspect of gauging drought vulnerability. As communities grow and urbanize, strain on water resources increases. During droughts, heightened demand exacerbates scarcity issues, potentially leading to deficits and vulnerability. The correlation between total water demand and drought susceptibility is well-documented and backed by research. Monitoring trends in demand helps anticipate and mitigate drought impacts. For a growing amount of water demand in a given region, the drought would rise. The overall water demand is the most significant factor in the vulnerability of drought and is directly linked to drought conditions [44]. Water demand data was obtained from the 2016 groundwater booklet.
Water used for irrigation: Agriculture, especially in countries like India, is a major water consumer. Irrigation is crucial for food production, and water scarcity during droughts can lead to crop failures, food insecurity and economic losses. Considering water used for irrigation provides insights into a drought’s potential impact on agriculture and food security. Therefore, the water used for irrigation purposes is a very responsible parameter (Figure 4).
Water for all use: Comprehensive drought vulnerability assessment must include residential, agricultural, industrial and livestock water needs. When demand exceeds supply, challenges arise, particularly in droughts. Inadequate residential water affects health, and diverse uses highlight societal and economic implications. Incorporating all water needs provides a holistic understanding of drought effects. Data for various uses is obtained from the 2016 groundwater report (Figure 4).

3.2.3. Parameters Used in Agricultural Component-Induced Vulnerability

Irrigation intensity: The region with higher irrigation intensity is severely impacted by drought, as the demand for water in these areas is strong. As a result, the higher the irrigation intensity, the higher the chances of drought occurrences. The net and gross irrigated area of the state are 143.92 lakh. ha and 217 lakh ha. respectively (Figure 5).
Gross cropped area: Gross cropped area is one of the most significant factors for the drought-induced agricultural component. The relationship between this aspect and the drought is positive, i.e., the drought conditions will rise with a significant volume of gross cropped area. The crop yield per unit area of the state is approximately 26.09 tons per hectare.
Net sown area: Another important consideration for the estimation of the drought is the net sown area. The drought’s state is also positively related to this parameter. Drought conditions would certainly impact the region with a huge volume of crops.
Cropping intensity: Essentially, the crop intensity is determined by the ratio of the gross area to the net area of the crop. Agriculture production can be improved by increasing the crop intensity [45]. Thus, the relationship between drought and this element is positive.

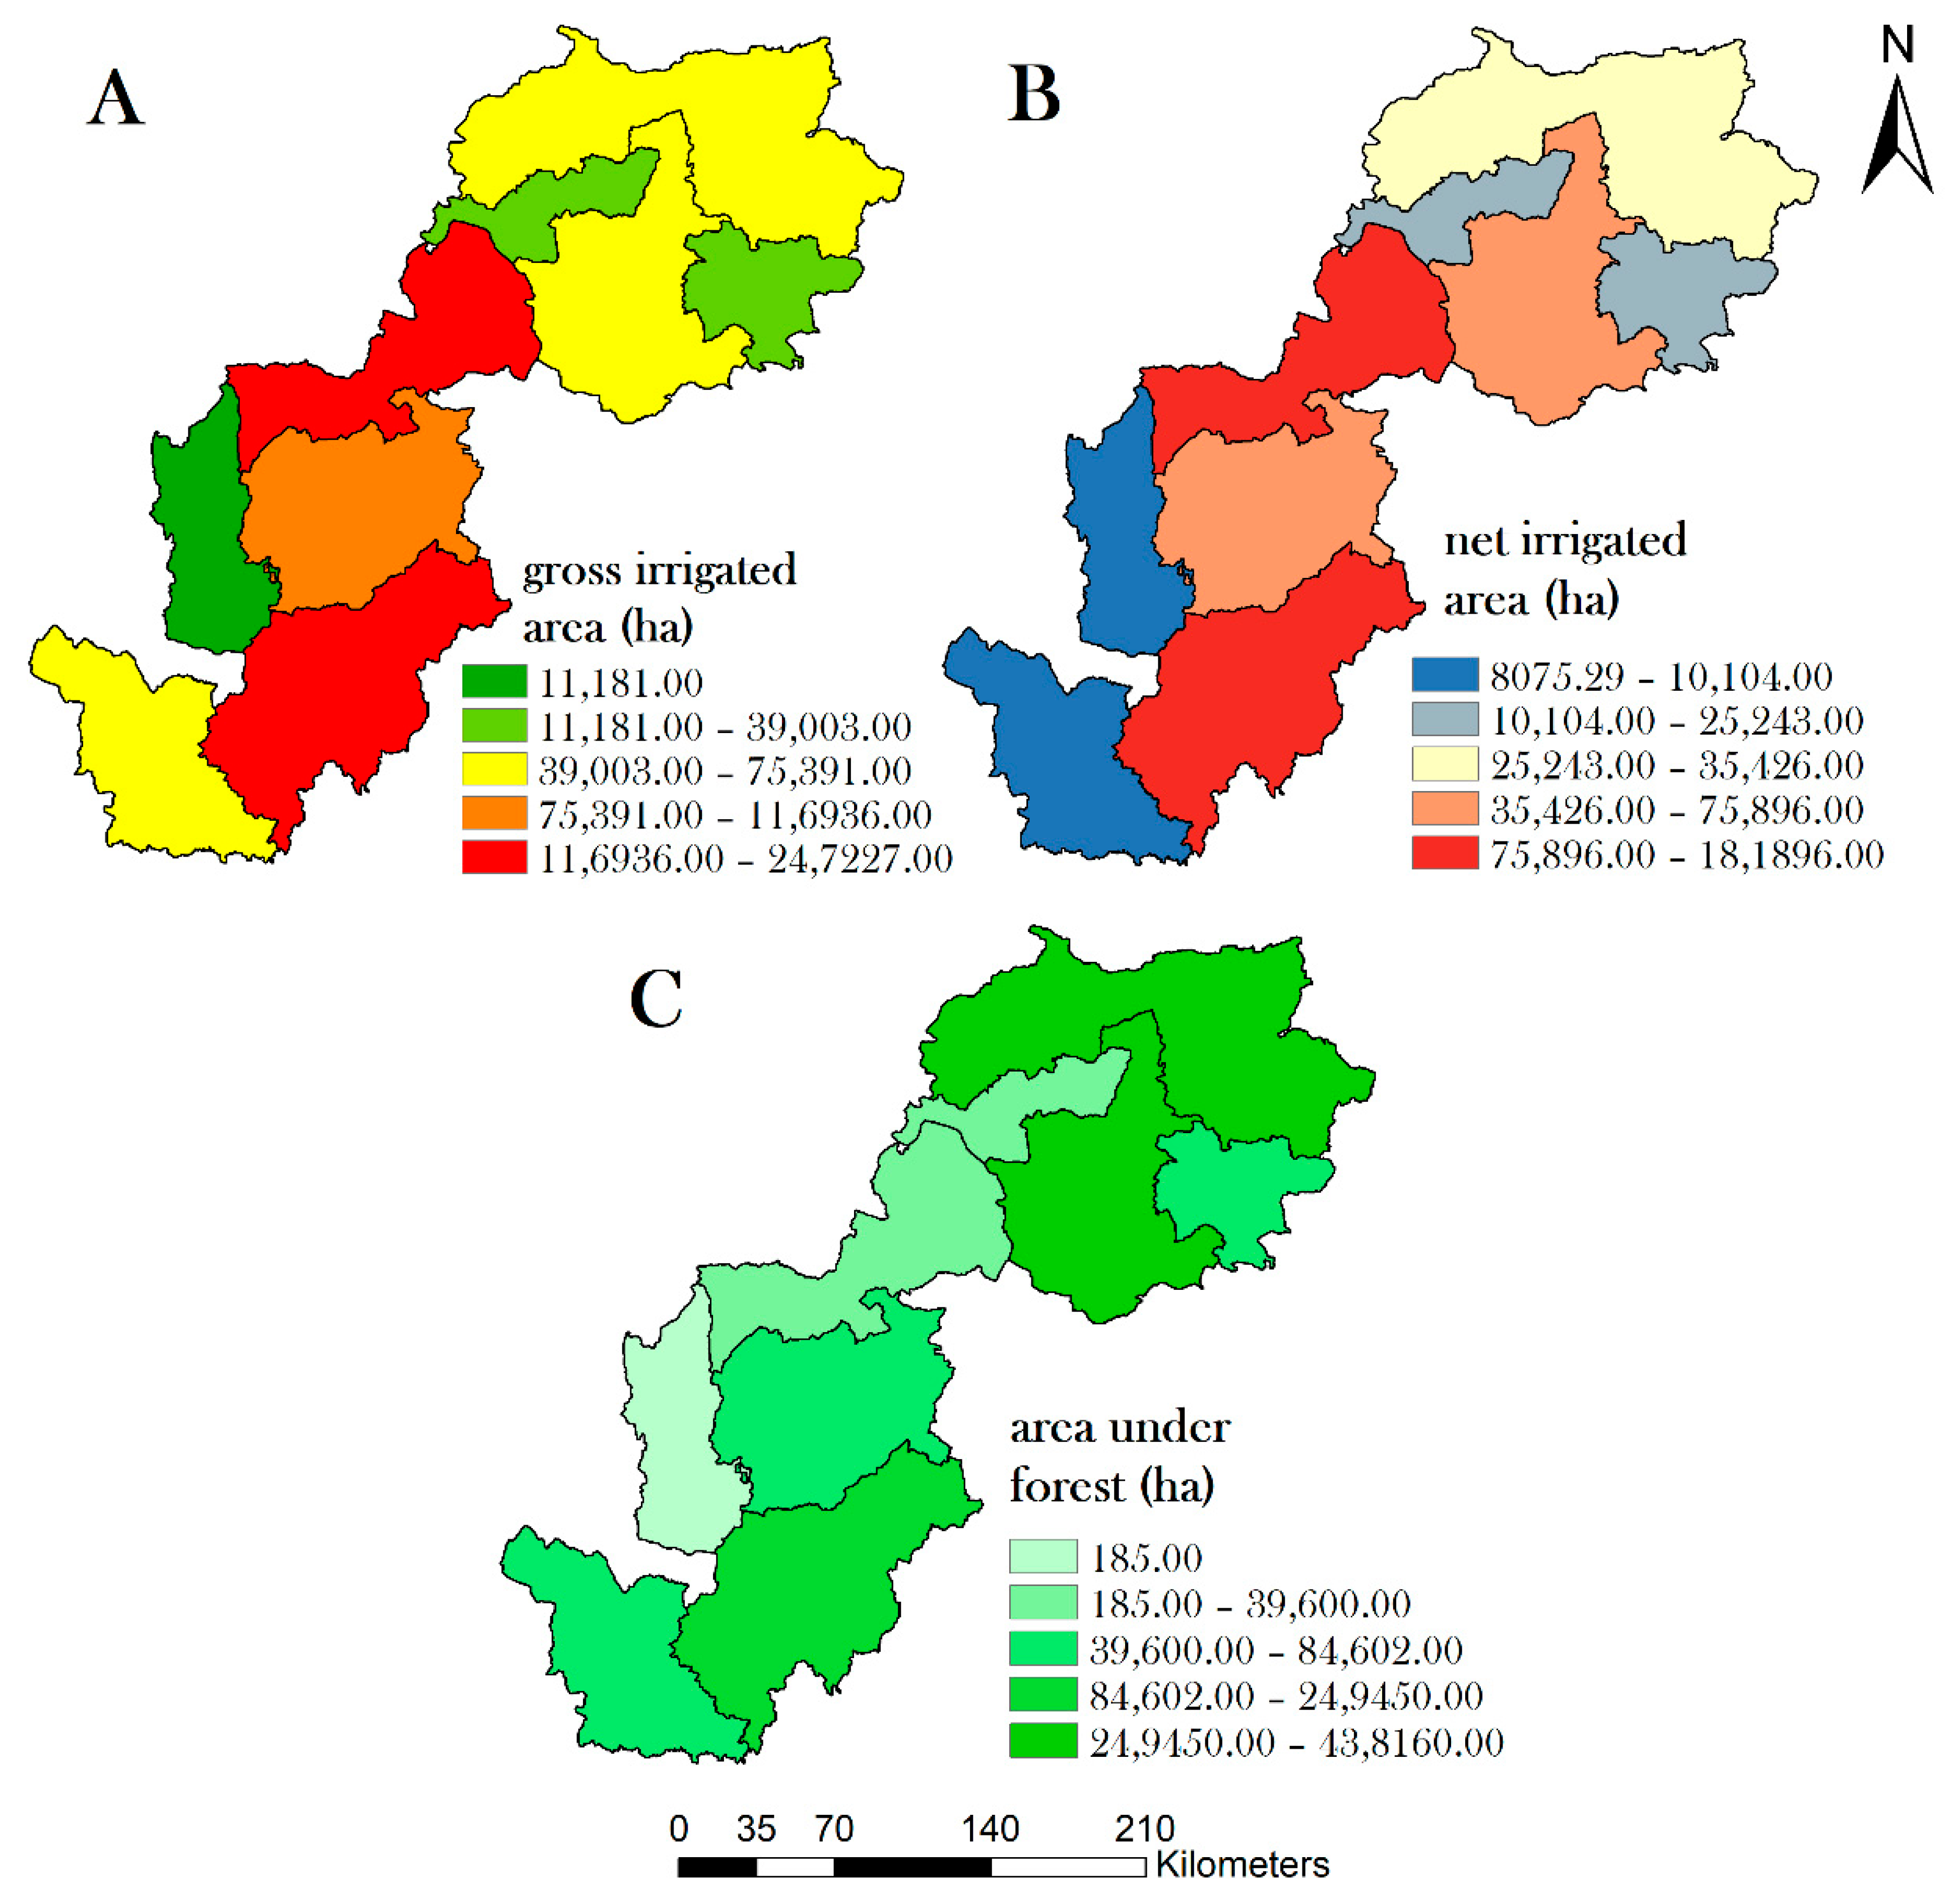
3.2.4. Parameters Used in Land Use-Induced Vulnerability

Gross irrigated area: Gross irrigated area is expressed as a total area under crops which is irrigated once or more. In this situation, the number of times the areas are harvested in a single year is considered most. With a growing amount of gross cropped area, the risk for drought could increase.
Net irrigated area: This is defined by the region that is irrigated by every source for a specific crop once a year. With this parameter, the relationship is also direct and considered to be a critical parameter for drought (Figure 6).
Area under forests: Forests are one of the most significant factors in protecting an area from drought. If the number of trees is high, the drought will decrease. This means that a greater forest area will protect a region from drought. Therefore, it is considered to be a critical parameter in this case. Increased forest cover diminishes drought vulnerability through improved soil moisture retention, microclimate regulation, sustained groundwater levels and enhanced evapotranspiration. This synergy effectively alleviates water scarcity and mitigates the adverse effects of drought.

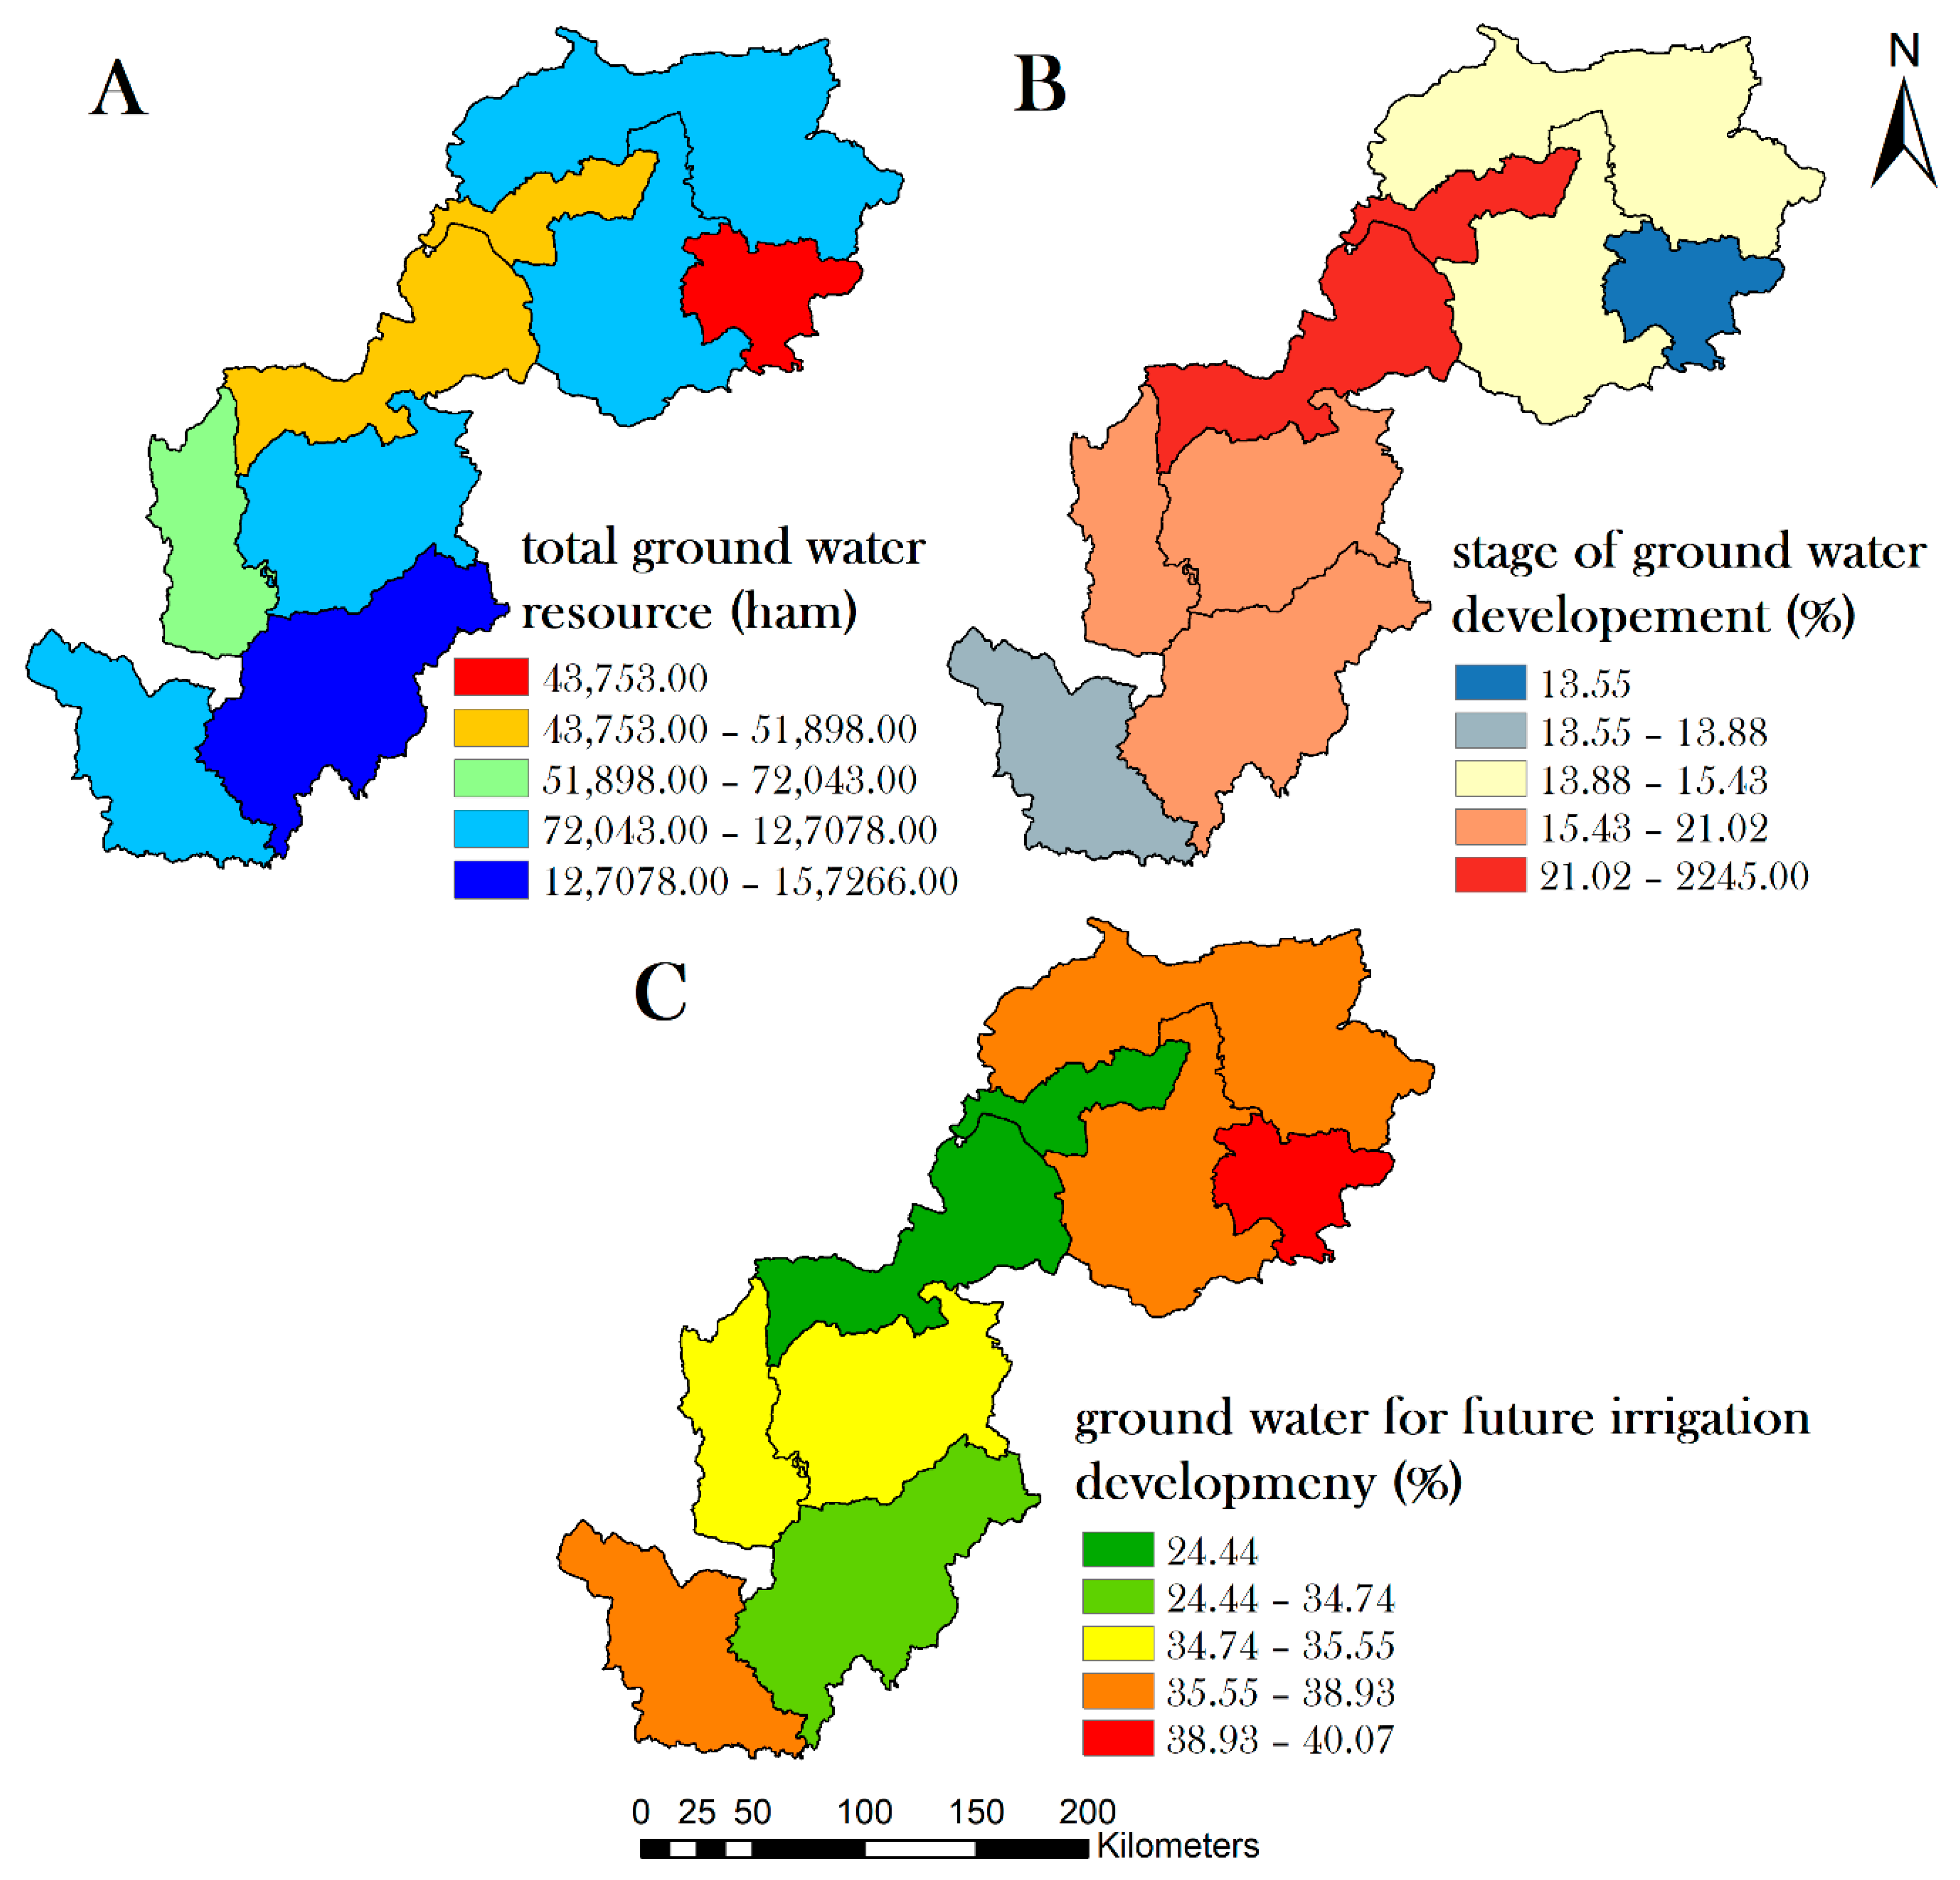
3.2.5. Parameters Used in Ground Water Status-Induced Vulnerability

Total ground water: Ground water is one of the most important factors that can save an area from droughts. Groundwater plays a key role in avoiding drought. Therefore, the association with this element for drought is negative (Figure 7).
Stage of ground water development: This is the ratio of annual ground water withdrawal and the proportion of total annual ground water supply. The relationship between drought and this parameter is positive. The rise in the percentage of this parameter would increase the level of drought.
Ground water for future irrigation: If the volume of water for potential use is adequate for a given area, it is believed that the region will not suffer from situations such as drought. Similarly, if ground water is adequate for potential irrigation in a given region, the drought would undoubtedly decrease.

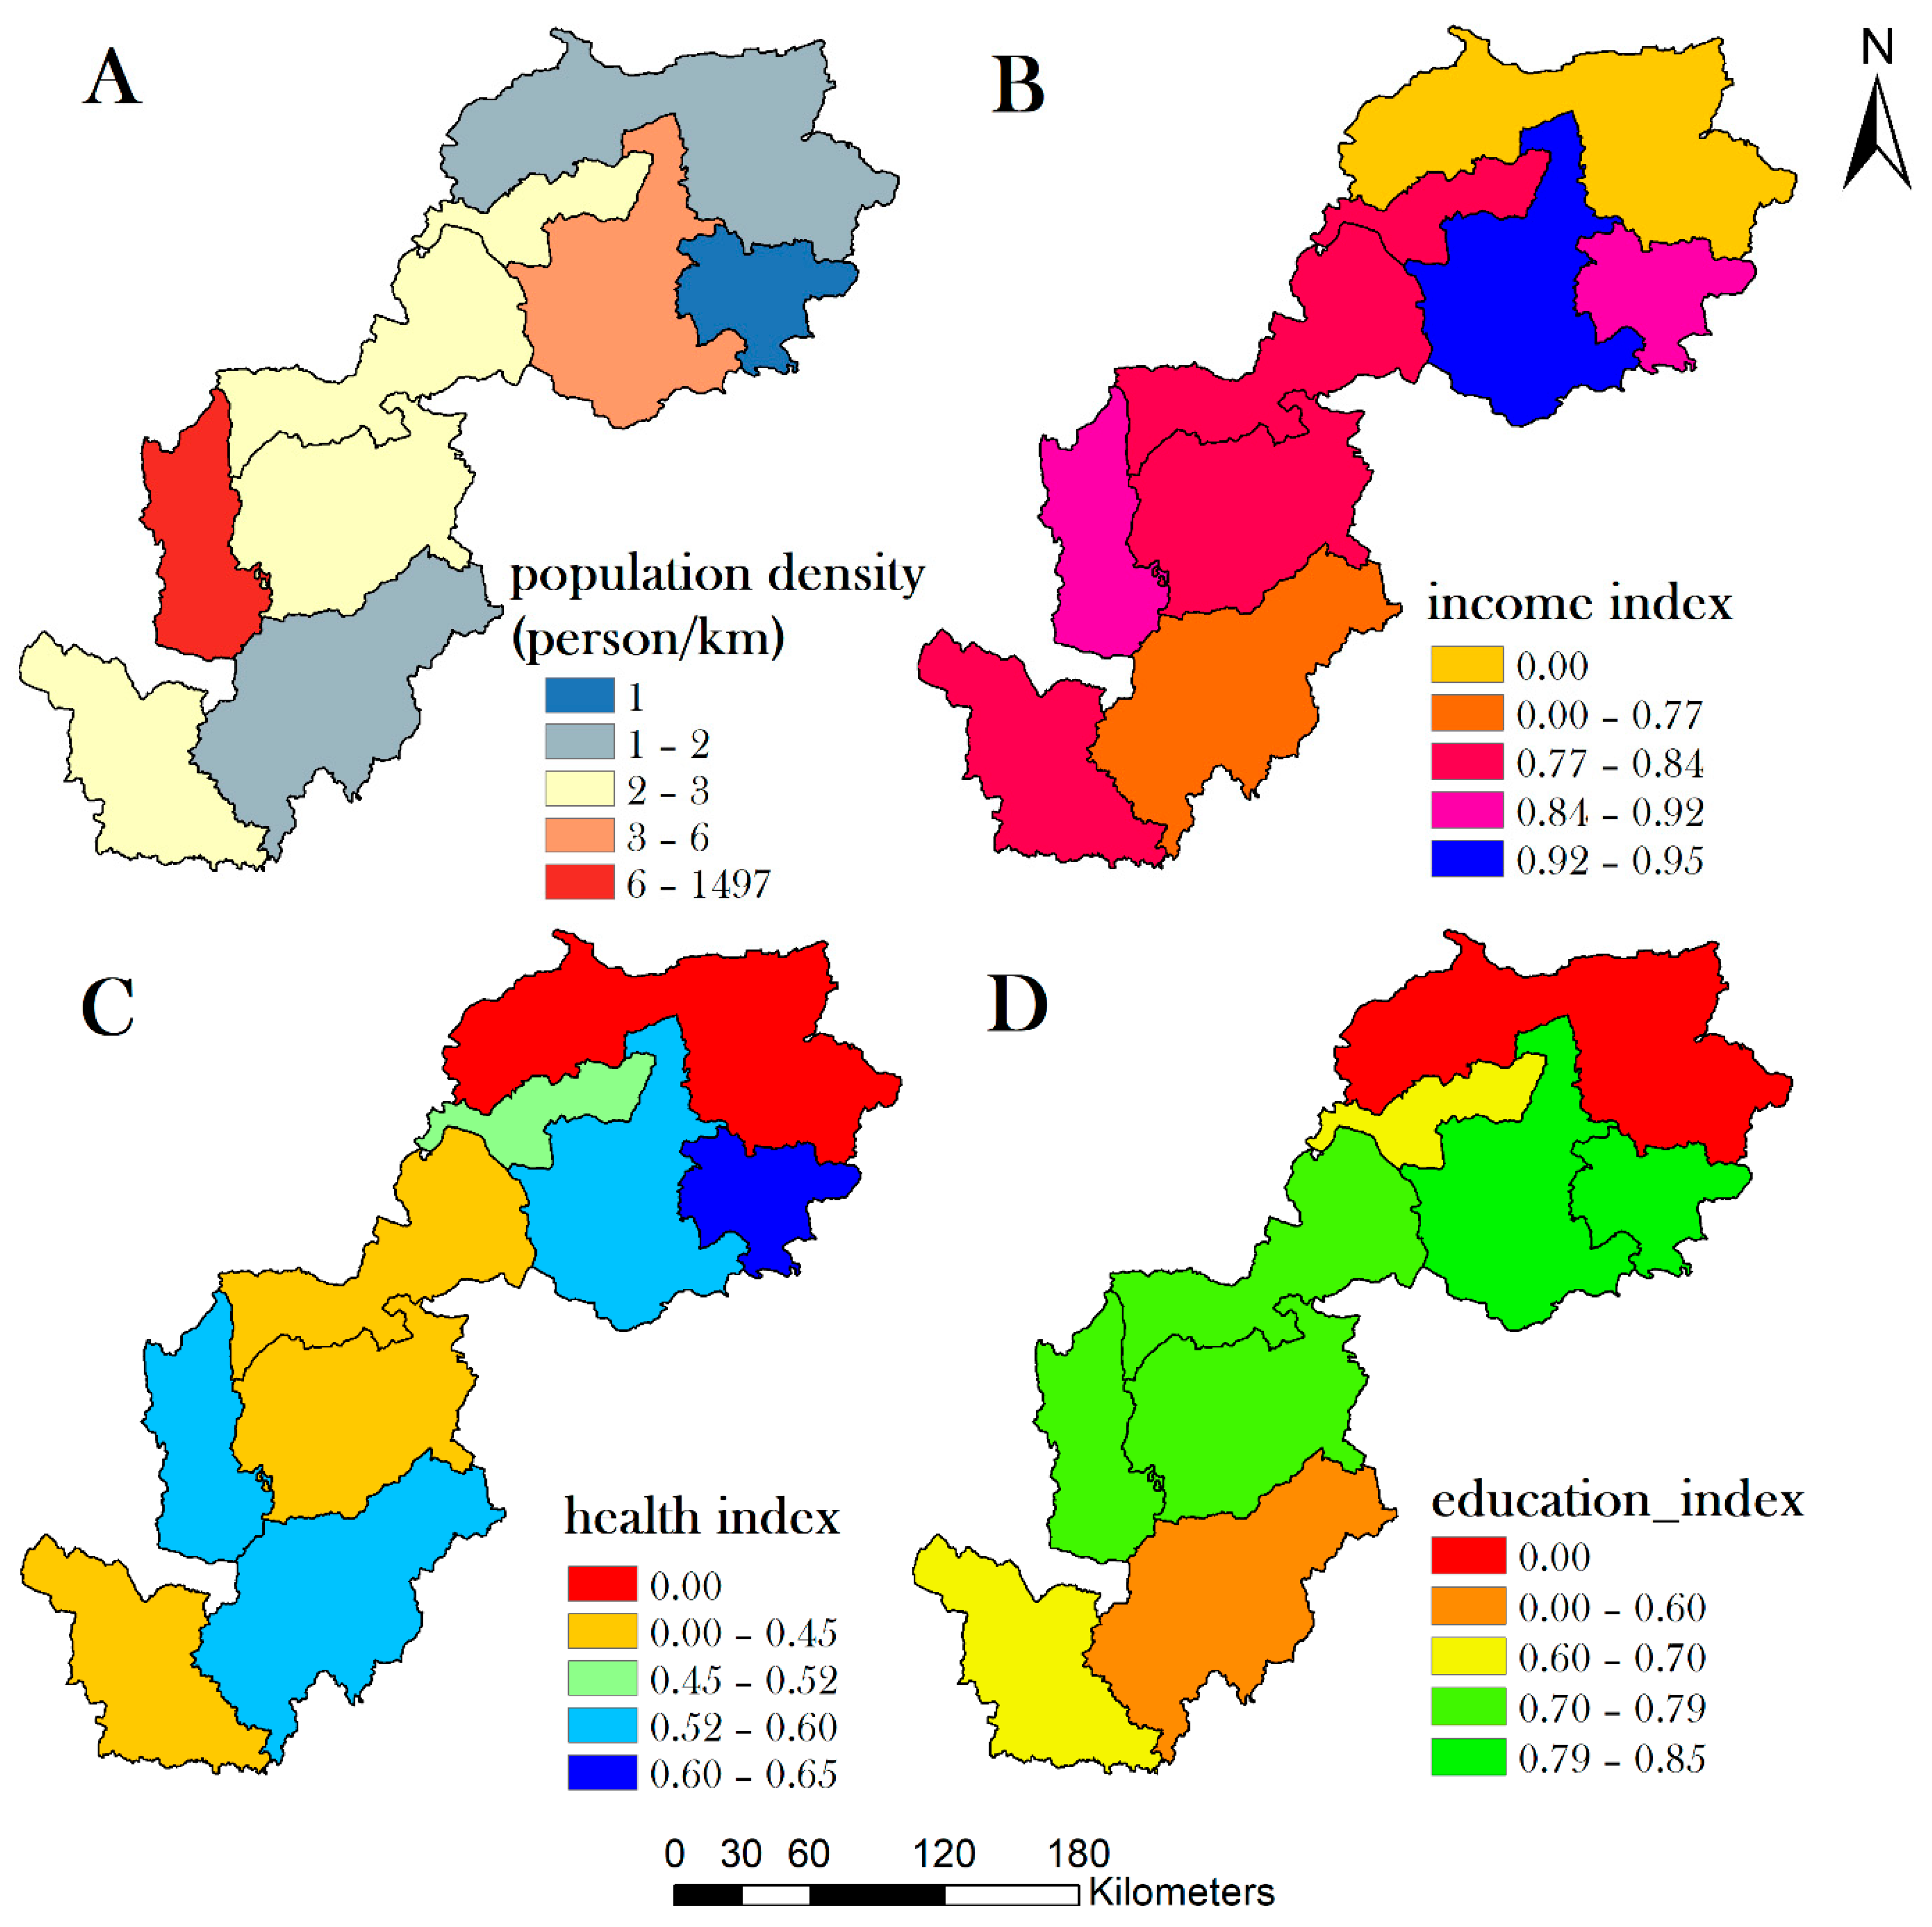
3.2.6. Parameters Used in Population- and Development-Induced Vulnerability

Population density: Population growth would certainly have an effect on the area due to factors such as drought [46]. Since the population is rising, more water will be required to satisfy the need for water. The relationship of drought duration to this factor is also positive, and a significant amount of people will be affected by it (Figure 8).
Health: Drought is very much reliant on the state of local residents. If the health state of a certain area is strong, they would be more likely to deal with a drought crisis. As a result, drought vulnerability is adversely linked to this.
Education: Similarly to the health status of residential residents, if the education level is high in a particular region, they will also be protected from being vulnerable to drought; hence, they are likely to be more aware of drought conditions.
Income Index: With a high number of resources, people can battle the drought crisis and they can adopt a precarious situation more effectively with high incomes and creative strategies.
Table 2. Reason behind the consideration of drought conditioning factors for drought vulnerability modelling.
FactorsCauses of Selecting the Parameters References
Annual rainfallWith higher rainfall the vulnerability of drought will decrease.[47]
Average temperatureHigher average temperature will enhance the drought condition.[48]
EvapotranspirationAspects have a severe impact on the landslide owing to the intense heat of the sun.[49]
Wet day frequencyWith the rising frequency of wet day, the drought will reduce.[50]
Total water demand The drought condition will increase by more water demand.[51]
Water use for irrigationThe demand of water for irrigation will increase the drought.[52]
Water for all useFor the more demand of water, the dryness is increased.[53]
Gross cropped areaHigher gross cropped area means more vulnerable to drought.[54]
Cropping intensityHigh intensity increases the severity of drought[45]
Irrigation intensityMore water demand for irrigation means increasing amount of drought.[55]
Gross irrigated areaLarger amount of gross cropped area will accelerate the condition of drought.[54]
Net irrigated areaWith the increasing amount of net irrigated area, the drought will enhance.[56]
Area under forestDrought will accelerate by decreasing amount of area under forest cover.[56]
Total ground waterSufficient amount of ground water reduces the drought vulnerability.[57]
Stage of ground water developmentWith the increasing percentage of this parameter drought will increase.[58]
Ground water for future irrigationLess ground water for future irrigation means a greater number of droughts.[57]
Population densityIncreasing number of people will increase drought.[46]
HealthGood health condition reduced drought situation.[59]
Education High level of education can prevent a region from drought condition.[60]
Income indexHigher income level can decrease the number of droughts of a region.[8]

3.3. Application of Fuzzy AHP

In 1980, Saaty developed the theory of fuzzy AHP [61]. In this theory, the fuzzy hypothesis applies to the AHP system. The AHP approach is essentially used for decision-making purposes for the use of multi-criteria layers. This approach is correlated with a pair of wise analysis of the different solutions according to a variety of criteria and the weighting judgment. The complexity for each choice is not included in the AHP, but the fuzzy approach addresses this problem. The weights of the directional parameters were calculated by the fuzzy AHP method, which allows a better approach to the problem of multi-criteria decision-making.
The Fuzzy Analytic Hierarchy Process (fuzzy AHP) method presents a significant advancement in the field of drought vulnerability assessment by effectively addressing the inherent uncertainties and complexities associated with the assessment process. This innovative approach integrates the AHP framework with fuzzy logic, allowing for the incorporation of subjective judgments and imprecise data in a systematic manner. By accommodating vagueness and ambiguity, the fuzzy AHP method enables a more comprehensive and accurate evaluation of drought vulnerability, considering multiple criteria and their interdependencies. This enhances the robustness and reliability of the assessment, making it a valuable tool for policymakers, researchers, and practitioners in devising targeted and adaptive strategies to mitigate drought impacts and enhance resilience in water-scarce regions.
The first use of the fuzzy AHP approach is identified with [62]. They have addressed the functions of triangular membership for the purpose of pair-wise comparison. By defining the priorities of fuzzy, Buckley applied a new theme to the triangular functions in 1985 [63]. However, to determine comparative weights of significance, a variety of techniques were applied to the fuzzy AHP method for both instances (general and replacement). The method provided by Buckley has been used in our research. The fuzzy AHP approach is discussed below.
Stage 1 decision makers compare or replace parameters in a linguistic manner as seen in Table 3. For example, if the value of parameter 1 is perceived to be less than that of parameter 2 by the decision-maker, then it is considered on a fuzzy triangular scale (2, 3, 4). Alternatively, (1/4, 1/3, 1/2) would be the fuzzy triangular scale for the relationship between C2 and C1 in the contribution matrices (pair-wise) of the layers [64]. The matrix of the pair-wise contribution is shown in Equation (1) where the superiority of the kth decision-maker of the ith parameter over the jth criteria has been indicated using the fuzzy triangular numbers, the first choice of the decision-maker for the first parameter is indicated by d ~ 112, which is d ~ 112 = (2, 3, 4).
d ˜ k d ˜ 11 k d ˜ 12 k d ˜ 1 n k d ˜ 21 k d ˜ 2 n k d ˜ n 1 k d ˜ n 2 k d ˜ m n k
Stage 2 in any case, if the number of the decision-maker is greater than one, the average major concern for each decision-maker is accepted and the estimate is seen in Equation (2).
d ˜ i j = k = 1 K d ˜ i j k K
Stage 3 there has been a transition in the pair-wise matrix which is steady with the mean priorities seen in Equation (3).
A ˜ = d ˜ 11 d ˜ 1 n d ˜ n 1 d ˜ n n
Stage 4 for each criterion, the identification of the geometric mean of fuzzy comparative values shall take place as per Buckley and using Equation (4). Here, the triangular values are also represented.
r ˜ i = j = 1 n d ˜ i j 1 / n , i = 1 , 2 , , n
Stage 5 the fuzzy weight of every criterion could be estimated by using Equation (5) after combining the 3 sub-steps below:
(i) Estimate the vector summation of every r ˜ i ;
(ii) Discover the (−1) power of summative vector. Transform the fuzzy triangular number to enhance it;
(iii) To obtain the fuzzy weight of i ( w ˜ i ) i parameter multiply each r ˜ i with this reverse function that follows.
w ˜ i = r ˜ i ( r ˜ 1 r ˜ 2 r ˜ n ) 1 = ( l w i , m w i , u w i )
Stage 6 using the Chou and Chang method, it is important to de-fuzzify as the fuzzy triangular numbers are still defined by using Equation (6).
M i = l w i , m w i , u w i 3
Stage 7 in this last stage, Mi is expected to be standardized by using Equation (7) while Mi is not a fuzzy integer.
N i = M i i = 1 n M i
Appropriate weights of all parameters along with alternatives can be calculated by using the above seven phases. After that, the ratings are determined for each alternative by combining each alternative weight along with important parameters. In response to these results, the decision-maker identifies the option with the most desirable score.

3.4. Fuzzification of the Parameters

The transformation of an input into a fuzzy attribute is known as a fuzzification [65]. Owing to vagueness, uncertainty or complexity, where any blurredness has arisen, this means that the variable may be fuzzy, and the membership function may imply it. The degree of membership is determined using fuzzification. In this analysis, using the function of fuzzy membership, we have transformed all layers of different parameters of drought-induced vulnerability into fuzzy layers in the ArcGIS environment, depending on their direction (positive or negative) in assessing the vulnerability of drought. The effect of each parameter is seen in Table 4.

3.5. Computing the Weight of the Parameters by AHP

The weights of the various parameters of the induced vulnerability were calculated using the AHP approach to classify the integrated vulnerability of western Odisha drought. The comparison matrixes (pair-wise) were built based on the contribution of each criterion layer to the degree of drought. The weights of each parameter were determined by calculating the rank of each parameter. The rating, weight and decision matrix for six categories of drought vulnerability are seen in Table 5.

3.6. Validation Methods

3.6.1. MAE

The mean absolute error (MAE) is determined by summing up all the values of the disparity between the practical and the enumerated values distant from their position [66]. The equation shall be expressed as follows:
M A E = 1 N i = 1 n V p r e d i c t V o b s e r v
where N represents the size of sample, Vpredict represents predicted and Vobserv refers to the practical values of the dependent variable.

3.6.2. RMSE

Root mean square error (RMSE) is designed to establish a square root ratio between the difference of the enumerated values and the practical values [67]. The equation shall be defined as follows:
R M S E = i = 1 N [ V p r e d i c t V o b s e r v ] 2 N

4. Results

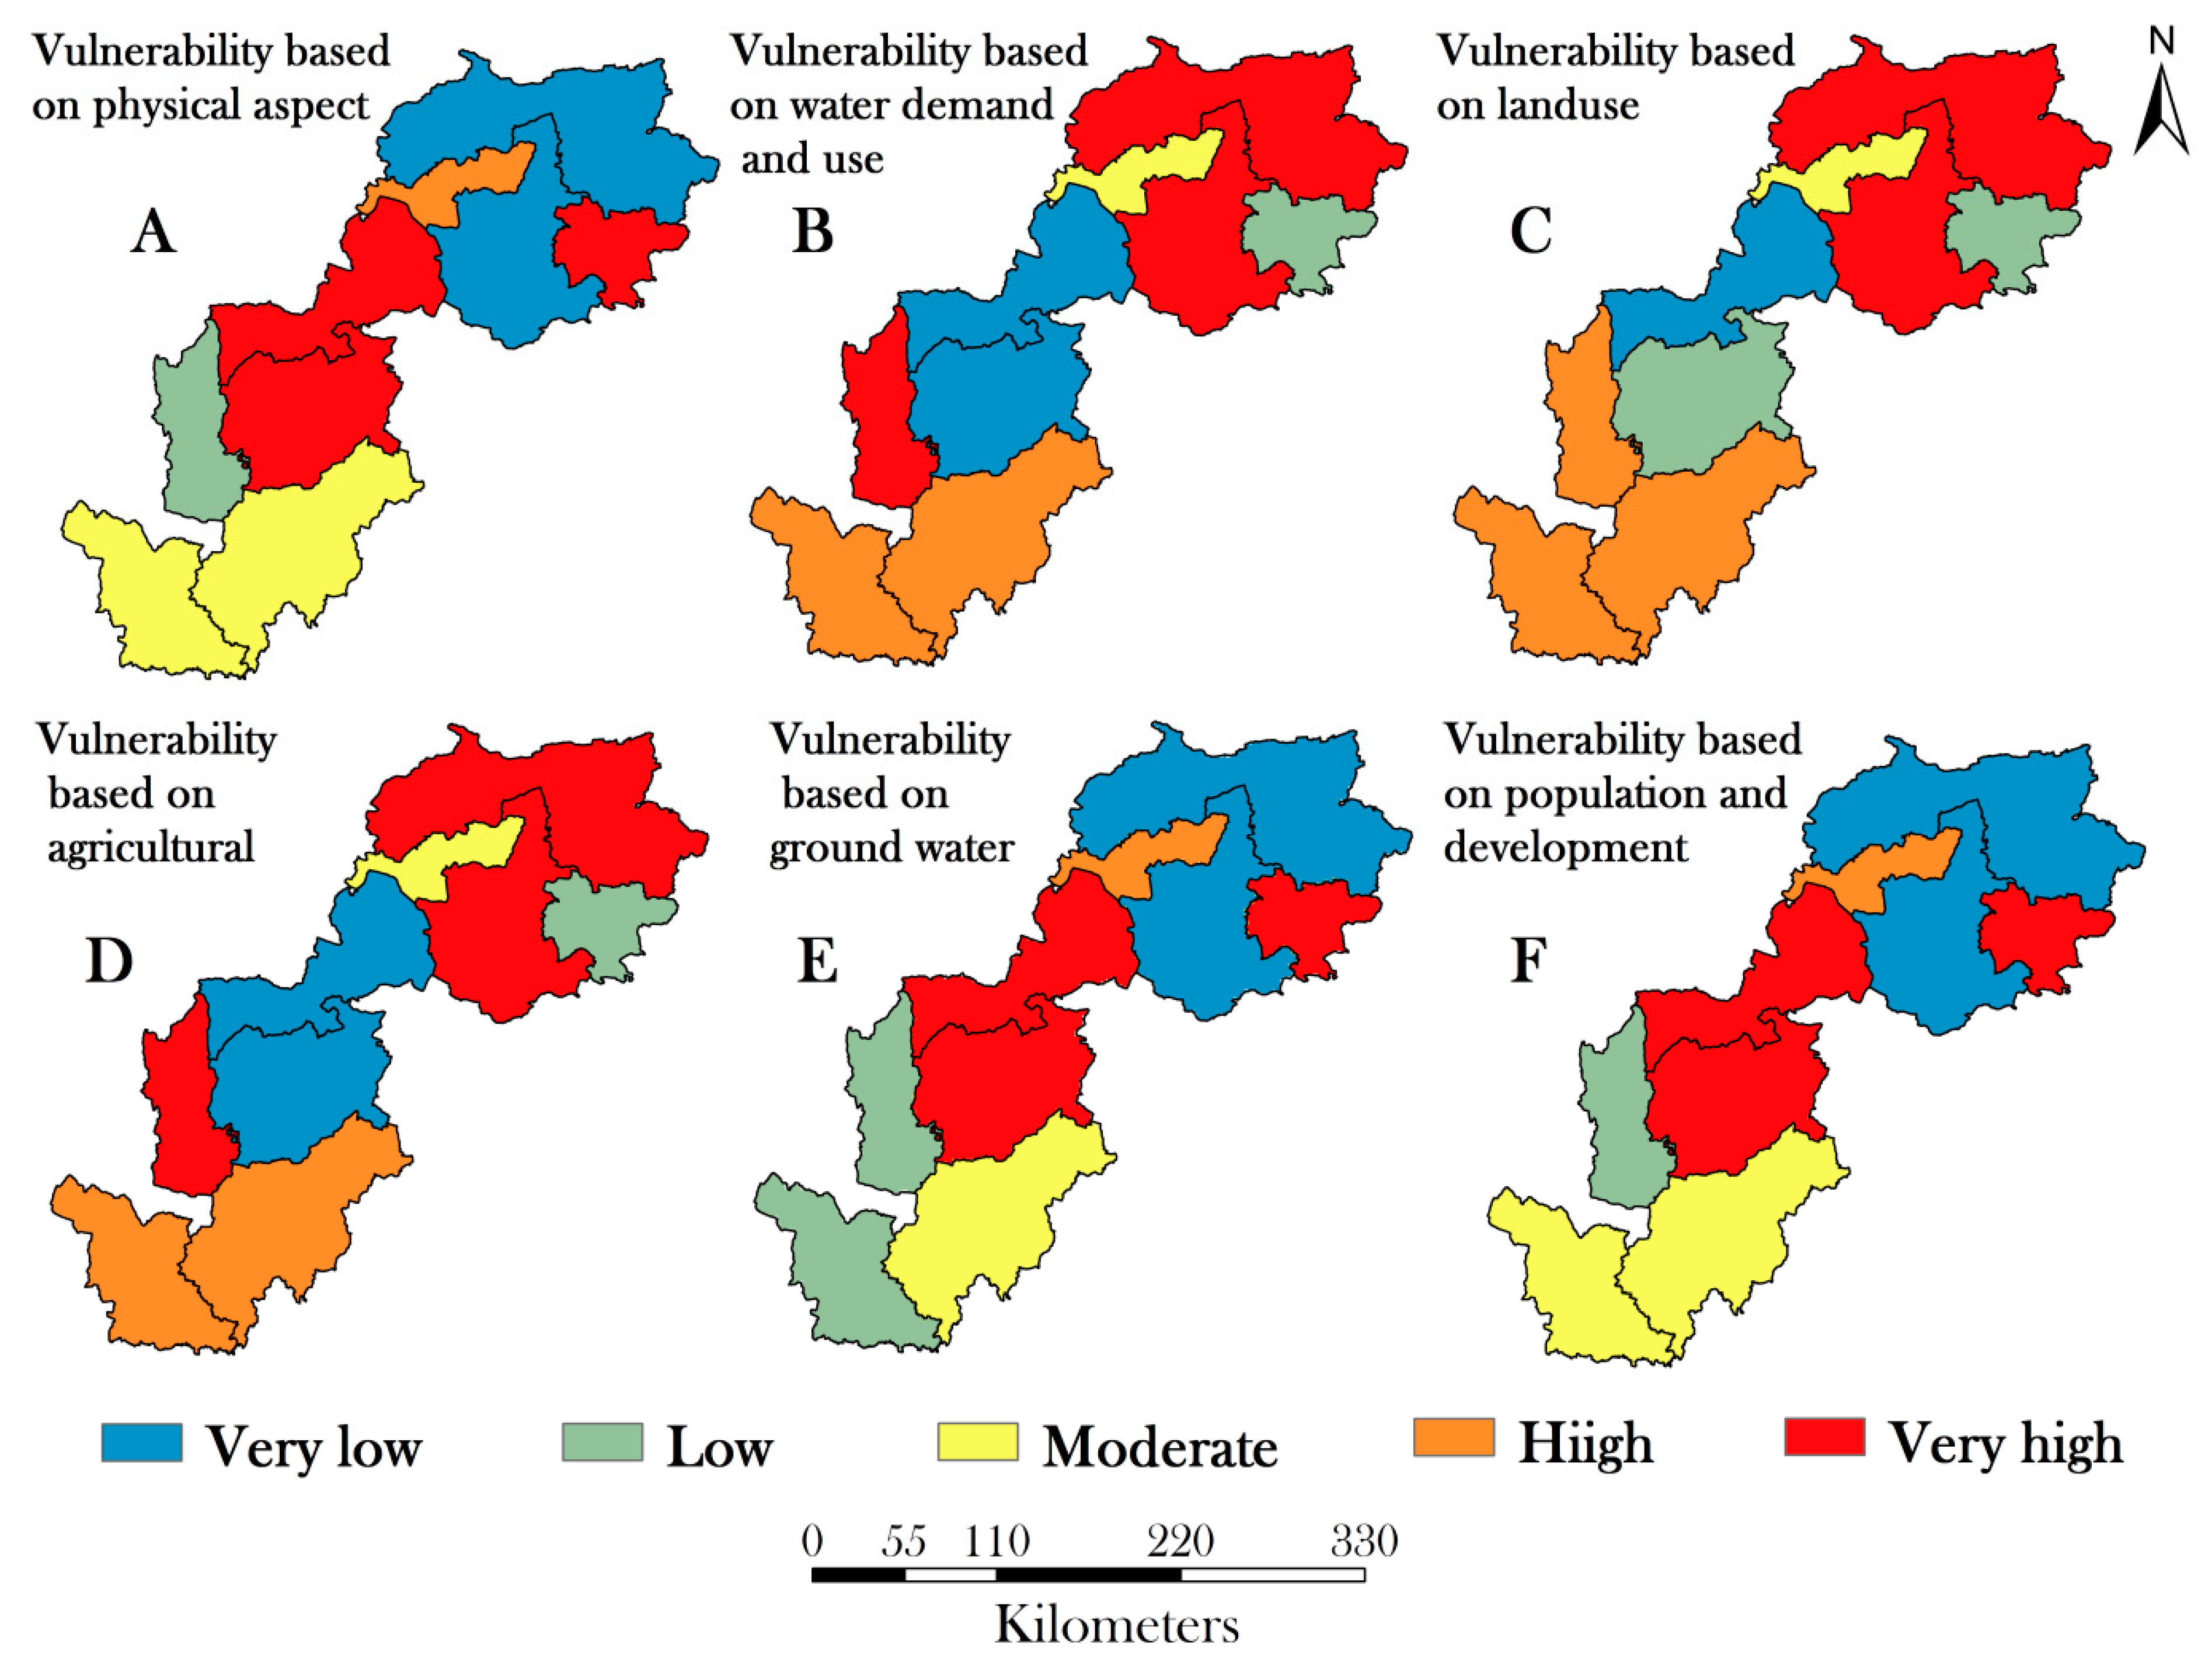
4.1. Drought Vulnerability Mapping Based on Physical Aspect

The drought vulnerability map based on the physical parameter reveals that the districts of Baragarh, Bolangir, Deogarh and Jharsuguda are coming under very high and high drought vulnerability areas (Figure 9A). These extremely high and high vulnerability areas occupy roughly 36.96 per cent (6.05 km2) and 5.19 per cent (0.85 km2) of the study area, respectively (Table 6). The lower portion of the study region is protected by a moderate drought vulnerability region. These areas primarily include the Kalahandi and Nabarangapur districts (Figure 9A). A total of 19.16 percent (3.14 km2) of the study area is within this vulnerability region (Table 6). Sundargarh, Sambalpur and Nuapara have low to very low drought vulnerability (Figure 9A). Low to very low risk areas occupy approximately 38.69 per cent (6.34 km2) of the research area (Table 6).

4.2. Drought Vulnerability Mapping Based on Water Demand and Used

The drought vulnerability map used and based on water demand shows that mainly the northern (Sundargarh, Sambalpur) and southern (Nuapara, Kalahandi and Nabarangapur) districts are vulnerable to a very high drought vulnerability zone (57.05%) (Figure 9B) (Table 6). The district of Jharsuguda comes under a moderate vulnerability zone (11.62 percent area) (Figure 9B) (Table 6). The middle portion of the study area, primarily the districts of Baragar, Bolangir and Deogar, falls under very low to low vulnerability areas (Figure 9B) and these two zones occupy 25.49 percent (4.58 km2) of the study area (Table 6).

4.3. Drought Vulnerability Mapping Based on Agriculture

The drought vulnerability map based on agriculture is the same as the vulnerability map based on the demand and use of water. The districts of Sundargarh, Sambalpur, Nuapada, Kalahandi and Nabarangapur are also very strongly vulnerable to high drought (57.05 percent) (Figure 9C) (Table 6). About 11.62 percent of the state is moderately vulnerable (district of Jharsuguda). Bargarh, Bolangir and Deogarh districts that are largely located in the middle part of the study area are vulnerable to low to very low vulnerability to drought (Figure 9C). The area of the study region occupies about 25.49 percent (4.58 km2) (Table 6).

4.4. Drought Vulnerability Mapping Based on Land Use

We can see that the very high to high vulnerability zone occupies about 57.05 percent of the study region in the vulnerability map dependent on land use (Table 6). These two regions primarily include the districts of Sundargarh, Sambalpur, Nuapada, Kalahandi and Nabarangapur (Figure 9D). About 11.62 percent of the Jharsuguda district region came under a moderate drought vulnerability zone, and 11.62 and 14.51 percent of the remaining area fell under a low and very low vulnerability area, respectively (Table 6). These two areas primarily comprise the districts of Baragarh, Bolangir and Deogarh (Figure 9D).

4.5. Drought Vulnerability Mapping Based on Ground Water

The map of drought vulnerability based on groundwater is somewhat the same as the map of physical drought vulnerability. The extremely low and low vulnerability areas here often include the northern and southern parts of the area in particular. These two areas occupy 38.53 percent of the research area in total (Table 6). These two areas are predominantly Sundargarh, Sambalpur, Nuapara and Nabarangapur (Figure 9E). Kalahandi district has come under a moderate drought vulnerability category (Figure 9E). Quite high to high vulnerability to drought can be seen in the districts of Baragarh, Bolangir, Jharsuguda and Deogarh (Figure 9E). These two areas primarily occupy 42.04 percent of the research area (6.85 km2) (Table 6).

4.6. Drought Vulnerability Mapping Based on Population and Development

In the population-based and growth-based vulnerability map, we can see that the physical drought vulnerability map gives the same outcome. The districts of Baragarh, Bolangir, Deogarh and Jharsuguda are inhabited by very high to high vulnerability areas (Figure 9F). These two areas largely occupy 42.15 percent (6.9 km2) of the study area (Table 6). The Kalahandi and Nabarangapur districts, which are located in the lower part of the study area, are moderately vulnerable to drought (Figure 9F). This area occupies approximately 19.16 percent of the study region (3.14 km2) (Table 6). Around 38.69 percent of the study area, which is roughly 6.34 km2, is largely occupied by very low to low drought vulnerability zones (Table 6).

4.7. Integrated Drought Vulnerability Mapping

In the integrated drought vulnerability map, the highest percentage of the region (32.66 percent) was found to have come under a very high vulnerability region covering the Sundargarh and Sambalpur districts (Table 7) as seen in Figure 10. On the other side, the district of Nuapara (7.56 percent) is covered by a high vulnerability zone (Table 7). The moderate vulnerability zone occupies about 25.74 percent of the study region (Table 7). The Kalahandi and Nabarangapur districts are part of this zone (Figure 10). The composite area of 34.04 percent of the study zone is very low to low vulnerability (Table 7). The districts of Bolangir, Baragarh, Deogarh and Jharsuguda inhabit all of these zones (Figure 10).

4.8. Validation of Drought Vulnerability Model

The validation of drought vulnerability evaluation was carried out by the root mean square error (RMSE) and mean absolute error (MAE) validation methods, as described in the methodology. For RMSE and MAE, 0.354 and 0.386 values were found, respectively. It is seen from the measured RMSE and MAE value of the current vulnerability model that the model used in the current study is accurate and suitable for assessing the drought vulnerability of any area, because the number of errors is very minimal. The historical drought events have also provided support for the drought vulnerability map of Odisha generated in the current study [68,69,70]. The following are some drought years in Odisha: 1983, 1987, 2002, and 2015 [30].

5. Discussion

Many researchers have prepared a significant number of studies on drought vulnerability mapping [56,57,58]. In addition to this, several researchers have established drought mitigation strategies and policies in India [59,71]. However, it is very rare for India to determine drought vulnerability with many criteria of different component-induced drought [59,71] and the number of drought studies on Odisha, India, is also very low. We have considered the western portion of Odisha in this present study for the assessment of drought vulnerability, as drought is a major problem in this province [72]. Here, we have introduced six criteria of drought-induced components (physical, demand and usage of water, agriculture, land use, state of ground water and population and development) that are highly responsible for drought vulnerability [59,73]. In order to recognize the vulnerability of an area, we have found a total of 22 parameters from various drought-induced components that are very crucial [59,68,74]. Based on the previous literature, we have chosen all the parameters, and, at the same time, we have evaluated the vulnerability of drought using the fuzzy AHP system, which is one of the trendiest methods for evaluating drought vulnerability and provides a good result in this area [59]. However, the fuzzy AHP approach has some disadvantages as this methodology does not tackle the non-straight model with it; hence, this model cannot cope with uncertainty. This strategy often relies more on decision-makers by whom the rating system is considered biased [59]. However, this technique is useful in determining the priority value of the parameters. But, in recent years, the fuzzy AHP approach has been very important in modelling drought vulnerability [59]. In the fuzzy method, the fuzzification was carried out on the basis of the importance of the parameters, along with the weighting of the parameters by the AHP method. The combination of these two methods has improved the importance of this study. We have composited all the parameters of drought by using this methodology and have finally prepared the final map of western Odisha’s drought vulnerability. Although many parameters for the development of drought vulnerability are considered, this study will be very reliable for the future planning of Odisha’s natural hazard management and for the planners, researchers and decision-makers of other drought-related research. In this study, we prepared a total of seven drought vulnerability maps in which the first six maps were developed on the basis of six vulnerability-based components. Then the six maps were subdivided further into five classes. After that, all six drought vulnerability maps were combined to obtain the final result of the drought vulnerability of the northwestern part of Odisha and subdivided the map by using Jenks’ natural break process from 1967 [75]. From the findings, it is clear that mainly the upper part of this current study’s region has fallen through quite high along with the extreme drought vulnerability zone. The names of the upper districts are Sambalpur and Sundargarh (Figure 10), which means that these districts are more vulnerable to drought [76,77,78]. The districts, which are more vulnerable to drought, have agriculture as their only source of income. High levels of insecurity, less crop diversity, high levels of borrowing and cultivation make the situation worse [79]. Livelihood diversity is mainly concerned with the control of the risk of natural disaster [79]. The largest region of northwestern Odisha is vulnerable to high drought (Table 7), which is around 33 percent. In addition to this high temperature, decreased rainfall levels, water shortages, higher evaporation rates and lower levels of ground water are also responsible for significant vulnerability to drought [59]. However, the eastern part of the state is not severely vulnerable to drought as it is situated near the Bay of Bengal [59]. Since the diversity of livelihoods of farmers in that part of the country is much less, they are essentially dependent on agricultural activities and agriculture-related activities for their livelihoods. As a result, they are mainly affected by the severity of the drought. It is also found here that people’s socio-economic conditions are also extremely low [80,81]. Farmers’ income is substantially lower in areas with drought severity [38,69] where farmers are highly affected. For the assessment of drought, the applied fuzzy AHP method has provided a valuable result. The method of rainwater harvesting in this area, along with this scientific use of water, knowledge of water shortage, the quest for ground water, adaptation of different crop trends and crop diversity in the northwestern part of Odisha, should be considered in this drought’s situation. The implementation of a crop insurance scheme is one of the better steps for the country to deal with drought [59]. This analysis would be of interest to potential researchers because, with the aid of this report, they will further add certain other criteria that can be used to represent the vulnerability of drought in a more precise manner. With the aid of this report, future researchers will also build a more useful model for the estimation of droughts. However, field surveys may increase the importance of this form of vulnerability assessment. Nevertheless, the control methods of the natural hazards of India as well as the environment can be strengthened in an acceptable manner.
Odisha’s susceptibility to drought stems from a confluence of geographical, climatic, and socio-economic factors [49]. Its predominantly a tropical climate, characterized by seasonal and often erratic monsoons, resulting in uneven distribution of rainfall across the region. The state’s undulating terrain is coupled with poor soil moisture retention and exacerbates water scarcity during dry spells [50]. High evaporation rates, coupled with overexploitation of groundwater resources and inadequate water management practices, further amplify the region’s vulnerability [50,51].
The implications of our findings reverberate profoundly in the area of drought management and policy formulation in Odisha. Our results advocate for the immediate implementation of strategic measures, such as rainwater harvesting, prudent water management practices, groundwater conservation, and diversification of crops, particularly in regions exhibiting elevated vulnerability. The proposition of a crop insurance scheme emerges as a pragmatic stride toward mitigating the adverse effects of drought [59]. Beyond its immediate application, our study serves as a springboard for future researchers, providing a scaffold to refine assessments by integrating additional criteria and elevating model accuracy. While acknowledging potential limitations, such as the enrichment brought by field surveys, our research equips decision-makers and stakeholders with invaluable insights to bolster natural hazard management and fortify resilience in the face of drought-induced adversities.

6. Conclusions

In conclusion, this study employed an integrated multi-criteria spatial drought methodology to generate a comprehensive drought susceptibility map for the northwestern region of Odisha. By amalgamating diverse parameters from various causative components of drought using the Fuzzy Analytic Hierarchy Process (fuzzy AHP) and geospatial techniques, we verified the model’s applicability. Evaluation of the model’s performance using RMSE and MAE metrics on training and evaluation datasets validated its robustness. The fuzzy AHP method effectively ranked and weighted parameters, leading to a synthesized drought vulnerability map that offers valuable insights. The outcomes of our analysis underscore critical zones of drought vulnerability within the study area. Notably, Sundargarh and Sambalpur districts exhibit extreme vulnerability, while Nuapada experiences high vulnerability. Moderate vulnerability characterizes Kalahandi and Nabarangpur, whereas Jharsuguda, Deogarh, Baragarh and Bolangir districts face relatively lower vulnerability levels. These findings hold immense practical utility for stakeholders, including planners, decision-makers, natural resource managers and farmers, enabling them to formulate targeted mitigation strategies, policies and actions. By aiding in the design of resilient farming practices and water management approaches, the vulnerability map empowers local communities to mitigate the adverse impacts of drought.
Furthermore, the transferability of this model to similar physiographic and geological contexts beyond Odisha offers broader relevance for drought-vulnerable regions across the country. This research serves as a crucial resource for India, a nation highly reliant on agriculture for sustenance, guiding farmers in selecting drought-resistant crops and optimizing water use. It is important to acknowledge the limitations of this study, such as the reliance on published sources rather than field surveys and the potential omission of certain parameters. Nevertheless, the developed model’s adaptability to different datasets and regions holds promise for enhancing drought vulnerability assessments in diverse landscapes.
Based on the vulnerability assessment conducted in Odisha, several targeted measures can be implemented to mitigate the impacts of drought. For districts exhibiting extreme and high vulnerability, such as Sundargarh, Sambalpur and Nuapada, a multifaceted approach involving enhanced water conservation and storage through rainwater harvesting, efficient irrigation practices, promotion of drought-resistant crop varieties, and micro-level water management initiatives should be prioritized. In areas with moderate vulnerability such as Kalahandi and Nabarangpur, emphasis should be placed on promoting crop diversification, sustainable land management practices and community-based water-sharing arrangements. For districts with lower vulnerability, such as Jharsuguda, Deogarh, Baragarh and Bolangir, continued awareness campaigns on water conservation and judicious water usage should be reinforced to ensure preparedness for future drought events.
As we move forward, the insights gained from this study hold great potential for informing proactive natural hazard management strategies. By equipping decision-makers with a comprehensive understanding of drought vulnerability, this research lays the groundwork for resilient and sustainable approaches that safeguard livelihoods and enhance the overall resilience of vulnerable communities.

Author Contributions

Conceptualization, S.M., P.K.J. and P.K.; methodology, S.M., G.M. and B.K.; software, B.K. and S.K.; validation, S.M.; formal analysis, S.K.; investigation, G.M. and B.K.; data curation, S.M. and B.K.; writing—original draft preparation, S.M. and S.K.; writing—review and editing, P.K.J. and P.K.; visualization, S.M., B.K. and S.K.; supervision, P.K.J.; funding acquisition, P.K. All authors have read and agreed to the published version of the manuscript.

Funding

We acknowledge the support from the Japan Science and Technology Agency (JST), as a part of the Abandonment and Rebound: Societal Views on the Landscape- and Land-Use Change and their Impacts on Water and Soils (ABRESO) project under the Belmont Forum.

Data Availability Statement

Data will be made available on reasonable request.

Acknowledgments

The authors would like to express our sincere gratitude to the Handling Editor and the anonymous reviewers for their invaluable contributions and insightful feedback, which greatly improved the quality of research article.

Conflicts of Interest

The authors declare no conflict of interest.

References

  1. Samans, R.; Nelson, J. The New Business Operating Context of the 2020s. In Sustainable Enterprise Value Creation: Implementing Stakeholder Capitalism through Full ESG Integration; Springer International Publishing: Cham, Switzerland, 2022; pp. 35–62. [Google Scholar]
  2. Barbour, E.J.; Adnan, M.S.G.; Borgomeo, E.; Paprocki, K.; Khan, M.S.A.; Salehin, M.; Hall, J.W. The unequal distribution of water risks and adaptation benefits in coastal Bangladesh. Nat. Sustain. 2022, 5, 294–302. [Google Scholar] [CrossRef]
  3. Coly, S.M.; Zorom, M.; Leye, B.; Karambiri, H.; Guiro, A. Learning from history of natural disasters in the Sahel: A comprehensive analysis and lessons for future resilience. Environ. Sci. Pollut. Res. 2023, 49, 1–13. [Google Scholar] [CrossRef] [PubMed]
  4. Bogale, G.A.; Erena, Z.B. Drought vulnerability and impacts of climate change on livestock production and productivity in different agro-Ecological zones of Ethiopia. J. Appl. Anim. Res. 2022, 50, 471–489. [Google Scholar] [CrossRef]
  5. Dijoo, Z.K.; Khurshid, R. Environmental Degradation as a Multifaceted Consequence of Human Development. In Environmental Biotechnology: Sustainable Remediation of Contamination in Different Environs; CRC Press: New York, NY, USA, 2022. [Google Scholar]
  6. Price, J.; Warren, R.; Forstenhäusler, N.; Wallace, C.; Jenkins, R.; Osborn, T.J.; Van Vuuren, D.P. Quantification of meteorological drought risks between 1.5 °C and 4 °C of global warming in six countries. Clim. Chang. 2022, 174, 12. [Google Scholar] [CrossRef]
  7. Rusca, M.; Savelli, E.; Di Baldassarre, G.; Biza, A.; Messori, G. Unprecedented droughts are expected to exacerbate urban inequalities in Southern Africa. Nat. Clim. Chang. 2023, 13, 98–105. [Google Scholar] [CrossRef]
  8. Wang, P.; Asare, E.; Pitzer, V.E.; Dubrow, R.; Chen, K. Associations between long-term drought and diarrhea among children under five in low-and middle-income countries. Nat. Commun. 2022, 13, 3661. [Google Scholar] [CrossRef] [PubMed]
  9. Asif, Z.; Chen, Z.; Sadiq, R.; Zhu, Y. Climate Change Impacts on Water Resources and Sustainable Water Management Strategies in North America. Water Resour. Manag. 2023, 37, 2771–2786. [Google Scholar] [CrossRef]
  10. Koko, A.F.; Han, Z.; Wu, Y.; Abubakar, G.A.; Bello, M. Spatiotemporal Land Use/Land Cover Mapping and Prediction Based on Hybrid Modeling Approach: A Case Study of Kano Metropolis, Nigeria (2020–2050). Remote Sens. 2022, 14, 6083. [Google Scholar] [CrossRef]
  11. Minhas, P.S.; Saha, J.K.; Dotaniya, M.L.; Sarkar, A.; Saha, M. Wastewater irrigation in India: Current status, impacts and response options. Sci. Total Environ. 2022, 808, 152001. [Google Scholar] [CrossRef]
  12. Mwadzingeni, L.; Mugandani, R.; Mafongoya, P.; Mwadzingeni, L.; Mugandani, R.; Mafongoya, P. Risks of climate change on future water supply in smallholder irrigation schemes in Zimbabwe. Water 2022, 14, 1682. [Google Scholar] [CrossRef]
  13. Anandhi, A.; Douglas-Mankin, K.R.; Srivastava, P.; Aiken, R.M.; Senay, G.; Leung, L.R.; Chaubey, I. DPSIR-ESA vulnerability assessment (DEVA) framework: Synthesis, foundational overview, and expert case studies. Trans. ASABE 2020, 63, 741–752. [Google Scholar] [CrossRef]
  14. Roy, P.S.; Ramachandran, R.M.; Paul, O.; Thakur, P.K.; Ravan, S.; Behera, M.D.; Sarangi, C.; Kanawade, V.P. Anthropogenic land use and land cover changes—A review on its environmental consequences and climate change. J. Indian Soc. Remote Sens. 2022, 50, 1615–1640. [Google Scholar] [CrossRef]
  15. Belaïd, F. Implications of poorly designed climate policy on energy poverty: Global reflections on the current surge in energy prices. Energy Res. Soc. Sci. 2022, 92, 102790. [Google Scholar] [CrossRef]
  16. Hagenlocher, M.; Meza, I.; Anderson, C.C.; Min, A.; Renaud, F.G.; Walz, Y.; Siebert, S.; Sebesvari, Z. Drought vulnerability and risk assessments: State of the art, persistent gaps, and research agenda. Environ. Res. Lett. 2019, 14, 083002. [Google Scholar] [CrossRef]
  17. Batool, M.; El-Badri, A.M.; Hassan, M.U.; Haiyun, Y.; Chunyun, W.; Zhenkun, Y.; Jie, K.; Wang, B.; Zhou, G. Drought stress in Brassica napus: Effects, tolerance mechanisms, and management strategies. J. Plant. Growth Regul. 2022, 42, 21–45. [Google Scholar] [CrossRef]
  18. Cole, H.D.; Cole, M.J.; Simpson, K.J.; Simpson, N.P.; Ziervogel, G.; New, M.G. Managing city-scale slow-onset disasters: Learning from Cape Town’s 2015–2018 drought disaster planning. Int. J. Disaster Risk Reduct. 2021, 63, 102459. [Google Scholar] [CrossRef]
  19. Jafari, S.M.; Nikoo, M.R.; Sadegh, M.; Chen, M.; Gandomi, A.H. Non-parametric severity-duration-frequency analysis of drought based on satellite-based product and model fusion techniques. Environ. Sci. Pollut. Res. 2023, 30, 42087–42107. [Google Scholar] [CrossRef] [PubMed]
  20. Warter, M.M.; Singer, M.B.; Cuthbert, M.O.; Roberts, D.; Caylor, K.K.; Sabathier, R.; Stella, J. Drought onset and propagation into soil moisture and grassland vegetation responses during the 2012–2019 major drought in Southern California. Hydrol. Earth Syst. Sci. 2021, 25, 3713–3729. [Google Scholar] [CrossRef]
  21. Yao, Y.; Liu, Y.; Zhou, S.; Song, J.; Fu, B. Soil moisture determines the recovery time of ecosystems from drought. Glob. Chang. Biol. 2023, 29, 3562–3574. [Google Scholar] [CrossRef]
  22. Satoh, Y.; Yoshimura, K.; Pokhrel, Y.; Kim, H.; Shiogama, H.; Yokohata, T.; Hanasaki, N.; Wada, Y.; Burek, P.; Byers, E.; et al. The timing of unprecedented hydrological drought under climate change. Nat. Commun. 2022, 13, 3287. [Google Scholar] [CrossRef]
  23. Kumar, P.; Debele, S.E.; Sahani, J.; Rawat, N.; Marti-Cardona, B.; Alfieri, S.M.; Basu, B.; Basu, A.S.; Bowyer, P.; Charizopoulos, N.; et al. An overview of monitoring methods for assessing the performance of nature-based solutions against natural hazards. Earth-Sci. Rev. 2021, 217, 103603. [Google Scholar] [CrossRef]
  24. Wu, B.; Ma, Z.; Yan, N. Agricultural drought mitigating indices derived from the changes in drought characteristics. Remote Sens. Environ. 2020, 244, 111813. [Google Scholar] [CrossRef]
  25. Kassahun, Z.; Renninger, H.J. Effects of drought on water use of seven tree species from four genera growing in a bottomland hardwood forest. Agric. For. Meteorol. 2021, 301, 108353. [Google Scholar] [CrossRef]
  26. Konapala, G.; Mishra, A. Quantifying climate and catchment control on hydrological drought in the continental United States. Water Resour. Res. 2020, 56, e2018WR024620. [Google Scholar] [CrossRef]
  27. Mukhawana, M.B.; Kanyerere, T.; Kahler, D. Review of in-Situ and remote sensing-based indices and their Applicability for integrated drought monitoring in South Africa. Water 2023, 15, 240. [Google Scholar] [CrossRef]
  28. Mujere, N. Assessing Risks and Resilience to Hydro-Meteorological Disasters. In Disaster Risk Reduction for Resilience: Climate Change and Disaster Risk Adaptation; Springer International Publishing: Cham, Switzerland, 2023; pp. 143–159. [Google Scholar]
  29. Saldariaga, J.; Yevjevich, V. Application of Run-Lengths to Hydrologic Series Hydrol Paper; Colorado State University Publication, Colorado State University: Fort Collins, CO, USA, 1970. [Google Scholar]
  30. Saha, S.; Kundu, B.; Paul, G.C.; Mukherjee, K.; Pradhan, B.; Dikshit, A.; Abdul Maulud, K.N.; Alamri, A.M. Spatial assessment of drought vulnerability using fuzzy-analytical hierarchical process: A case study at the Indian state of Odisha. Geomat. Nat. Hazards Risk 2021, 12, 123–153. [Google Scholar] [CrossRef]
  31. Akturk, G.; Zeybekoglu, U.; Yildiz, O. Assessment of meteorological drought analysis in the Kizilirmak River Basin, Turkey. Arab. J. Geosci. 2022, 15, 850. [Google Scholar] [CrossRef]
  32. Şen, Z. Probabilistic modelling of crossing in small samples and application of runs to hydrology. J. Hydrol. 1991, 124, 345–362. [Google Scholar] [CrossRef]
  33. Cavus, Y.; Aksoy, H. Critical drought severity/intensity-duration-frequency curves based on precipitation deficit. J. Hydrol. 2020, 584, 124312. [Google Scholar] [CrossRef]
  34. Singh, U.; Sharma, P.K. Drought forecasting using the stochastic model in the Betwa river basin, India. Model. Earth Syst. Environ. 2021, 8, 1771–1786. [Google Scholar] [CrossRef]
  35. Vroege, W.; Bucheli, J.; Dalhaus, T.; Hirschi, M.; Finger, R. Insuring crops from space: The potential of satellite-retrieved soil moisture to reduce farmers’ drought risk exposure. Eur. Rev. Agric. Econ. 2021, 48, 266–314. [Google Scholar] [CrossRef]
  36. Kalubarme, M.; Acharya, M.; Shukla, S.H. Monitoring drought and its impact on agriculture using drought indices and geo-informatics technology in Patan District, Gujarat. Int. J. Environ. Geoinform. 2019, 6, 153–162. [Google Scholar] [CrossRef]
  37. Liu, C.; Yang, C.; Yang, Q.; Wang, J. Spatiotemporal drought analysis by the standardized precipitation index (SPI) and standardized precipitation evapotranspiration index (SPEI) in Sichuan Province, China. Sci. Rep. 2021, 11, 1280. [Google Scholar] [CrossRef] [PubMed]
  38. Hu, X.; Ren, H.; Tansey, K.; Zheng, Y.; Ghent, D.; Liu, X.; Yan, L. Agricultural drought monitoring using European Space Agency Sentinel 3A land surface temperature and normalized difference vegetation index imageries. Agric. For. Meteorol. 2019, 279, 107707. [Google Scholar] [CrossRef]
  39. Kumar, P.V.; Osman, M.; Mishra, P.K. Development and application of a new drought severity index for categorizing drought-prone areas: A case study of undivided Andhra Pradesh state, India. Nat. Hazards 2019, 97, 793–812. [Google Scholar] [CrossRef]
  40. Barnard, D.M.; Germino, M.J.; Bradford, J.B.; O’Connor, R.C.; Andrews, C.M.; Shriver, R.K. Are drought indices and climate data good indicators of ecologically relevant soil moisture dynamics in drylands? Ecol. Indic. 2021, 133, 108379. [Google Scholar] [CrossRef]
  41. Shah, D.; Mishra, V. Integrated Drought Index (IDI) for drought monitoring and assessment in India. Water Resour. Res. 2020, 56, e2019WR026284. [Google Scholar] [CrossRef]
  42. Dikshit, A.; Pradhan, B.; Santosh, M. Artificial neural networks in drought prediction in the 21st century—A scientometric analysis. Appl. Soft Comput. 2022, 114, 108080. [Google Scholar] [CrossRef]
  43. Sokhi, R.S.; Moussiopoulos, N.; Baklanov, A.; Bartzis, J.; Coll, I.; Finardi, S.; Friedrich, R.; Geels, C.; Grönholm, T.; Halenka, T.; et al. Advances in air quality research—Current and emerging challenges. Atmos. Chem. Phys. 2022, 22, 4615–4703. [Google Scholar] [CrossRef]
  44. Haile, G.G.; Tang, Q.; Li, W.; Liu, X.; Zhang, X. Drought: Progress in broadening its understanding. Wiley Interdiscip. Rev. Water 2020, 7, e1407. [Google Scholar] [CrossRef]
  45. Sivakumar, V.L.; Krishnappa, R.R.; Nallanathel, M. Drought vulnerability assessment and mapping using Multi-Criteria decision making (MCDM) and application of Analytic Hierarchy process (AHP) for Namakkal District, Tamilnadu, India. Mater. Today Proc. 2021, 43, 1592–1599. [Google Scholar] [CrossRef]
  46. Alharbi, R.S.; Nath, S.; Faizan, O.M.; Hasan, M.S.U.; Alam, S.; Khan, M.A.; Bakshi, S.; Sahana, M.; Saif, M.M. Assessment of Drought vulnerability through an integrated approach using AHP and Geoinformatics in the Kangsabati River Basin. J. King Saud Univ.-Sci. 2022, 34, 102332. [Google Scholar] [CrossRef]
  47. Alkhalidi, A.; Assaf, M.N.; Alkaylani, H.; Halaweh, G.; Salcedo, F.P. Integrated innovative technique to assess and priorities risks associated with drought: Impacts, measures/strategies, and actions, global study. Int. J. Disaster Risk Reduct. 2023, 94, 103800. [Google Scholar] [CrossRef]
  48. Wijitkosum, S.; Sriburi, T. Fuzzy AHP integrated with GIS analyses for drought risk assessment: A case study from upper Phetchaburi River basin, Thailand. Water 2019, 11, 939. [Google Scholar] [CrossRef]
  49. Nicholson, C.C.; Egan, P.A. Natural hazard threats to pollinators and pollination. Glob. Chang. Biol. 2020, 26, 380–391. [Google Scholar] [CrossRef] [PubMed]
  50. Roy, P.; Pal, S.C.; Chakrabortty, R.; Chowdhuri, I.; Saha, A.; Shit, M. Climate change and groundwater overdraft impacts on agricultural drought in India: Vulnerability assessment, food security measures and policy recommendation. Sci. Total Environ. 2022, 849, 157850. [Google Scholar] [CrossRef] [PubMed]
  51. Pal, S.C.; Chowdhuri, I.; Das, B.; Chakrabortty, R.; Roy, P.; Saha, A.; Shit, M. Threats of climate change and land use patterns enhance the susceptibility of future floods in India. J. Environ. Manag. 2022, 305, 114317. [Google Scholar] [CrossRef] [PubMed]
  52. Ma, S.; Qiu, H.; Yang, D.; Wang, J.; Zhu, Y.; Tang, B.; Sun, K.; Cao, M. Surface multi-hazard effect of underground coal mining. Landslides 2023, 20, 39–52. [Google Scholar] [CrossRef]
  53. Yang, D.; Qiu, H.; Ye, B.; Liu, Y.; Zhang, J.; Zhu, Y. Distribution and Recurrence of Warming-induced Retrogressive Thaw Slumps on the Central Qinghai-Tibet Plateau. J. Geophys. Res. Earth Surf. 2023, 18, e2022JF007047. [Google Scholar] [CrossRef]
  54. Yuan, C.; Li, Q.; Nie, W.; Ye, C. A depth information-based method to enhance rainfall-induced landslide deformation area identification. Measurement 2023, 219, 113288. [Google Scholar] [CrossRef]
  55. Zhang, Y.; Luo, J.; Zhang, Y.; Huang, Y.; Cai, X.; Yang, J.; Mao, D.; Li, J.; Tuo, X.; Zhang, Y. Resolution Enhancement for Large-Scale Real Beam Mapping Based on Adaptive Low-Rank Approximation. IEEE Trans. Geosci. Remote Sens. 2022, 60, 1–21. [Google Scholar] [CrossRef]
  56. Yan, Y.; Jarvie, S.; Liu, Q.; Zhang, Q. Effects of fragmentation on grassland plant diversity depend on the habitat specialization of species. Biol. Conserv. 2022, 275, 109773. [Google Scholar] [CrossRef]
  57. Zhou, J.; Wang, L.; Zhong, X.; Yao, T.; Qi, J.; Wang, Y.; Xue, Y. Quantifying the major drivers for the expanding lakes in the interior Tibetan Plateau. Sci. Bull. 2022, 67, 474–478. [Google Scholar] [CrossRef] [PubMed]
  58. Li, J.; Wang, Z.; Wu, X.; Xu, C.; Guo, S.; Chen, X. Toward Monitoring Short-Term Droughts Using a Novel Daily Scale, Standardized Antecedent Precipitation Evapotranspiration Index. J. Hydrometeorol. 2020, 21, 891–908. [Google Scholar] [CrossRef]
  59. Li, J.; Wang, Z.; Wu, X.; Zscheischler, J.; Guo, S.; Chen, X. A standardized index for assessing sub-monthly compound dry and hot conditions with application in China. Hydrol. Earth Syst. Sci. 2021, 25, 1587–1601. [Google Scholar] [CrossRef]
  60. Zhu, G.; Liu, Y.; Wang, L.; Sang, L.; Zhao, K.; Zhang, Z.; Lin, X.; Qiu, D. The isotopes of precipitation have climate change signal in arid Central Asia. Glob. Planet. Chang. 2023, 225, 104103. [Google Scholar] [CrossRef]
  61. Sang, L.; Zhu, G.; Xu, Y.; Sun, Z.; Zhang, Z.; Tong, H. Effects of Agricultural Large-And Medium-Sized Reservoirs on Hydrologic Processes in the Arid Shiyang River Basin, Northwest China. Water Resour. Res. 2023, 59, e2022WR033519. [Google Scholar] [CrossRef]
  62. Wu, B.; Quan, Q.; Yang, S.; Dong, Y. A social-ecological coupling model for evaluating the human-water relationship in basins within the Budyko framework. J. Hydrol. 2023, 619, 129361. [Google Scholar] [CrossRef]
  63. Li, W.; Shi, Y.; Zhu, D.; Wang, W.; Liu, H.; Li, J.; Shi, N.; Ma, L.; Fu, S. Fine root biomass and morphology in a temperate forest are influenced more by the nitrogen treatment approach than the rate. Ecol. Indic. 2021, 130, 108031. [Google Scholar] [CrossRef]
  64. Fang, Y.; Wang, H.; Fang, P.; Liang, B.; Zheng, K.; Sun, Q.; Li, X.Q.; Zeng, R.; Wang, A. Life cycle assessment of integrated bioelectrochemical-constructed wetland system: Environmental sustainability and economic feasibility evaluation. Resour. Conserv. Recycl. 2023, 189, 106740. [Google Scholar] [CrossRef]
  65. Yuan, L.; Wu, X.; He, W.; Degefu, D.M.; Kong, Y.; Yang, Y.; Xu, S.; Ramsey, T.S. Utilizing the strategic concession behavior in a bargaining game for optimal allocation of water in a transboundary river basin during water bankruptcy. Environ. Impact Assess. Rev. 2023, 102, 107162. [Google Scholar] [CrossRef]
  66. Wang, X.; Wang, T.; Xu, J.; Shen, Z.; Yang, Y.; Chen, A.; Wang, S.; Liang, E.; Piao, S. Enhanced habitat loss of the Himalayan endemic flora driven by warming-forced upslope tree expansion. Nat. Ecol. Evol. 2022, 6, 890–899. [Google Scholar] [CrossRef] [PubMed]
  67. Tian, H.F.; Huang, N.; Niu, Z.; Qin, Y.C.; Pei, J.; Wang, J. Mapping Winter Crops in China with Multi-Source Satellite Imagery and Phenology-Based Algorithm. Remote Sens. 2019, 11, 820. [Google Scholar] [CrossRef]
  68. Tian, H.; Pei, J.; Huang, J.; Li, X.; Wang, J.; Zhou, B.; Qin, Y.; Wang, L. Garlic and Winter Wheat Identification Based on Active and Passive Satellite Imagery and the Google Earth Engine in Northern China. Remote. Sens. 2020, 12, 3539. [Google Scholar] [CrossRef]
  69. Gao, C.; Zhang, B.; Shao, S.; Hao, M.; Zhang, Y.; Xu, Y.; Kuang, Y.; Dong, L.; Wang, Z. Risk assessment and zoning of flood disaster in Wuchengxiyu Region, China. Urban. Clim. 2023, 49, 101562. [Google Scholar] [CrossRef]
  70. Yin, Z.; Liu, Z.; Liu, X.; Zheng, W.; Yin, L. Urban heat islands and their effects on thermal comfort in the US: New York and New Jersey. Ecol. Indic. 2023, 154, 110765. [Google Scholar] [CrossRef]
  71. Chen, J.; Liu, Z.; Yin, Z.; Liu, X.; Li, X.; Yin, L.; Zheng, W. Predict the effect of meteorological factors on haze using BP neural network. Urban. Clim. 2023, 51, 101630. [Google Scholar] [CrossRef]
  72. Yin, L.; Wang, L.; Zheng, W.; Ge, L.; Tian, J.; Liu, Y.; Yang, B.; Liu, S. Evaluation of Empirical Atmospheric Models Using Swarm-C Satellite Data. Atmosphere 2022, 13, 294. [Google Scholar] [CrossRef]
  73. Yin, L.; Wang, L.; Huang, W.; Tian, J.; Liu, S.; Yang, B.; Zheng, W. Haze Grading Using the Convolutional Neural Networks. Atmosphere 2022, 13, 522. [Google Scholar] [CrossRef]
  74. Ren, B.; Zhang, Q.; Ren, J.; Ye, S.; Yan, F. A Novel Hybrid Approach for Water Resources Carrying Capacity Assessment by Integrating Fuzzy Comprehensive Evaluation and Analytical Hierarchy Process Methods with the Cloud Model. Water 2020, 12, 3241. [Google Scholar] [CrossRef]
  75. Kalisa, W.; Zhang, J.; Igbawua, T.; Ujoh, F.; Ebohon, O.J.; Namugize, J.N.; Yao, F. Spatio-temporal analysis of drought and return periods over the East African region using Standardized Precipitation Index from 1920 to 2016. Agric. Water Manag. 2020, 237, 106195. [Google Scholar] [CrossRef]
  76. Sur, C.; Kang, D.H.; Lim, K.J.; Yang, J.E.; Shin, Y.; Jung, Y. Soil Moisture–Vegetation–Carbon Flux Relationship under Agricultural Drought Condition using Optical Multispectral Sensor. Remote Sens. 2020, 12, 1359. [Google Scholar] [CrossRef]
  77. Miah, M.G.; Abdullah, H.M.; Jeong, C. Exploring standardized precipitation evapotranspiration index for drought assessment in Bangladesh. Environ. Monit. Assess. 2017, 189, 547. [Google Scholar] [CrossRef] [PubMed]
  78. Hao, Z.; Hao, F.; Singh, V.P.; Ouyang, W.; Cheng, H. An integrated package for drought monitoring, prediction and analysis to aid drought modeling and assessment. Environ. Model. Softw. 2017, 91, 199–209. [Google Scholar] [CrossRef]
  79. Jiang, W.; Wang, L.; Feng, L.; Zhang, M.; Yao, R. Drought characteristics and its impact on changes in surface vegetation from 1981 to 2015 in the Yangtze River Basin, China. Int. J. Climatol. 2020, 40, 3380–3397. [Google Scholar] [CrossRef]
  80. Liu, S.; Shi, H.; Niu, J.; Chen, J.; Kuang, X. Assessing future socioeconomic drought events under a changing climate over the Pearl River basin in South China. J. Hydrol. Reg. Stud. 2020, 30, 100700. [Google Scholar] [CrossRef]
  81. Katipoğlu, O.M.; Acar, R.; Şengül, S. Comparison of meteorological indices for drought monitoring and evaluating: A case study from Euphrates basin, Turkey. J. Water Clim. Chang. 2020, 11, 29–43. [Google Scholar] [CrossRef]
Figure 1. Location of study area.
Water 15 03210 g001
Figure 2. Methodological framework for this study.
Water 15 03210 g002
Figure 3. Drought vulnerability parameters based on physical aspect.
Water 15 03210 g003
Figure 4. Drought vulnerability parameters based on water demand and use.
Water 15 03210 g004
Figure 5. Drought vulnerability parameters based on agriculture.
Water 15 03210 g005
Figure 6. Drought vulnerability parameters based on land use.
Water 15 03210 g006
Figure 7. Drought vulnerability parameters based on ground water.
Water 15 03210 g007
Figure 8. Drought vulnerability parameters based on population and development.
Water 15 03210 g008
Figure 9. Drought vulnerability based on six considered categories.
Water 15 03210 g009
Figure 10. Integrated drought vulnerability map.
Water 15 03210 g010
Table 1. Sources of selected parameters.
ParametersData Sources
Annual rainfallIndian Meteorological Department
Average temperatureIndian Meteorological Department
EvapotranspirationIndian Meteorological Department
Wet day frequencyIndian Meteorological Department
Total water demand Ground water booklet 2016
Water use for irrigationGround water booklet 2016
Water for all useGround water booklet 2016
Gross cropped areaDistrict irrigation plan 2016
Cropping intensityDistrict irrigation plan 2016
Irrigation intensityA study on Irrigation and Agricultural
productivity in Odisha 2018
Gross irrigated areaDistrict irrigation plan 2016
Net irrigated areaDistrict irrigation plan 2016
Area under forestDistrict irrigation plan 2016
Total ground waterGround water booklet 2016
Stage of ground water developmentGround water booklet 2016
Ground water for future irrigationGround water booklet 2016
Population densityDistrict irrigation plan 2016
HealthOdisha economic journal 2019
Education Odisha economic journal 2019
Income indexOdisha economic journal 2019
Table 3. Philological terminologies and the equivalent triangular numbers of fuzzy.
Saaty ScaleDefinitionFuzzy Triangular Scale
1Equally important (Eq. Imp.) (1, 1, 1)
3Weakly important (W. Imp.) (2, 3, 4)
5Fairly important (F. Imp.) (4, 5, 6)
7Strongly important (S. Imp.) (6, 7, 8)
9Absolutely important (A. Imp.) (9, 9, 9)
2The intermittent values between two adjacent scales(1, 2, 3)
4(3, 4, 5)
6(5, 6, 7)
8(7, 8, 9)
Table 4. Drought vulnerability parameters and their relationship with drought.
Sl No.ParametersRelationship of Parameters with Drought
1Annual rainfallNegative
2Average temperaturePositive
3EvapotranspirationPositive
4Wet day frequencyNegative
5Total water demandPositive
6Water for all usePositive
7Water use for irrigationPositive
8Gross cropped areaPositive
9Net sown areaPositive
10Cropping intensityPositive
11Irrigation intensityPositive
12Gross irrigated areaPositive
13Net irrigated areaPositive
14Area under forestNegative
15Total ground waterNegative
16Stage of ground water developmentPositive
17Ground water for future irrigationNegative
18Population densityPositive
19Income indexNegative
20Education indexNegative
21Health indexNegative
Table 5. Assigned ranks and weights of each parameter.
ParametersRankWeight
Physical
Annual rainfall10.466
Average temperature20.277
Evapotranspiration30.161
Wet day frequency40.096
Water demand and use
Total water demand10.539
Water for all use20.297
Water use for irrigation30.164
Agricultural component
Gross cropped area10.466
Net sown area20.277
Cropping intensity30.161
Irrigation intensity40.096
Land use
Gross irrigated area10.539
Net irrigated area20.297
Area under forest30.164
Ground water status
Total ground water10.539
State of ground water development20.297
Ground water for future irrigation30.164
Population and development
Population density10.466
Income index20.277
Education index30.161
Health index40.096
Table 6. Area under five drought vulnerability classes.
Drought Vulnerability Based on Physical AspectVulnerability ClassNumber of PixelsArea (%)Area in (km2)
Very low471925.944.25
Low231912.752.09
Moderate348619.163.14
High9445.190.85
Very high672536.966.05
Drought Vulnerability Based on Water Demand and UseVulnerability classNumber of pixelsArea (%)Area in (km2)
Very low414320.763.73
Low9444.730.85
Moderate348617.473.14
High231911.622.09
Very high906645.438.16
Drought vulnerability based on agricultureVulnerability classNumber of pixelsArea (%)Area in (km2)
Very low414320.763.73
Low9444.730.85
Moderate348617.473.14
High231911.622.09
Very high906645.438.16
Drought vulnerability based on land use Vulnerability classNumber of pixelsArea (%)Area in (km2)
Very low289514.512.61
Low219210.981.97
Moderate348617.473.14
High402320.163.62
Very high736236.896.63
Drought vulnerability based on ground water Vulnerability classNumber of pixelsArea (%)Area in (km2)
Very low464925.684.18
Low232712.852.09
Moderate351919.433.17
High9565.280.86
Very high665636.765.99
Drought vulnerability based on population and development Vulnerability classNumber of pixelsArea (%)Area in (km2)
Very low471925.944.25
Low231912.752.09
Moderate348619.163.14
High9445.190.85
Very high672536.966.05
Table 7. Area under integrated drought vulnerability classes.
Vulnerability ClassNumber of PixelsArea (%)Area in (km2)
Very low667929.846.01
Low9404.200.85
Moderate576025.745.18
High16937.561.52
Very high730932.666.58
Disclaimer/Publisher’s Note: The statements, opinions and data contained in all publications are solely those of the individual author(s) and contributor(s) and not of MDPI and/or the editor(s). MDPI and/or the editor(s) disclaim responsibility for any injury to people or property resulting from any ideas, methods, instructions or products referred to in the content.

