Article

Stormwater Uptake in Sponge-Like Porous Bodies Surrounded by a Pond: A Fluid Mechanics Analysis

Fluid Mechanics, Department of Engineering Sciences and Mathematics, Luleå University of Technology, 97187 Luleå, Sweden
*
Author to whom correspondence should be addressed.
Water 2023, 15(18), 3209; https://doi.org/10.3390/w15183209
Submission received: 28 June 2023 / Revised: 28 August 2023 / Accepted: 5 September 2023 / Published: 8 September 2023
(This article belongs to the Special Issue Sustainable Water Management and Treatment)

Abstract

:
In this work, a previously published model for the water up take of stormwater in sponge-like porous bodies by the group is further developed. This is done by investigating the highest-performing model and considering the water uptake from the surroundings of a pond and rain-infiltrated soil. This implies that water uptake from impermeable to partially permeable surfaces is examined. Hence, the following cases are considered: (1) impervious bottom surface and no precipitation, (2) impervious bottom surface with precipitation, (3) permeable soil with no precipitation, and (4) permeable soil with precipitation. A mathematical model covering all these cases is presented, where the governing equations are the mass conservation and Darcy’s law together with an assumption of a sharp wetting front being a first-order approximation of the complete Richard’s equation. Results for the water uptake height, pond depth, and wetting front are computed numerically and plotted against time. Analytical solutions are also presented in certain cases, and critical values are obtained. The parametric study includes variations in the ratio of the model- to the surrounding ground surface area, initial pond depth, precipitation, and soil characteristics. To exemplify, the time it takes to absorb the water from the pond after a precipitation period is presented. The results are related to the Swedish rainfall data of 1 h duration with a return period of 10 years. When evaluating efficiency, the focus is on the absorption time. Results vary considerably, demonstrating a general trend that with soil infiltration, the water absorption rate is higher. For most cases, the considered water amount is absorbed completely, although depending on the parameters and conditions. These results serve to optimize the model for each of the cases. The main focus of the research lies in the theoretical aspect.

1. Introduction

Stormwater storage in urban catchments can be created at various spatial scales [1], starting with the lot scale measures (LSM) and moving towards larger scales in the neighborhood [2,3]. While the capacity of individual lot-level measures is small, they are used in high numbers and serve as “distributed” storage. Furthermore, LSMs are recognized for their educational value, leading to the active participation of the public in stormwater management.
In the search for new LSMs providing distributed storage of water in urban areas, Lundström et al. [1] examined the feasibility of creating dynamic storage of rainwater or stormwater in sponge-like porous bodies (SPB). They proposed two types of such storage structures illustrated in Figure 1a: down-flow SPB storage (Figure 1a,b) and up-flow SPB storage (Figure 1b,c) and demonstrated in numerical experiments that such bodies could fully absorb, in real-time, Swedish design rainfalls of 1 h duration and a return period of 10 years. Note that the SPB storage sketches presented in Figure 1 are intended just to elucidate the theoretical concept of such storage without any aesthetic, practical, or placement considerations. The figure is directly copied from [1].
For the case of down-flow storage SPB, Lundström et al. [1] assumed that during the filling process, driven by diffusion only, SPBs would maintain the original shape. This assumption imposes a limit on the volume of water stored, setting it equal to the volumetric capacity of the original body. In the study by Åkerstedt et al. [4], the effect of swelling was included, with an increased absorbed water volume by an amount of 14%.
The form of the up-flow device in the previous paper [1] was a solid cylinder with two concentric porous media wrapped around the solid cylinder. The solid cylinder may then mimic a tree or lamp post. In the present paper, only one single region with a porous medium is considered since this was found to be more optimal considering the amount of water uptake. The same physical model of the up-flow device as in the paper by Lundström et al. [1] is considered, in which the governing equations are the conservation of mass and Darcy’s law together with an assumption of a sharp wetting front, thus being a first-order approximation of the complete Richard’s equation [5,6]. The study explores various physical scenarios.
The purpose of the present paper is a further the theoretical development of the up-flow SPB storage concept. In the previous paper by Lundström et al. [1] on the up-flow SPB storage, the surrounding area of the pond and rain-infiltrated soil was not considered. In the present paper, a first very simplified 1-D model of the water uptake in an up-flow SPB device is presented with the presence of a surrounding pond, mimicking a flood scenario. This study’s significance lies in assessing the SPB model’s efficiency in absorbing the flood, with a primary focus on factors like absorption time, volume retention, heights from numerical results, and, where possible, analytical expressions. Critical values are also computed, meaning that there exists a limit for which the model is able to absorb. The efficiency computations in the case of permeable soil are also carried out, achieving 86% and 88% efficiency.
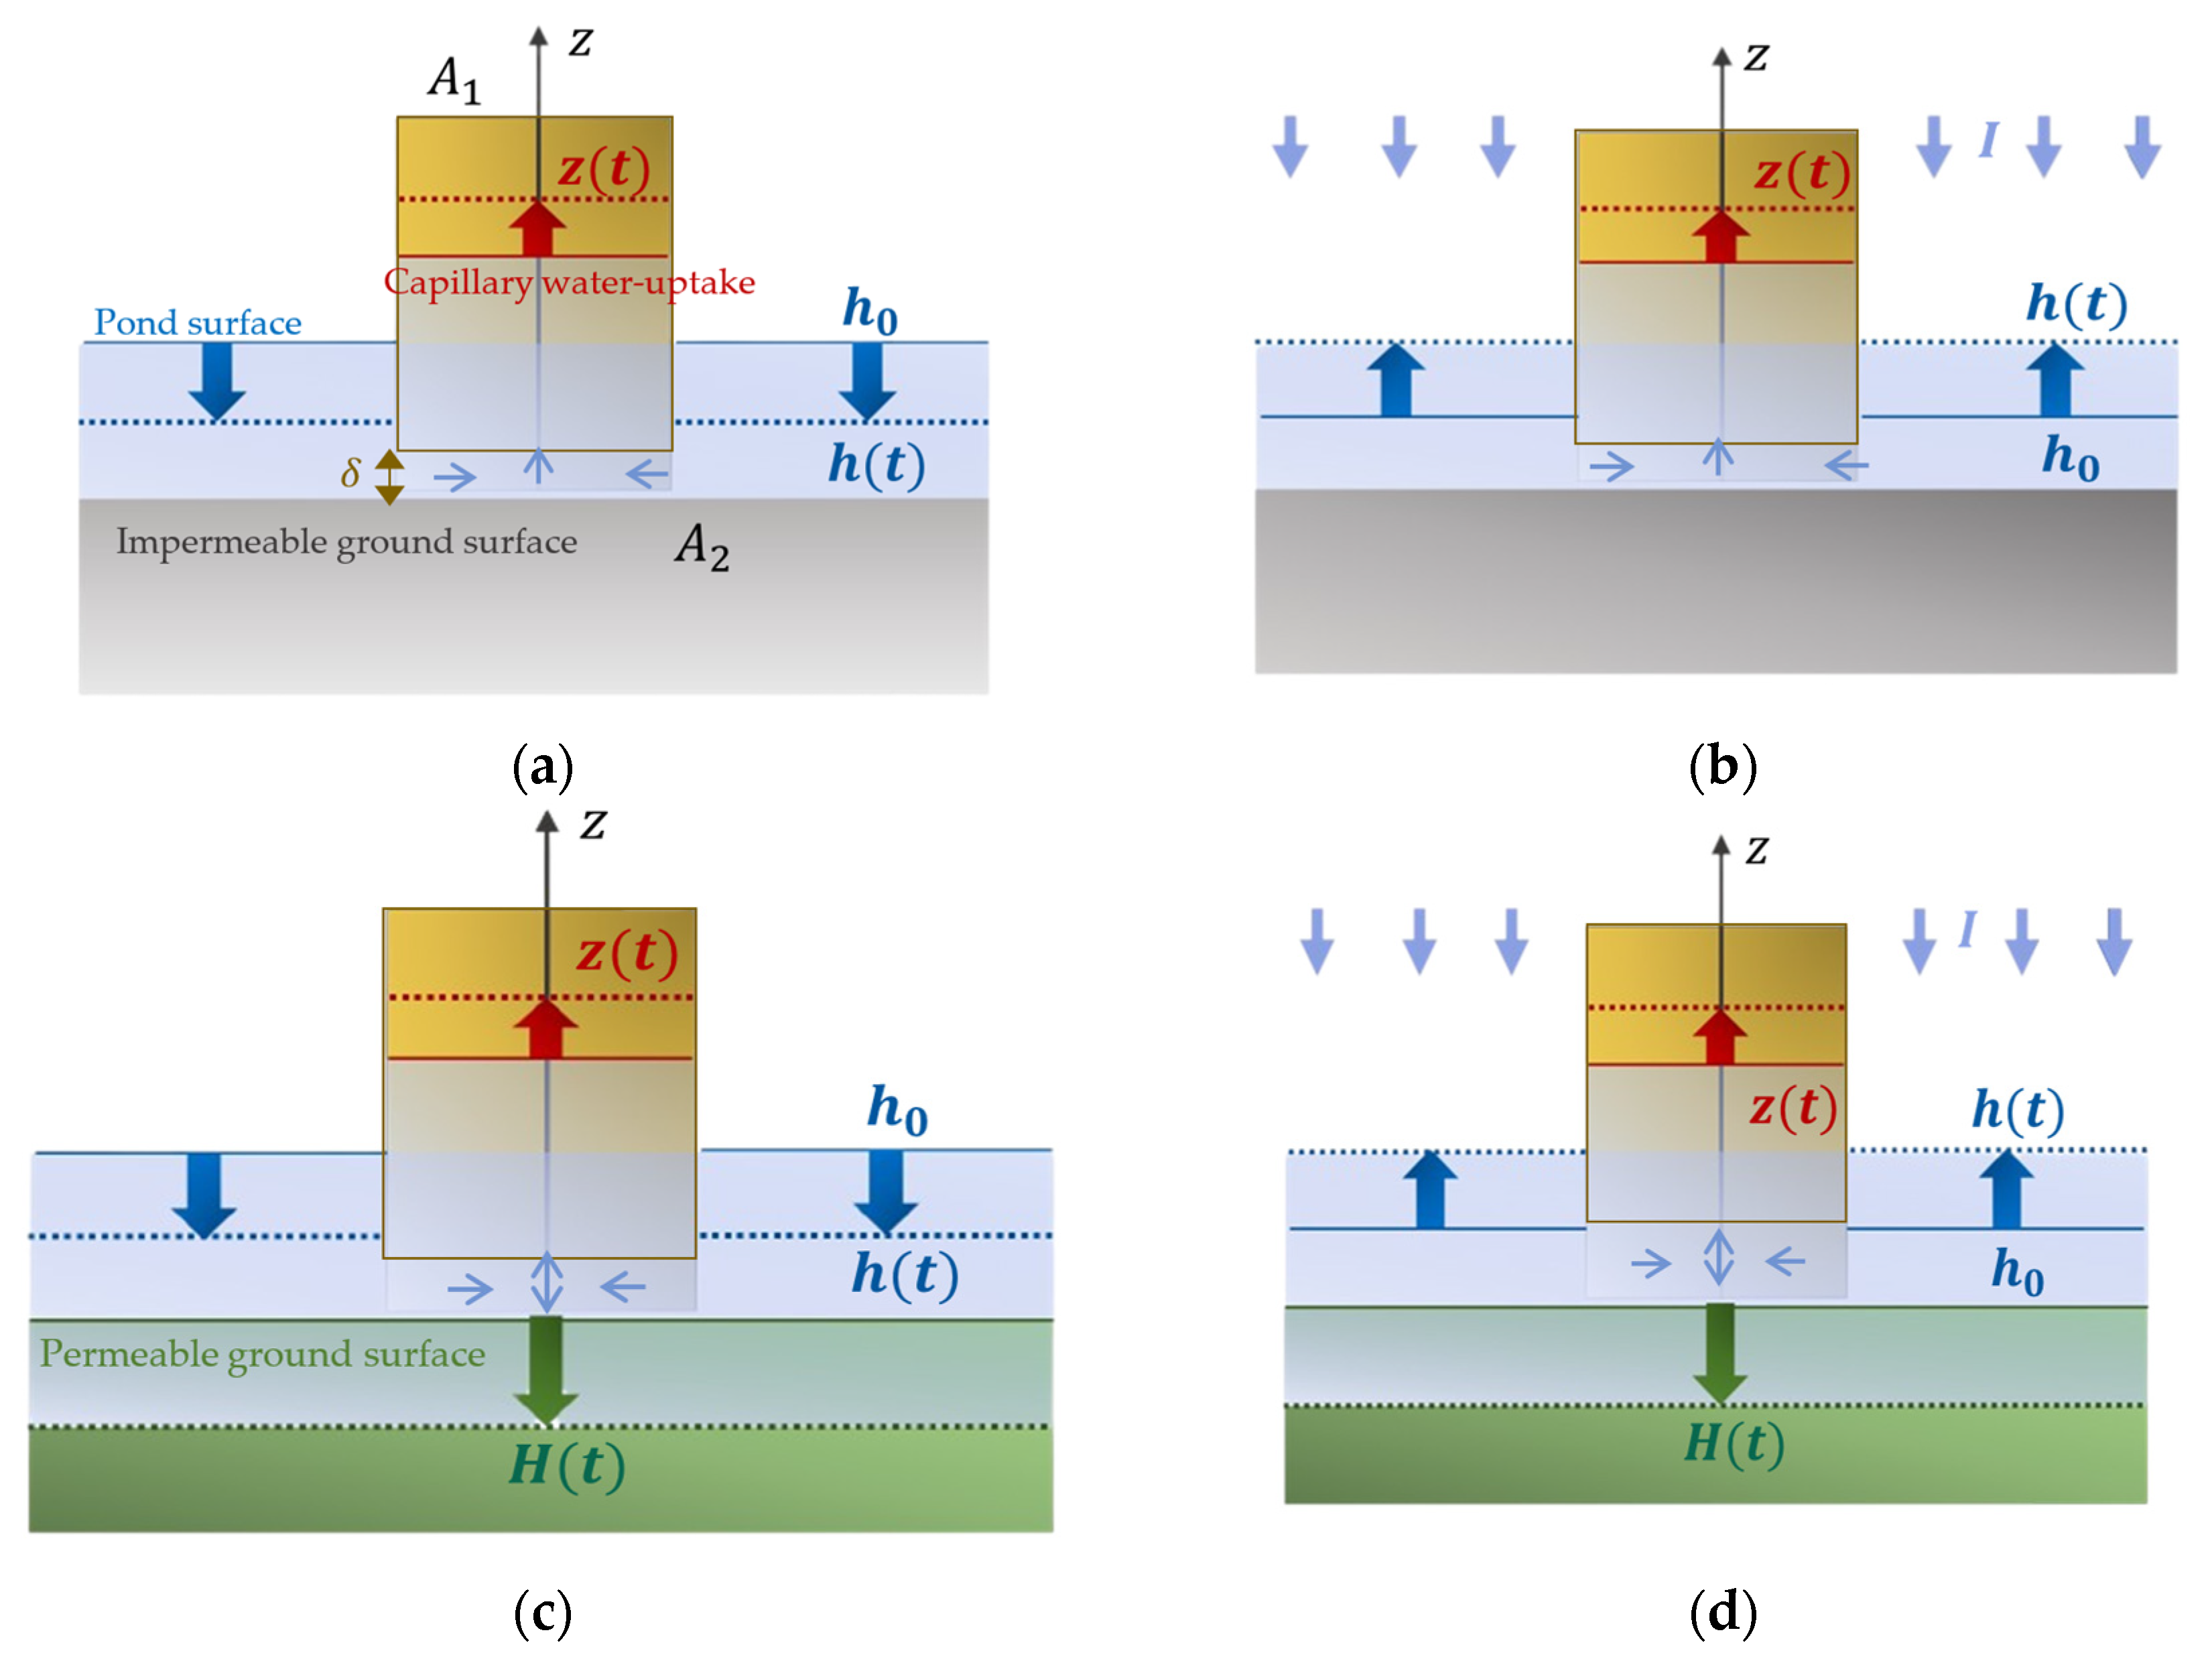
For the theoretical derivation and the obtaining of the parameters and/or their expressions, it is assumed that the model is (i) placed on the impermeable ground without any precipitation, (ii) placed on the impermeable ground with a limited duration of precipitation, (iii) placed on the permeable ground without any precipitation, and (iv) placed on the permeable ground with rainfall lasting for a finite duration of one hour. This is all illustrated in Figure 2. The rationale behind assuming an impermeable ground in the first two cases is to mimic the conditions of urban surfaces, such as asphalt or concrete (e.g., parking lots) while adopting a permeable ground in the last two cases aims to simulate scenarios where the model is positioned on natural surfaces like parks or similar environments. The placement of the model incorporates a narrow gap at the bottom to ensure water absorption. The pond has an initial height o f   h 0 ,   as shown in Figure 2. The color of the ground denotes permeability, whereas the green color indicates that the ground surface is permeable and grey impermeable. Variables h ( t ) represent the pond height ( h ( t = 0 ) = h 0 being the initial height), z ( t ) water uptake height within the model, H ( t ) the depth of the infiltrated water within the completely saturated soil, and the parameter I is the uniform rain intensity. Notation δ represents the gap between the ground and the model. Arrows illustrate the general water movement at arbitrary time t after a certain amount of time has already passed. It is to illustrate the processes studied. When there is no rain and when the soil is impermeable, the model absorbs the pond, and the absorption time can be determined analytically. If the soil is permeable, a portion of the water infiltrates into the ground while the rest is absorbed by the model, and the absorption time is calculated once more. Other parameters are also found, such as the volumes, heights, and critical values, where possible. In the case of rainfall, the pond at first either gradually increases or decreases depending on the intensity of the rain flux. This study examines the long-term behavior of the process, with no special interest in the initial stages.
The paper additionally presents information on the configuration for the up-flow device, encompassing the governing equations that form the basis of the mathematical modeling. The mathematical modeling is explained for each case, considering the precipitation and ground type on which the model is located. A parametric study is conducted to outline the model parameters and establish the necessary values for computing results, such as rain intensity and pond depth. These parameters are based on the referenced source by Lundström et al. [1]. Furthermore, the results for each case are presented, focusing on the analysis of the efficiency of the model by calculating and comparing the absorption time of the surrounding pond. The influence of soil permeability on the efficiency of the model is found to be significant, and this efficiency is quantified accordingly. The model demonstrates higher performance for the absorption time of the pond on permeable soil under rainy conditions as opposed to dry conditions. Finally, a concise discussion is provided, summarizing the comprehensive analysis conducted throughout this study.
This study offers a conceptual overview of the up-flow model in diverse scenarios, accompanied by a detailed mathematical model with specific approximations outlined in the work and its derivations presented in the Appendix A, Appendix B and Appendix C. However, the real-world application and the corresponding technical examinations require further experimental investigations, and it is currently in the early stages of technological readiness. Future experiments aim to assess feasibility and enhance the model’s implementation, though practical technological application is not the primary focus of this study. The main objective was to explore the overall physics and water-uptake behavior of the model in different intended usage scenarios.

2. Mathematical Modelling of the Water Uptake of the Surrounding Pond for Different Conditions

2.1. The Up-Flow SPB Storage Concept

In Lundström et al. [1], the up-flow SPB storage structures absorb the water vertically from the ground. The two variants of such structures, as described by Lundström et al. [1], include (i) the intermediate-height structures, which expand horizontally upon water uptake, Figure 1b and (ii) the low-height structures, which rise from the ground while absorbing the water, Figure 1c. Hydrogel and a specific porous medium are among the storage structure material examples utilized for this purpose [1,7,8].
Since the flow in the porous medium of the SPB is one-dimensional, only the cross-section area matters. The porous medium consists of vertical parallel fibers, and the medium does not deform and does not swell as the surrounding walls of the model are fixed. It is assumed that a narrow gap of negligible height δ exists between the ground and the model, allowing for water absorption into the model. The gap does not impact subsequent analysis, as one can place the coordinate center at the base of the model. Furthermore, the device considered is surrounded by a pond of a finite depth, aiming to replicate the conditions caused by urban stormwater runoff resulting in floods. In focus, the scenarios considered on the effectiveness of the water uptake are: (i) the model is placed on an impervious ground with no precipitation, (ii) the model is placed on an impervious ground experiencing a finite duration of precipitation, (iii) the model is placed on a permeable ground with no precipitation and lastly, (iv) the model is placed on a permeable ground with precipitation of finite duration. The four cases are illustrated in Figure 2a–d, respectively. In the case of permeable soil, various types are investigated, as the nature of the ground itself has an impact on the flood mitigation outcomes.

2.2. Governing Equations

Referring to the modeling of the up-flow SPB water uptake as described in [1], the governing equations are the mass conservation and Darcy’s law (theoretically valid for Reynolds numbers R e 1 [9]). The porous medium consists of vertical parallel fibers. The porous medium does not deform and does not swell as the surrounding walls of the model are fixed, ensuring that the flow is confined, meaning that there is no water flux at the lateral boundaries of the cylindrical model. The fluid flow within the pond is assumed to be inviscid. Further, the fluid motion within the model is assumed to be described by an incompressible viscid, yielding:
· K ^ φ = 0
where φ = p + ρ g z ( t ) is the modified pressure, and K is the permeability tensor. The gravity acts in the in the negative z -direction. Assuming homogeneous and isotropic porous media, Equation (1) becomes the Laplace equation. In general, the flow within the porous medium occurs in a 2D domain. However, the presence of a boundary condition where the radial flux is zero, along with the application of the uniqueness theorem, leads to the solution depending only on the z-coordinate. Consequently, any horizontal flow movements within the model are absent. The main driving mechanism of this confined flow along the fibers is the capillary action:
p c = 2 γ c o s ( Θ ) R
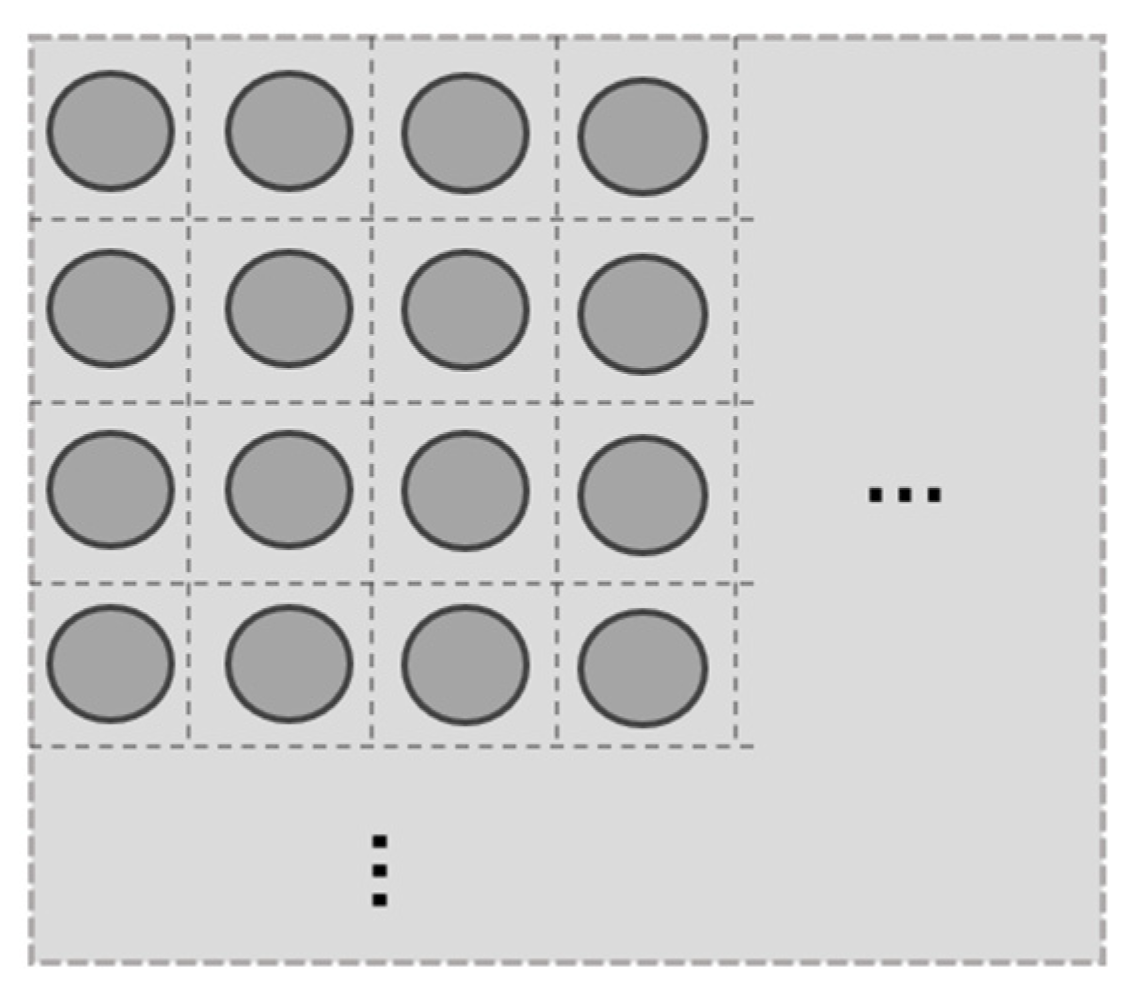
where p c is the capillary pressure, γ is the surface tension, Θ is the contact angle, and R is the pore radius of the porous model. This has already been described in the referenced work by Lundström et al. [1]. It is important to emphasize that in the narrow gap below the cylindrical model, the inviscid assumption is no longer valid, and here, energy losses become important. In hydraulic systems, this kind of energy loss is often included as a single head loss coefficient and can be added in a term similar to the dynamic pressure term. However, as will be shown, the dynamical pressure term is only of significance for the initial stages of the process. This is also detailed in Appendix B. Since the long-term analysis is of interest, this particular energy loss may be disregarded in further analysis. The flow within the pond occurs in a 2D domain, allowing for horizontal movements. However, the horizontal flow movements may be diminished due to two factors: Firstly, the zero-flux boundary condition to the storage device, and secondly, the periodic arrangement of storage devices as depicted in Figure 3, which simulates an outer no-flux condition between neighboring storage devices. Hence, in further analysis, horizontal movements within the pond shall be neglected. It is important to highlight that there is a small gap between the soil and the model, ensuring no contact or water transfer from the soil to the model. Additionally, the flow in the gap becomes significant only during the initial phase of the process, where the dynamical terms, energy losses, and horizontal movement within the gap must be included. However, the analysis performed in this study primarily focuses on long-term processes, allowing us to analyze the water movements as one-dimensional.
For the infiltration of water within the soil, i.e., the cases illustrated in Figure 2c,d, a sharp wetting front is assumed [10], which is a first-order approximation of the more complete Richard’s equation, Equation (3) [11,12], hence the following equation is applied:
θ t = · [ K θ ( Ψ z ) ]
where θ is the water content, and Ψ z   is the total energy potential. Behind the wetting front, it is assumed complete saturation of the soil [13,14]; thus, Equation (3) transforms into the Laplace equation [15]; further details may be found in Appendix C. The waterfront within the soil is assumed to be planar [13]. It is further assumed that the domain extends infinitely on the ground surface and is divided into an infinite number of regularly shaped cells. This division ensures that due to the symmetry, there is no water exchange at the boundaries, meaning there is zero flux, ensuring that there is no horizontal flow. This is illustrated in Figure 3.
In addition to Equations (1)–(3), describing the physics of the flow, the conservation of volumes needs to be established in a more general scenario:
I t A 2 = z t Φ 1 A 1 + h t h 0 A 2 A 1 + H t Φ 2 A 2
where I is the rainwater inflow velocity, h ( t ) the pond height and h 0 = h 0 initial pond height, z t the height that has been reached within the up-flow model and H t the depth of the water within the soil.
For each of the cases, the conservation, Equation (4), is adapted accordingly. Furthermore, Φ 1 is the up-flow model porosity and Φ 2 the soil porosity. A 1 denotes the inlet surface area of the up-flow model and A 2 denotes the surface area of the surrounding soil. In the further analysis, r = A 1 A 2 , is the ratio of these areas. It is important to note that in the given context, index 2 refers to the soil, while index 1 pertains to the up-flow model.
A comprehensive mathematical model is presented for each of the cases. The details of the derivations are provided in Appendix A.

2.2.1. Mathematical Modelling for Case 1

In the first configuration, Figure 2a, the up-flow model is placed on top of the impermeable soil, and there is no rainfall, i.e., I = 0 . The full cylindrical up-flow model is encompassed by a pond. At the initial stages of the absorption process t 0 , the initial conditions are set to:
h t = 0 = h 0 ,       z t = 0 = 0
As time progresses t > 0 , the water is absorbed into the model, leading to a reduction in the height of the surrounding pond. The associated processes are described by the following set of equations:
z d z d t = ρ g K 1 μ Φ 1   p c 1 ρ g + h 0 1 1 Φ 1 r 1 r z 1 2 g z ˙ 2 1 Φ 1 r 1 r 2            
h ( t ) = h 0 Φ 1 r 1 r z t
Hence, solving Equations (6) and (7) yields z t and h t . During the initial stages, the inclusion of the dynamical pressure term is crucial in addition to the hydrostatic pressure. It is the last term in Equation (6). Without considering the dynamical term and with zero initial conditions z t = 0 = 0 , a singularity arises, namely z ˙ t = 0 (explained in Appendix A). This paradoxical issue is solved with the dynamical term yielding z ˙ t = 0 = 0 . Notice that the dynamical term is only relevant during the initial moments of the process, during extremely short instances, when t 0 .
By integrating Equation (6) and ignoring the dynamical term, it is possible to analytically derive an expression for the time required to completely absorb the surrounding pond, T a p , according to:
T a p = μ Φ 1 ρ g K 1 1 r 1 1 Φ 1 r 1 r 1 1 Φ 1 r   z c 1 + h 0 ln Φ 1 r z c 1 + h 0 Φ 1 r z c 1 + h 0 ( 1 r ) 1 1 Φ 1 r h 0 1 r Φ 1 r h 0
where z c 1 = p c 1 ρ g . The analytical expression, considering the dynamical term, is also derived in Appendix A; however, as explained earlier, this term is only significant when t 0 , and does not affect T a p .

2.2.2. Mathematical Modelling for Case 2

In the second configuration, Figure 2b, the model is still surrounded by a pond, and the soil is still impermeable. Unlike in the previous case, the current configuration involves a precipitation event of a finite duration period T . Initial conditions are set to be the same as in Equation (5). During the rainfall t [ 0   T ] , the initial change in the pond height, either an increase or decrease, depends on various factors such as the model geometry scale, rain intensity, etc. After the rain has stopped, i.e., t > T , the process of absorbing the surrounding pond remains the same as in the previous scenario with a difference in the initial conditions:
h t = T = h 1 ,       z t = T = z 1
Taking all of this into consideration, a mathematical model can be developed describing the underlying process as follows:
z d z d t = ρ g K 1 μ Φ 1   z c 1 + h 0 + I t ( 1 ( 1 Φ 1 ) r ) z 1 r 1 2 g z ˙ 2 1 Φ 1 r 1 r 2 ,   t ϵ [ 0   T ]
h t = h 0 + I t Φ 1 r z ( t ) 1 r ,   t ϵ [ 0   T ]
z d z d t = ρ g K 1 μ Φ 1   z c 1 + h 1 + Φ 1 r z 1 ( 1 ( 1 Φ 1 ) r ) z 1 r 1 2 g z ˙ 2 1 Φ 1 r 1 r 2 ,   t > T
h t = h 1 Φ 1 r 1 r z t z 1 ,   t > T
It is also possible to derive the absorption time analytically, representing the duration of the model to completely absorb the water from the moment the rain has stopped t [ T   T a p ] in the following way:
T a p = μ Φ 1 ρ g K 1 1 r 1 1 Φ 1 r z c 1 + h 1 + Φ 1 r 1 r z 1 ( 1 r ) 1 1 Φ 1 r   ln z c 1 + h 1 z 1 z c 1 z 1 1 r Φ 1 r h 1 1 r Φ 1 r h 1 + T

2.2.3. Mathematical Modelling for Case 3

In the third configuration, Figure 2c, the model is placed on a permeable soil, but there is no precipitation. The initial conditions for the third case are:
h t = 0 = h 0 ,   z t = 0 = 0 ,   H t = 0 = 0
By incorporating the advancing wetting flow front into the soil with an approximated Richards equation, the following mathematical model is derived:
z d z d t = ρ g K 1 μ Φ 1 z C 1 + h z 1 2 g z ˙ 2 Φ 1 r z ˙ + Φ 2 H ˙ 1 r 2
H d H d t = ρ g K 2 μ Φ 2 z C 2 + h + H 1 2 g H ˙ 2 Φ 1 r z ˙ + Φ 2 H ˙ 1 r 2  
h ( t ) = h 0 Φ 1 r z ( t ) + Φ 2 H ( t ) 1 r
The set of coupled Equations (16)–(18) are solved numerically in MATLAB.

2.2.4. Mathematical Modelling for Case 4

For the last configuration, Figure 2d, the soil is considered to be permeable, and there is precipitation in the time duration t [ 0   T ] . The initial conditions are set as in Equation (15). Analogously to case 2, a set of equations to model the process during the rainfall period are formed, and a separate model is used after it has stopped raining. Equations (16) and (17) remain unchanged, while the conservation Equation (18) is altered accordingly:
h ( t ) = h 0 + I t Φ 1 r z ( t ) Φ 2 H ( t ) 1 r ,   t ϵ [ 0   T ]
h ( t ) = h 1 Φ 1 r z ( t ) z 1 + Φ 2 H ( t ) H 1 1 r ,   t > T
where h t = T = h 1 , z t = T = z 1 and H t = T = H 1 .

2.3. Parametric Study

For plotting results and conducting efficiency studies, the relevant parameters and their corresponding values for each of the configurations are briefly explained. The model itself is based on the up-flow model described in [1], and as such, the parameter values are directly extracted from the corresponding table of parameters for up-flow SPB provided in the reference: the radius of the model cylinder is taken to be a = 0.1   m , the porosity being Φ 1 = 0.7 and the geometrical scale of the porous media R = 10   μ m .
Table 1 provides an overview of the three types of soil considered in the current study: sand, silty soil, and clay. The selection of soil types is based on soil content statistics specific to Sweden, obtained from a digital soil map of Sweden [16]. To determine the porosity and capillary pressure values, the article by Detmann [17] is used as a reference, selecting the following soil groups: medium sand, strong clayey silt, and pure clay. The capillary pressure under a complete saturation assumption has a uniform value of 1   k N / m 2 for all soil types [17]. As for the permeability coefficients of the selected soil types, several literature sources are applied [18,19,20,21].
The information regarding rain intensity is gathered from the previous study conducted by Lundström et al., as presented in Table 2 [1]. Inflow data is obtained from the local rainfall regime, Olsson et al. [22]. To facilitate analysis, the value commonly employed for analysis purposes will be the rain intensity of 0.68 · 10 5 [m/s per unit area] with an average duration of one hour. However, variations in rain duration, intensity, and other factors will be explored to observe their effects on the results. Table 2 provides the precipitation information, although the preceding rainfall will not be included in the analysis as the model has been initially derived for the uniform rain conditions.
In the next results section, the necessary graphs are generated by varying the parameters of primary interest, namely the initial flood height and the model porosity values. These variations will allow an analysis of the impact of these parameters on the results. In the previous work [1], the effect of the porosity values on the efficiency is discussed briefly. Clearly, increasing the porosity enhances the water uptake and overall performance. However, a more detailed analysis will be conducted to examine the effects of porosity across different configurations and how it has an impact on the performance under different circumstances. The values of the porosity are taken to be the same as in the previous paper study [1].
The depth of the surrounding ponds, representing the simulated flood, is derived from a case study conducted in Malmö, Sweden, by Haghighatafshar et al. [18]. The study specifically examines the possibility of the reduction of stormwater floods and has generated a flood map of the Augustenborg area (year 2014). After selecting the appropriate values for the initial pond height, together with the corresponding porosity values, they are placed in Table 3 below.

3. Results

Results for case 1 are outlined in Section 3.1, while those for case 2 are presented in Section 3.2. For cases 3 and 4, the results are discussed in Section 3.3. The numerical calculations are conducted in MATLAB utilizing the ode45 function with a tolerance of 1 × 10⁻¹⁰ (the function relies on the fourth-order Runge–Kutta method). Unless otherwise specified, the results are primarily presented for r = A 1 A 2 = 0.35 ,   ϕ = 0.7 ,   h 0 = 0.5   m and I = 0.68 · 10 5   m/s per unit area with an average duration of T = 1   h .
It is important to emphasize that since the mathematical modeling is based on ratios rather than explicit surface values, the surfaces involved can be chosen arbitrarily. However, it should be noted that explicit surface values do play a role when calculating volumes. For the analysis of uptake height, pond height, and water depth in the soil, r is the key consideration and not the actual geometry. This aspect is intriguing as it allows for different design choices. However, in this study, the cylindrical design is employed. The design parameters and values are chosen to ensure the model’s compactness, as SPBs are intended not to interfere with their environment while retaining effective absorption capacity.

3.1. Case 1

Based on the mathematical modeling for case 1 in Section 2.2.1, it is possible to plot the variations of the water column height and the pond height over time. Analogously, the same applies to the computation of the corresponding volumes, namely the volume of water uptake and the volume of the pond, which can be depicted as a function of time according to:
V z ( t ) = Φ 1 A 1 z ( t ) ,   V h t = ( A 2 A 1 ) h ( t )
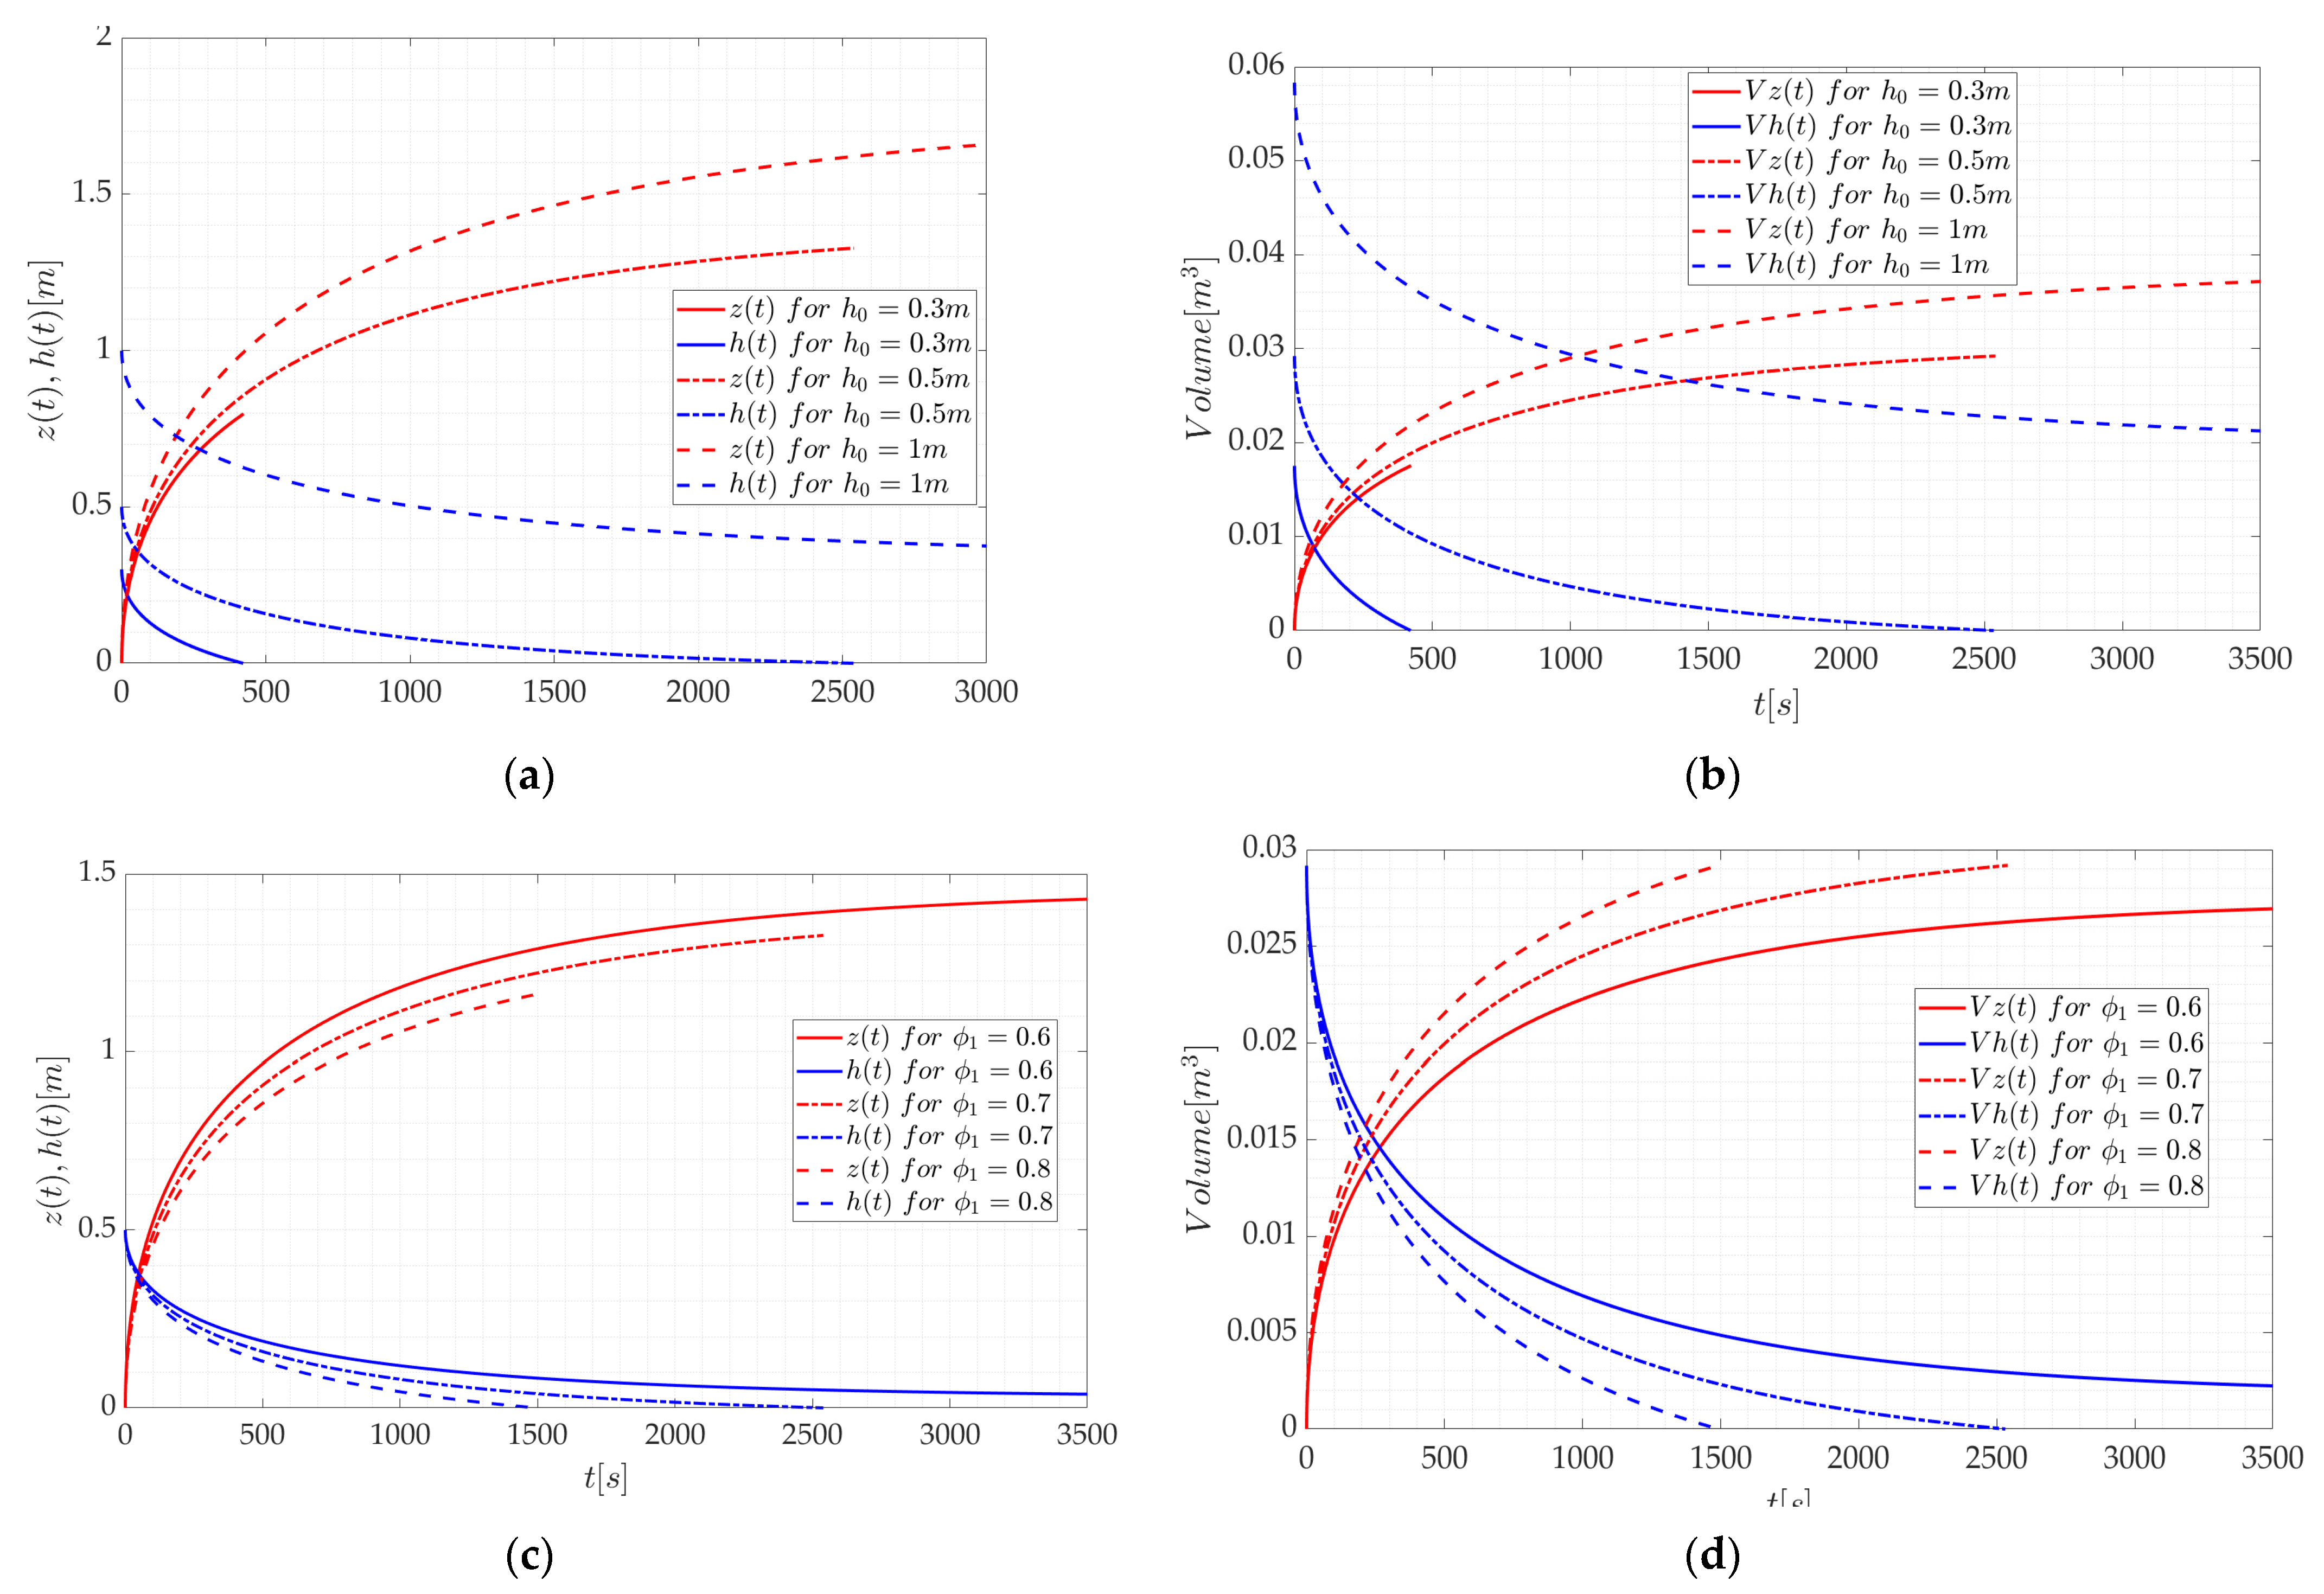
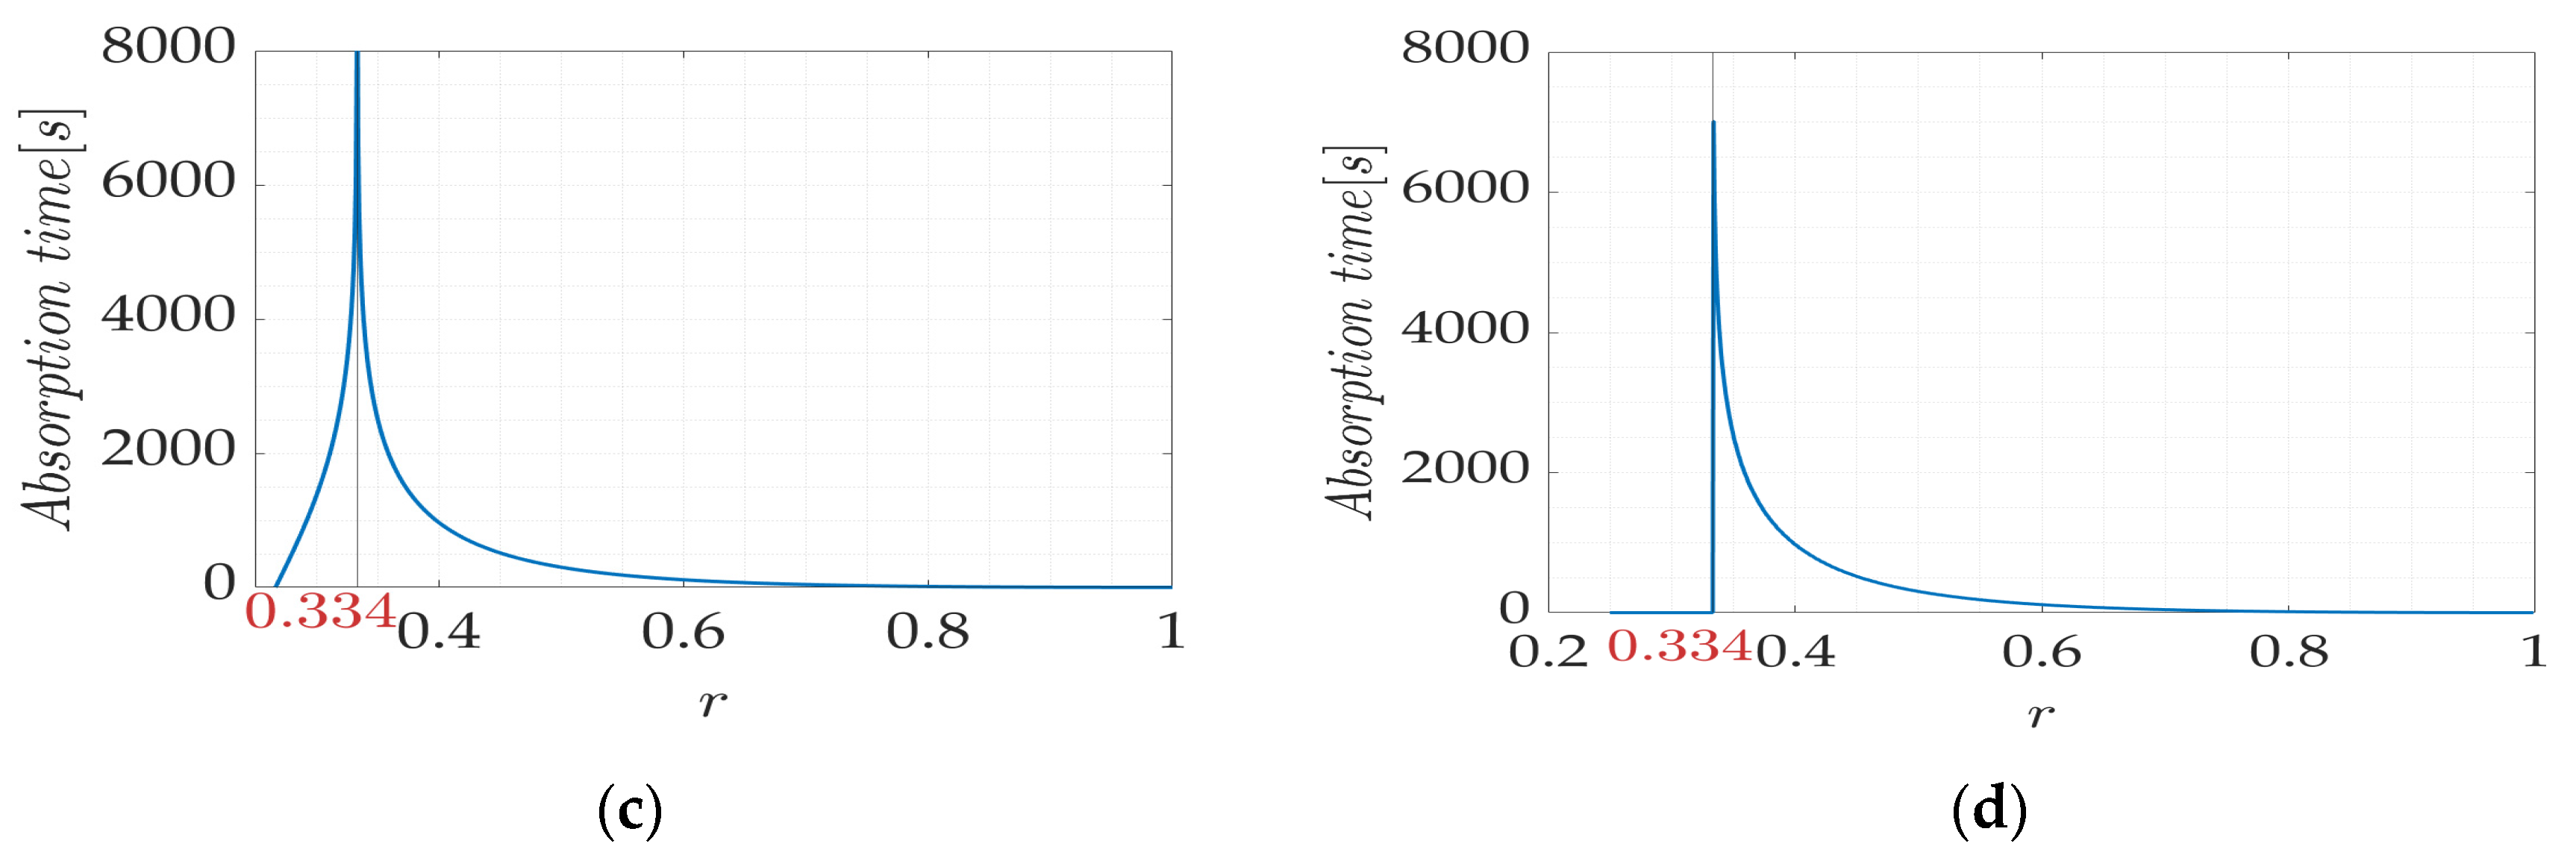
To examine the effectiveness of the up-flow model, the initial pond height is altered using the values presented in Table 3, keeping the porosity constant at 0.7. Based on the results obtained in Figure 4a,b, it can be concluded that for larger initial depths, the time taken to absorb the surrounding pond (i.e., h T a p = 0 ) increases up to a certain value of h 0 = h c r i t i c a l . Beyond this initial critical value h 0 = h c r i t i c a l , the flood will not be completely absorbed, h t > 0 ,   t . This would mean that the model has a capacity of maximum flood absorption equal to the critical one. This behavior aligns well with the analytical expression for T a p in Equation (8). It is possible to graphically represent the analytical expression for the absorption time, as demonstrated in Figure 5a. Evidently, the values will progressively increase until they reach the critical value h c r i t i c a l 0.54   m (i.e., the asymptote of the function). An exact analytical expression for this critical value can be derived by considering the condition in Equation (8) that the denominator in the logarithmic function must be greater than zero:
h 0 = h c r i t i c a l = Φ 1 r 1 r z c
Figure 5b presents the graph following the numerical computation of Equations (6) and (7), which is exactly in line with the analytical one.
Results, when altering the porosities according to Table 3 (with constant h 0 = 0.5   m ) are presented in Figure 4c,d. A general trend is observed: as the porosities increase, there is a corresponding decrease in the time required for absorbing the surrounding pond. This indicates that with larger contact surface areas, there is an enhanced capacity for water uptake. Once again, there is a critical value for a complete water up-take, this time related to the porosity. Similar to the critical initial pond height value, this value can be determined using the same analogy and reasoning, i.e., ϕ c r i t i c a l 0.65 . Nevertheless, as the porosity continues to decrease below the critical value, the model will no longer be capable of fully absorbing the surrounding pond.
The same analysis applies to the ratio, with the analytical plot displayed in Figure 5a and the numerical plot shown in Figure 5b. As the ratio increases, indicating that the model occupies more of the surrounding space, the time required for absorbing the pond notably decreases. However, below the critical value, the model will only absorb water up to a certain height, leaving the remaining pond intact.
Returning to Figure 5a, an interesting observation can be made: the graphs depicting the analytical expression with and without the inclusion of dynamical pressure remain precisely aligned. This reaffirms the previous statement that the dynamic pressure has minimal impact on the results, except in very brief instances. Consequently, in subsequent studies and analyses, the dynamic pressure will be disregarded.

3.2. Case 2

In this case, the analysis incorporates uniform rain with an average finite duration of one hour ( T = 3600   s ).
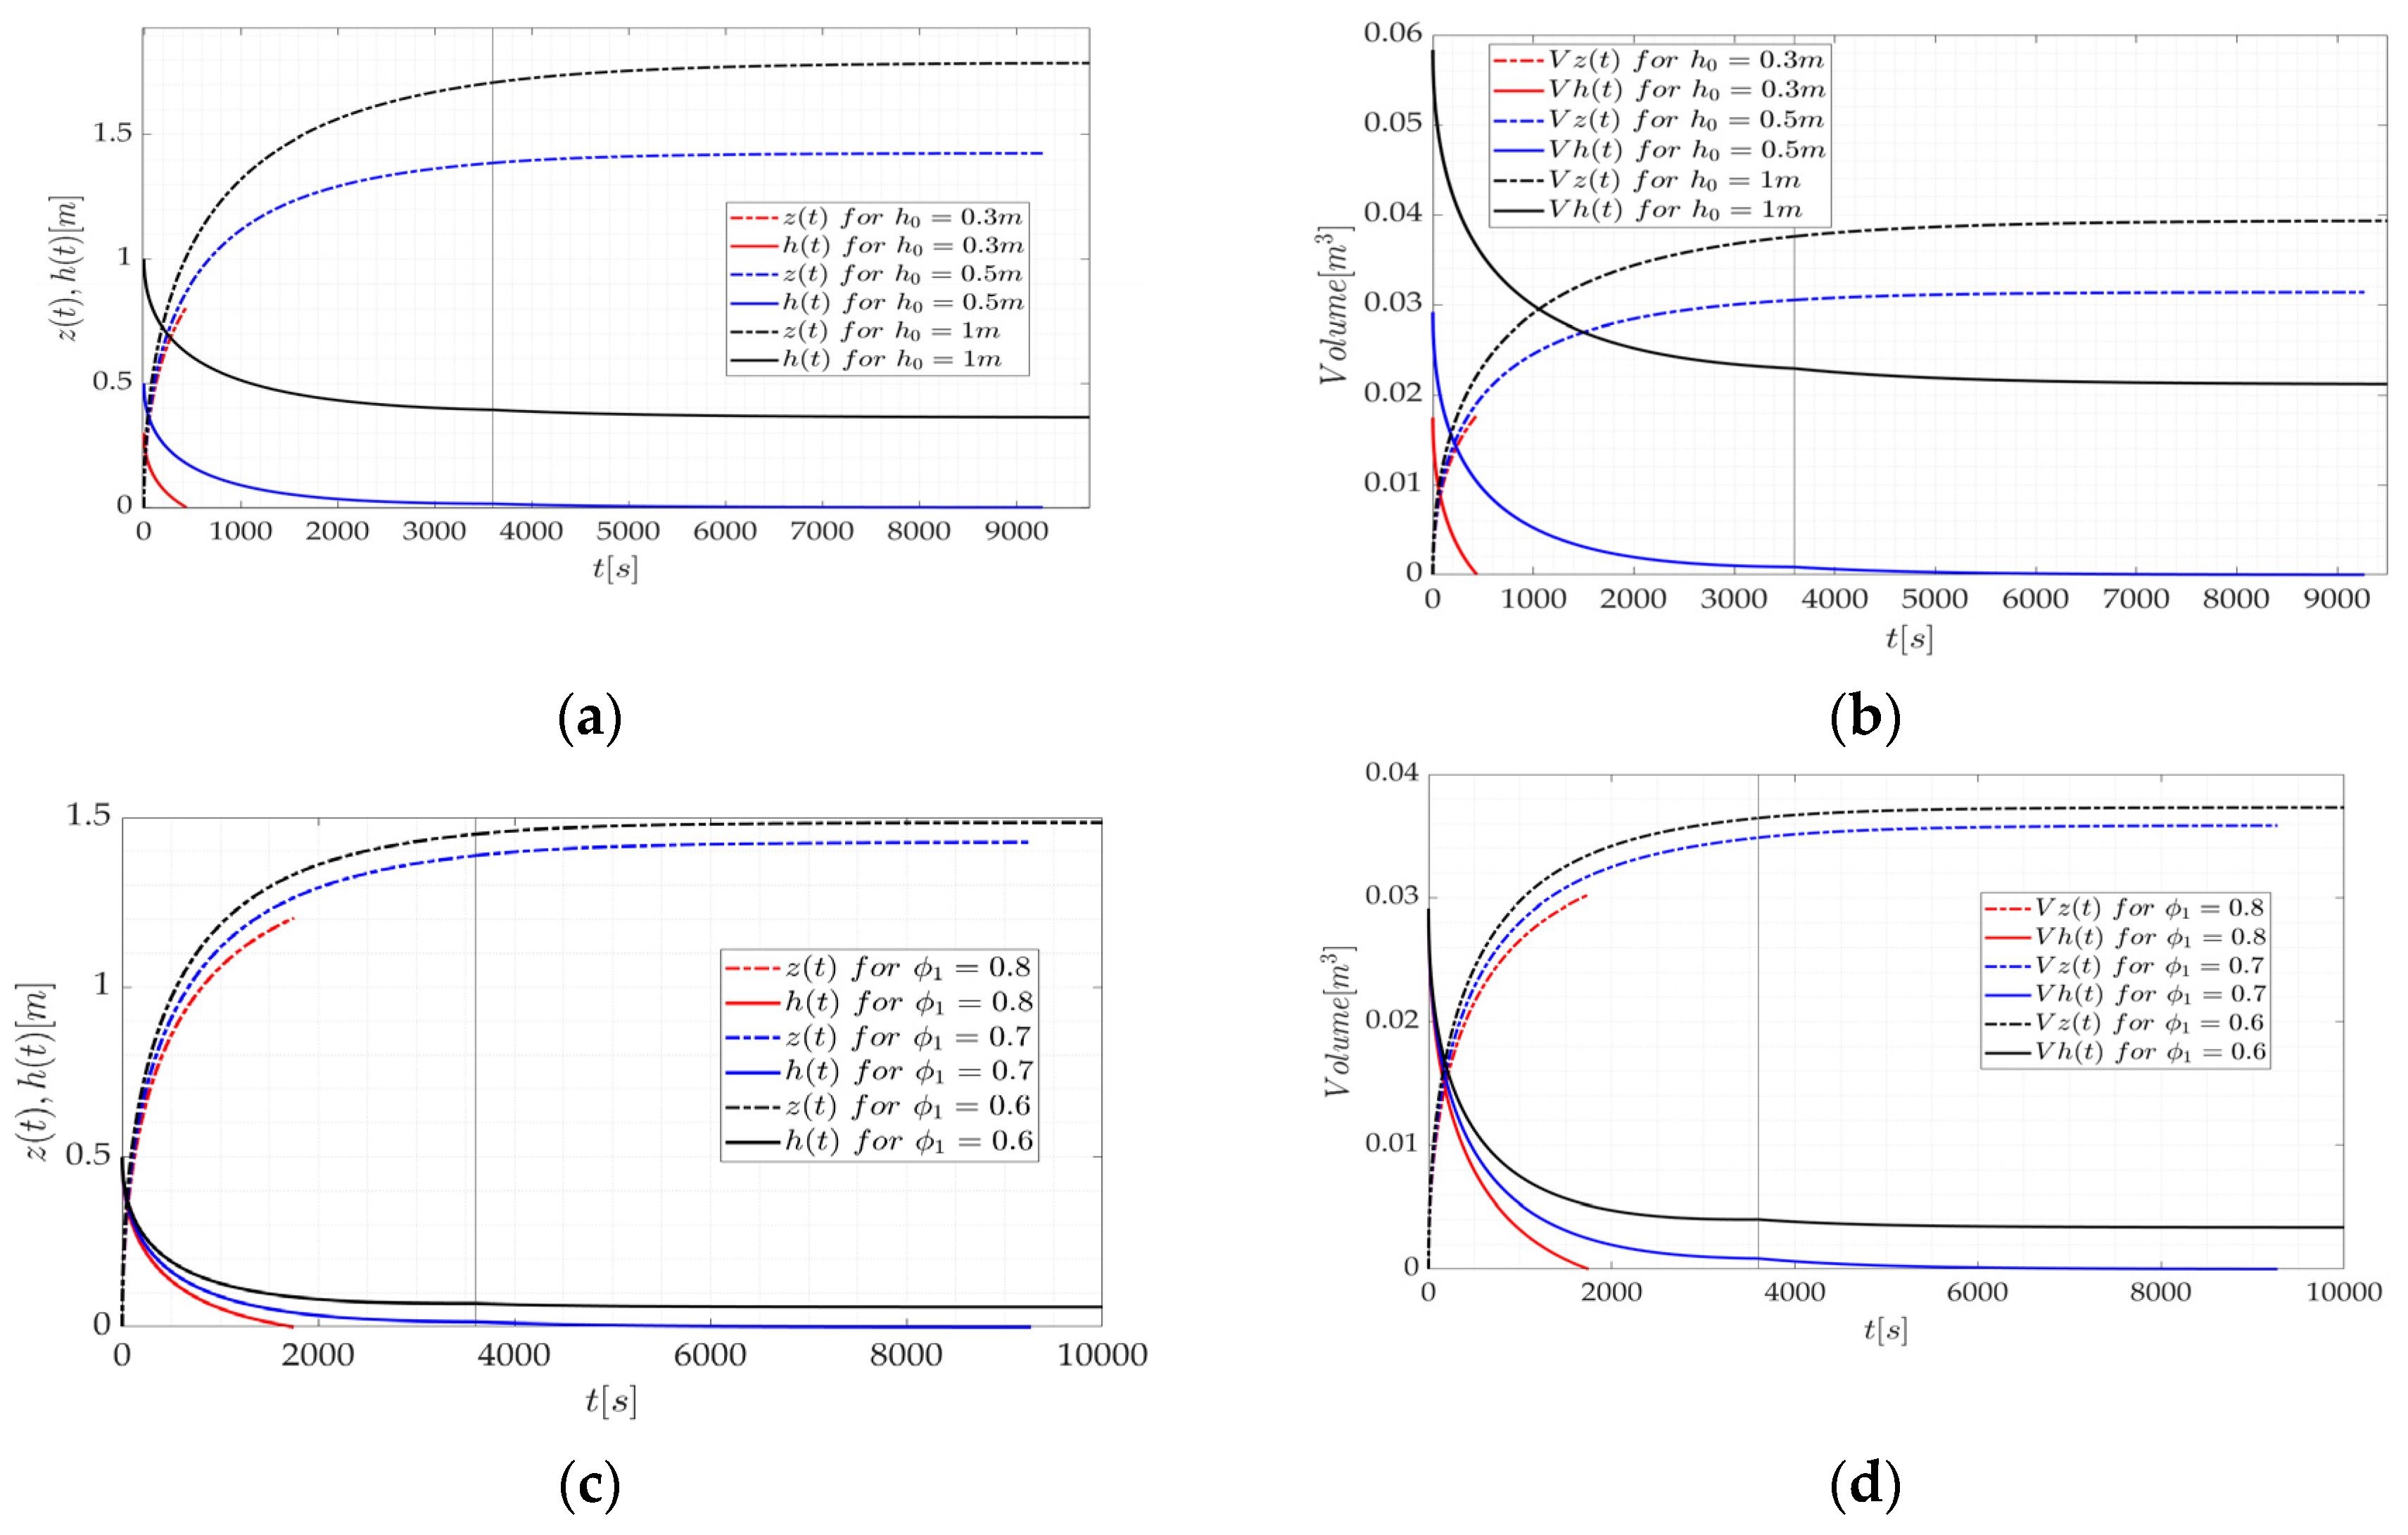
As before, the water column height and pond height are plotted against time, along with their respective volumes, as depicted in Figure 6. In Figure 6a,b, the initial pond depth is varied with the constant porosity value of 0.7. Notably, for a smaller depth of 0.3 m, the presence of rain has a minor impact on the absorption. However, for a depth of 0.5 m, the difference is significant compared to the one in case 1. The rain now plays a crucial role in prolonging the absorption time (in case 1, approximately 2500 s, while in case 2, it exceeds 9000 s). Similarly, in case 1, when the flood height reaches 1 m, the critical value for height is surpassed, resulting in incomplete absorption of the flood. Analogously, by altering the porosities (with constant h 0 = 0.5   m ), an increase in the values leads to a delay in the absorption time compared to the one in case 1.
Computing the absorption time analytically becomes considerably more challenging during the precipitation period, i.e., t   ϵ   [ 0   T ] . However, once the rainfall has ceased, the expression for the absorption time aligns with that of case 1. In this case, the absorption time is determined by calculating the difference between the time at which the pond is completely absorbed and the duration of the rainfall: T a p = t h = 0 T . The only distinction when deriving the expression lies in the initial conditions h t = T = h 1 , z t = T = t 1 (Section 2.2.2). Equation (14) presents the analytical expression, and following a similar approach to the one in case 1, the expression for the critical height is obtained as:
h 1 = h c r i t i c a l = ( z c z 1 ) Φ 1 r 1 r ;
The results are computed numerically and plotted in Figure 7c,d. Notably, the critical ratio value appears to be larger in case 2 than the one observed in case 1. This discrepancy can be attributed to the additional volume introduced by the rain, necessitating a slightly larger surface area to facilitate the complete absorption of the pond.
It is also noteworthy to observe the implications of modifying the rain intensity during its one-hour duration. Figure 7a,b presents the results corresponding to these variations. The intensity values used for analysis are sourced from Table 2, with the assumption of uniform rainfall for all the cases to facilitate meaningful comparison. As anticipated, an increase in the intensity of rainfall corresponds to a longer absorption time of the pond. Once the critical threshold for the intensity value is surpassed, the model becomes incapable of fully absorbing the surrounding water.
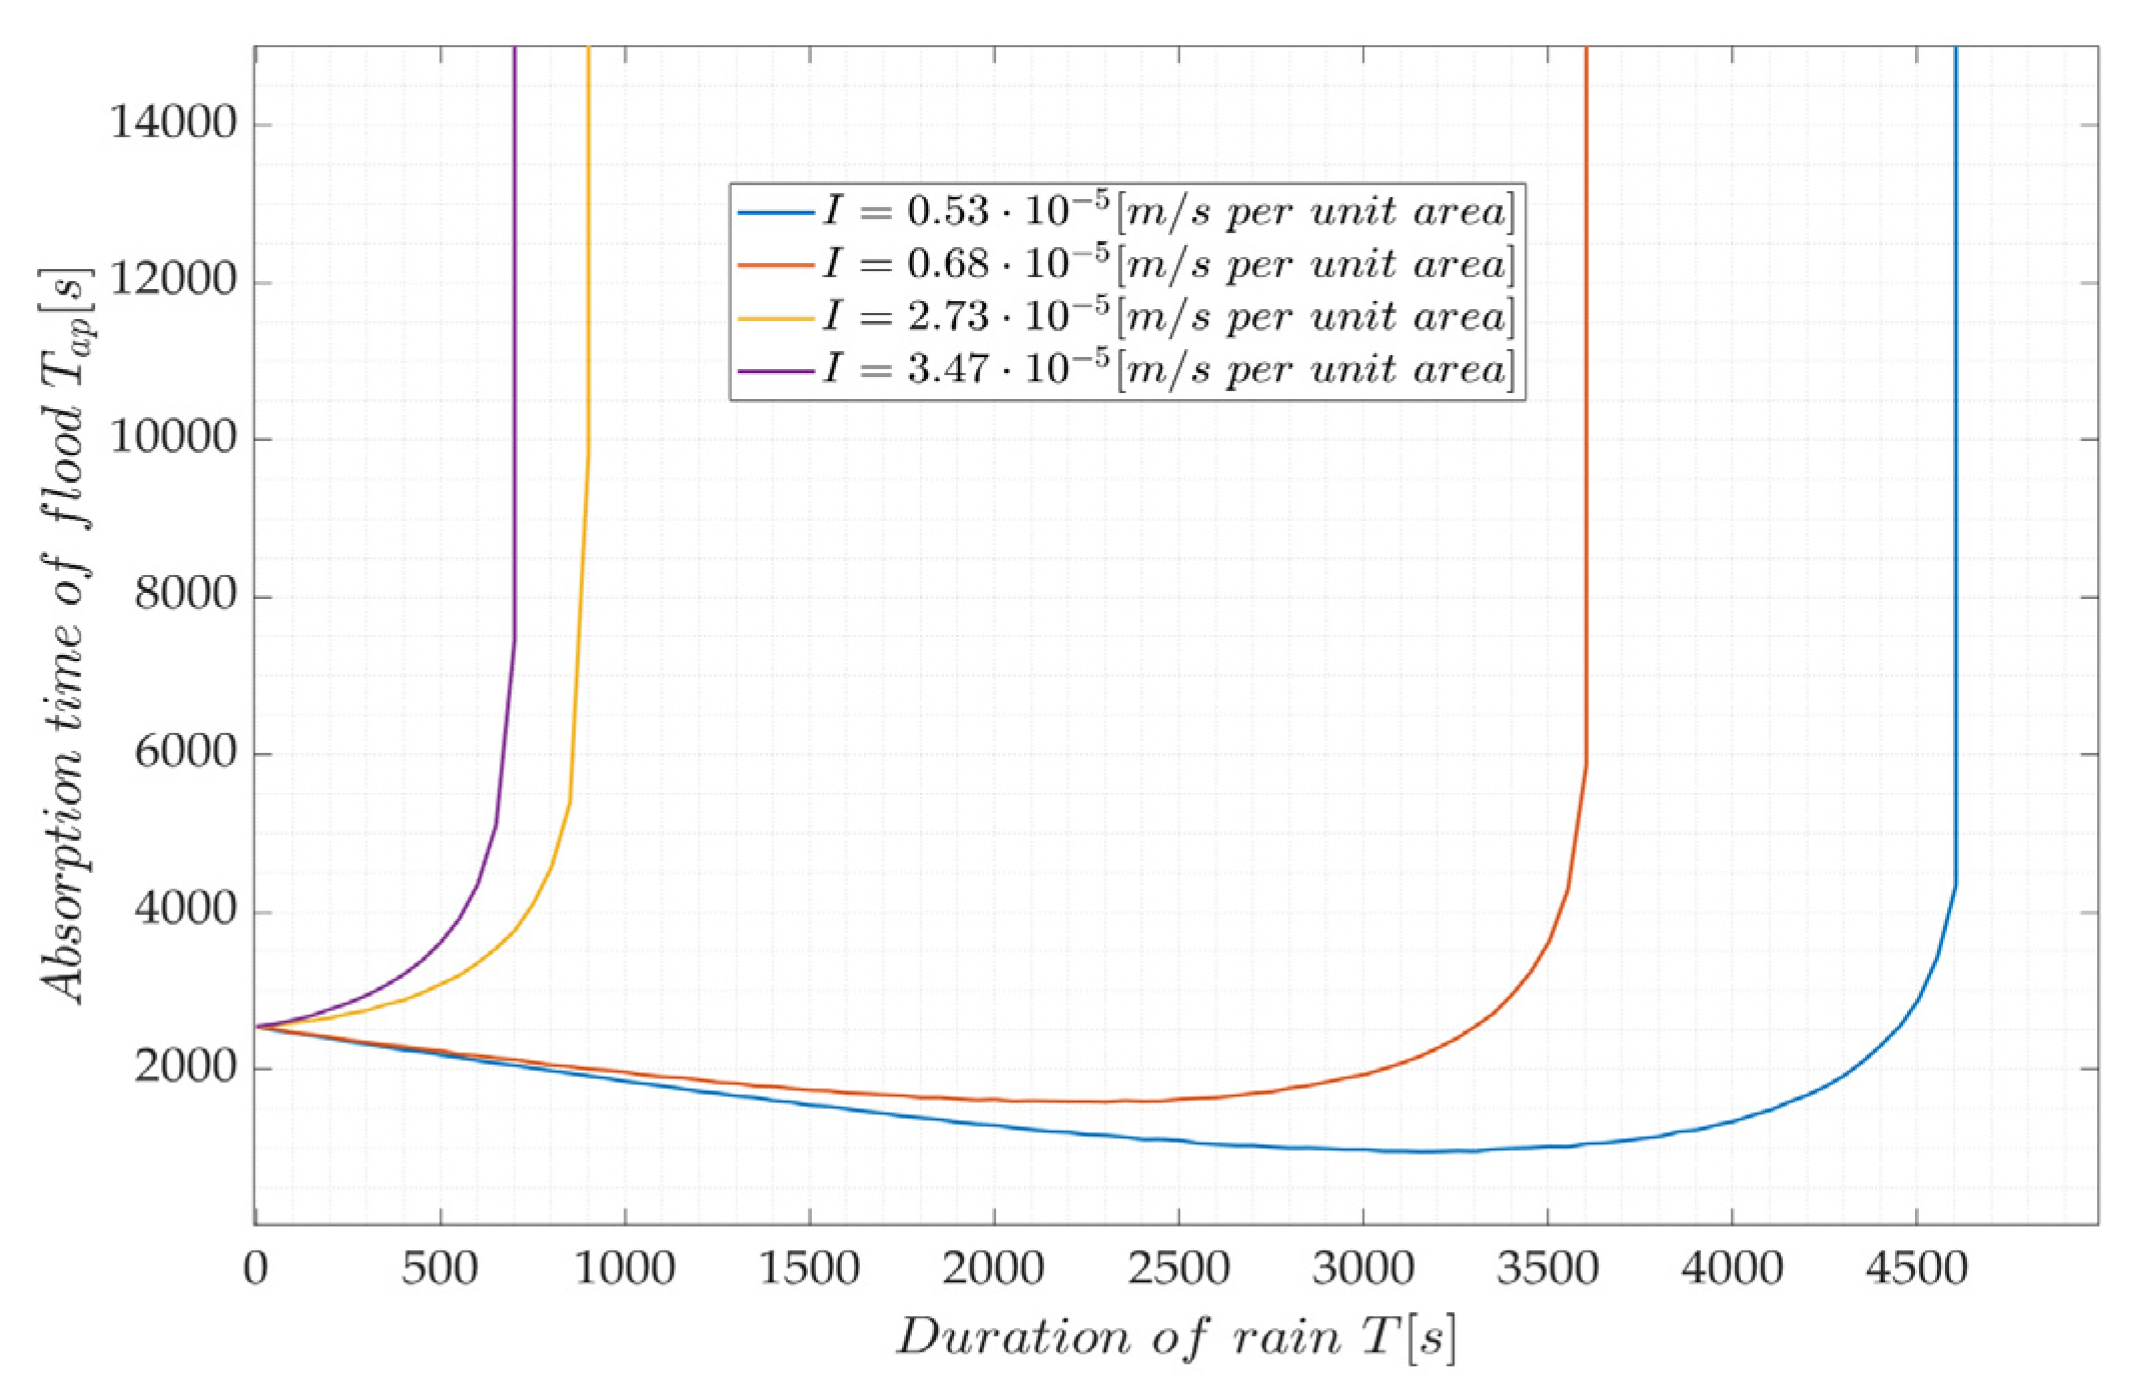
In addition to altering the rainfall intensity, it is also important to study variations in the duration of the rain. While the average duration taken in this study is one hour, it is interesting to explore how the absorption time is affected when the rainfall lasts longer or shorter than this. Graphs depicting the absorption time in relation to the rain duration are plotted for different rain intensities in Figure 8, providing insights into this relationship.
It is apparent that for each rain intensity, there exists a critical value of rain duration beyond which the model cannot fully absorb the flood. Naturally, higher-intensity rain reaches this critical rain duration value sooner compared to lower-intensity rain: after 500 s, it becomes evident that higher rain intensities have substantially increased the flood height. At t = 0   s , the absorption time is equivalent to that of case 1, approximately 2500 s. As a reminder, the definition of the absorption time for case 2 is that it is calculated starting from the moment when the rainfall has ceased until the time the pond has been fully absorbed.

3.3. Case 3 and Case 4

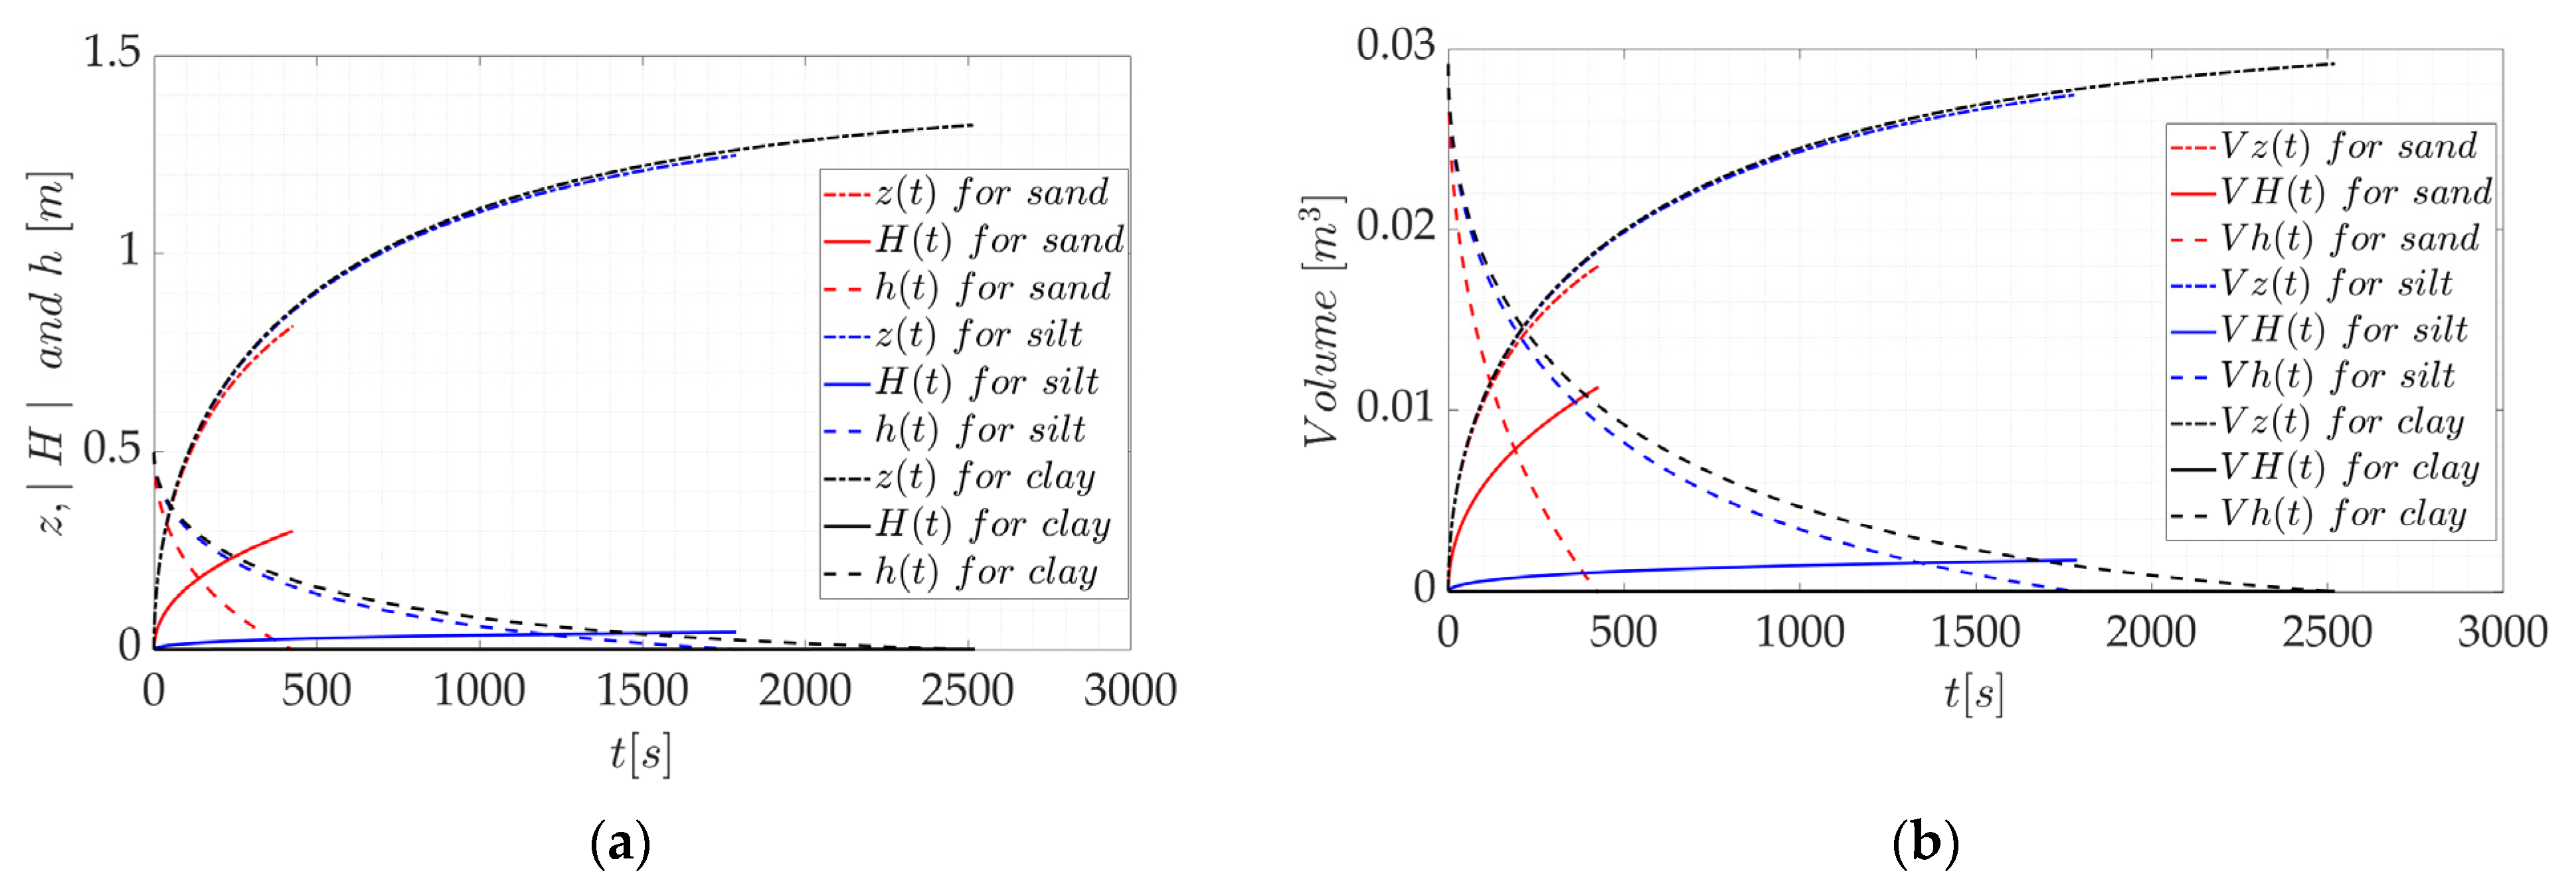
In cases 3 and 4, the process of water infiltration into the soil is incorporated as described in Section 2.2.3 and Section 2.2.4, and the specific soil parameters used can be found in Table 1. The obtained results for the water column height, surrounding pond height, and waterfront depth in the soil are graphically depicted in Figure 9a, while the corresponding volumes are presented in Figure 9b. Volumes are, in these cases, calculated as:
V z ( t ) = Φ 1 A 1 z ( t ) ,   V h t = ( A 2 A 1 ) h ( t ) ,   V H ( t ) = Φ 2 A 2 H ( t )
In Figure 9, it can be observed that the absorption time of the pond is crucially dependent on the type of soil. The results indicate that sand demonstrates the most efficient absorption, with the shortest time required. On the other hand, clay exhibits the least absorption, as the infiltrated water into the soil (waterfront depth H ) appears to be nearly non-existent. Furthermore, when comparing clay to impermeable soil, the difference in absorption time is negligible. Given the results, sand will be selected as the main soil type for subsequent results presentation due to its efficiency.
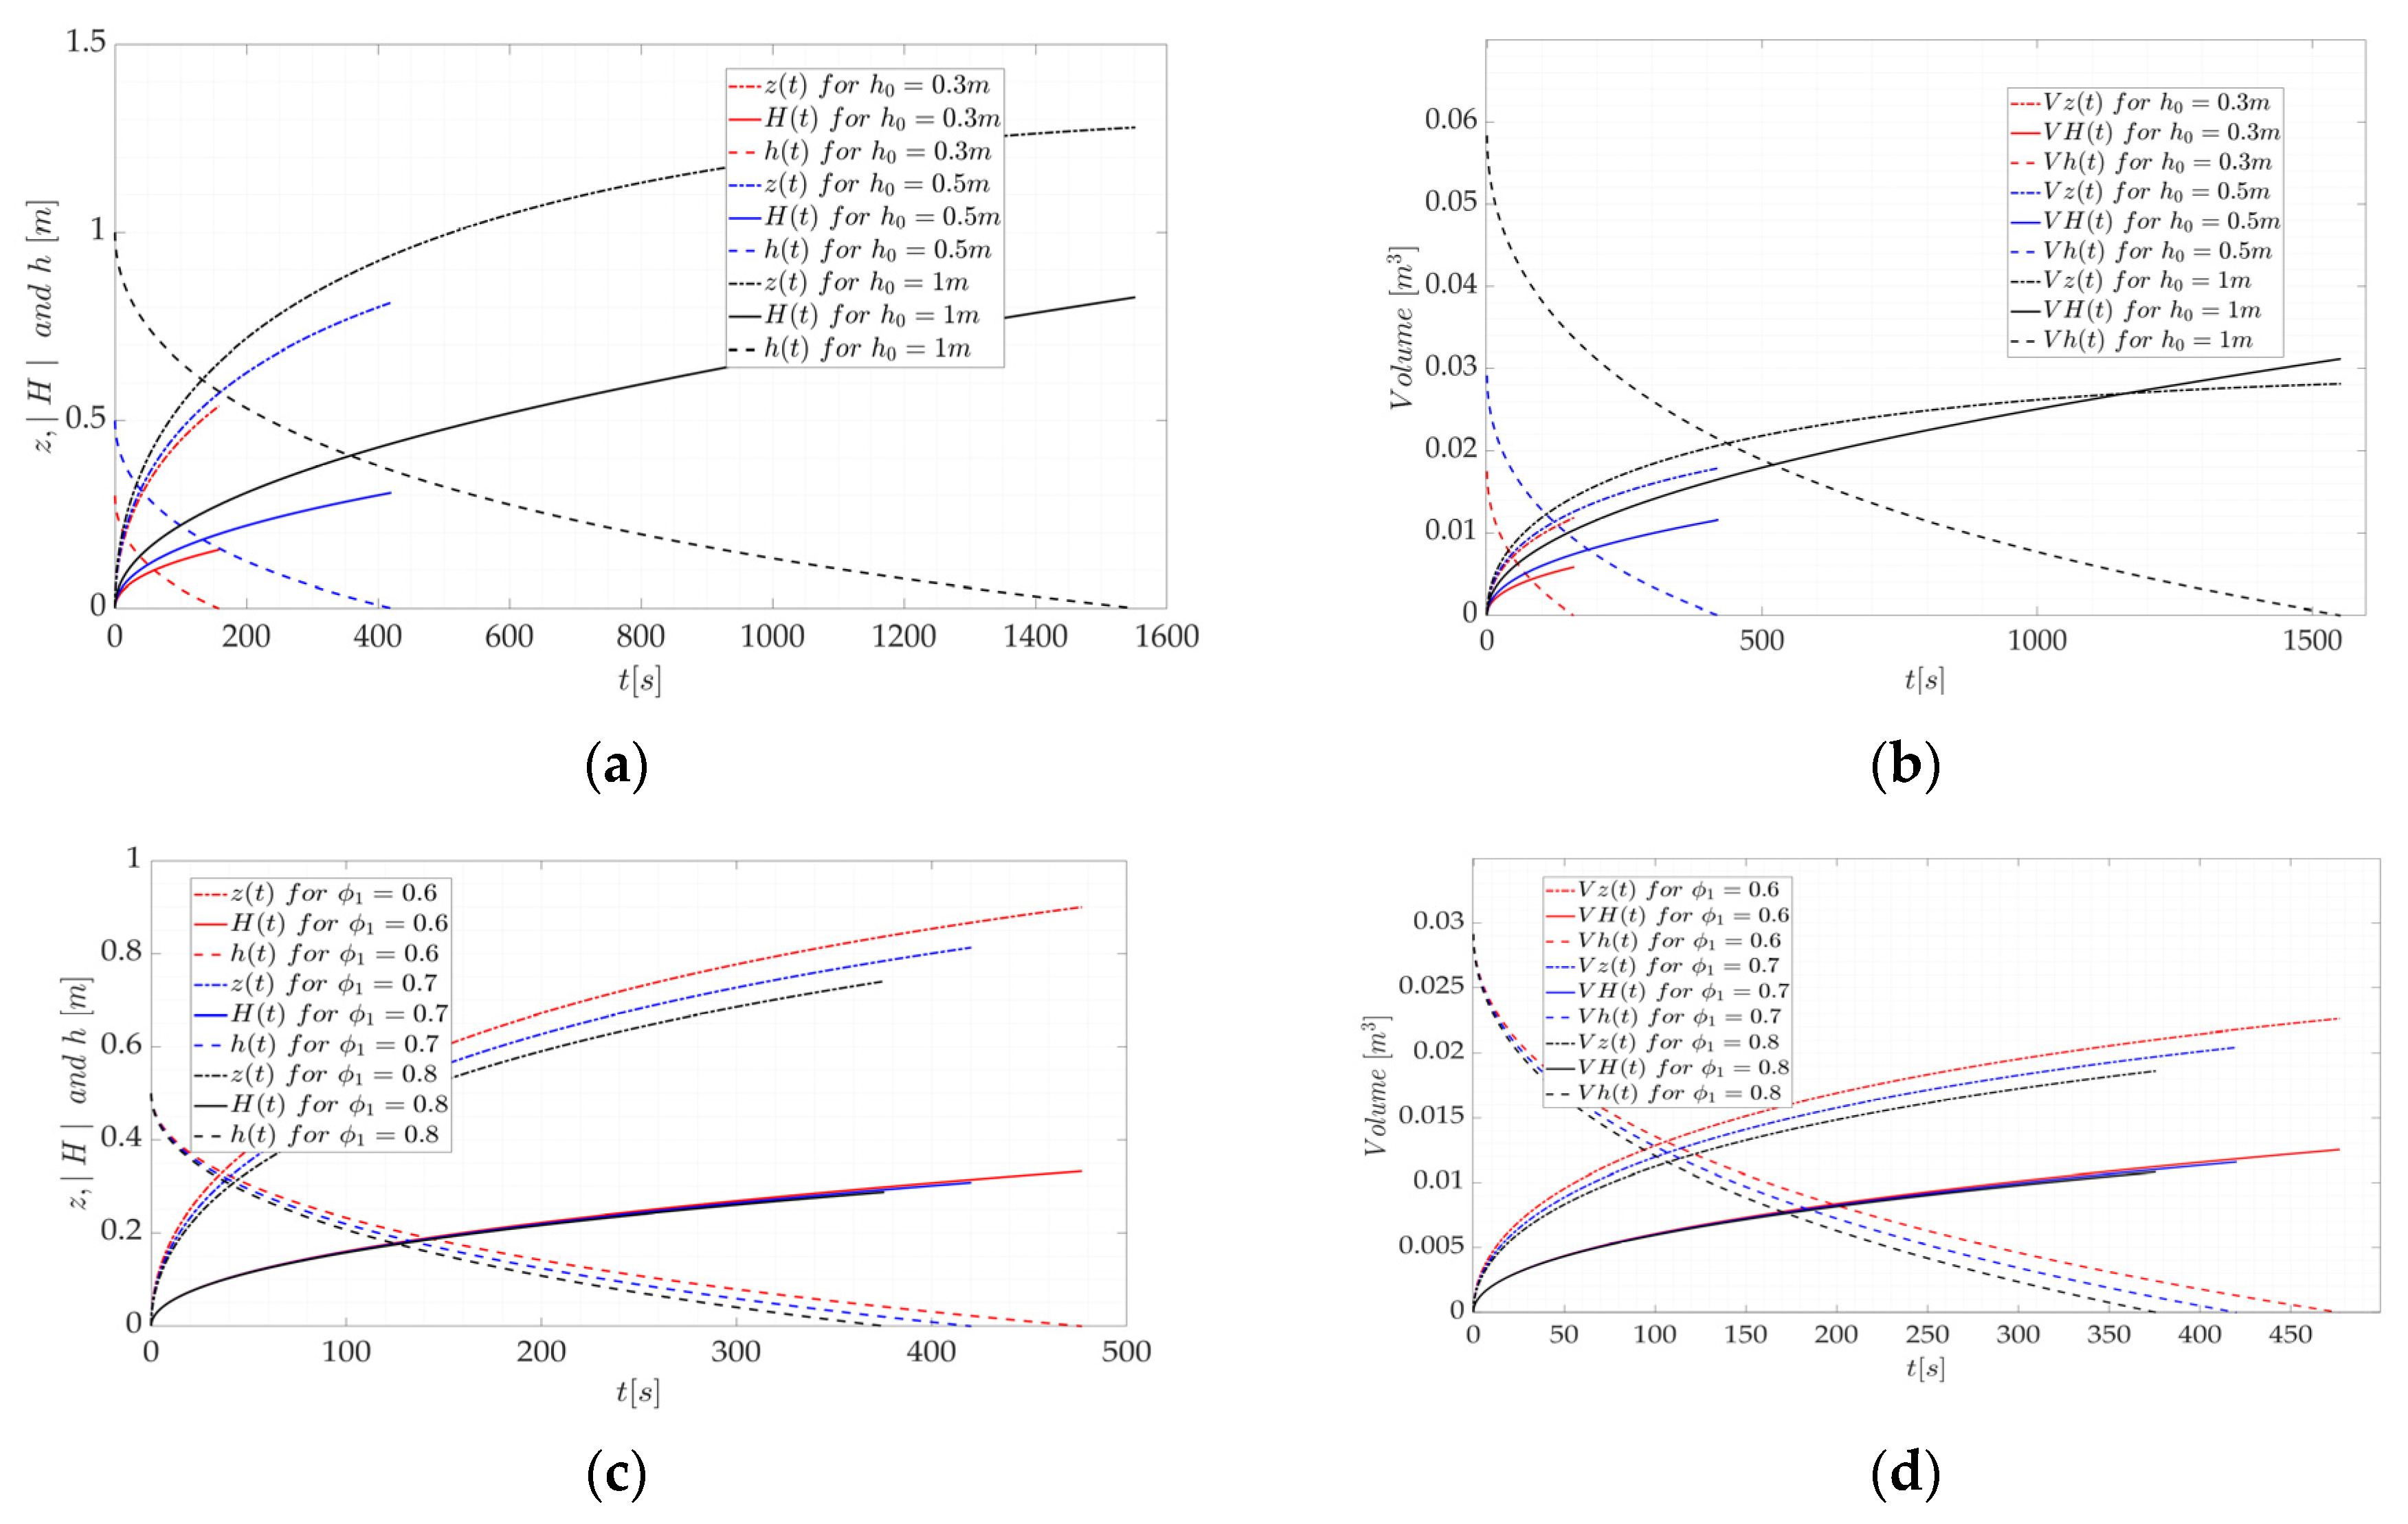
It is of particular interest to examine the effectiveness of the model when highly permeable soil is sand. The variations in the initial pond height are illustrated in Figure 10a,b, while the impact of altering the porosity is depicted in Figure 10c,d.
The absorption time increases with the growing values of the initial pond height, mimicking the results for cases 1–2. However, comparing case 3 (permeable soil) to case 1 (impermeable surface), it is evident that the permeability of the ground plays a significant role in facilitating water absorption. For an initial height of 0.3 m, the absorption time in case 1 is approximately 500 s, while in case 3, it is around 200 s, nearly half the value. Similarly, for an initial height of 0.5 m, the absorption time in case 1 is close to 2500 s, whereas in case 3 with soil, it is only 400 s. Furthermore, it is important to highlight that, unlike previous cases, in case 3 with soil, the entire flood is absorbed even for an initial height of 1 m.
Analogous observations can be made when considering the variations in porosity, as shown in Figure 10c,d. In case 1, with the highest porosity value of 0.8, the absorption time is approximately 1500 s, whereas in case 3, with soil, the absorption time for the same porosity value is around 400 s. In contrast to the previous two cases, when considering the lowest porosity of 0.6, the surrounding pond will be fully absorbed. This demonstrates the significant improvement in the overall performance of the up-flow model when soil is incorporated.
Given the significant impact of soil, it is intriguing to further examine the influence of rain on the results. Figure 11 presents the final case 4 analysis, where the plots in Figure 11a,b showcase the results by varying initial pond height, while the graphs in Figure 11c,d illustrate the effects of varying porosity.
Observing Figure 11a,b, it can be noted that the absorption time for the surrounding pond has slightly increased compared to case 3. However, it remains significantly lower than in cases 1 and 2. Similar trends are observed in the graphs of Figure 11 when varying the porosities. The rainfall in this study case with permeable soil exhibits a small influence on the overall performance outcomes.
The investigation of higher precipitation intensity becomes an additional point of interest. As depicted in Figure 12a,b, even at the highest intensity, there is only a minimal delay of 50 s. Note that the plots for the two lowest intensities are perfectly coincided. The presence of soil diminishes the impact of rain on system performance. Conversely, in case 2, particularly for an initial depth of 0.5 m, there is a substantial difference in absorption time compared to case 1. Additionally, rain intensity plays a crucial role in case 2, and for the highest intensity, the flood remains partially absorbed. In contrast, in case 4, the highest intensity merely introduces a delay of 50 s in the absorption process.
To quantify the efficiency of the water uptake, considering that the ground is permeable for case 3, the soil type is sand, h 0 = 0.5   m and Φ 1 = 0.7 , one may use the following formula:
η = T a p r = 0 T a p T a p ( r = 0 ) 2839 s 405 s 2839 s 0.857
where T a p ( r = 0 ) denotes the absence of the model, indicating that the pond is absorbed solely by the soil. The findings clearly demonstrate that the designed up-flow model plays a substantial role in enhancing water absorption, surpassing the sole absorption capacity of the soil.
Similarly, for case 4, when rain is included with I = 3.47 · 10 5 m/s per unit area of average duration 1 h:
η = T a p r = 0 T a p T a p ( r = 0 ) 3774 s 454 s 3774 s 0.88
The impact of rain on pond absorption is apparent, leading to a gradual increase in the volume of the pond, leading to a delay in the absorption time. Notably, the absorption of the soil acting alone is significantly longer in this scenario compared to the previous case (case 3). The designed model exhibits higher efficiency, particularly under rainy conditions. This is attributed to the superior characteristics of the model as an absorber, including higher permeability and porosity values, as well as a greater capillary pressure compared to the soil.

3.4. Summary

The SPB model is designed with a constant ratio of r = 0.35 . It is further important to emphasize that the results plotted throughout the study are for the designated values of ϕ = 0.7 ,   h 0 = 0.5   m , and I = 0.68 · 10 5 m/s per unit area with a duration of T = 1   h , unless stated otherwise.
In the first case, when the soil is impermeable, and there is no rain, analytical expressions are obtained for the absorption time, enhancing the understanding of the exact absorption time behavior. Furthermore, from the analytical expression, critical values are derived h c r i t i c a l 0.54   m and ϕ c r i t i c a l 0.65 . Above h c r i t i c a l and below ϕ c r i t i c a l the model is not able to fully absorb the remaining pond. In the second case, when there is rain, analytical derivation of the critical values is not as straightforward, as the inclusion of the rain complicates the analysis: h 1 = h 0 t = T 0.0149   m and ϕ c r i t i c a l 0.68 . These critical values are useful in the designing process of the model, knowing the conditions under which the model will experience failure to fully absorb.
In the last two cases, the ground is permeable. The soil type chosen is sand. It is interesting to observe how much the soil enhances the overall absorption process, that also in cases when the values of relevant parameters surpass the critical values (found in the previous two cases), the model can still fully absorb the surrounding pond. In the initial two cases, the device retains significantly more water compared to the last two cases. This is due to impermeable ground, and hence, the absorption process relies solely on the model (the maximum capacity V m a x   0.037   m 3 ), while in the latter cases, soil absorption leads to a lower retained volume. This implies that the model can still absorb additional water. To evaluate absorption efficiency, the most suitable approach is to examine absorption time T a p = T h = 0 . The corresponding results are summarized in Table 4. In instances where the critical values are exceeded, preventing complete water absorption by the device, the corresponding values become indefinite as T a p . Apart from infinite absorption, the longest absorption time occurs in case 2, surpassing 9000 s. This is due to the ground being impermeable and conditions of rainfall with an intensity of I = 0.68 · 10 5   m / s per unit area. In case 4 (when soil is permeable), for the same rain intensity, the time is T a p = 419   s . The table clearly illustrates a significantly shorter overall absorption time when the soil is permeable. Furthermore, considering higher porosity values and lower initial pond heights, the absorption time notably decreases, particularly in the initial two cases.

4. Discussion

The primary objective of this paper was to theoretically examine the impact of the modified up-flow model, based on the referenced work by Lundström et al. [1], contributing to the analysis of dynamic stormwater storage under various conditions, including permeable and impermeable soil along with external conditions. Certain idealizations were made, such as when modeling the water flow in the narrow gap, and effects due to viscosity were not included, causing certain energy losses to be neglected. These energy losses are certainly important in the initial stages of the process, which, when included, should lead to a slower process initially in a similar manner to the inclusion of the dynamic pressure term. Another idealization (i.e., approximations in the study) is the neglect of horizontal flow in the pond, as well as in the soil. Soil is considered to be saturated (Green–Ampt model). The problem in this study is treated as a one-dimensional flow due to the symmetrical and periodic arrangement of the storage devices (no-flux boundary condition), as presented in Figure 3. It is believed that the first approximation with a one-dimensional flow in the pond and soil should give at least a first estimate of relevant parameters.
Several parameters were varied, including the initial pond depth, rain intensity, soil type, and the porosity of the up-flow model. The absorption time of a surrounding pond was chosen as the key parameter to assess the efficiency of the water uptake. The findings revealed that including highly permeable soil as sand significantly improves the overall water removal performance. In certain events involving impermeable soil, complete absorption of the flood was not achieved, but still, the up-flow model performs well for such a case. Another study by Zhao et al. [24], in which the stormwater management model (SWMM) and Green-Ampt infiltration model have been used to examine how soil-saturated hydraulic conductivity and soil capillary suction head can influence stormwater runoff, has also concluded that improving these parameters, i.e., overall soil permeability, boosts the infiltration significantly, specifically when varying the conductivity. The absorption time in the present study was computed analytically, and where possible, critical values were determined, demonstrating good agreement with the numerical results. These findings enable the identification of optimal parameter choices and provide insights into staying within critical values. Efficiency was evaluated specifically for permeable soil, indicating that the presented model exhibits higher efficiency when rain is taken into account. Additionally, it is worth noting that, in mathematical modeling, the ratio of surfaces played a crucial role rather than the surfaces alone. This suggests that the analysis can be extended to various shapes and configurations of devices.
This study serves as a valuable starting point to evaluate the up-flow model water uptake under different conditions. However, further investigations are required, particularly regarding aspects related to device implementation, the discharge of the water, etc., as this study primarily focuses on physical and mathematical modeling. Additionally, future analyses could consider the incomplete saturation of the soil, incorporating the Richards equation with variations in saturation and possible horizontal movement, as conducted in some recent work [25,26,27], as well as including the effect of rainfall on the infiltration rate [28]. To further improve the model, evapotranspiration could also be included, similar to the work by Timsina et al. [29]. Improving the physical model for the water flow in the pond, including viscosity and horizontal flow, would further enhance the model. Finally, the development of an experimental rig for the validation of the models is essential. Progress in this direction is underway.

5. Conclusions

This study performs a further theoretical analysis of the innovative concept of dynamical water storage in sponge-like porous bodies proposed by Lundström et al. [1]. The assessment focuses on the up-flow model, using a full-cylindrical model to examine its performance under different conditions, such as permeable and impermeable soil and with or without rain. In each case, a pond is employed to replicate a flood scenario. Mathematical modeling based on first principles, including permeable soil, shows that the model effectively captures 1 h Swedish design rainfalls with an average return period of 10 years. However, when impermeable soil is considered, critical values for geometrical and model-characteristic parameters are derived, indicating that values exceeding the critical ones will hinder the model’s ability to absorb the surrounding flood. The permeability of the soil is found to be a crucial factor in water absorption, and the analysis shows that the model can be optimized according to the maximum values reached by the model. However, further investigation is needed to ensure the practical applicability of this dynamical water storage up-flow model concept, such as considering the soil as unsaturated, which will necessitate the use of the complete Richards equation to obtain more realistic results.
This work presents a conceptual overview of the up-flow model in various scenarios, focusing solely on its water-uptake capacity. More comprehensive theoretical and experimental research is necessary to fully explore further the potential and real-world feasibility of this concept.

Author Contributions

Conceptualization, A.B. and H.O.Å.; methodology, A.B. and H.O.Å.; software, A.B.; validation, A.B.; formal analysis, A.B., H.O.Å., I.A.S.L. and T.S.L.; investigation, A.B. and H.O.Å.; data curation, A.B.; writing—original draft preparation, A.B.; writing—review and editing A.B. (writing and editing), H.O.Å. (editing and review), I.A.S.L. (review) and T.S.L. (review); visualization, A.B., H.O.Å. and I.A.S.L.; supervision, H.O.Å., I.A.S.L. and T.S.L. All authors have read and agreed to the published version of the manuscript.

Funding

This research was funded by VINNOVA (Swedish Governmental Agency for Innovation Systems) DRIZZLE—Centre for Stormwater Management grant number 2016-05176.

Data Availability Statement

The data presented in this study are available on request from the corresponding author.

Conflicts of Interest

The authors declare no conflict of interest. The funders had no role in the design of this study, in the collection, analyses, or interpretation of data, in the writing of the manuscript, or in the decision to publish the results.

Appendix A

Details of the derivations for all the relevant equations and expressions used throughout this study will be explained. First, it is referred to case 1, and further on, a comprehensive derivation for the remaining cases will be provided as well.

Appendix A.1. Case 1

Starting from the Laplace equation 2 φ = 0 (Section 2.2) one may write:
φ ( z , t ) = A ( t )   z + B ( t )  
where φ = p + ρ g z ( t ) is the corresponding expression for the modified pressure and A t ,   B ( t ) are the unknown time-dependent coefficients. At z = 0 , there exists a condition for the inlet pressure p i n and thus one may determine B ( t ) :
B t = p i n
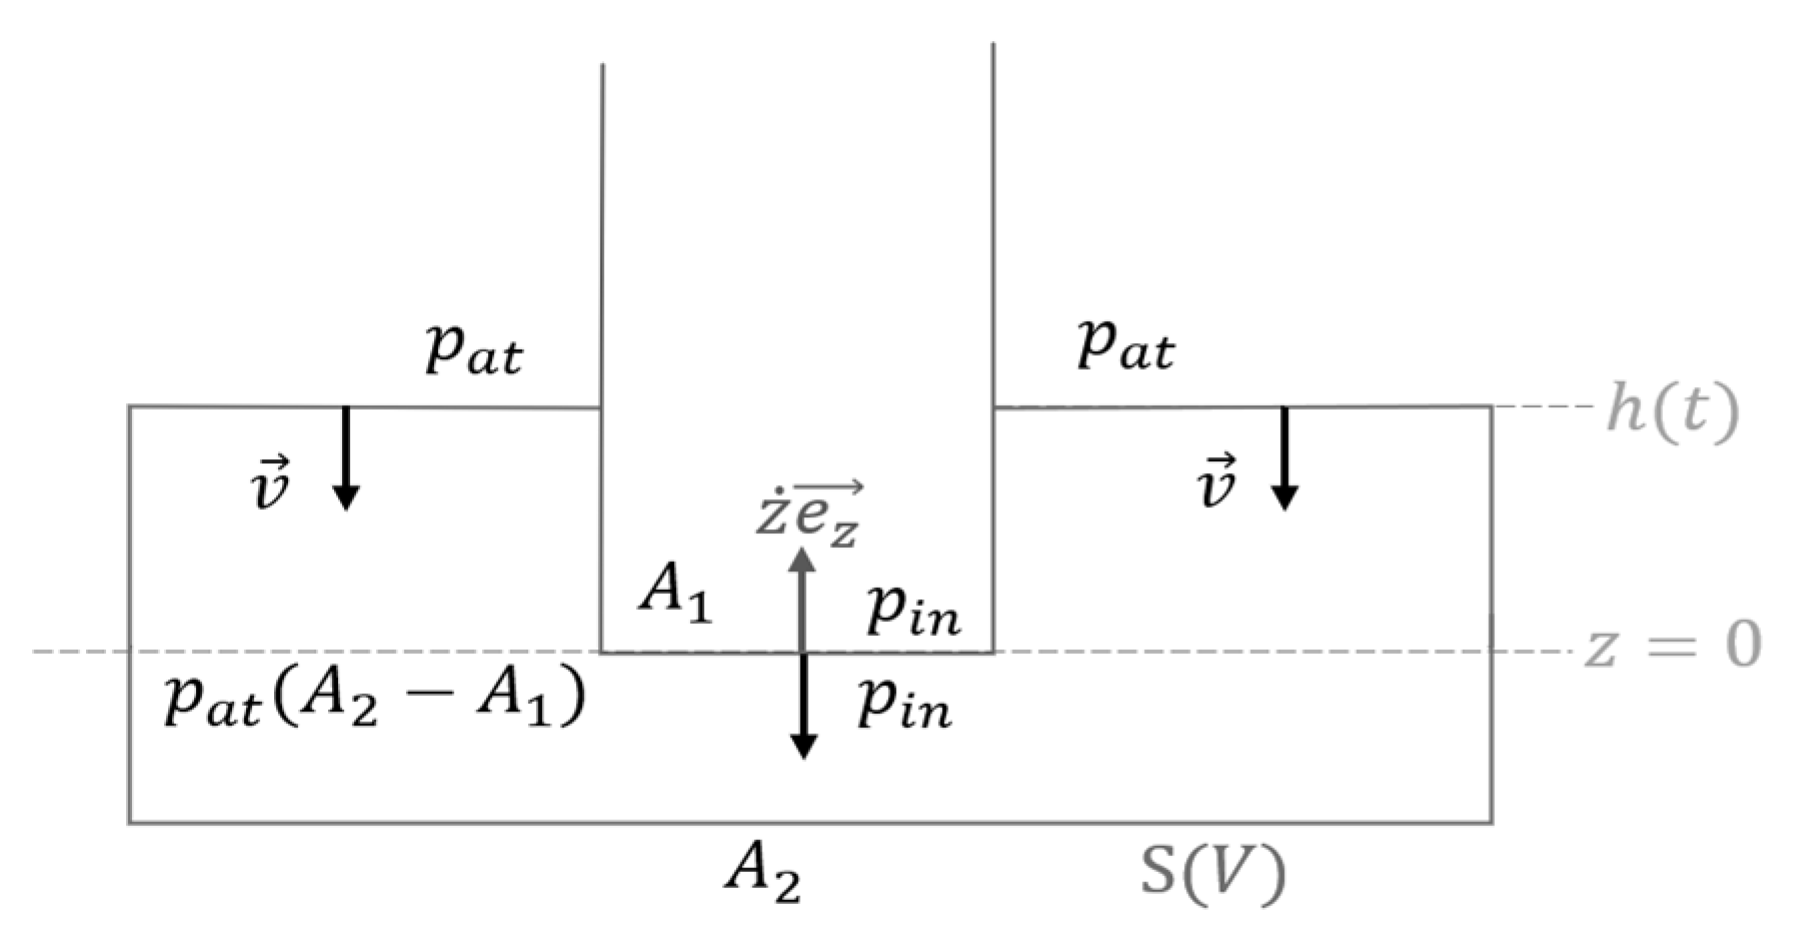
To determine p i n , it is referred to Reynolds transport theorem together with the defined control volume as presented in Figure A1:
e t d V + e v d S = p a t A 2 A 1 v p i n A 1 Φ 1 z ˙
e = 1 2 ρ v 2 + ρ g z     e t = ρ v v t   t 0
where e is the specific energy of the system. The first term on the LHS of Equation (A3) becomes zero: coordinate z does not vary in time, and knowing that after a very long time, i.e., t the velocity becomes constant (observed from the simulations), the time derivative of e becomes zero (Equation (A4)).
Figure A1. Control volume for the derivation of p i n .
Water 15 03209 g0a1
The second term on the LHS is determined as follows:
e v d S = 1 2 ρ v 2 + ρ g h   v A 2 A 1 + 1 2 ρ z ˙ 2 Φ 1 z ˙ A 1
From the continuity equation, one may write:
A 1 Φ 1 z ˙ = v A 2 A 1   v = A 1 Φ 1 A 2 A 1 z ˙
Replacing Equations (A5) and (A6) into Equation (A3), one gets:
p i n = p a t + ρ g h + 1 2 ρ z ˙ 2 ( A 1 Φ 1 A 2 A 1 2 1 )  
B ( t ) = p a t + ρ g h + 1 2 ρ z ˙ 2 ( A 1 Φ 1 A 2 A 1 2 1 )  
The fluid is driven upwards by the capillary rise:
φ z , t = A t z + B t = ρ g z + p a t p c  
where p c = 2 γ c o s ( Θ ) R is the corresponding capillary pressure. By utilizing Darcy’s law and the governing single-phase flow expression for the flux q one may determine the expression for A ( t ) :
q = Φ 1 d z d t z = z ( t ) = K 1 μ φ z = K 1 μ A t         A ( t ) = μ Φ 1 K 1 d z d t z = z ( t )
From Equations (A8) to (A10), the following expression is obtained:
z d z d t = ρ g K 1 μ Φ 1   p c ρ g + h 0 1 1 Φ 1 r 1 r z 1 2 g z ˙ 2 1 Φ 1 r 1 r 2
The initial conditions are z 0 = 0 , h 0 = h 0 . If the dynamical term, i.e., the last term in the previous Equation (A11), is neglected and further observing the initial phases of the process, i.e., when t 0 , one obtains:
z 0 d z d t = ρ g K 1 μ Φ 1   p c ρ g + h 0     d z d t = 1 z ( 0 ) ρ g K 1 μ Φ 1   p c ρ g + h 0
The velocity at very small instances appears to be infinite, which is not physically meaningful. When resolved, it can be shown that z t t 0 ~ t and d z d t t 0 . Nevertheless, if the dynamical term were not to be neglected when t 0 , the velocity would become zero during the initial stages d z d t 0 :
0 = ρ g K 1 μ Φ 1   p c ρ g + h 0 1 2 g d z d t 2 1 Φ 1 r 1 r 2 d z d t 2 g 1 Φ 1 r 1 r 2   p c ρ g + h 0 · t 0
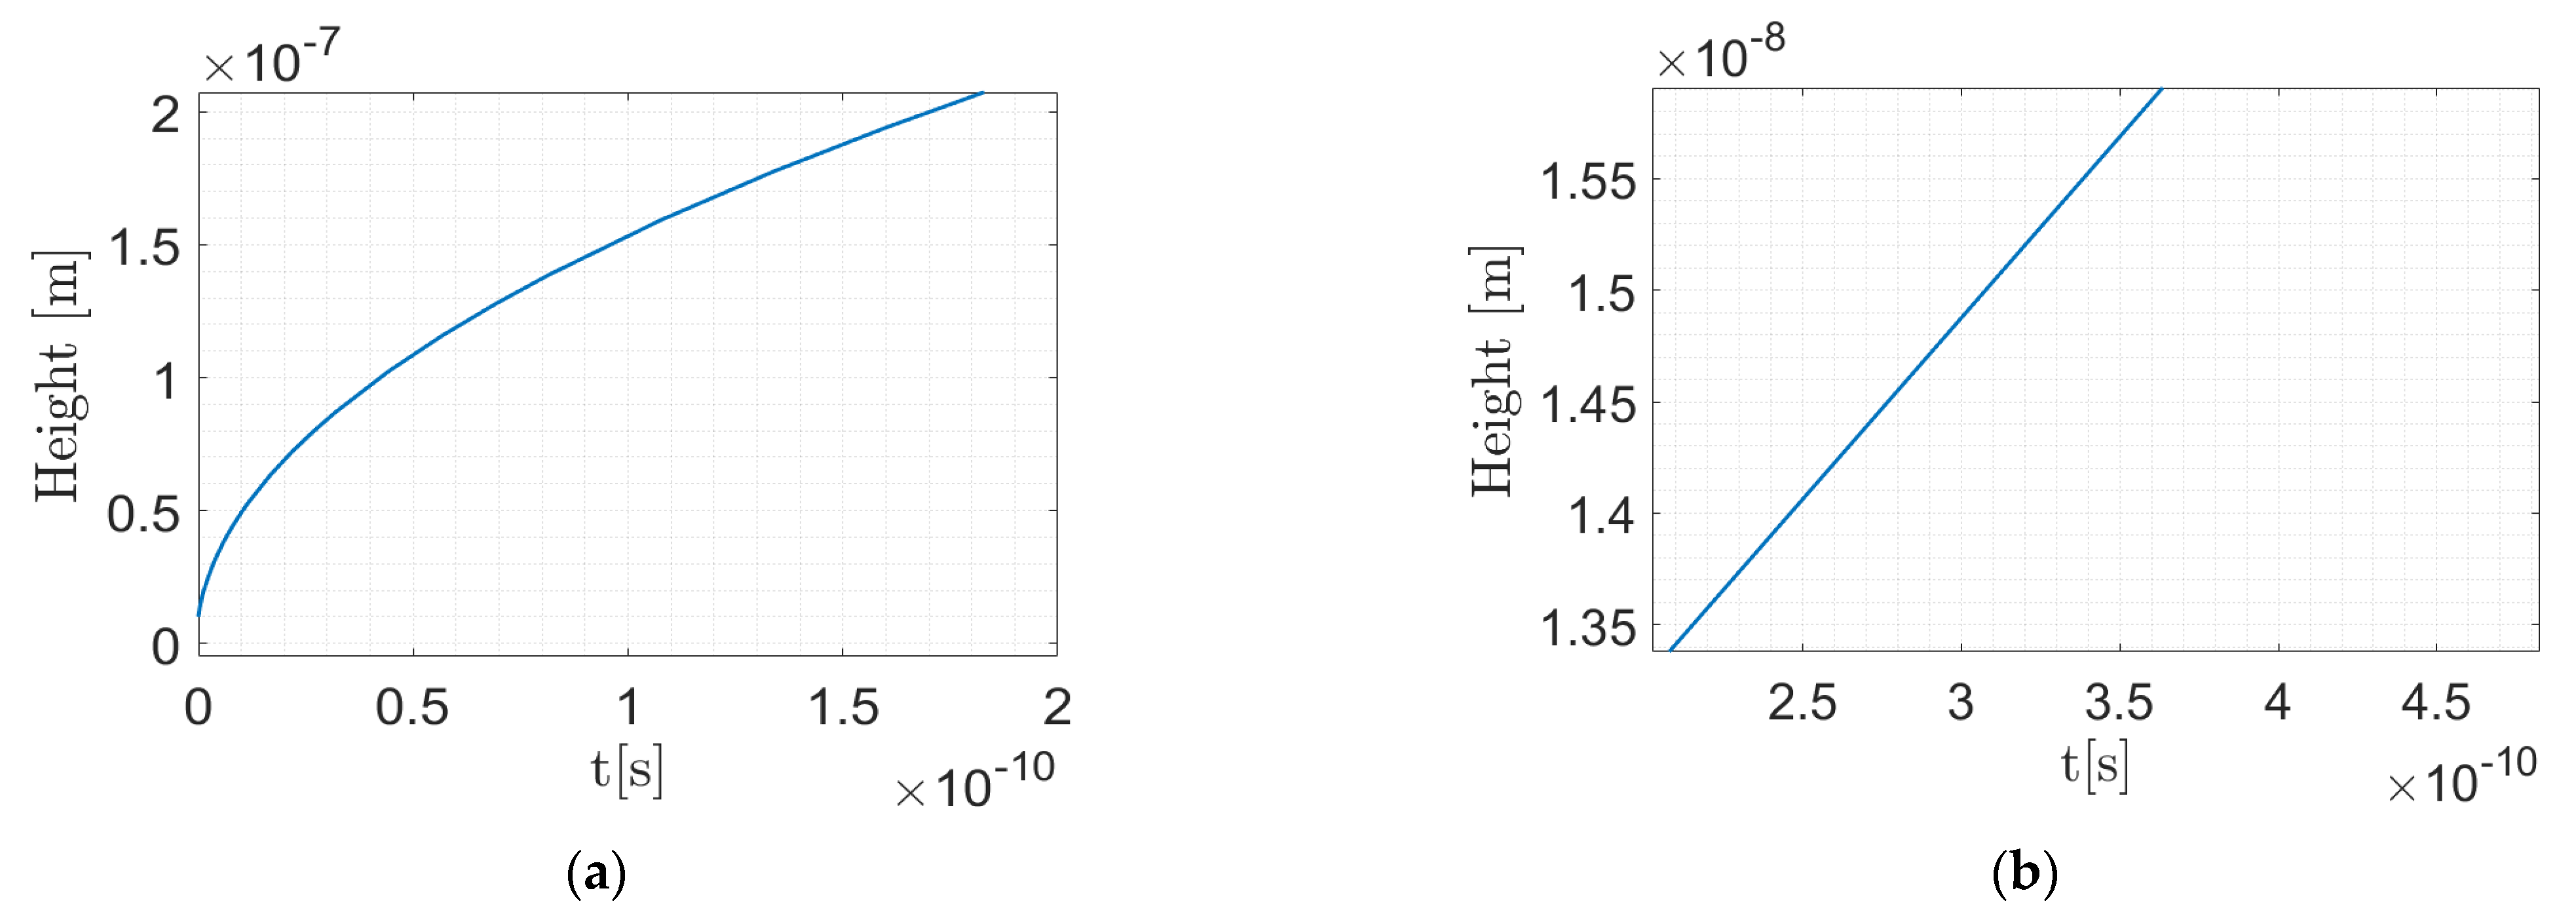
Figure A2 illustrates the behavior for different cases, both with and without the inclusion of the dynamical pressure term. It has been noted in the numerical simulations (carried out in MATLAB) that the results demonstrate no differences (observing results plotted with and without the dynamical term) at time intervals on the order of milliseconds, but are started to be observed at order t ~ 10 10 s as shown in figure. Based on these findings, it can be said that the dynamical term has minimal influence on the long-term results.
Figure A2. Up-take height plotted at initial time stages: (a) when dynamical pressure is not included and (b) when dynamical pressure is included.
Water 15 03209 g0a2
From the conservation of volumes (no effect of rain and impermeable soil is considered), one may express the pond height:
0 = Φ 1 z A 1 + ( h t h 0 ) ( A 2 A 1 )
h ( t ) = h 0 Φ 1 r 1 r z t  
where r = A 1 A 2 is the area ratio of the surfaces. Resolving Equations (A11) and (A12), z ( t ) and h ( t ) can be found. It is further possible to obtain an analytical solution for the time taken to absorb the surrounding pond. From the conservation of volumes at the time when all the flood is absorbed, i.e., h t = T a p = 0 , one can express the up-take height reached:
0 = Φ 1 z * A 1 + h t = T a p h 0 A 2 A 1   z * = 1 r Φ 1 r h 0
If the effect of dynamical pressure is neglected, i.e., the last term in Equation (A11) is zero, one may integrate Equation (A11) with respect to z with limits from 0 to z * and with respect to t from 0 to T a p . Thus, one obtains:
0 z * z d z   z c + h 0 1 1 Φ 1 r 1 r z = ρ g K 1 μ Φ 1 0 T a p d t
T a p = μ Φ 1 ρ g K 1 1 r 1 1 Φ 1 r 1 r 1 1 Φ 1 r   z c 1 + h 0 ln Φ 1 r z c 1 + h 0 Φ 1 r z c 1 + h 0 ( 1 r ) 1 1 Φ 1 r h 0 1 r Φ 1 r h 0
Equation (A14) represents the time taken to absorb all of the surrounding ponds when neglecting the dynamic pressure. However, it is also possible to obtain a more general solution with the effect of dynamical pressure. In that case, Equation (A11) needs to be rewritten in the following form:
d z d t 2 + 2 α z d z d t = 2 β z + γ
where the coefficients α , β , and γ are:
α = μ Φ 1 ρ K 1 ( 1 ( Φ 1 r 1 r ) 2 ) ,   β = g 1 ( 1 Φ 1 ) r ( 1 r ) ( 1 ( Φ 1 r 1 r ) 2 ) , γ = 2 g ( z c + h 0 ) 1 ( Φ 1 r 1 r ) 2
Equation (A15) can be further transformed into a simpler form:
d z d t + α z 2 = α z 2 2 β z + γ
The Euler substitution is introduced to solve Equation (A16):
α z 2 2 β z + γ = u + α z z = γ u 2 2 ( β + α u )
Replacing the substitution Equation (A17) into Equation (A16) and integrating:
T a p = 0 z * d z α z 2 2 β z + γ α z       = 1 2 u 1 u 2 ( α u 2 + 2 β u + α γ ) d u β + α u 2 u      
T a p = A ln u 1 u 2 + B α ln β + α u 1 β + α u 2 + C α 1 β + α u 2 1 β + α u 1
Equation (A19) represents the analytical solution of the absorption time without neglecting the dynamical term. The coefficients in the equation are:
A = 1 2 α γ 2 β 2 ,   B = 1 2 β 2 α γ 2 β 2 , C = 1 2 β γ α 2 β ,   u 2 = α z * 2 2 β z * + γ α z *   and u 1 = γ

Appendix A.2. Case 2

In case 2, the soil is considered impermeable, and additionally, a precipitation of duration I 0   T is considered. Similarly to the previous case 1, one may derive a corresponding set of equations representing the model as well as provide an analytical expression of the absorption time after it has stopped raining. The only difference to case 1 is in the conservation of volumes:
I t A 2 = Φ 1 z A 1 + h t h 0 A 2 A 1 ,     t ϵ [ 0   T ] 0 = Φ 1 z A 1 + h t h 0 A 2 A 1 ,     t > T
One may express the pond height h t   from Equation (A20) and place it into Equation (A11):
z d z d t = ρ g K 1 μ Φ 1   z c 1 + h 0 + I t ( 1 ( 1 Φ 1 ) r ) z 1 r 1 2 g z ˙ 2 1 Φ 1 r 1 r 2 ,   t ϵ [ 0   T ]
h t = h 0 + I t Φ 1 r z ( t ) 1 r ,   t ϵ [ 0   T ]
z d z d t = ρ g K 1 μ Φ 1   z c 1 + h 1 + Φ 1 r z 1 ( 1 ( 1 Φ 1 ) r ) z 1 r 1 2 g z ˙ 2 1 Φ 1 r 1 r 2 ,   t > T
h t = h 1 Φ 1 r 1 r z t z 1 ,   t > T
where h 1 and z 1 are the initial conditions after precipitation t > T , i.e., h t = T = h 1 and z t = T = z 1 . The absorption time is calculated as T a p = t h = 0 T . It is the time taken for the model to absorb the remaining pond after it has stopped raining. In the same way, as in case 1, the analytical solution is obtained; however, from the previous analysis, it has been demonstrated that the dynamical pressure can be neglected; hence, the solution is presented here for the case when disregarding the dynamical pressure:
T a p = μ Φ 1 ρ g K 1 1 r 1 1 Φ 1 r z c + h 1 + Φ 1 r 1 r z 1 1 r 1 1 Φ 1 r   ln z c + h 1 z 1 z c + h 1 + Φ 1 r 1 r z 1 1 1 Φ 1 r 1 r z * + z 1 z * + T  
where z * is the height reached by the model once all of the pond is absorbed:
0 = Φ 1 z * z 1 A 1 + h t = T a p h 1 A 2 A 1   z * = z 1 + 1 r Φ 1 r h 1

Appendix A.3. Case 3

In this scenario, it is assumed that the soil is permeable and that there is no rain. As explained in the initial Section 2.2, for the infiltration of water into the soil, an assumption of a sharp wetting front is made as well as complete saturation, and thus the Richards equation along with the Darcy velocity transforms to Laplace equation for which the solution of the modified pressure can be written in the following form:
φ 2 = A 2 t z + B 2 ( t )
For the uptake of the water within the model, the expression has been previously derived (Equation (A1)):
φ 1 = A 1 t z + B 1 ( t )
where A 1 t ,   A 2 t ,   B 1 t and B 2 t   are the corresponding coefficients. Analogously to case 1, with consideration of the advancing of the wetting front in the soil, the set of equations describing the change of the water uptake height z ( t ) , pond height h ( t ) and waterfront depth within the soil H ( t ) will be derived:
q 1 = Φ 1 d z d t z = z ( t ) = K 1 μ φ 1 z = K 1 μ A 1 t
q 2 = Φ 2 d z d t z = H t = Φ 2 d H d t = K 2 μ φ 2 z = K 2 μ A 2 ( t )
where q 1   is the volumetric flow rate of the fluid flow going into the model and q 2 is the flow rate of the water moving into the soil. As seen previously, there is a condition at z = 0 :
φ 1 z = 0 = B 1 ( t ) = p i n 1 ,   φ 2 z = 0 = B 2 ( t ) = p i n 2
Similar to Equation (A9), one can write expressions for modified pressure at z = z ( t ) and z = H ( t ) from which it is possible to obtain expressions for coefficients A 1 t and A 2 t :
φ 1 z = z ( t ) = A 1 z ( t ) + p 1 = ρ g z ( t ) + p a t p c 1     A 1 ( t ) = p a t p 1 p c 1 + ρ g z ¯ z ( t )
φ 2 z = H ( t ) = A 2 H ( t ) + p 2 = ρ g H ( t ) + p a t p c 1     A 2 = p 2 p a t + p c 2 + ρ g H ( t ) H ( t )
From Equations (A27) to (A31) and with the analogy of case 1 in determining the corresponding inlet pressures (Bernoulli’s equation and continuity), one can thus obtain the set of equations for the modeling of case 3:
z d z d t = ρ g K 1 μ Φ 1 z C 1 + h z 1 2 g z ˙ 2 Φ 1 r z ˙ + Φ 2 H ˙ 1 r 2
H d H d t = ρ g K 2 μ Φ 2 z C 2 + h + H 1 2 g H ˙ 2 Φ 1 r z ˙ + Φ 2 H ˙ 1 r 2  
h ( t ) = h 0 Φ 1 r z ( t ) + Φ 2 H ( t ) 1 r
Equation (A34) is obtained from the conservation of volumes:
0 = Φ 1 z A 1 + h h 0 A 2 A 1 + Φ 2 H A 2

Appendix A.4. Case 4

As in the previous case, it is assumed that the soil is permeable and that there is a precipitation of finite duration. The only difference in the modeling of case 4 compared to the one in case 3 is that the conservation of volume changes due to the rain inflow:
I t A 2 = Φ 1 z A 1 + h h 0 A 2 A 1 + Φ 2 H A 2 ,   t ϵ [ 0   T ] 0 = Φ 1 z A 1 + h h 0 A 2 A 1 + Φ 2 H A 2 ,   t > T
Furthermore, the pond height from the previous equations is expressed as:
h ( t ) = h 0 + I t Φ 1 r z ( t ) Φ 2 H ( t ) 1 r ,   t ϵ [ 0   T ]
h ( t ) = h 1 Φ 1 r z ( t ) z 1 + Φ 2 H ( t ) H 1 1 r ,   t > T
Equations (A32) and (A33), together with Equations (A35) and (A36), represent the modeling of case 4. Both sets of equations for case 3 and case 4 are resolved numerically with the ode45 function in MATLAB. The dynamical pressure during the numerical simulations has been neglected.

Appendix B

The impact of the loss factor (or energy loss) on the modeling process is further detailed. Incorporating the friction losses resulting from the system’s geometry, particularly sudden narrowing, involves considering head losses that are approximately proportional to the square of the flow rate. The exact value of the friction coefficient for the studied flow and geometry is not known. Nevertheless, it will be demonstrated that this coefficient does not influence the analysis or results over longer time periods. Figure A3 illustrates the studied problem, from which we may write Bernoulli’s equation between two points as follows:
p i n ρ g + z ˙ 2 2 g p a t ρ g + v 2 2 g + h = Δ H l o s s = ξ   z ˙ 2 2 g
Figure A3. Illustration for deriving the head loss coefficient.
Water 15 03209 g0a3
Analogous to the derivation of Equation (A11) in Appendix A, the same procedure is applied here, with a slight modification in the dynamical term to account for the inclusion of the loss factor from Equation (A38):
z d z d t = ρ g K 1 μ Φ 1   p c ρ g + h 0 1 1 Φ 1 r 1 r z 1 2 g z ˙ 2 1 + ξ Φ 1 r 1 r 2
The analysis has demonstrated that the dynamical term remains significant only for very short time durations. Consequently, for longer time periods, the last term in Equation (A38) can be disregarded. Numerical simulations have confirmed that the dynamical term is observable only in timeframes on the order of milliseconds.
An alternative method to understand the diminishing relevance of the dynamical term is to consider the asymptotic linear solution when t   for the water uptake height:
z   k t + n
Replacing the asymptotic solution Equation (A39) into Equation (A38), an expression for k can be obtained:
k = ρ g K μ ϕ 1 1 ϕ 1 r 1 r  
From Equation (A40), it can be seen that the loss factor ξ does not affect the behavior of the asymptotic coefficient k . Consequently, for longer time durations, ξ has no impact on the final results.

Appendix C

The approximation is applied to the Richards equation, which serves as the basis for modeling the advancement of the waterfront into the soil. Derivation of the equations will be explained. The conservation of mass of water in an unsaturated porous media can be expressed as:
θ t + · q = 0
where θ represents the soil–water content and q the water flux. From Darcy’s law, the flux can be expressed as:
q = K ^ μ φ
where φ = p + ρ g z is the modified pressure, and K ^ is the permeability coefficient tensor. The modified pressure can be expressed in terms of the hydraulic head H , which is the sum of the pressure head ψ and gravity head z :
φ = ρ g H = ρ g p ρ g + z = ρ g ( ψ + z )
For unsaturated flow, the permeability coefficient and the pressure head vary as a function of the water-soil content, i.e., K ^ ( θ ) and   ψ ( θ ) . Replacing Equations (A42) and (A43) into Equation (A41), Richard’s equation is obtained:
θ t = ρ g μ · [ K ^ ψ θ θ + K z z ( θ ) ]
In the case of a completely saturated flow approximation ( s = 1 ), the soil-water content attains its maximum value and remains constant, i.e., θ = θ m a x = ϕ , where ϕ represents the soil porosity. In this study, it is assumed that the observed time scale is significantly longer than the transient time required to achieve complete saturation. The Green-Ampt flow model [10] is utilized for this purpose, where it is assumed that the completely saturated waterfront moves like a single block or unit through the soil. As the water-soil content remains constant, both the permeability coefficient tensor and pressure head also remain constant. By employing this approximation and returning to the initial equation, i.e., Equation (A41), it can now be simplified:
· q = 0
Replacing Equation (A42) with Equation (A45), the Laplace equation is obtained:
· ( K ^ φ ) = 0

References

  1. Lundström, T.S.; Åkerstedt, H.O.; Larsson, I.A.S.; Marsalek, J.; Viklander, M. Dynamic Distributed Storage of Stormwater in Sponge-Like Porous Bodies: Modelling Water Uptake. Water 2020, 12, 2080. [Google Scholar] [CrossRef]
  2. Marsalek, J.; Schreier, H. Innovation in Stormwater Management in Canada: The Way Forward. Water Qual. Res. J. 2009, 44, v–x. [Google Scholar] [CrossRef]
  3. Toronto Region Conservation Authority. Evaluation of Residential Lot Level Stormwater Practices; Toronto Region Conservation Authority (TRCA): Toronto, ON, Canada, 2013. [Google Scholar]
  4. Åkerstedt, H.O.; Lundström, T.S.; Larsson, I.A.S.; Marsalek, J.; Viklander, M. Modeling the Swelling of Hydrogels with Application to Storage of Stormwater. Water 2021, 13, 34. [Google Scholar] [CrossRef]
  5. Zarandi, M.A.F.; Pillai, K.M.; Kimmel, A.S. Spontaneous Imbibition of Liquids in Glass-Fiber Wicks. Part I: Usefulness of a Sharp-Front Approach. AIChE J. 2018, 64, 294–305. [Google Scholar] [CrossRef]
  6. Faghihi Zarandi, M.A.; Pillai, K. Spontaneous Imbibition of Liquid in Glass Fiber Wicks, Part II: Validation of a Diffuse-Front Model. AIChE J. 2017, 64, 306–315. [Google Scholar] [CrossRef]
  7. Vo, H.N.; Pucci, M.F.; Corn, S.; Le Moigne, N.; Garat, W.; Drapier, S.; Liotier, P.J. Capillary Wicking in Bio-Based Reinforcements Undergoing Swelling—Dual Scale Consideration of Porous Medium. Compos. Part A Appl. Sci. Manuf. 2020, 134, 105893. [Google Scholar] [CrossRef]
  8. Foudazi, R.; Zowada, R.; Manas-Zloczower, I.; Feke, D.L. Porous Hydrogels: Present Challenges and Future Opportunities. Langmuir 2023, 39, 2092–2111. [Google Scholar] [CrossRef]
  9. Khayamyan, S.; Lundström, T.S.; Hellström, J.G.I.; Gren, P.; Lycksam, H. Measurements of Transitional and Turbulent Flow in a Randomly Packed Bed of Spheres with Particle Image Velocimetry. Transp. Porous Media 2017, 116, 413–431. [Google Scholar] [CrossRef]
  10. Alastal, K.; Ababou, R. Moving Multi-Front (MMF): A Generalized Green-Ampt Approach for Vertical Unsaturated Flows. J. Hydrol. 2019, 579, 124184. [Google Scholar] [CrossRef]
  11. Caputo, J.-G.; Stepanyants, Y.A. Front Solutions of Richards’ Equation. Transp. Porous Media 2008, 74, 1–20. [Google Scholar] [CrossRef]
  12. Richards, L.A. Capillary conduction of liquids through porous mediums. Physics 1931, 1, 318–333. [Google Scholar] [CrossRef]
  13. Bear, J. 7.6 Direct Integration in One-Dimensional Problems. In Dynamics of Fluids in Porous Media; Environmental Science Series; American Elsevier: New York, NY, USA, 1972; ISBN 978-0-444-00114-6. [Google Scholar]
  14. Bear, J. 9.4 Unsaturated Flow. In Dynamics of Fluids in Porous Media; Environmental Science Series; American Elsevier: New York, NY, USA, 1972; ISBN 978-0-444-00114-6. [Google Scholar]
  15. Kuraz, M.; Holub, J.; Jerabek, J. Numerical Solution of the Richards Equation Based Catchment Runoff Model with Dd-Adaptivity Algorithm and Boussinesq Equation Estimator. Pollack Period. 2017, 12, 29–44. [Google Scholar] [CrossRef]
  16. Piikki, K.; Söderström, M. Digital Soil Mapping of Arable Land in Sweden—Validation of Performance at Multiple Scales. Geoderma 2019, 352, 342–350. [Google Scholar] [CrossRef]
  17. Detmann, B. Linear Elastic Wave Propagation in Unsaturated Sands, Silts, Loams and Clays. Transp. Porous Media 2011, 86, 537–557. [Google Scholar] [CrossRef]
  18. Haghighatafshar, S.; Nordlöf, B.; Roldin, M.; Gustafsson, L.-G.; la Cour Jansen, J.; Jönsson, K. Efficiency of Blue-Green Stormwater Retrofits for Flood Mitigation—Conclusions Drawn from a Case Study in Malmö, Sweden. J. Environ. Manag. 2018, 207, 60–69. [Google Scholar] [CrossRef]
  19. MSE-MyWebPages Melbourne School of Engineering. Available online: https://people.eng.unimelb.edu.au/stsy/geomechanics_text/Ch5_Flow.pdf (accessed on 11 March 2023).
  20. Woessner, W.W.; Eileen, P.P. Hydrogeologic Properties of Earth Materials and Principles of Groundwater Flow; The Groundwater Project: Guelph, ON, Canada, 2020. [Google Scholar]
  21. Yu, C.; Cheng, J.J.; Jones, L.G.; Wang, Y.Y.; Faillace, E.; Loureiro, C.; Chia, Y.P. Data Collection Handbook to Support Modeling the Impacts of Radioactive Material in Soil; USA, 1993; p. 152. Available online: https://resrad.evs.anl.gov/docs/data_collection_1993.pdf (accessed on 5 April 2023).
  22. Olsson, J.; Södling, J.; Berg, P.; Wern, L.; Eronn, A. Short-duration rainfall extremes in Sweden: A regional analysis. Hydrol. Res. 2019, 50, 945–960. [Google Scholar] [CrossRef]
  23. Berggren, K. Urban Stormwater Systems in Future Climates—Assessment and Management of Hydraulic Overloading. Ph.D. Thesis, Luleå University of Technology, Luleå, Sweden, 2014. [Google Scholar]
  24. Zhao, G.; Wan, Y.; Lei, Z.; Liang, R.; Li, K.; Pu, X. Effect of Urban Underlying Surface Change on Stormwater Runoff Process Based on the SWMM and Green-Ampt Infiltration Model. Water Supply 2021, 21, 4301–4315. [Google Scholar] [CrossRef]
  25. Vodák, R.; Fürst, T.; Šír, M.; Kmec, J. The Difference between Semi-Continuum Model and Richards’ Equation for Unsaturated Porous Media Flow. Sci. Rep. 2022, 12, 7650. [Google Scholar] [CrossRef]
  26. Chali, A.K.N.; Hashemi, S.R.; Akbarpour, A. Numerical Solution of the Richards Equation in Unsaturated Soil Using the Meshless Petrov–Galerkin Method. Appl. Water Sci. 2023, 13, 119. [Google Scholar] [CrossRef]
  27. Xiao, Y.; Zhu, Y. Study of the Water Vertical Infiltration Path in Unsaturated Soil Based on a Variational Method: Application of Power Function Distribution of D (θ). Hydrol. Sci. J. 2022, 67, 2254–2261. [Google Scholar] [CrossRef]
  28. Wei, L.; Yang, M.; Li, Z.; Shao, J.; Li, L.; Chen, P.; Li, S.; Zhao, R. Experimental Investigation of Relationship between Infiltration Rate and Soil Moisture under Rainfall Conditions. Water 2022, 14, 1347. [Google Scholar] [CrossRef]
  29. Timsina, R.C.; Khanal, H.; Ludu, A.; Uprety, K.N. Numerical Solution of Water Flow in Unsaturated Soil with Evapotraspiration. Nepali Math. Sci. Rep. 2021, 38, 35–45. [Google Scholar] [CrossRef]
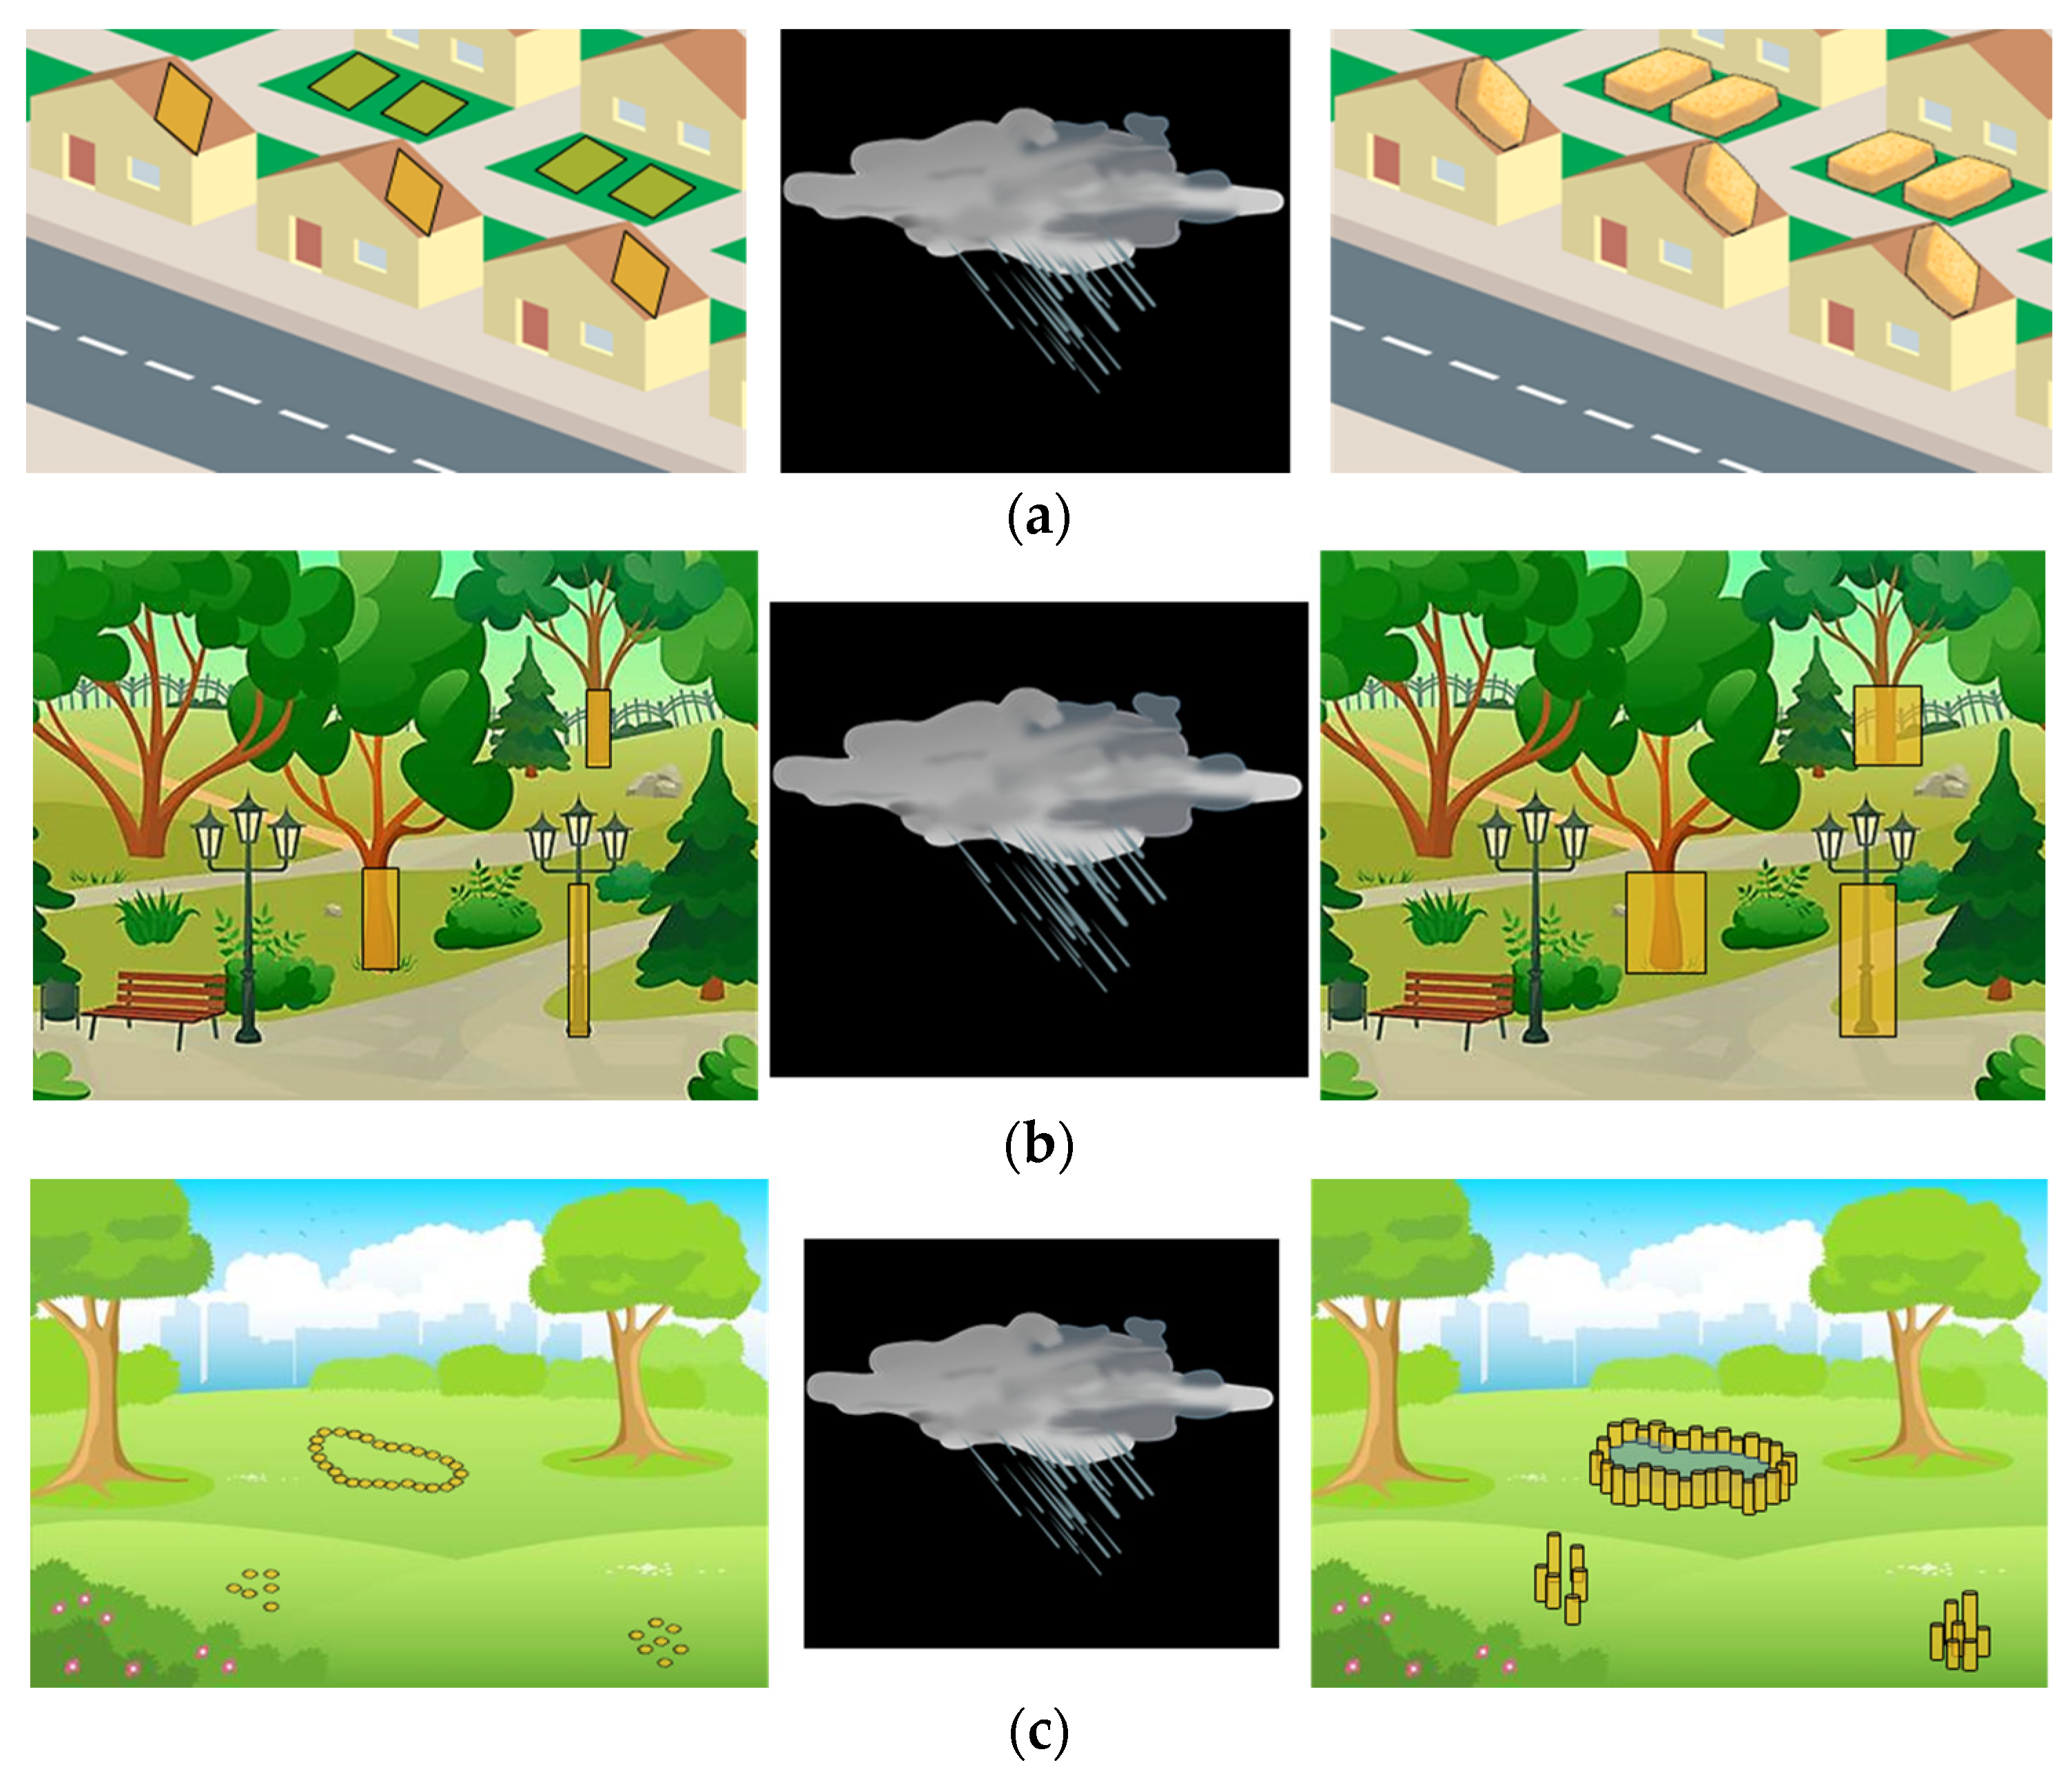
Figure 1. Theoretical concepts: (a) down-flow sponge-like porous body (SPB) storage; (b) up-flow SPB storage with the pre-installed vertical structures expanding horizontally; and (c) up-flow SPB storage with new vertical structures growing up from the ground when absorbing water. The figure is directly copied from [1].
Water 15 03209 g001
Figure 2. Illustrative representations of the four scenarios showing water uptake of the up-flow storage device when surrounded by a pond: (a) case 1: impervious ground surface without precipitation; (b) case 2: impervious ground surface with precipitation; (c) case 3: permeable ground surface without precipitation; (d) case 4: permeable ground surface with precipitation. Note that the ground color denotes permeability: green indicates permeable ground surface, and grey is impermeable. A 1 denotes the inlet surface area of the up-flow model and A 2 denotes the surface area of the surrounding ground. h ( t ) denotes the pond height ( h t = 0 = h 0 ), z ( t ) water uptake height within the model, H ( t ) the depth of the infiltrated water within the soil, and I the uniform rain intensity. δ denotes the gap. Arrows represent the water movement.
Water 15 03209 g002
Figure 3. Illustration of the domain of the soil extending infinitely with an infinite number of cells. Each cell contains the model.
Water 15 03209 g003
Figure 4. (a) Water column and pond heights and (b) their corresponding volumes for case 1 are plotted against time for various initial height values (Table 3); (c) water column and pond heights and (d) their corresponding volumes for case 1 are plotted against time for various porosity values (Table 3).
Water 15 03209 g004
Figure 5. Time taken to absorb the pond is plotted as a function of the initial pond height value and ratio: (a) plots follow the analytical expressions: red plot contains, and the blue does not contain the effect of dynamical pressure; (b) the graph is plotted numerically; (c) the graph is plotted following the analytical expression (the effect of the dynamical pressure is neglected); (d) the graph is plotted numerically.
Water 15 03209 g005aWater 15 03209 g005b
Figure 6. (a) Water column and pond heights and (b) their corresponding volumes for case 2 are plotted against time for various initial height values (Table 3); (c) water column and pond heights and (d) their corresponding volumes for case 2 are plotted against time for various porosity values (Table 3).
Water 15 03209 g006
Figure 7. (a) Water column and pond heights and (b) their corresponding volumes for case 2 are plotted against time for various rain intensity values (Table 2); (c) time taken to absorb the pond is plotted as a function of initial pond height value after precipitation; (d) time taken to absorb the pond is plotted as a function of area ratio.
Water 15 03209 g007
Figure 8. The time taken to absorb the pond is plotted as a function of the duration of rain for different rain intensity values (Table 2).
Water 15 03209 g008
Figure 9. (a) Water column, pond, and depth of the waterfront within the soil and (b) their corresponding volumes for case 3 are plotted against time for different types of soil (Table 1).
Water 15 03209 g009
Figure 10. (a) Water column, pond, and depth of the water within the soil and (b) their corresponding volumes for case 3 are plotted against time for various initial height values (Table 3); (c) water column, pond, and depth of the waterfront within the soil and (d) their corresponding volumes for case 3 are plotted against time for various porosity values (Table 3).
Water 15 03209 g010aWater 15 03209 g010b
Figure 11. (a) Water column, pond, and depth of the water within the soil and (b) their corresponding volumes for case 4 are plotted against time for various initial height values (Table 3); (c) water column, pond, and depth of the waterfront within the soil and (d) their corresponding volumes for case 4 are plotted against time for various porosity values (Table 3).
Water 15 03209 g011
Figure 12. (a) Water column, pond depth of the waterfront within the soil, and (b) their corresponding volumes for case 4 are plotted against time for various rain intensity values (Table 2).
Water 15 03209 g012
Table 1. Soil parameters.
Soil Type Permeability   K ( m 2 ) Porosity   Φ 2 (%)
Sand 10 11 42
Silty 10 13 44
Clay 10 17 46
Table 2. Direct inflow of rainwater into storage (Table is copied from [1]).
Event Direct   Rainwater   Inflow   Velocity   I   m / s   per   Unit   Area   [ m 2 ]
Southwest (SW)North (N)
Uniform intensity 60 min duration, with return period 1:10 years 0.68 · 10 5 0.53 · 10 5
60 min duration event with a high-intensity burst of 5 min, return period 1:10 years, Berggren [23] 3.47 · 10 5
Preceding rainfall (during the first 27.5 min) = 7 mm
2.73 · 10 5
Preceding rainfall (during the first 27.5 min) = 5.4 mm
Table 3. Initial pond height and porosity values of the up-flow SPB device.
Initial   Pond   Height   h 0 [m] Porosity   Φ 1 (%)
0.3   60
0.5   70
1   80
Table 4. Absorption time values ( T a p ) extracted from the plots for different porosity, initial pond height, and rain intensity scenarios in all four cases.
ϕ 1 = 0.6 ϕ 1 = 0.7 ϕ 1 = 0.8 h 0 = 0.3   m h 0 = 0.5   m h 0 = 1   m I = 0.53 · 10 5 m s
per Unit Area
I = 0.68 · 10 5 m s
per Unit Area
I = 3.47 · 10 5 m s
per Unit Area
T a p s for case 1indefinite252314584072522indefiniteno rainno rainno rain
T a p s for case 2indefinite922116494239220indefinite46309221indefinite
T a p s for case 34614103661484101481no rainno rainno rain
T a p s for case 44724203701534201540417419458
Disclaimer/Publisher’s Note: The statements, opinions and data contained in all publications are solely those of the individual author(s) and contributor(s) and not of MDPI and/or the editor(s). MDPI and/or the editor(s) disclaim responsibility for any injury to people or property resulting from any ideas, methods, instructions or products referred to in the content.