Article

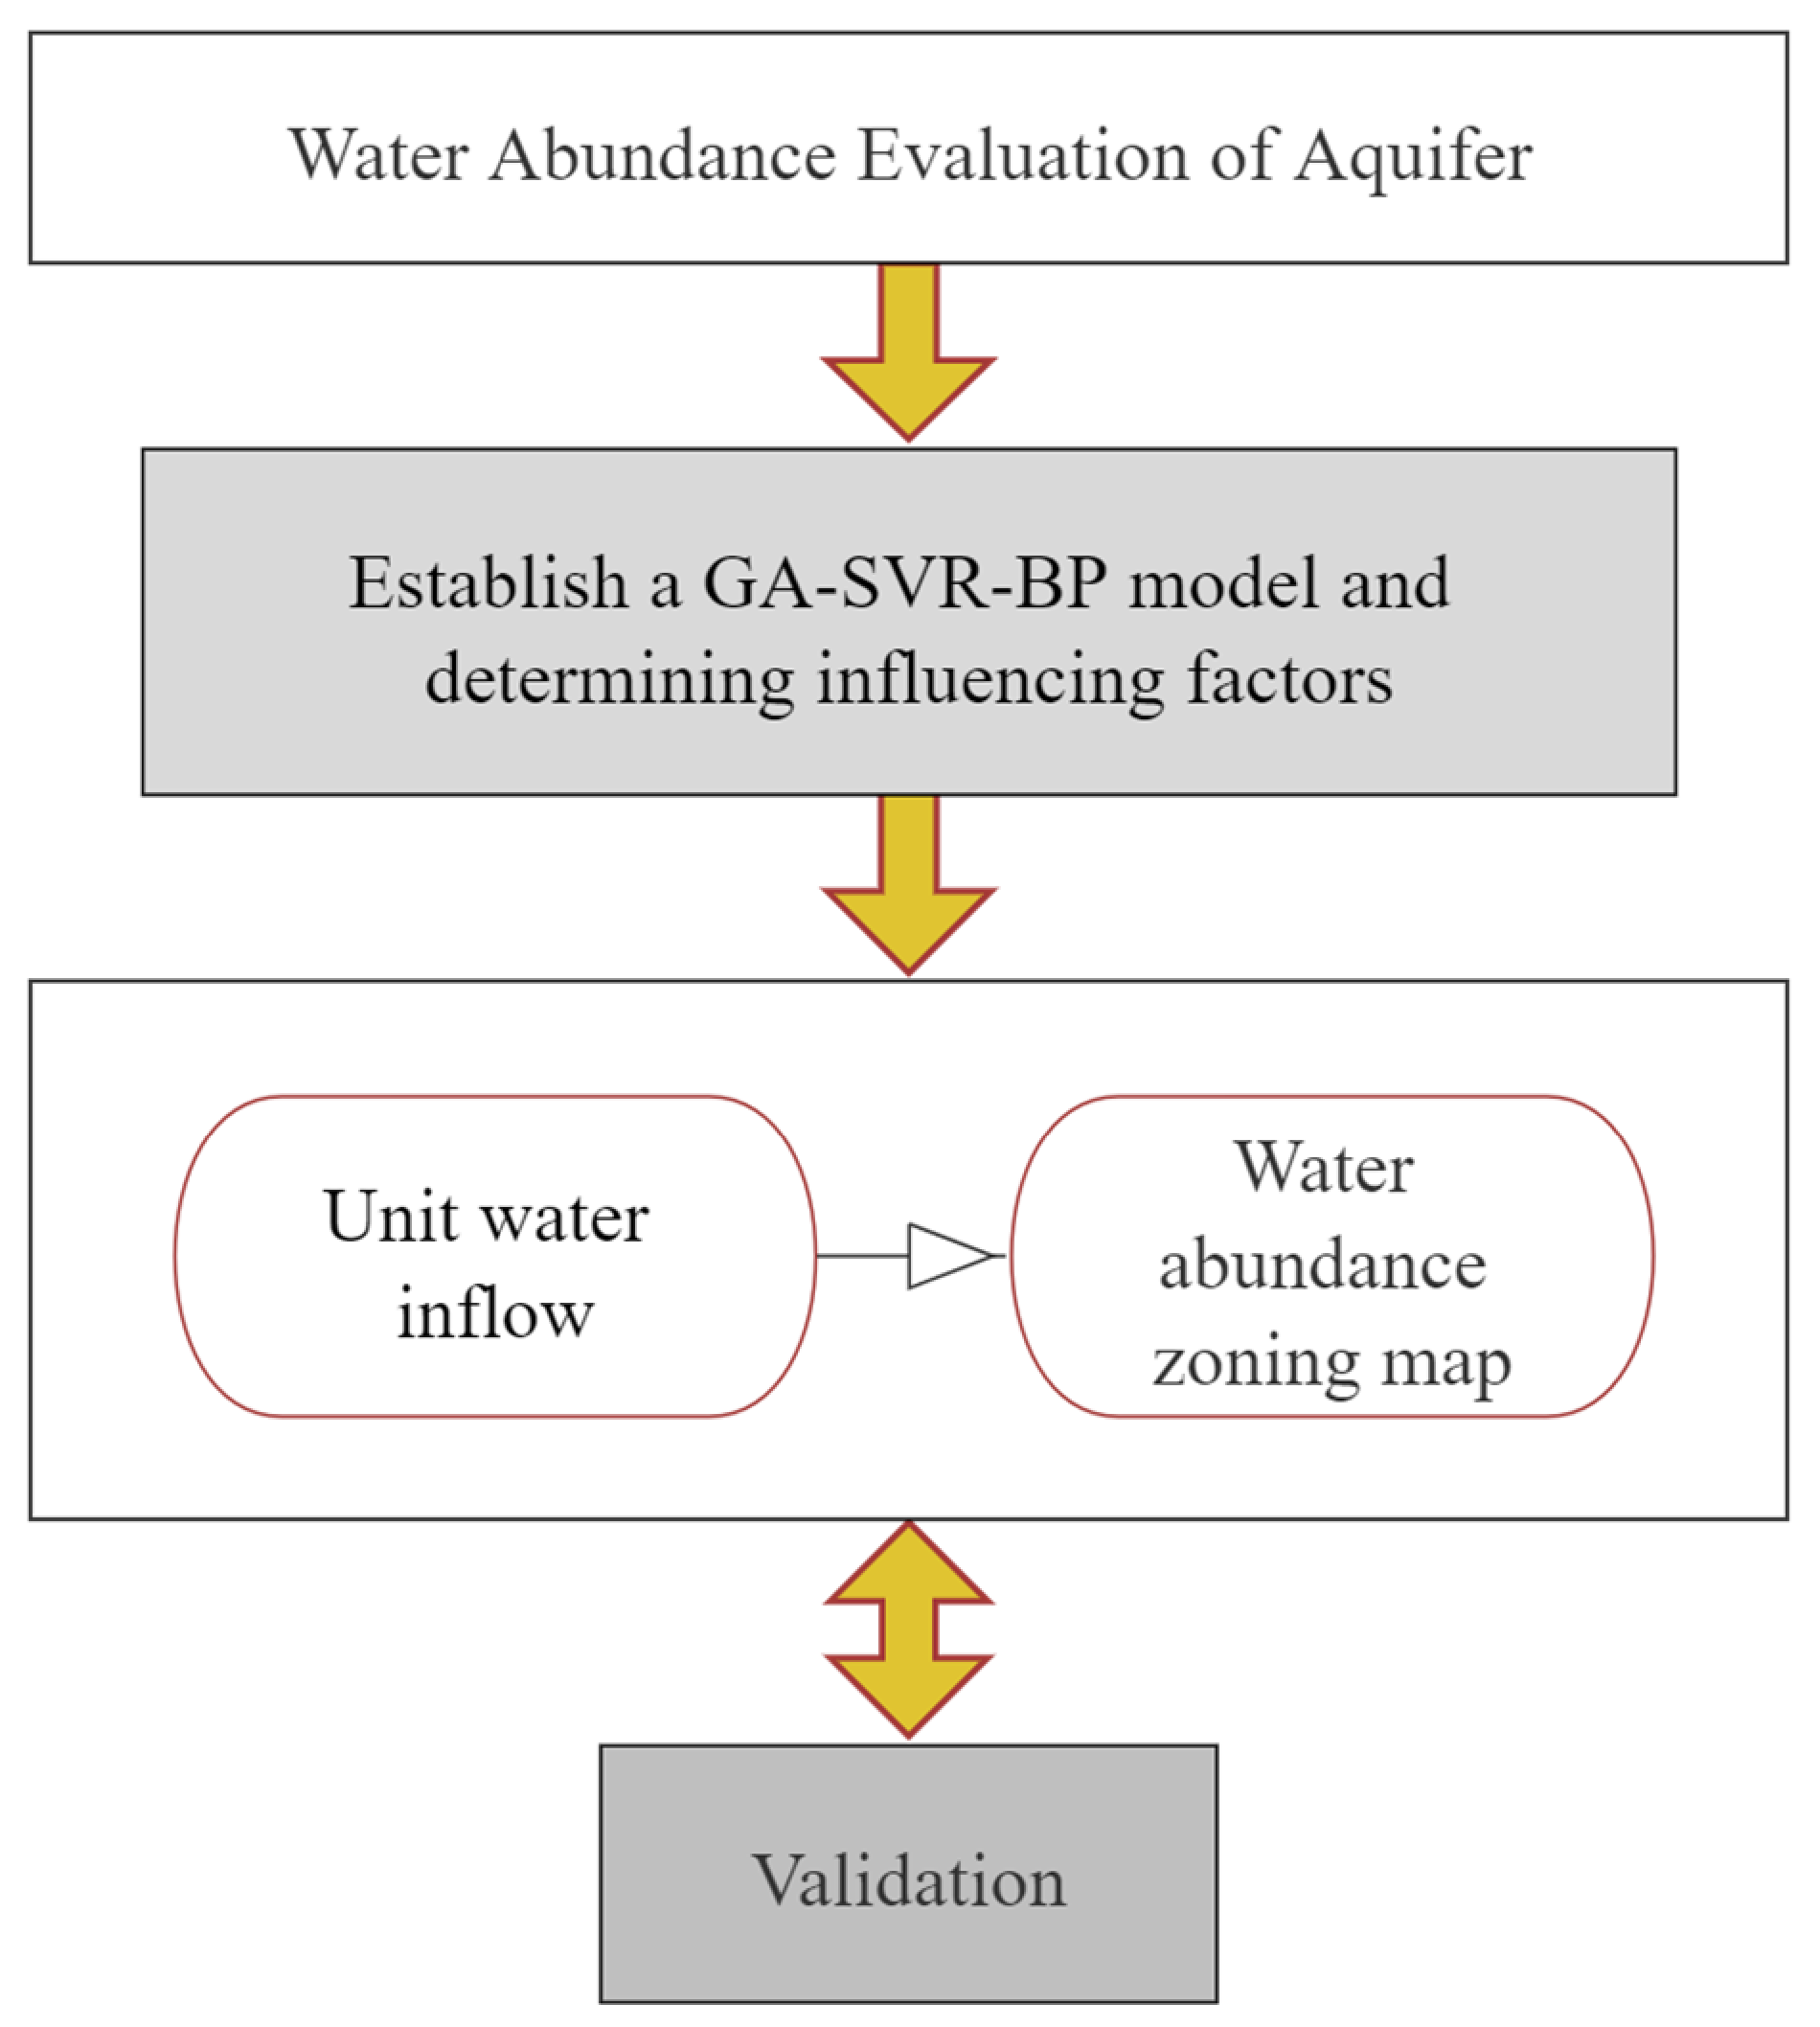
Water Abundance Evaluation of Aquifer Using GA-SVR-BP: A Case Study in the Hongliulin Coal Mine, China

1
School of Resources and Geoscience, China University of Mining and Technology, Xuzhou 221116, China
2
National Investment Hami Energy Development Co., Ltd., China Coal Energy Group Co., Ltd., Hami 839000, China
*
Author to whom correspondence should be addressed.
Water 2023, 15(18), 3204; https://doi.org/10.3390/w15183204
Submission received: 31 July 2023 / Revised: 23 August 2023 / Accepted: 6 September 2023 / Published: 8 September 2023

Abstract

:
At present, coal accounts for more than 56% of China’s primary energy consumption and will continue to dominate for a long time in the future. With the continuous expansion of the mining intensity and scale of Jurassic coal resources in Northwestern China, the problem of mine roof water disasters is becoming increasingly serious. The degree of harm is related to the hydrogeological structure of the overlying strata of the coal seam. Reasonable and effective prediction and evaluation of the water abundance of the coal seam roof aquifer is conducive to making scientific decisions on the prevention and control of roof water disasters, so as to achieve safe mining. In order to solve the problem of water abundance evaluation in mining areas lacking hydrological holes, taking the Hongliulin coal mine in Shennan mining area as an example, four main control factors for water abundance were selected: sandstone thickness, core recovery ratio, brittle rock thickness ratio, and flushing fluid consumption. Combined with unit water inflow and multiple factor comprehensive analysis, a back propagation (BP) artificial neural network and support vector machine regression (SVR) were introduced into water abundance evaluation. The reciprocal variance method was used to predict the measured unit water inflow. Finally, according to the “Detailed Rules for Coal Mine Water Prevention and Control”, the water abundance of aquifers was classified to verify the accuracy of the model and partition the water abundance of the study area. The results indicate that, based on the predicted results of unit water inflow, out of 37 borehole data, 22 weak water abundance holes and 15 medium water abundance holes were evaluated correctly, verifying their applicability. The study area was generally weak in water abundance, with two grades of medium and weak. The medium water abundance area was mainly located in the north and south of the study area, and the weak water abundance area was mainly located in the east and west. It can be seen that this evaluation model has certain applicability for evaluating the water abundance of coal seam roofs. It is of great significance, especially for the evaluation of water abundance in mining areas where hydrological holes are lacking.

1. Introduction

With the continuous expansion of the mining intensity and scale of Jurassic coal resources in the northwest of China, the problem of mine roof water damage is becoming increasingly serious. In order to solve the problem of water abundance evaluation in mining areas lacking hydrological holes, investigation and research is being conducted. The consumption of fossil fuels causes environmental emissions and climate change. In particular, coal accounts for more than 56% of China’s primary energy consumption (it is predicted that coal will still account for about 50% of the total consumption of primary energy by 2030) and will continue to dominate for a long time in the future. The northwest region of China has abundant coal resources and is an important coal production base. Among them, the Jurassic coalfield in northern Shaanxi (one of the seven major coalfields in the world) holds an important position in China’s coal resources and is a favorable development zone for coal resources [1,2,3]. The Shennan mining area is a large-scale coal production base in the Jurassic coal field of northern Shaanxi, with a total coal resource of about 5.5 billion tons, mainly including the Ningtiaota coal mine, Zhangjiamao coal mine, and Hongliulin coal mine. In recent years, coal production in the Shennan mining area has been reduced year by year. There have been multiple mine water inrush phenomena in the weathered bedrock area of the coal seam roof, which threatened the safety of underground mining. Coal seam mining inevitably exposes, damages, or interferes with the top and bottom aquifers. Although the mining process does not cause water inrush when exposed to areas with poor water abundance, water abundant areas are more likely to cause serious water inrush during the mining process [4]. With the continuous expansion of the mining intensity and scale of Jurassic coal resources in the northwest region, the problem of mine roof water damage is becoming increasingly serious. Therefore, conducting a reasonable and effective prediction and evaluation of the water abundance of the coal seam roof aquifer is not only conducive to comprehensively understanding the distribution of water abundance in the roof aquifer area within the mine field, but also has important significance for the protection of groundwater resources [5,6,7]. It is conducive to making more scientific risk prevention decisions, thereby reducing, or even eliminating, the hidden danger of water inrush in the mine.
Many scholars have conducted research on the evaluation of aquifer water abundance, mainly involving the on-site pumping test method [8,9,10,11], the geophysical exploration method [12,13], the and multi factor comprehensive analysis method [14,15,16,17,18,19].
Dhakate R [20] et al. combined hydrological and geomorphological data with geophysical surveys to partition the potential of groundwater in the Sujinda Valley. Wang P [21] studied the detection effect of the transient electromagnetic method on shallow and deep burnt rock groundwater, and the results showed that the transient electromagnetic method can accurately reflect the range of shallow and deep burnt rock groundwater. The results of geophysical exploration have multiple solutions, which affects the exploration accuracy of water abundance. Due to the large workload, high cost, and limited control range in the process of geophysical exploration and water pumping (discharge) testing, the multi factor comprehensive analysis method has been favored by domestic and foreign experts and scholars, and a large amount of research has been carried out [17,22,23]. The multi factor comprehensive analysis method is a comprehensive consideration of hydrogeological information related to the water abundance of aquifers obtained from geophysical exploration by extracting the main factors and using statistical analysis methods to predict the water abundance of aquifers [24,25]. Among the representative methods, the water abundance index method was proposed by Wu Q [26]. Wu X.R [27] et al. proposed the prediction of water yield of roof sandstone based on fuzzy clustering. Cui X.L [28] et al. proposed multiple information prediction and evaluation zones for the water abundance of coal seam roof sandstone. Xue J.K [29] et al. used the analytic hierarchy process and entropy weight method to evaluate the water abundance of igneous rock aquifers while considering the characteristics of expert experience and measurement data to determine the weights of each indicator, improving the accuracy of the results. The multi factor comprehensive analysis method is widely used in the evaluation of aquifer water abundance, which relies on hydrological holes and has certain limitations in determining factor weights.
At present, the main method of comprehensive evaluation for predicting the water abundance of aquifers is to first establish an indicator system for the influencing factors of water abundance, and then use methods such as analytic hierarchy process, principal component analysis, and grey theory to determine the degree of influence (i.e., weight) of each indicator [23,30,31,32]. However, the existing comprehensive evaluation methods rely on hydrological holes in the evaluation process, and the Coal Mine Water Prevention and Control Regulations (2018) clearly stipulate that the evaluation of the water abundance of the roof aquifer is based on the size of the unit water inflow of the borehole, and that the water abundance is divided into four levels: weak water abundance, medium water abundance, strong water abundance, and extremely strong water abundance [33]. However, the degree of hydrogeological exploration is relatively low in most coal mining areas in China, so the data used to determine the unit water inflow is usually unreliable.
For situations where the degree of hydrogeological exploration is low and the unit water inflow data is unreliable, the main aim of this article is to introduce artificial neural networks and support vector machines to solve the problem of water abundance evaluation in mining areas lacking hydrological holes. This study combined unit water inflow and multifactor comprehensive analysis and introduced back propagation (BP) artificial neural networks and support vector machines regression (SVR) into the evaluation of water abundance, in which combining the reciprocal variance method evaluates the water abundance of coal seam roof. Taking the Hongliulin coal mine in the Shennan mining area of western China as an example, 37 sets of borehole data were collected, with unit water inflow as the prediction target for water abundance. Taking into account the various factors affecting water abundance, such as sandstone thickness, core recovery ratio, brittle rock thickness ratio, and flushing fluid consumption, a water abundance prediction model was established by combining artificial neural networks and support vector machines regression to evaluate the water abundance of the Jurassic middle series bedrock fissure aquifer on the roof of the Hongliulin coal mine coal seam. Comparing the evaluation results with the measured data of unit water inflow, the results follow the distribution law of unit water inflow and do not completely depend on the unit water inflow. This method provides a new way for evaluating water abundance in areas lacking hydrological holes.
The specific objective of this research is (i) to provide a new way for evaluating water abundance and (ii) to solve the problem of water abundance evaluation in mining areas lacking hydrological hole. This study consists of four parts: Introduction, Materials and Methods, Results, and Conclusions. The Section 2 describes the research area and the research methods (BP neural networks and SVR). The Section 3 is a description of the results of the GA-SVR-BP model, and the Section 4 is an analysis of the water abundance evaluation results obtained by the study.

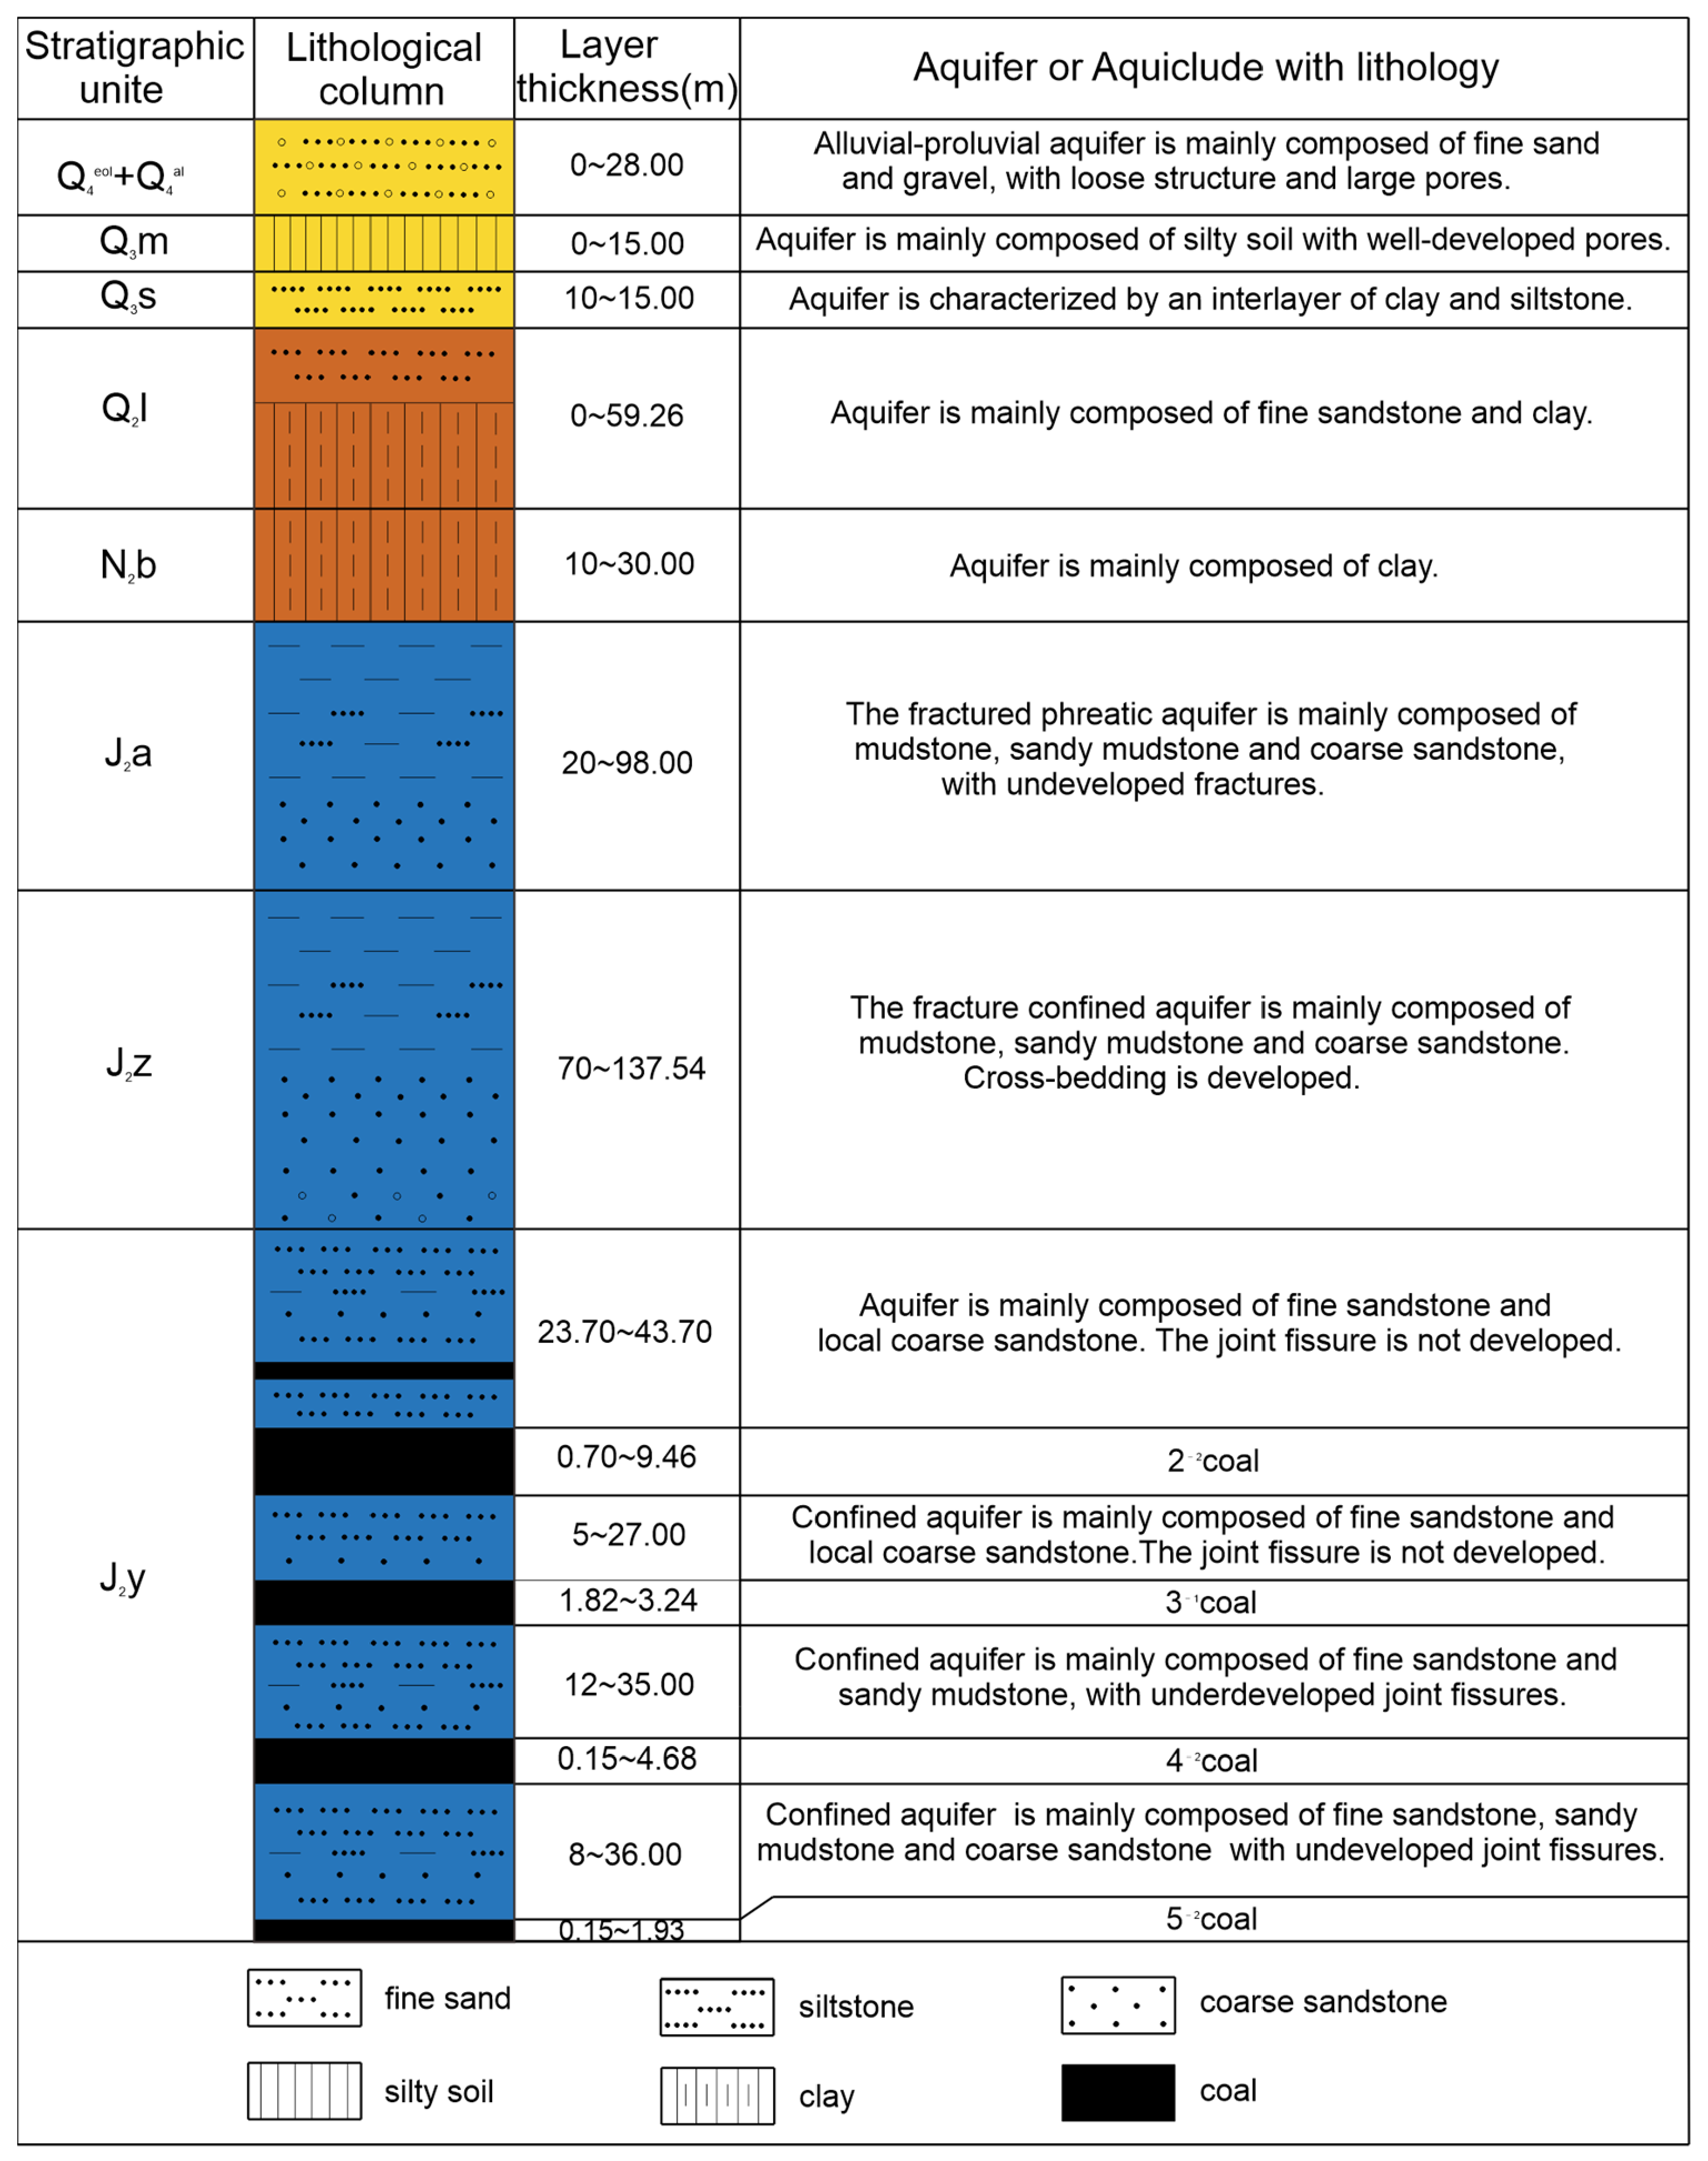
2. Materials and Methods

2.1. Overview of the Research Area

The Hongliulin coal mine is located in the Shennan mining area in the central northern part of Shenmu County, Yulin City, Shaanxi Province, about 36 km away from Shenmu County, with a mining area of 143.34 km2 (Figure 1). The strata in the study area, from new to old, are Quaternary Holocene eolian sand (Q4eol) and Alluvium (Q4al), Upper Pleistocene Malan Formation (Q3m) and Salawusu Formation (Q3s), Middle Pleistocene Lishi Formation (Q2l), Neogene Pliocene Baode Formation (N2b), Jurassic Middle Jurassic Anding Formation (J2a), Zhiluo Formation (J2z), Yan’an Formation (J2y), and Fuxian Formation (J2f). The stratum in the mine field is flat, and the overall structural trend is monocline structure inclined to NWW. The west of the mine field has a simple monocline structure, and the east is relatively flat. The coal seams 1−2, 2−2, 3−1, 4−2, 4−3, 5−2 in Jurassic Yan’an Formation are mainly exploited.
The main aquifers in the mine field include the Quaternary loose pore phreatic aquifer, the Jurassic Middle Anding Formation fractured phreatic aquifer, the Zhiluo Formation fractured confined aquifer, and the Yan’an Formation fractured confined aquifer. The lithology of the aquifer is mainly sandstone. The schematic diagram of the main mining coal seam and aquifer is shown in Figure 2.
With the extension of the mining area, the mines in the Shennan mining area have experienced multiple water inrush phenomena. Among them, during the first mining face of the southern wing of the Ningtiaota mine, the maximum water inflow reached 1300 m3/h, which caused the working face to be flooded and shut down. The local roof of the mining area has strong water abundance and is a water source that threatens the mine. Therefore, the evaluation of the water abundance of the roof aquifer in the Hongliulin coal mine in the Shennan mining area has great significance for safe coal mining, groundwater resource protection, and sustainable development.

2.2. Method

2.2.1. Principles of Support Vector Machines

Assuming that the existing input samples are n-dimensional vectors, the samples and corresponding output values are (x1, y1), (x2, y2), …, (xk, yk). The regression problem is to find a mapping so that x outside the sample can find the corresponding y value through the mapping f(x). The basic principle of support vector machine regression (SVR) is to map complex low dimensional nonlinear regression problems φ(x) transforming into linear regression in high-dimensional space. SVR is used to find the regression function [34], namely:
f x = w φ x + b
In this formula: w is the weight vector and b is the threshold.
According to statistical theory, the SVM regression function can be determined by minimizing the following objective numbers:
R w = 1 2 w T w + C i = 1 n ξ i + ξ i *
s . t . y i f x i ε + ξ i f x i y i ε + ξ i ξ i , ξ i * 0
In this formula, ξ and ξ * are non-negative relaxation variables; ε is an insensitive loss function parameter; and C is a penalty factor, its function is to compromise between empirical risk and model complexity.
The Lagrange method is used to solve the above constrained optimization problem, and the original problem is transformed into its dual problem, namely:
J α i , α i * = m a x 1 2 i = 1 n j = 1 n α i α i * α j α j * K x i , x j + i = 1 n α i * y i ε i = 1 n α i y i ε
s . t . i = 1 n α i α i * = 0 0 α i , α i * C
In the formula, K x i , x j = θ ( x i ) · θ ( x j ) is the kernel function of SVM; α i , α i * is the lagrange coefficient.
The SVM regression function can be obtained:
f x = i = 1 n α i α i * K x i , x + b
where: the kernel function adopts Radial basis function, namely K x i , x j = e x p ( g | x i x i | 2 ) ; g is the parameter width of the kernel function.

2.2.2. BP Artificial Neural Network

A BP neural network is a multi-layer feedforward network trained based on an error backpropagation algorithm, which generally includes an input layer, output layer, and hidden layer. Each neuron in each layer is fully connected, while there is no connection between neurons in the same layer. When learning samples are provided to the network, the network randomly generates weights and thresholds for each neuron. The neuron calculates the input samples according to the weight and threshold value and transmits them to the lower layer until the calculation results are output at the output layer. The ideal output is compared with the calculation results to determine the value of the calculation error function. Each layer modifies the weight value and threshold value according to the error, so it is named an “error back propagation learning algorithm”. As this error backpropagation correction continues, the accuracy of the network’s response to the input mode continues to improve until the set conditions are met and the training is completed. The BP algorithm can be divided into two aspects [35]:
  • Input mode forward propagation
Firstly, calculate the actual output value of the learning sample according to Equations (7) and (8) based on the randomly given initial weight W and threshold b. The relationship between the input layer and the hidden layer is:
H i d d e n j = f i = 1 n W i j a i + b 1 j
The relationship between the hidden layer and the output layer is:
o u t l = f j = 1 q W j l H i d d e n j + b 2
In the equation, a i is the i-th input; b 1 j and b 2 are the thresholds for the hidden layer and the output layer, respectively; f is the transfer function; H i d d e n ( j ) is the output of the j-th node in the hidden layer; W i j   W j l are the weights are from the input layer to the hidden layer and from the hidden layer to the output layer.
2.
Output error backpropagation
When the output node gets the actual output value, if the error between these actual output values and the expected value is greater than the acceptable range, it is necessary to correct the weight and threshold of the network. As long as the weight is corrected in the direction of the negative gradient of the Error function, the error will not continue to increase.
Assuming the mean square value of absolute error is:
E K = i = 1 l δ i l 2 2
The adjustment amount of the weight value is:
Δ W = β g r a d v E k
where, β is the learning rate.
This article borrows Genetic Algorithm (GA) to optimize the parameter selection of BP neural network and SVR. GA was proposed by Holland under the inspiration of biological evolution. Due to its ability to effectively solve complex system optimization problems, it has become a hot topic in multiple interdisciplinary fields and has also been widely applied in geotechnical engineering. GA is a bionic algorithm, designed by the principle of biological evolution, that searches for the optimal solution. It simulates the natural process of genetic recombination and evolution and encodes the parameters of the problem to be solved, that is, genes. Several genes form a chromosome (individual). Many chromosomes perform operations similar to natural selection, pairing crossover, and mutation, and go through repeated iterations (generation inheritance) until the final optimization result is obtained. GA is based on population rather than single point search and can simultaneously obtain multiple extremum values from different points. Therefore, it is not suitable to fall into local optima [36]. The basic operation process is as follows: treat the input data of the algorithm as the initial population, calculate the fitness of individuals in the population, apply selection operators, crossover operators, and mutation operators to the population, and obtain the next generation population through these operations. When the maximum evolution algebra is reached, terminate the operation, and output the individuals with the maximum fitness. GA uses the optimal individual to optimize the initial weights and thresholds of the BP network and performs optimization on the parameters C and g in the SVR model, making the final prediction results closer to the actual measured values.

2.2.3. GA-SVR-BP

The procedures of this study are shown in Figure 3. Different methods have different modeling mechanisms and starting points. Combining different methods to comprehensively utilize the advantages of various methods to achieve the goal of improving prediction accuracy. This article uses the reciprocal variance method to combine a BP neural network and SVR to minimize the absolute value of prediction error. By using the following optimization model to solve for the weight coefficients, the optimal weight coefficients of the prediction method at each sample point can be obtained.
m i n J t = e t = | i = 1 n K i t e i t | s t i = 1 n K i t = 1 , K i t 0   t = 1 , 2 , , M
In the formula: e t is the error at the t (1, 2, …, n) th sample after GA-SVR-BP prediction; e i t is the prediction error of the i-th (i = 1, 2) method (SVR and BP) at the t-th (1, 2, …, n) sample; K i t is the weight of the i-th method at the t (1, 2, …, n) th sample.

2.3. Analysis of Factors Affecting Water Abundance
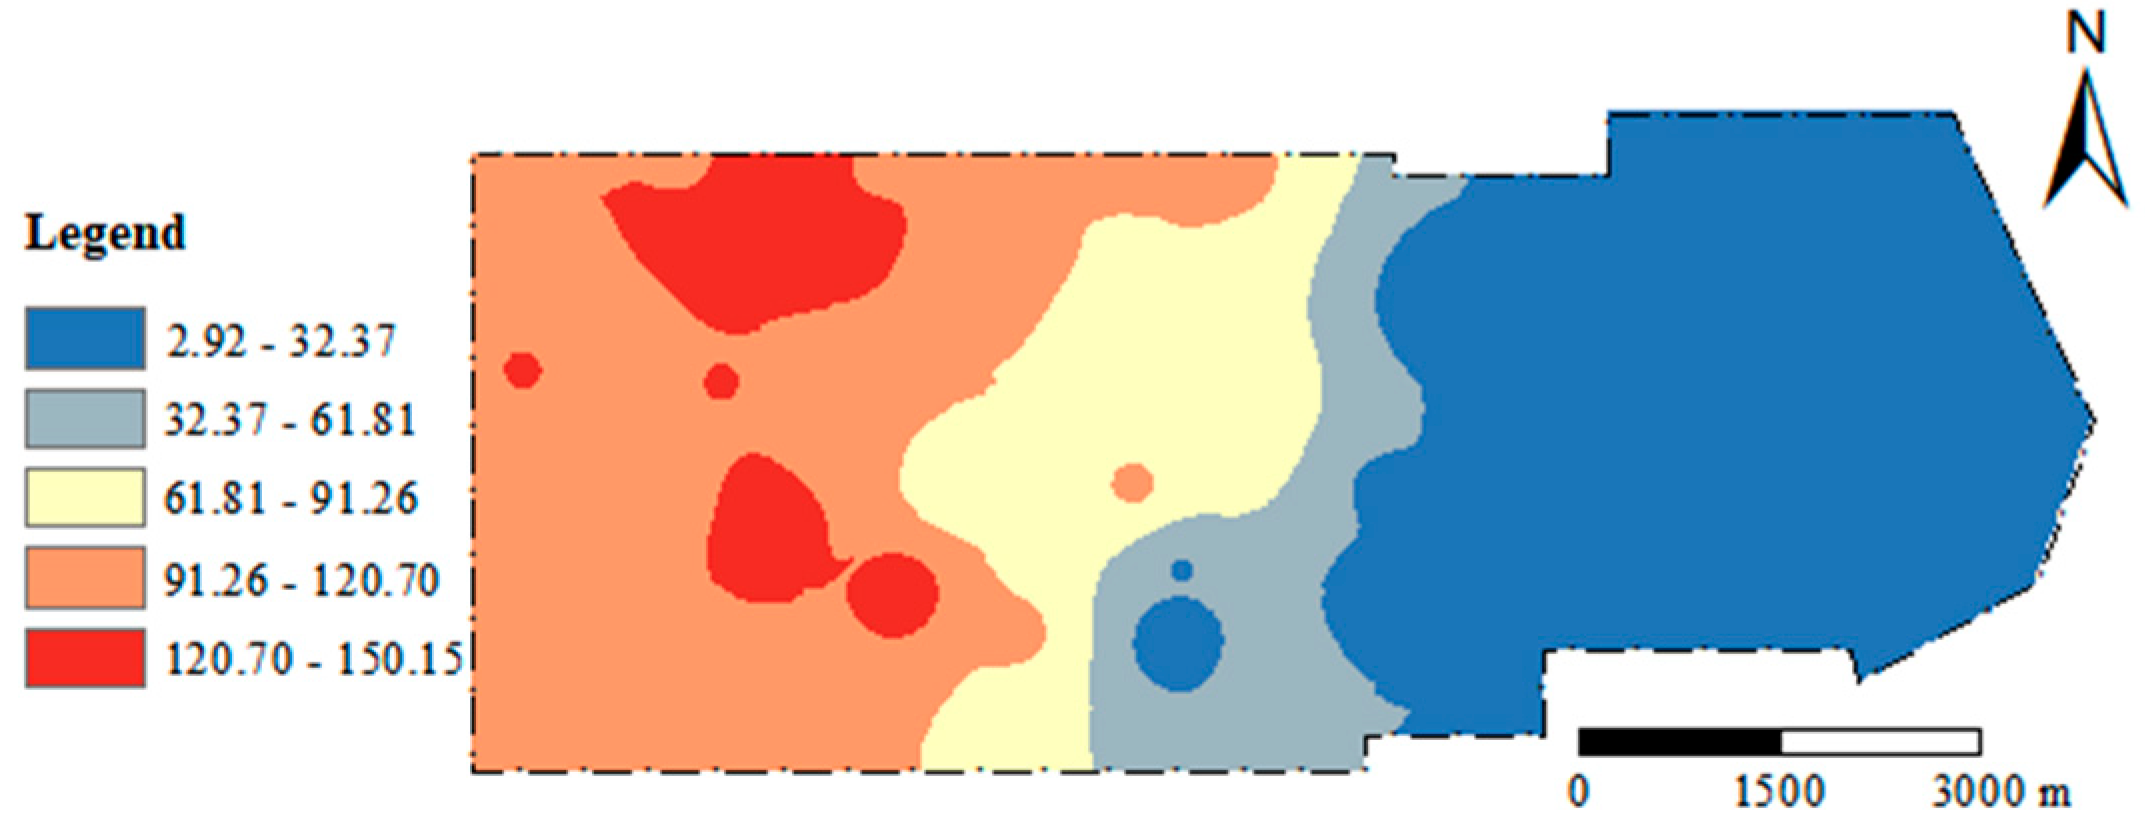
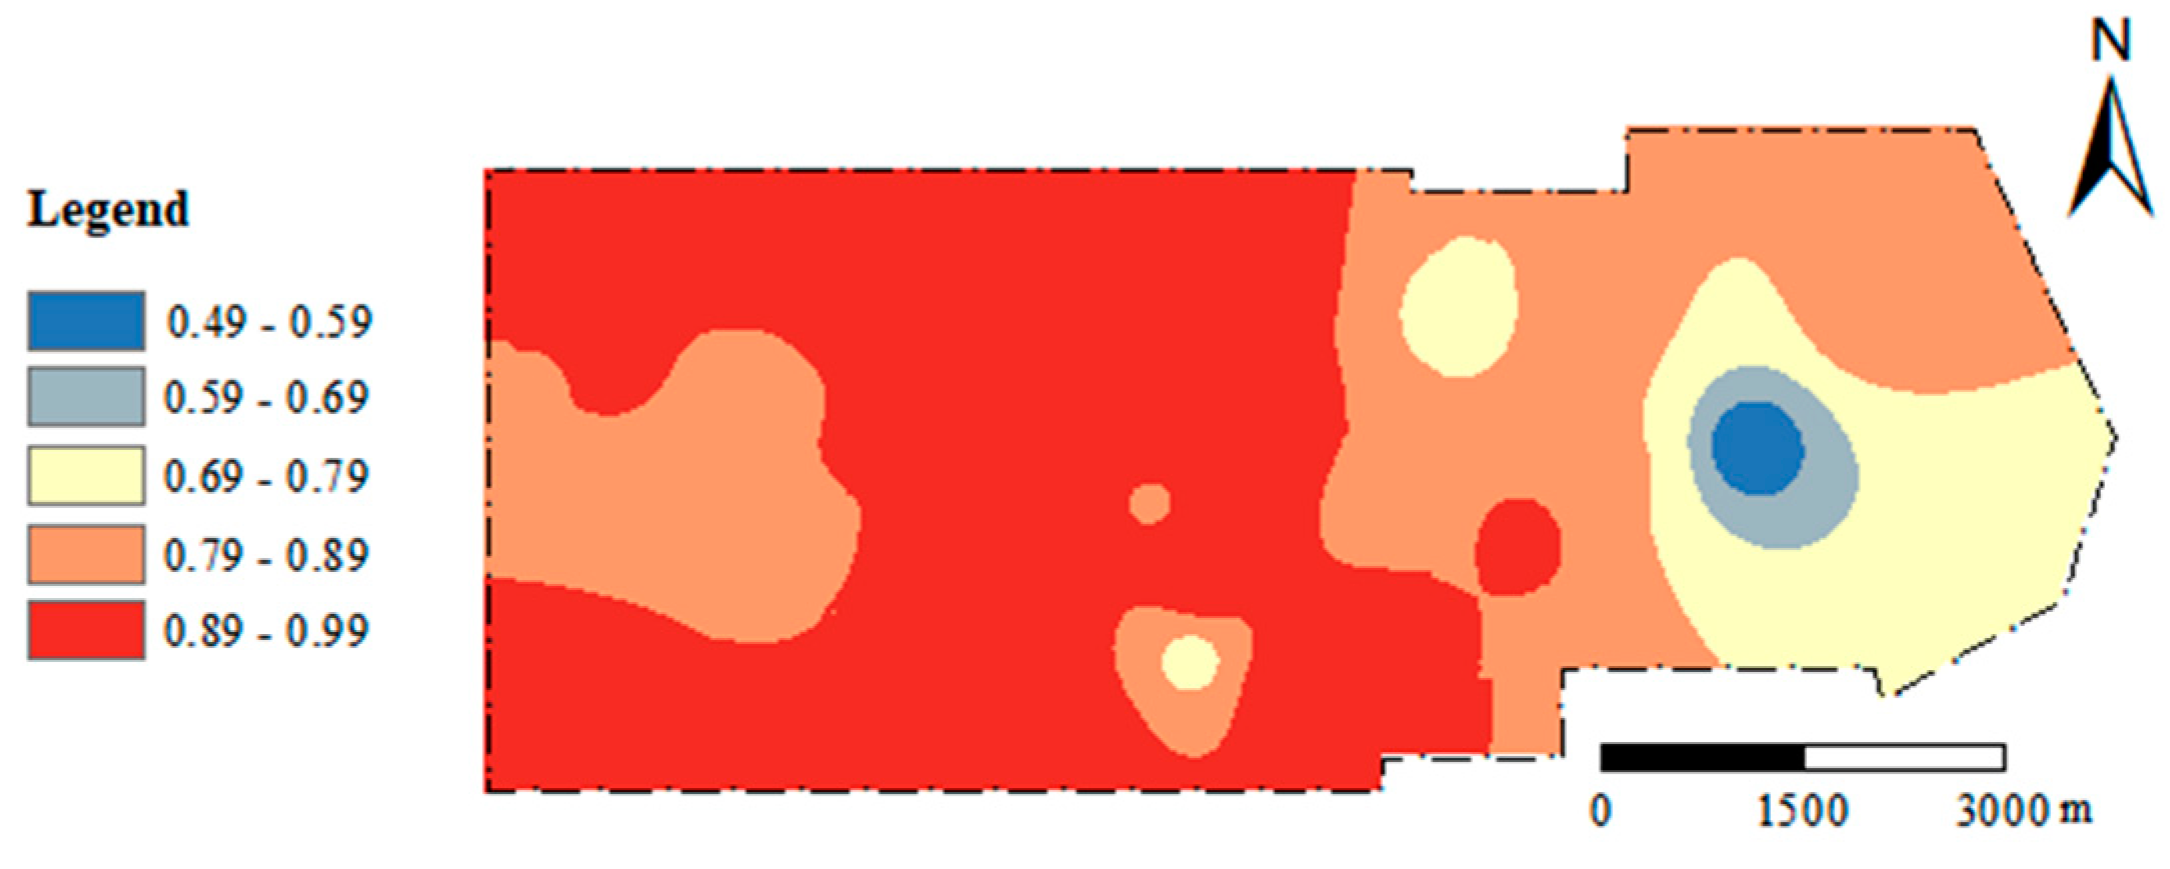
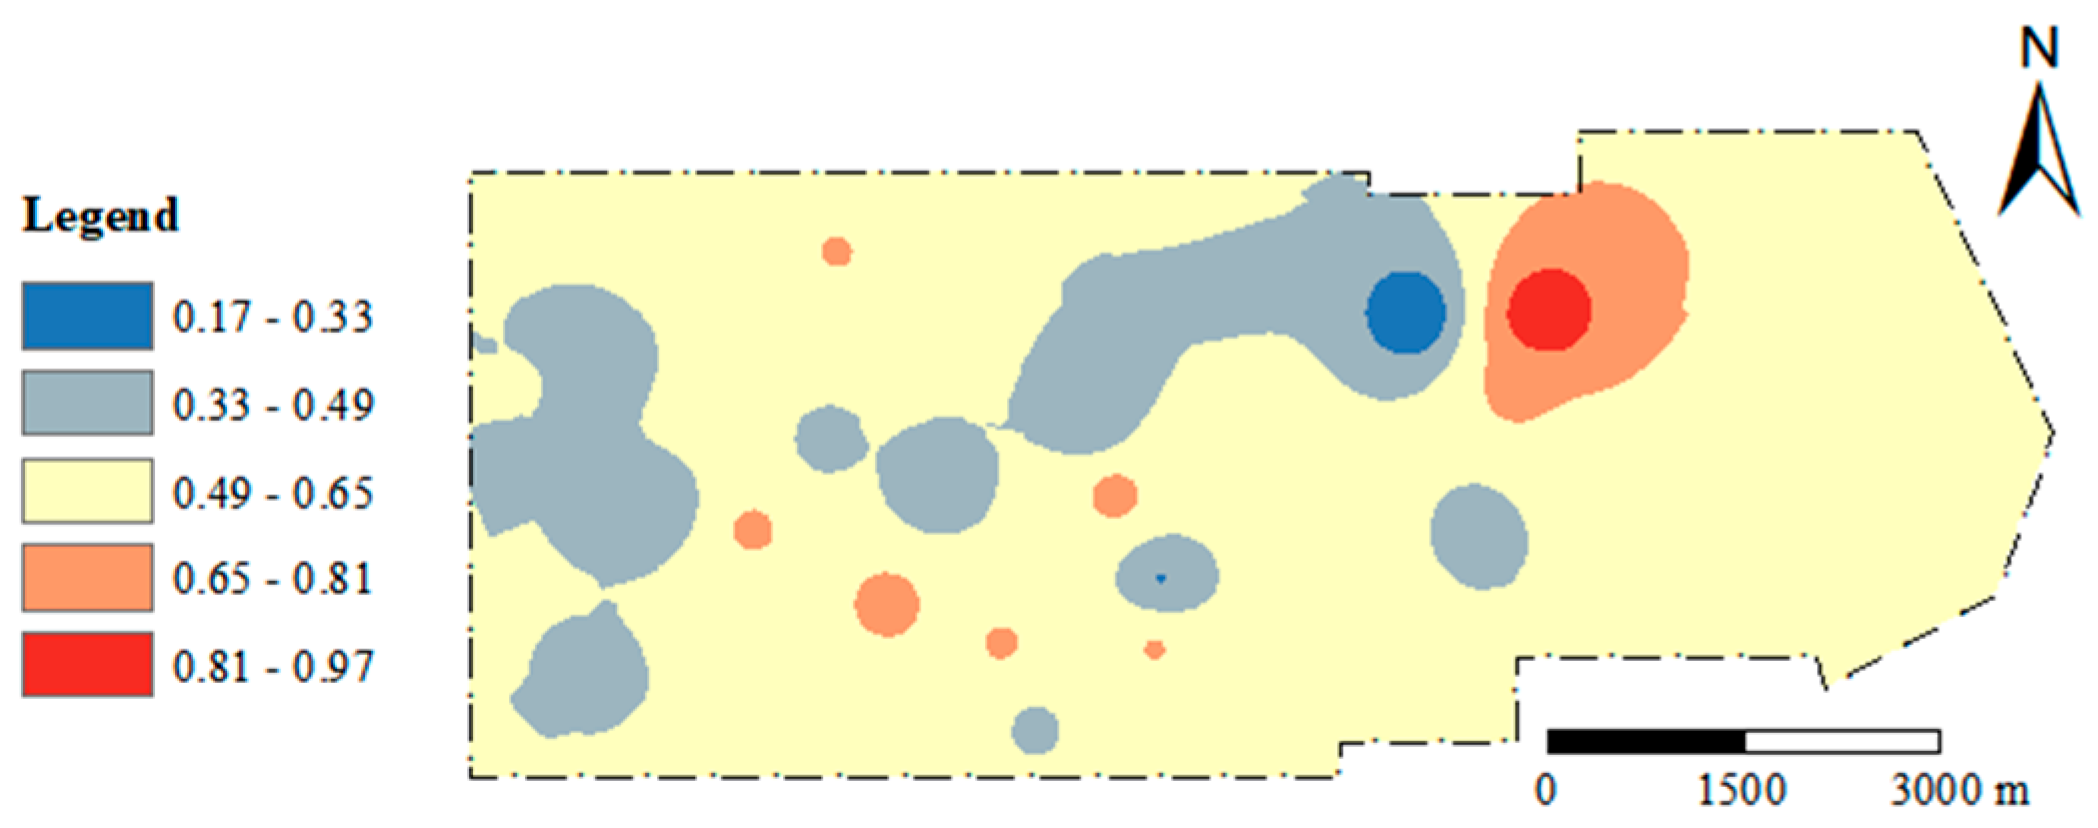
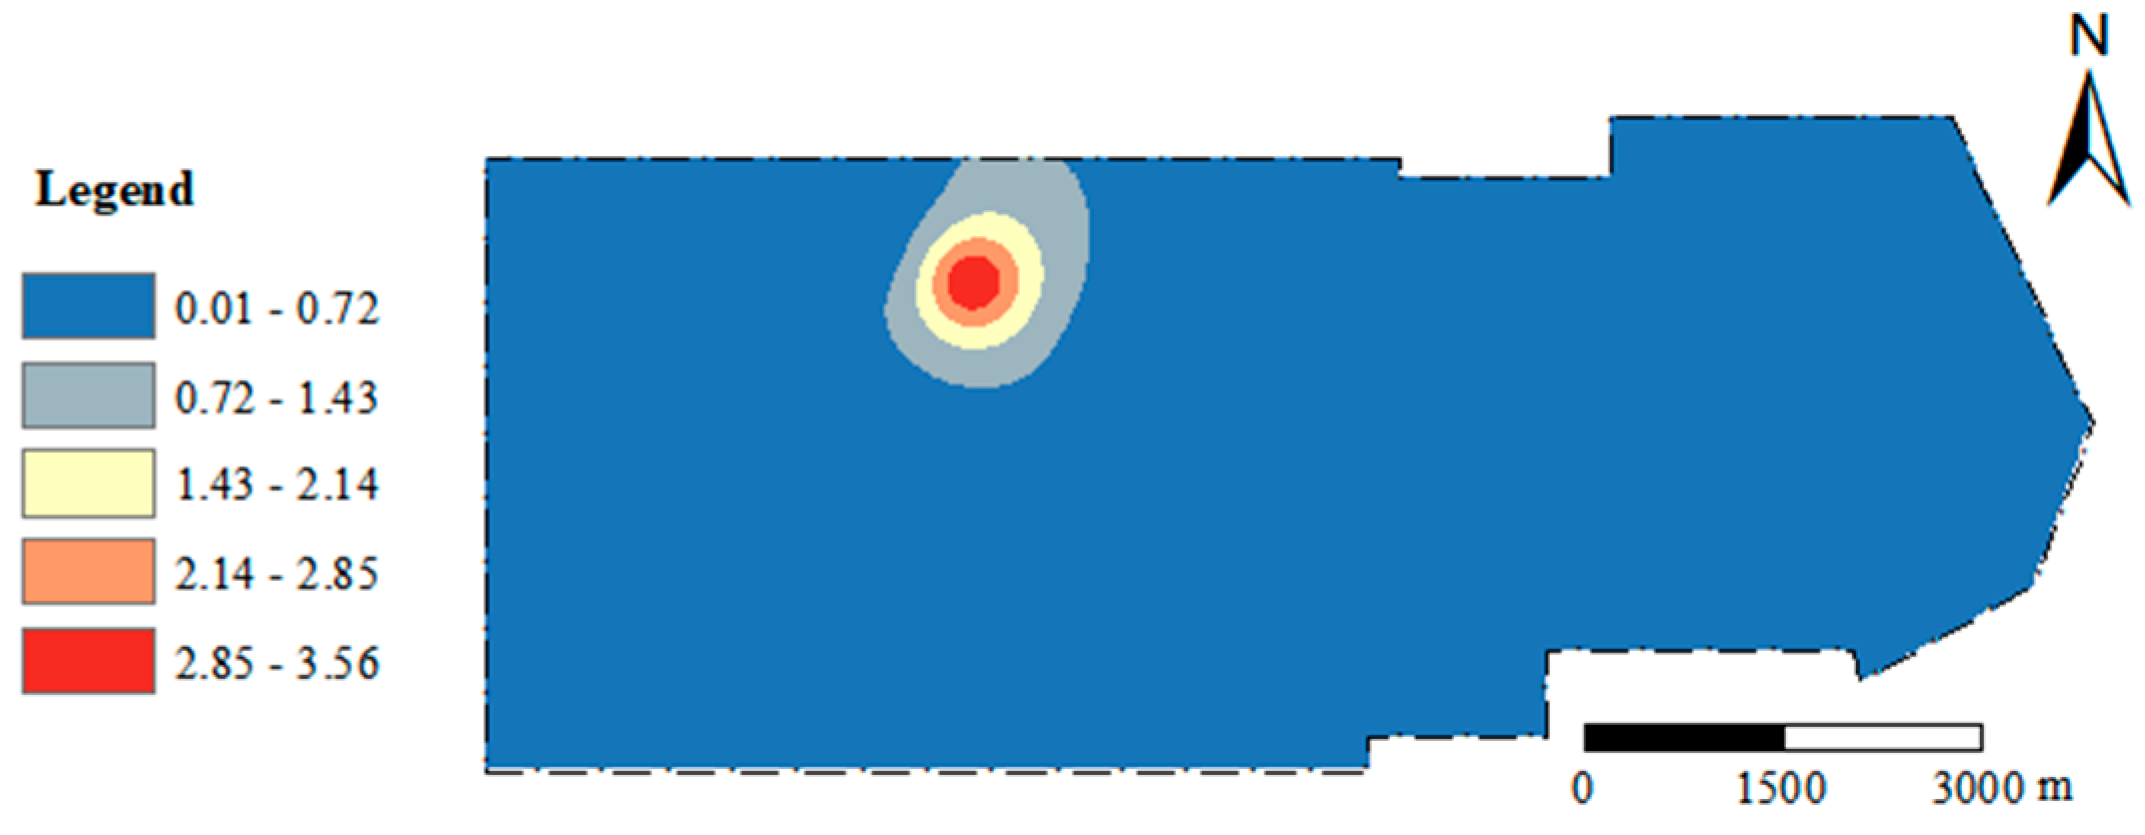
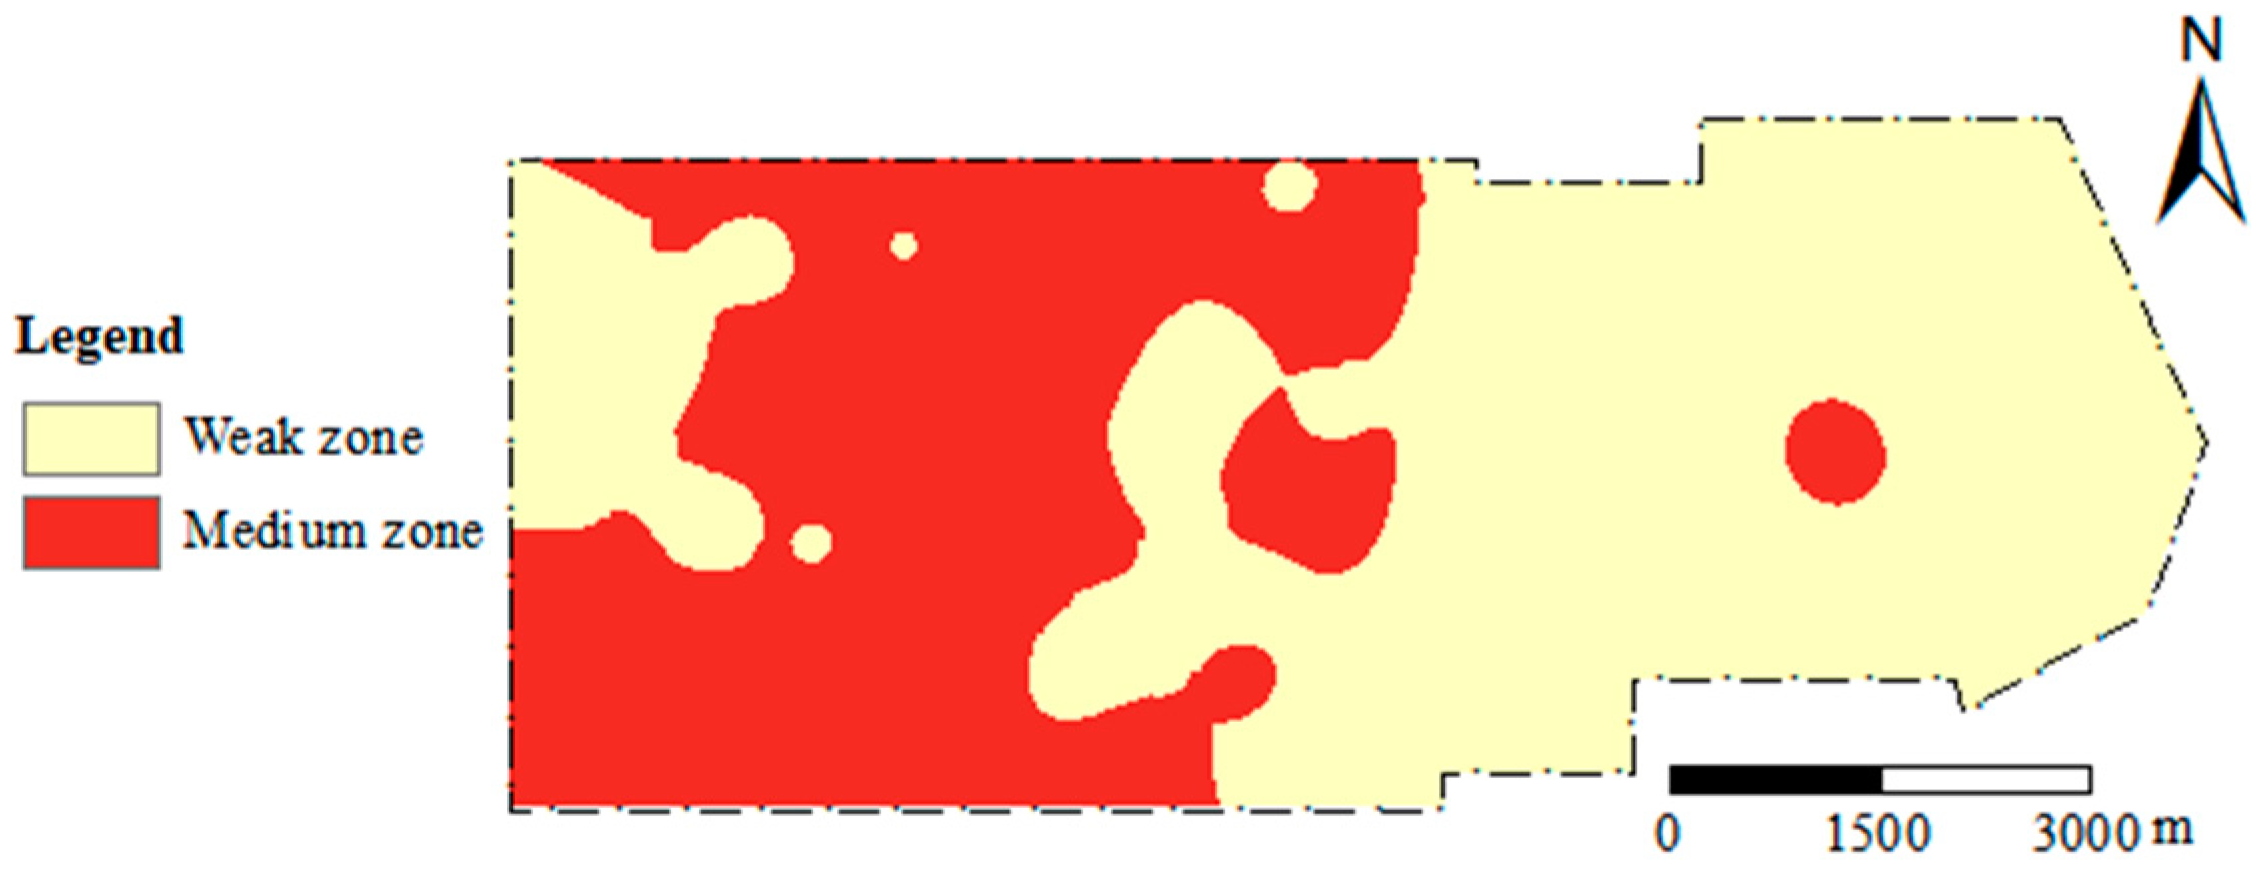
There are many factors that affect the water abundance of aquifers. Based on previous experience in evaluating water abundance, this article comprehensively considers the thickness of aquifers, rock core recovery ratio, brittle rock thickness ratio, and flushing fluid consumption as influencing factors.
The thickness of sandstone on the roof of coal seams is a direct indicator of the strength of water abundance, which represents the size of water storage space. Under certain other conditions, the larger the sandstone thickness, the larger the water storage space, and the stronger the water abundance. An established thematic map of sandstone thickness is shown in Figure 4.
The core recovery rate refers to the ratio of the length of the extracted core to the footage per round trip, which to some extent reflects the degree of fracture development in the rock layer. Generally speaking, the higher the core recovery ratio, the higher the integrity of the rock layer, and the relatively undeveloped the fractures are. The smaller the core recovery ratio is, the higher the degree of rock fracture development and the poorer the integrity of the rock layer. An established thematic map of core recovery ratios shown in Figure 5.
Under the influence of tectonic stress, underground rock layers may produce cracks. But the degree of crack development varies depending on the lithology. Brittle rocks (fine, medium, and coarse sandstone) often release stress in the form of fractures, with a high degree of fracture development. Plastic rocks (mudstone, siltstone, etc.) often use plastic deformation to release stress, and the fracture development is low. Therefore, the ratio of the thickness of brittle rock to the thickness of the stratum can be used to indicate the degree of fracture development, and the larger the ratio, the better the water abundance. An established thematic map of brittle rock thickness ratio is shown in Figure 6.
During the drilling process, when encountering rock formations with developed pores and fractures, the phenomenon of flushing fluid leakage may occur at any time. Usually, these areas have good water abundance, and the consumption of flushing fluid indirectly reflects the degree of development of tensile fractures that can store water in the rock mass, which is commonly used to evaluate the water abundance of the stratum. An established thematic map of flushing fluid consumption is shown in Figure 7.

3. Results

Taking into account the sandstone thickness, core recovery ratio, brittle rock thickness ratio, and flushing fluid consumption as evaluation indicators, the unit water inflow is used as the evaluation objective for training the BP neural network and SVR. We used 37 sets of learning samples (Table 1) to train the GA-BP and GA-SVR models using MATLAB (2021a) software. GA was used to optimize the weights and thresholds of the BP neural network and parameter C and g in the SVR model. The parameters for GA optimization were set as follows: the number of populations was 20, the maximum number of iterations was 100, the variation range of parameter C was [0.001,1000], and the variation range of parameter g was [0.001,1000]. The BP neural network consisted of three layers: input layer, hidden layer, and output layer, with a model target error of 0.0001. The water abundance evaluation model was obtained by combining the reciprocal variance method, and the predicted results are shown in Table 1.
From the thematic map of sandstone thickness (Figure 4), it can be seen that the thickness of sandstone in the mining area gradually weakens from west to east, indicating weak water abundance in the east. According to the thematic map of core recovery rate (Figure 5), it can be seen that the core recovery rate is relatively high in the central area of the mining area, and the integrity of the central rock layer is poor. According to the thematic map of brittle rock thickness ratio (Figure 6), it can be seen that the thickness ratio of brittle rock in a large area of the mining area is moderate. According to the thematic map of flushing fluid consumption (Figure 7), it can be seen that the overall flushing fluid consumption in the mining area is relatively low, and there is a small difference in water abundance levels.
According to the “Regulations on Water Prevention and Control in Coal Mines”, the water abundance of aquifers is classified into four levels based on the q value of the unit water inflow of boreholes, namely weak, medium, strong, and extremely strong (Table 2). This is used to verify the accuracy of the model and the validation process is shown in Table 1. Among the 37 borehole data, 22 weak water abundance layers and 15 medium water abundance layers were evaluated correctly. In the individual SVR prediction, one weak water abundance hole was predicted incorrectly, while in the individual BP prediction, seven weak water abundance holes were predicted incorrectly, and three medium water abundance holes were predicted incorrectly. The water abundance zones of the entire region are shown in Figure 8, and are, respectively, weak and medium water abundance zones. Among them, 59.40% are areas with medium water abundance, mainly located in the central north and central south of the study area; meanwhile, 40.60% are areas with weak water abundance, mainly located in the east and west.

4. Conclusions

For situations where the degree of hydrogeological exploration is low and the unit water inflow data is unreliable, this study combines unit water inflow and multifactor comprehensive analysis, introduces artificial neural networks and support vector machines regression into the evaluation of water abundance, and evaluates the water abundance of coal seam roof using the reciprocal variance method.
This model comprehensively considers various control factors, including sandstone thickness, core recovery ratio, brittle rock thickness ratio, and flushing fluid consumption. Different methods are appropriately combined to comprehensively utilize the advantages of various methods to improve prediction accuracy.
The aquifer water abundance evaluation model of the multi factor composite GA-SVR-BP was verified, and the evaluation results comply with the provisions of the “Coal Mine Water Prevention and Control Regulations”, with an accuracy rate of up to 100%. Moreover, the selected evaluation indicators can be obtained from ordinary geological exploration hole data, without the need for excessive on-site pumping tests and related geophysical exploration work. This solves the problem of unsatisfactory zoning results due to the small number of pumping holes and reduced the construction cost of pumping holes by eliminating the need for excessive pumping tests.
At present, research on the evaluation of aquifer water abundance mainly involves the on-site pumping test method, the geophysical exploration method, and the multi factor comprehensive analysis method. Mining areas lacking hydrological holes are unable to conduct pumping tests. Geophysical methods have multiple solutions and certain errors; furthermore, the multi factor comprehensive analysis method has a certain degree of subjectivity in determining the weight of influencing factors. On the basis of overcoming these shortcomings, this study provides new research ideas for the evaluation of water abundance. The influencing factors selected for this study include sandstone thickness, core recovery rate, brittle rock thickness, and flushing fluid consumption. With reliable data, collecting more influencing factors and more water abundance zoning levels may result in better results.
This result provides a reliable basis for solving the problem of water abundance evaluation in areas with low hydrogeological exploration level and a lack of hydrological holes. Furthermore, it has certain guiding significance for the prevention and control of water damage in coal mine roofs.

Author Contributions

Conceptualization, Q.W.; methodology, Q.W.; software, Y.H.; validation, L.Z.; formal analysis, W.L.; investigation, Y.H.; data curation, L.Z.; writing—original draft preparation, Q.W. and Y.H.; writing—review and editing, L.Z.; visualization, W.L. and Y.H.; supervision, W.L.; funding acquisition, Q.W. All authors have read and agreed to the published version of the manuscript.

Funding

This research was funded by the National Natural Science Foundation of China (Grant No. 42007240) and the project of “Enlisting and Leading” of China Coal (No.2022JB01). The funders of the funds are all Qiqing Wang.

Data Availability Statement

No new data were created or analyzed in this study. Data sharing is not applicable to this article.

Acknowledgments

The authors express their gratitude to everyone that provided assistance for the present study. The study was jointly supported by the National Natural Science Foundation of China (Grant No. 42007240) and the project of “Enlisting and Leading” of China Coal (No.2022JB01).

Conflicts of Interest

The authors declare no conflict of interest.

References

  1. Rui, G.; Hao, Y.; Feng, J.; Mei, X.C.; Wang, X.L. Influential factors and control of water inrush in a coal seam as the main aquifer. Int. J. Min. Sci. Technol. 2018, 28, 187–193. [Google Scholar] [CrossRef]
  2. Wang, Q.Q.; Li, W.P.; Chen, W.; Bai, H.Y. GIS-based assessment of landslide susceptibility using certainty factor and index of entropy models for the Qianyang County of Baoji city, China. J. Ear. Syst. Sci. 2015, 124, 1399–1415. [Google Scholar] [CrossRef]
  3. Wang, Q.Q.; Li, W.P.; Li, T.; Li, X.Q.; Liu, S.L. Goaf water storage and utilization in arid regions of northwest China: A case study of Shennan coal mine district. J. Clean. Product. 2018, 202, 33–44. [Google Scholar] [CrossRef]
  4. Wu, Q.; Xu, K.; Zhang, W.; Wei, Z. Roof aquifer water abundance evaluation: A case study in Taigemiao, China. Arab. J. Geosci. 2017, 10, 254. [Google Scholar] [CrossRef]
  5. Wu, Q. Research progress, problems, and prospects of mine water prevention and control and resource utilization in China. J. Coal Ind. 2014, 39, 795–805. [Google Scholar]
  6. Sun, Y.J.; Chen, G.; Xu, Z.M.; Yvan, H.Q.; Zhang, Y.Z.; Zhou, L.J.; Wang, X.; Zhang, C.H.; Zheng, J.M. Research progress on the current situation of water environment in coal mining areas and the treatment and utilization of mine water in China. J. Coal Ind. 2020, 45, 304–316. [Google Scholar]
  7. Peng, S.P.; Bi, Y.L. Key technologies and strategic considerations for ecological environment restoration in coal mining areas of the Yellow River Basin. J. Coal Ind. 2020, 45, 1211–1221. [Google Scholar]
  8. Nampak, H.; Pradhan, B.; Manap, M.A. Application of GIS based data driven evidential belief function model to predict groundwater potential zonation. J. Hydrol. 2014, 513, 283–300. [Google Scholar] [CrossRef]
  9. Jia, P.Z. Study on evaluation method of water abundance for aquifer in coal deposits. Coal Sci. Technol. 2017, 45, 168–172. [Google Scholar]
  10. Jiang, Z.L.; Tian, Y.H. Integrated geophysical technology applied to watery evaluation of sinkhole. Coal Sci. Technol. 2015, 43, 139–142. [Google Scholar]
  11. Medici, G.; West, L.J. Reply to discussion on ‘Review of groundwater flow and contaminant transport modelling approaches for the Sherwood Sandstone aquifer, UK; insights from analogous successions worldwide’ by Medici and West. Quart. J. Eng. Geol. Hydrogeol. 2023, 56, qjegh2021-176. [Google Scholar] [CrossRef]
  12. Streetly, M.; Chakrabarty, C.; McLeod, R. 2000. Interpretation of pumping tests in the Sherwood Sandstone Group, Sellafield, Cumbria, UK. Quart. J. Eng. Geol. Hydrogeol. 2000, 33, 281–299. [Google Scholar] [CrossRef]
  13. Li, M.X. Exquisite exploration of Jurassic burnt rock water abundance of northern part of Tarim Basin. Coal Min. Technol. 2018, 23, 15–17. [Google Scholar]
  14. Xiao, L.L.; Wei, J.C.; Niu, C. Study on the distortion of apparent resistivity curves caused by the ‘infnite’ electrode space of a Pole-Pole array and its correction. J. Appl. Geophys. 2015, 118, 124–138. [Google Scholar] [CrossRef]
  15. Yang, B.B.; Sui, W.H.; Duan, L.H. Risk assessment of water inrush in an underground coal mine based on GIS and Fuzzy Set Theory. Mine Water Environ. 2017, 36, 617–627. [Google Scholar] [CrossRef]
  16. Yang, B.B.; Yuan, J.H.; Duan, L.H. Development of a system to assess vulnerability of flooding from water in karst aquifers induced by mining. Environ. Earth Sci. 2018, 77, 91. [Google Scholar] [CrossRef]
  17. Yin, H.Y.; Shi, Y.L.; Niu, H.G. A GIS-based model of potential groundwater yield zonation for a sandstone aquifer in the Juye Coalfeld, Shandong, China. J. Hydrol. 2018, 557, 434–447. [Google Scholar] [CrossRef]
  18. Zeng, Y.F.; Wu, Q.; Liu, S.Q. Evaluation of a coal seam roof water inrush: Case study in the Wangjialing coal mine. China Mine Water Environ. 2018, 37, 174–184. [Google Scholar] [CrossRef]
  19. Shen, J.J.; Wu, Q.; Liu, W.T. The development of the water-richness evaluation model for the unconsolidated aquifers based on the extension matter-element theory. Geotech. Geol. Eng. 2020, 38, 2639–2652. [Google Scholar] [CrossRef]
  20. Dhakate, R.; Chowdhary, D.K.; Rao, G. Geophysical and geomorphological approach for locating groundwater potential zones in Sukinda chromite mining area. Environ. Earth Sci. 2012, 66, 2311–2325. [Google Scholar] [CrossRef]
  21. Wang, P. Transient electromagnetic methond exploration of burnt rock groundwater in shallow. Coal Min. Technol. 2018, 23, 21–24. [Google Scholar]
  22. Shi, S.Q.; Wei, J.C.; Yin, H.Y.; Xie, D.L.; Yang, J.H. Prediction of water abundance of sandstone aquifer in coal seam roof of Jisan coal mine. Coalf. Geol. Explor. 2017, 45, 100–104. [Google Scholar]
  23. Cao, Q.K.; Zhao, F. Risk assessment of water inrush from coal seam floor based on fuzzy support vector machine. J. Coal Ind. 2011, 36, 633–637. [Google Scholar]
  24. Biswas, S.; Mukhopadhyay, B.P.; Bera, A. Delineating groundwater potentilal zones of agriculture dominated landscapes using GIS based AHP techniques: A case study from Uttar Dinajpur district. West Bengal Environ. Earth Sci. 2020, 79, 302. [Google Scholar] [CrossRef]
  25. Ma, L.J.; Zhao, B.F.; Wang, H.; Gao, Y. Analysis of spatial differences in permeability based on sedimentary and structural features of the sandstone aquifer overlying coal seams in western China. Mine Water Environ. 2020, 39, 229–241. [Google Scholar] [CrossRef]
  26. Wu, Q.; Fan, Z.L.; Liu, S.Q.; Zhang, Y.W.; Sun, W.J. A GIS-based method for evaluating the water abundance of information fusion type aquifers—The water abundance index method. J. Coal Sci. 2011, 36, 124–1128. [Google Scholar]
  27. Wu, X.R.; Wei, J.C.; Yin, H.Y.; Zhang, Y.Q. Prediction of water yield of roof sandstone based on Fuzzy clustering—Taking Longgu Mine Field as an example. J. Shandong Univ. Sci. Technol. (Nat. Sci. Ed.) 2011, 30, c14–c18. [Google Scholar]
  28. Cui, X.E.; Li, W.P. Multivariate information prediction and evaluation of water abundance of sandstone in fully mechanized mining roof. Coalf. Geol. Explor. 2015, 43, 43–47. [Google Scholar]
  29. Xue, J.K.; Shi, L.; Wang, H.; Ji, Z.K.; Shang, H.B.; Xu, F.; Zhao, C.H. Water abundance evaluation of a burnt rock aquifer using the AHP and entropy weight method: A case study in the Yongxin coal mine, China. Mine Water Environ. 2021, 80, 417. [Google Scholar] [CrossRef]
  30. Wang, Y.; Han, J.; Gao, W.F. Evaluation of the water richness of Austrian limestone based on principal component analysis. Chin. Sci. Technol. Pap. 2017, 12, 1011–1014. [Google Scholar]
  31. Fan, L.M.; Ma, L.Q.; Yu, Y.H. Water-conserving mining influencing factors identification and weight determination in northwest China. Int. J. Coal Sci. Technol. 2019, 6, 95–101. [Google Scholar] [CrossRef]
  32. Onifade, M.; Genc, B. Spontaneous combustion liability of coal and coal-shale: A review of prediction methods. Int. J. Coal Sci. Technol. 2019, 6, 151–168. [Google Scholar] [CrossRef]
  33. State Administration of Coal Mine Safety Supervision. Detailed Rules for Water Prevention and Control in Coal Mines; Coal Industry Press: Beijing, China, 2018.
  34. Chai, H.B.; Zhang, J.P.; Yan, C. Prediction of the height of water conducting fractured zone in mining overburden based on GA-SVR. J. Min. Saf. Eng. 2018, 35, 359–365. [Google Scholar]
  35. Sun, Y.P.; Wang, Y.F.; Zheng, X.J. Analysis of the height of coal seam roof water conducting Fractured zone based on genetic support vector machine method. J. Coal Ind. 2009, 34, 1610–1615. [Google Scholar]
  36. Lou, G.Z.; Tan, Y. Prediction of the height of water conducting fractured zone based on PSO-BP neural network. Coal. Geol. Explor. 2021, 49, 198–204. [Google Scholar]
Figure 1. Location map of the research area.
Water 15 03204 g001
Figure 2. Schematic diagram of the main mining coal seam and aquifer (1:2000).
Water 15 03204 g002
Figure 3. Workflow of this study.
Water 15 03204 g003
Figure 4. Thematic map of sandstone thickness.
Water 15 03204 g004
Figure 5. Thematic map of core recovery ratio.
Water 15 03204 g005
Figure 6. Thematic map of brittle rock thickness ratio.
Water 15 03204 g006
Figure 7. Thematic map of flushing fluid consumption.
Water 15 03204 g007
Figure 8. Water abundance zoning map of the study area.
Water 15 03204 g008
Table 1. Prediction results and zone comparison.
NoSandstone Thickness
(m)
Core Recovery Ratio Brittle Rock Thickness
Ratio
Flushing Fluid Consumption (m3/h)Unit Water Inflow q (L/m·s)Predictive Value
(L/m·s)
Predictive
Classification
(True or False)
10-HB399.36 0.91 0.408 0.020 0.0522 0.0622weak (T)
10-HB4121.49 0.83 0.537 0.030 0.1829 0.1729medium (T)
10-HB766.29 0.92 0.392 0.070 0.1220 0.1220medium (T)
10-HB930.51 0.95 0.333 0.020 0.0150 0.0251weak (T)
11-HB498.11 0.83 0.418 0.040 0.0593 0.0692weak (T)
11-HB7140.31 0.90 0.708 0.250 0.2150 0.2150medium (T)
11-HB899.67 0.92 0.675 0.080 0.0240 0.0339weak (T)
5-HB2116.99 0.93 0.600 0.220 0.0799 0.0903weak (T)
8-HB1117.90 0.92 0.542 0.080 0.1108 0.1153medium (T)
8-HB3125.61 0.90 0.564 0.046 0.2482 0.2383medium (T)
8-HB4137.24 0.94 0.684 0.043 0.0788 0.0887weak (T)
8-HB973.05 0.95 0.421 0.048 0.0072 0.0172weak (T)
9-HB1085.29 0.94 0.591 0.023 0.4371 0.4192medium (T)
9-HB4139.62 0.91 0.632 0.110 0.0481 0.0580weak (T)
9-HB967.00 0.93 0.398 0.630 0.0030 0.0131weak (T)
HB1-1299.08 0.88 0.726 0.040 0.0802 0.0907weak (T)
HB2-1121.57 0.89 0.504 0.030 0.0202 0.0302weak (T)
HB2-1442.35 0.98 0.541 0.230 0.0027 0.0123weak (T)
HB3-1161.89 0.99 0.479 0.060 0.1549 0.1450medium (T)
HB3-6150.16 0.85 0.690 0.040 0.0855 0.0960weak (T)
HB4-3115.17 0.94 0.481 0.150 0.2165 0.2066medium (T)
6-HB667.53 0.95 0.379 0.015 0.2308 0.2206medium (T)
10-HB695.88 0.90 0.469 0.030 0.1617 0.1617medium (T)
7-HB1118.62 0.92 0.560 0.330 0.2126 0.2025medium (T)
8-HB1189.81 0.94 0.647 0.045 0.0415 0.0415weak (T)
8-HB6109.51 0.93 0.562 3.600 0.4733 0.4733medium (T)
HB4-6101.78 0.92 0.569 0.100 0.3623 0.3623medium (T)
BK3-118.480.830.7100.0200.00850.0184weak (T)
BK4-221.810.860.6490.0100.00110.0109weak (T)
BK527.290.860.9850.0200.01340.0235weak (T)
BK76.150.730.6720.0100.13760.1272medium (T)
BK816.340.940.5920.0450.00790.0178weak (T)
BK916.160.930.4140.0400.03910.0391weak (T)
SK142.920.700.1760.0200.01140.0213weak (T)
SK2127.400.790.5980.0300.00430.0143weak (T)
SK2220.300.810.5330.0350.03270.0327weak (T)
SK239.080.500.6210.0560.14590.1369medium (T)
Table 2. Classification standards for water abundance of aquifers.
Water AbundanceClassification Standards
Weak Water AbundanceMedium Water AbundanceStrong Water AbundanceExtremely Strong Water Abundance
unit water inflow q (L/(s∙m))q ≤ 0.10.1 < q ≤ 1.01.0 < q ≤ 5q > 5
Disclaimer/Publisher’s Note: The statements, opinions and data contained in all publications are solely those of the individual author(s) and contributor(s) and not of MDPI and/or the editor(s). MDPI and/or the editor(s) disclaim responsibility for any injury to people or property resulting from any ideas, methods, instructions or products referred to in the content.

