Article

Pharmaceuticals Removal by Ozone and Electro-Oxidation in Combination with Biological Treatment

by
Francesca Audino
1,*,
Judith Arboleda
1,
Mira Petrovic
2,
Ricard García Cudinach
3 and
Sonia Sanchis Pérez
1
1
Leitat Technological Center, 08225 Terrassa, Spain
2
Catalan Institute for Water Research (ICRA), 17003 Girona, Spain
3
Deisa Industrial Water Solutions SL, 08820 Barcelona, Spain
*
Author to whom correspondence should be addressed.
Water 2023, 15(18), 3180; https://doi.org/10.3390/w15183180
Submission received: 18 July 2023 / Revised: 30 August 2023 / Accepted: 31 August 2023 / Published: 6 September 2023
(This article belongs to the Special Issue Water, Wastewater and Waste Management for Sustainable Development)

Abstract

:
This study investigated the efficiency of two advanced oxidation processes (AOPs), ozonation (O3), and electrochemical oxidation (EO), applied individually or in combination, in the removal of contaminants of emerging concern (CECs) contained in hospital wastewaters, focusing on pharmaceuticals. The optimisation of the single technologies was performed using synthetic wastewater composed of four refractory pharmaceuticals, (carbamazepine-CBZ, lorazepam-LZP, ketoprofen-KTP, 10,11-epoxicarbamazepine-E-CBZ), first alone and then in mixture, in an initial concentration of 1 mg L−1 each. Once the best operational conditions for EO and O3 were defined, their combination (both simultaneous and sequential) was evaluated for the mixture of the selected pharmaceuticals. The treatment solution that showed the best performance was the simultaneous combination of O3 and EO. This treatment was validated using real hospital wastewater previously treated through a moving bed biofilm reactor (MBBR), evaluating its viability by testing the toxicity of the final effluent via Vibrio fischeri inhibition tests. The obtained results showed that the simultaneous combination of O3 and EO as the polishing step after a biological treatment is a very promising solution for hospital wastewater treatment, allowing for obtaining a non-toxic effluent and full degradation of refractory compounds. The disinfection potential of the proposed AOP was also assessed by determining Escherichia coli inactivation potential.

1. Introduction

Hospital wastewaters are complex effluents containing a diverse mix of pharmaceuticals, along with heavy metals, ray contrast media, and detergents, as well as a mix of pathogenic microorganisms, such as bacteria, viruses, and fungi, among others [1,2]. Despite of this, they are generally treated together with urban wastewaters (which may also contain pharmaceuticals from domestic uses and industrial production [3]) in municipal wastewater treatment plants (MWWTPs) without any previous treatment [4]. However, conventional treatments implemented in most MWWTPs are usually ineffective for the removal of pharmaceuticals that are detected at low concentrations (between µg L−1 and ng L−1) in water bodies (both ground and surface waters), thanks to the most powerful analytical techniques nowadays available [5].
Hence, it has been concluded that MWWTPs play a major role in the spreading of pharmaceuticals into the environment. Pharmaceuticals are considered contaminants of emerging concern (CECs), a general term that covers a wide class of different types of chemical compounds, which include pharmaceuticals and personal care products (PPCPs), disinfection by-products (DBPs), endocrine disruptors, industrial chemicals, persistent organic pollutants, and pesticides. No maximum dischargeable levels have been set for CECs in European legislation, but these substances could soon be subjected to further restrictions depending on the results of ongoing research on their effects on the aquatic environment and public health [6]. Indeed, the Commission Implementing Decision [EU] 2015/495 of 20 March 2015 [7] included a series of pharmaceutical products (diclofenac, 17a-ethinylestradiol, 17b-estradiol, estrone, erythromycin, clarithromycin, and azithromycin) in the watch list, covering those substances that must be monitored to confirm their risk for public health, and other CECs are most likely to be included in the near future [8].
In this context, it has been demonstrated that pharmaceutical products can impact environmental and human health through different pathways: they can (i) affect aquatic organisms (also causing genetic mutations) [9]; (ii) penetrate the food chain (mainly due to the use of sludges in agriculture, contaminated by excreted antibiotics [10]) with effects on public health [11]; and (iii) increase the number of antibiotic-resistant bacteria (ARB) and antibiotic resistant genes (ARGs), complicating the cure of infectious diseases in both humans and animals [12,13]. Antimicrobial resistance (AMR) was declared one of the top ten global public health issues by the World Health Organisation in 2019 and, in 2022, one of the top problems by the European Commission. Hospital wastewaters play a major role in the proliferation of AMR, the presence of CECs in water bodies, along with the misuse of antibiotics in humans and animals, and the inefficiency of current wastewater treatments [13,14]. This entails a critical problem regarding the current climatic change and drought scenarios that are affecting our planet globally, jeopardising the availability of quality water.
For all the reasons detailed above, the on-site treatment of hospital wastewaters based on advanced treatments for the effective elimination of pharmaceutical products is highly recommended. The most popular technologies to tackle hospital wastewaters are based on the activated sludge process (ASP), moving bed biofilm reactor (MBBR), constructed wetlands, and membrane bioreactors [1]. Alternatively, AOPs are of high interest because they allow the oxidation of CECs, instead of transferring them to a concentrate stream that needs to be properly treated and disposed. AOPs are based on the in situ generation of highly reactive (E = 2.8 V) and non-selective oxidising species, such as hydroxyl radicals (OH). AOPs include several treatments, such as electro-oxidation (EO), photocatalysis, ultrasonic radiation, and Fenton and photo-Fenton processes. However, ozone treatment (O3) can also be considered an AOP because high pH values activate an indirect oxidation pathway based on the generation of OH, while the direct mechanism involves O3, which is also a powerful oxidant (E = 2.07 V). O3 treatment presents several advantages: (i) it does not introduce any chemicals into the water (O3 lifespan ranges from a few seconds to 30 min); (ii) it is effective over a wide pH range; and (iii) it is easily generated in situ from O2/air only using energy, with O3 generators commercially available. Moreover, O3 treatment has shown high efficiency in both the removal of pharmaceuticals [15] and in the inactivation of ARB in hospital wastewater [14]. In parallel, EO is an environmentally friendly technology that does not require chemicals (only electric current) and has shown a great ability in removing trace and persistent PPCPs [16] and inactivating ARB [17]. The electrochemical oxidation of pollutants can be obtained via two oxidation mechanisms [18]: (i) the direct oxidation of the pollutant at the anodes’ surface or by physiosorbed or chemisorbed OH produced by dimensionally stable (e.g., boron doped diamond-BDD) and active (e.g., IrO2) anodes; and (ii) indirect oxidation achieved through the generation of a mediator (e.g., O3, H2O2, active chlorine, active bromine, etc.) in the bulk solution due to the electrolysis of chlorine.
Many advantages of AOP have been reported, including the significant reduction of inorganic and organic compounds, the complete mineralisation of organic contaminants to carbon dioxide, the generation of non-toxic by-products (if correctly applied), and the high reactivity and non-selectively of OH against pollutants [19], as well as their highly sustainable and nontoxic nature [20]. The main drawback of AOPs is the high operational cost due to the use of chemical reagents and/or high energy requirements, which hinder their long-term and full-scale application [21]. However, coupling biological and AOPs allows for the increase of the effectiveness of CECs removal, while optimising the AOP operational costs by decreasing the treatment time or softening the operational conditions as much as possible thanks to the biological step, which removes (in a cheap way) the biodegradable organic matter.
The aim of the present study was to develop a train of technologies for the treatment of hospital wastewaters, based on O3 and EO treatments aimed at removing pharmaceuticals recalcitrant to biological processes. In the present study, the biological treatment was performed by MBBR, a mixed system with both active biomass in suspension and biomass attached to carriers. The high surface development of the carriers provides a large surface for the growth of bacteria in the form of a biofilm. Each transporter individually increases the degradation performance of organic matter by providing a protected surface that allows the growth of bacteria. Therefore, MBBR systems can be operated at higher organic loads than conventional activated sludge systems, having shorter hydraulic retention times and showing less sensitivity to possible hydraulic overloads. For the present study, both AOPs (alone and in simultaneous/sequential combination) were optimised for the removal of a selected group of pharmaceuticals (four of the most refractory pharmaceuticals were defined as model contaminants: carbamazepine-CBZ, lorazepam-LZP, ketoprofen-KTP, 10,11-epoxicarbamazepine-E-CBZ), evaluating the possible synergic effects derived from the combined treatment. Once both optimal AOP and operational conditions were defined, the solution was finally tested for the treatment of a real hospital wastewater preliminary treated by MBBR, evaluating the removal of 28 of the most used analgesic, anti-inflammatory, and psychiatric drugs. Moreover, since, in some cases, the oxidation by-products generated in the AOP treatment can be more toxic than the molecule of the parent pharmaceutical [19,22,23], the toxicity evaluation of the treated effluent was performed through the Vibrio fischeri test. To the best of the authors’ knowledge, this is the first study addressing the synergic effect of EO and O3 for the treatment of MBBR effluent treating real hospital wastewaters with pharmaceuticals in real concentrations (no spiking).

2. Materials and Methods

2.1. Chemicals

Analytical standards (purity ≥ 97%) of CBZ, LZP, KTP, and E-CBZ were purchased from Merck (Madrid, Spain). Acetonitrile (AcN) and methanol (MeOH) HPLC grade, acetic acid and Na2EDTA (disodium ethylenediaminetetraacetate dihydrate salt), and HNO3 were supplied by Merck (Madrid, Spain). Ultrapure water was produced by a Synergy Water Purification System from Merck providing milli-Q water with a specific resistance of 18.2 MΩ cm−1. Chemical Oxygen Demand (COD) kits were supplied by HACH Lange (Bizkaia, Spain) and Total Organic Carbon (TOC) and Total Inorganic Carbon (TIC) standards were provided by ALCO (Terrassa (Barcelona), Spain).
Lyophilised V. fischeri for Microtox® analysis were purchased from Instrumentación Analítica S.A. (Barcelona, Spain), and NaCl, MgCl2, and KCl, used for the re-constituent solution, were purchased from Sigma Aldrich (Madrid, Spain). H2SO4 and NaOH, used for pH adjustment, were supplied by Scharlab (Barcelona, Spain).

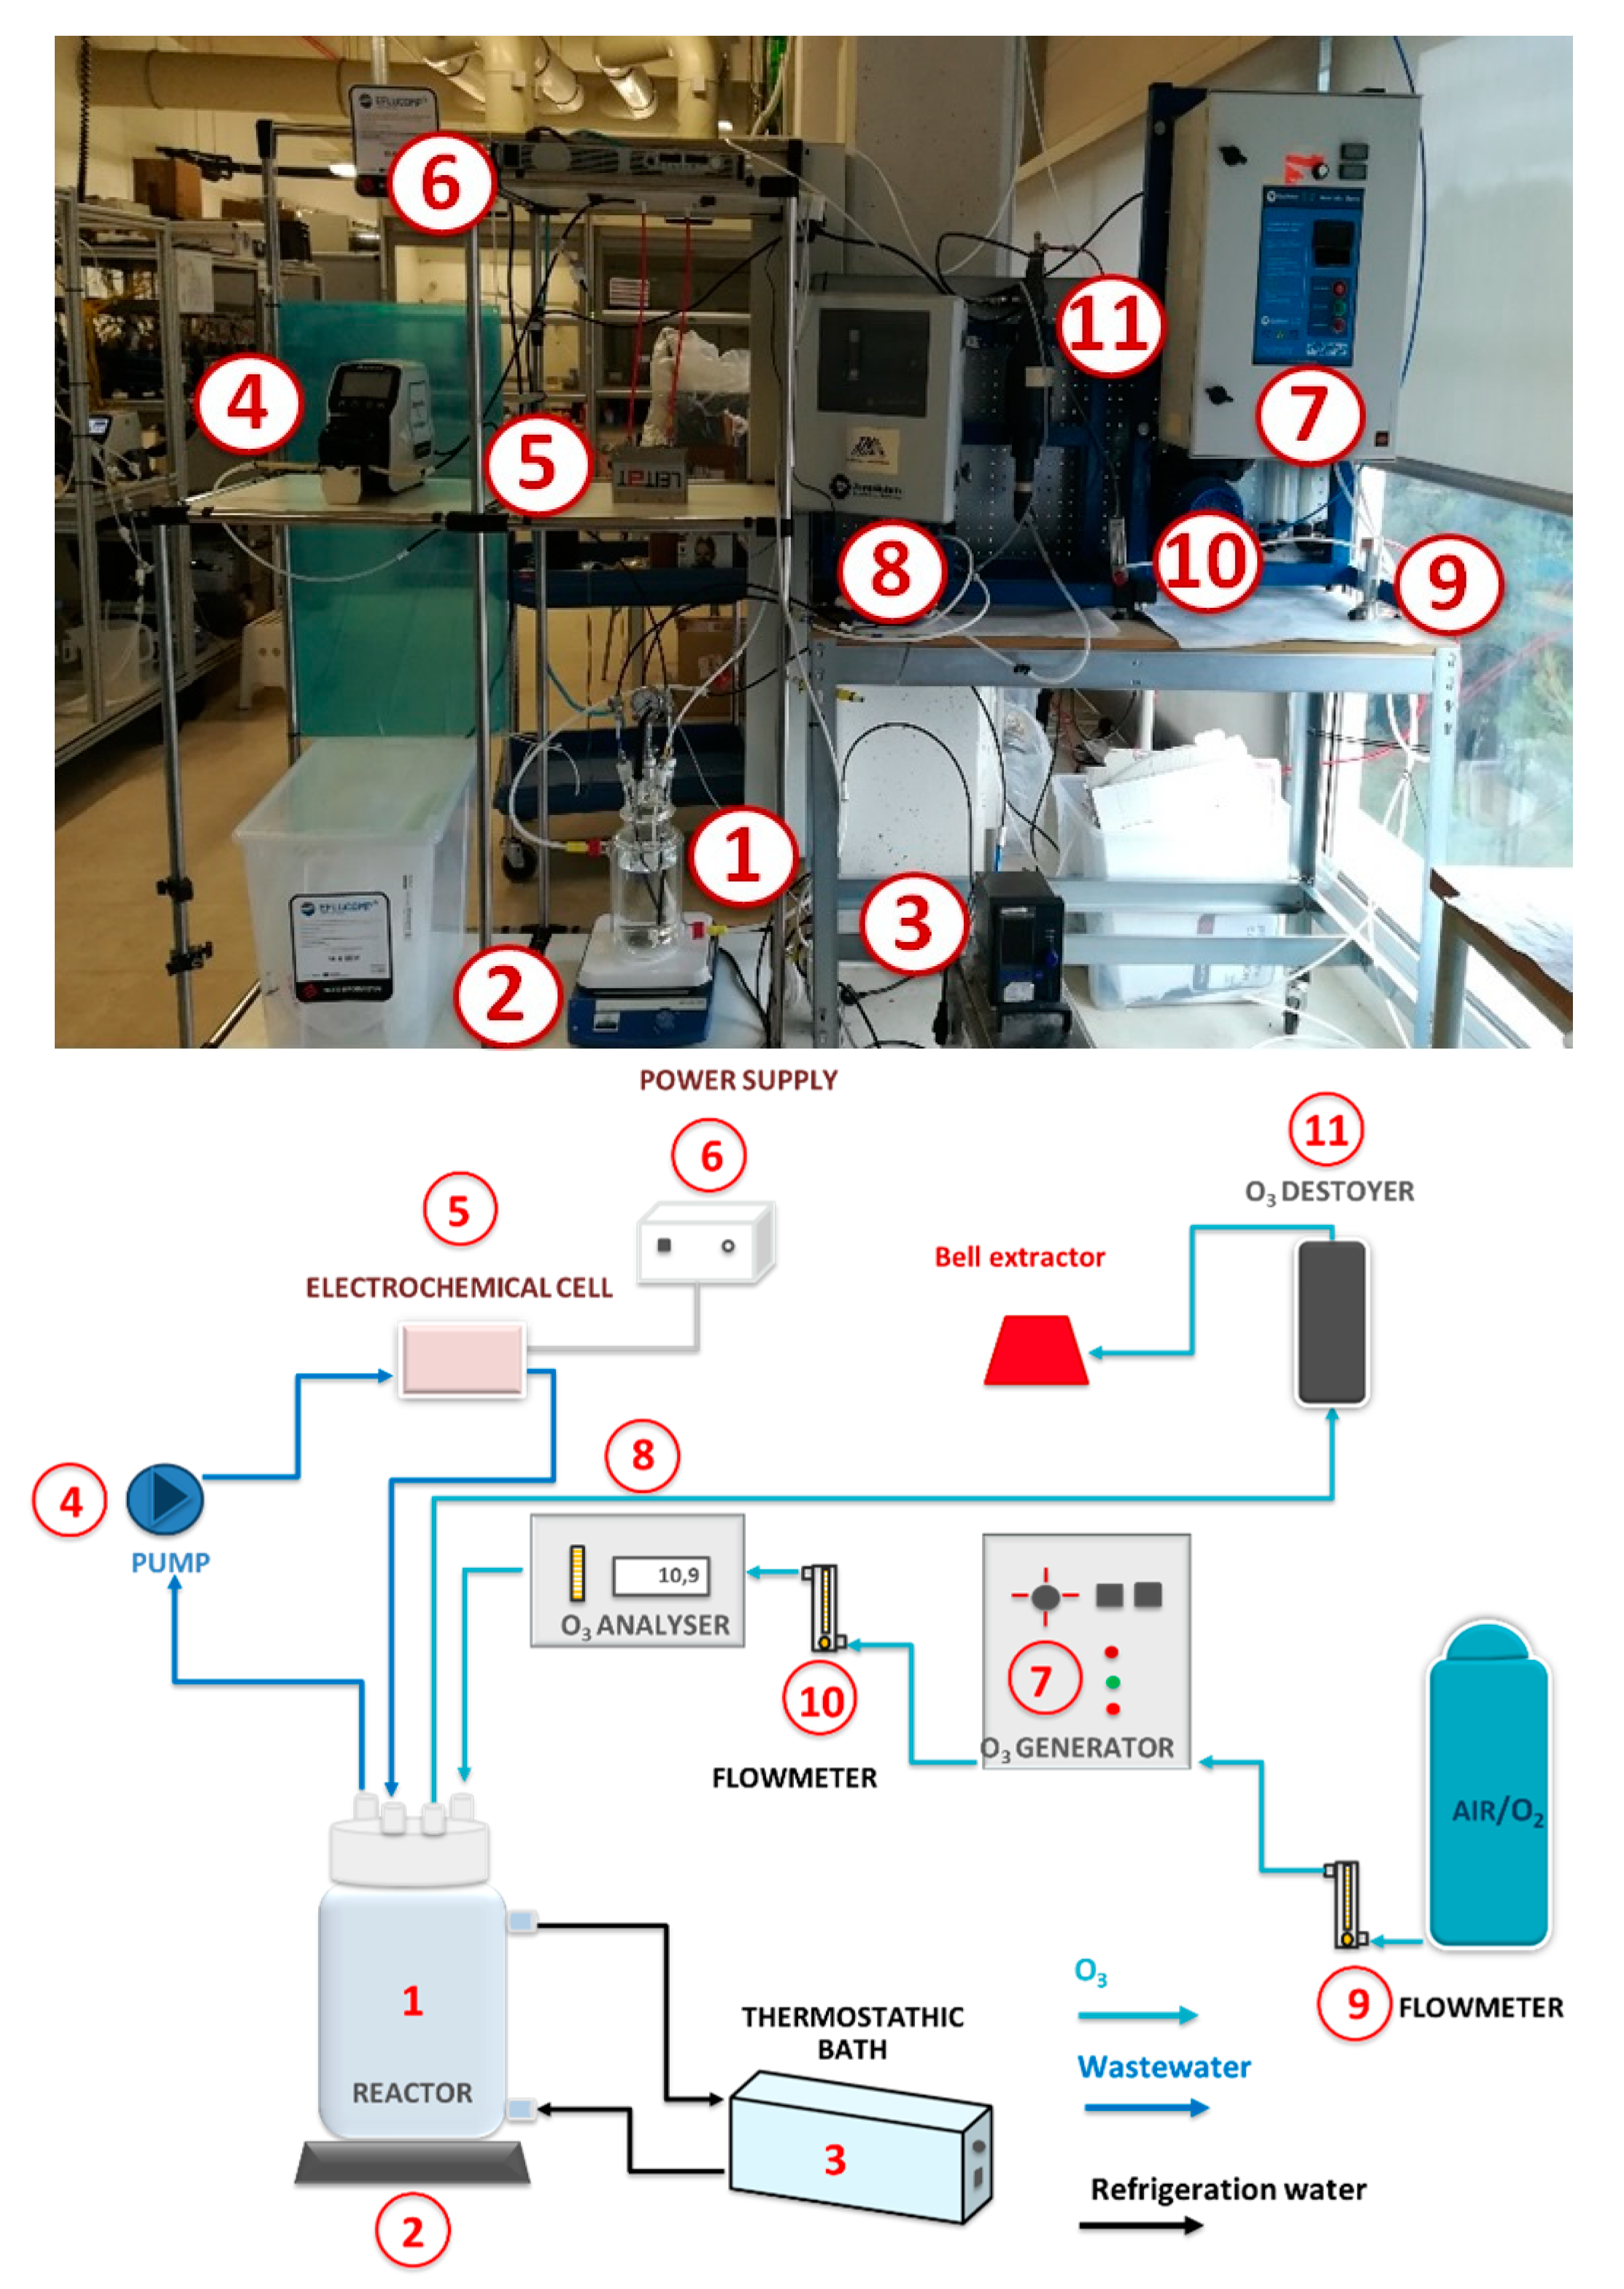
2.2. Experimental Set-Up

Figure 1 shows the set-up used to carry out the EO and O3 experiments. It was composed of a 2 L Pyrex® glass jacketed reactor (1) used as mixing/feeding reactor and was connected to an electrochemical cell and an O3 generator. This reactor was equipped with a pressure gauge (0–1 bar) to control the pressure due to the O3 injection and placed on an IKA C-MAG MS10 plate (2) to ensure a good homogenisation of the solution. The recirculation flowrate between the mixing/feeding reactor and the electrochemical cell was ensured by a Schenchen LabV6 peristaltic pump (4), fixing a flow rate of 1 L min−1. A Huber thermostatic bath (3) connected to the mixing/feeding reactor was used to keep the temperature constant (to 25 °C) during the experiments.
Regarding EO, a detachable electrochemical cell with interchangeable electrodes and variable electrode distance (between 3 and 10 mm) was used (5), testing BDD, stainless steel, and platinum supported on titanium (Pt/Ti) electrodes, with an area of 37.2 cm2 each. The electricity was supplied by a 1200 W power supply, with a maximum of 33 A and 75 V (6).
Concerning O3 treatment, a ZonoSistem Hidro GH 15 O3 generator (7), equipped with high-frequency corona discharge technology that ensures the production of up to 5 g O3 h−1, with a power supply of 230 V, 50–60 Hz, was used. The system can be fed with air (21% O2) or pure O2. An air/O2 flow regulator (9) was placed before the O3 generator to determine the inlet flow to it, QG, while an O3 flow regulator (10) placed before the O3 analyser was used to regulate the inlet flow to it, namely QA. In this way, the applied dose of O3 can be calculated as the product of the inlet flow of O3 to the mixing/feeding reactor (QR = QG − QA) and the O3 concentration in the mixing/feeding reactor. To allow real-time monitoring of the O3 concentration in the mixing/feeding reactor, a non-dispersive ultraviolet analyser (8) model Ozomat GM from Anseros (range of use: 230 VAC/50 Hz; 0–20 mA; 0–200 g O3 Nm−3; T = 5–45 °C; 20 L h−1 < gas flow < 40 L h−1) was adopted. An O3 destroyer by Engineer Ozone Engineering S.L., model DC-PVC-01, was used to remove the residual O3 from the outlet gas (11).
Concerning biological treatment, the MBBR (see Figure 2) consisted of a feeding tank (n. 1 in Figure 2) followed by an activated sludge biological reactor filled with plastic carriers (n. 2 in Figure 2), subsequently followed by a decanter for the final separation stage (n. 3 in Figure 2). The three tanks were built in methacrylate for a visual control of the biological system.

2.3. Studied Wastewaters

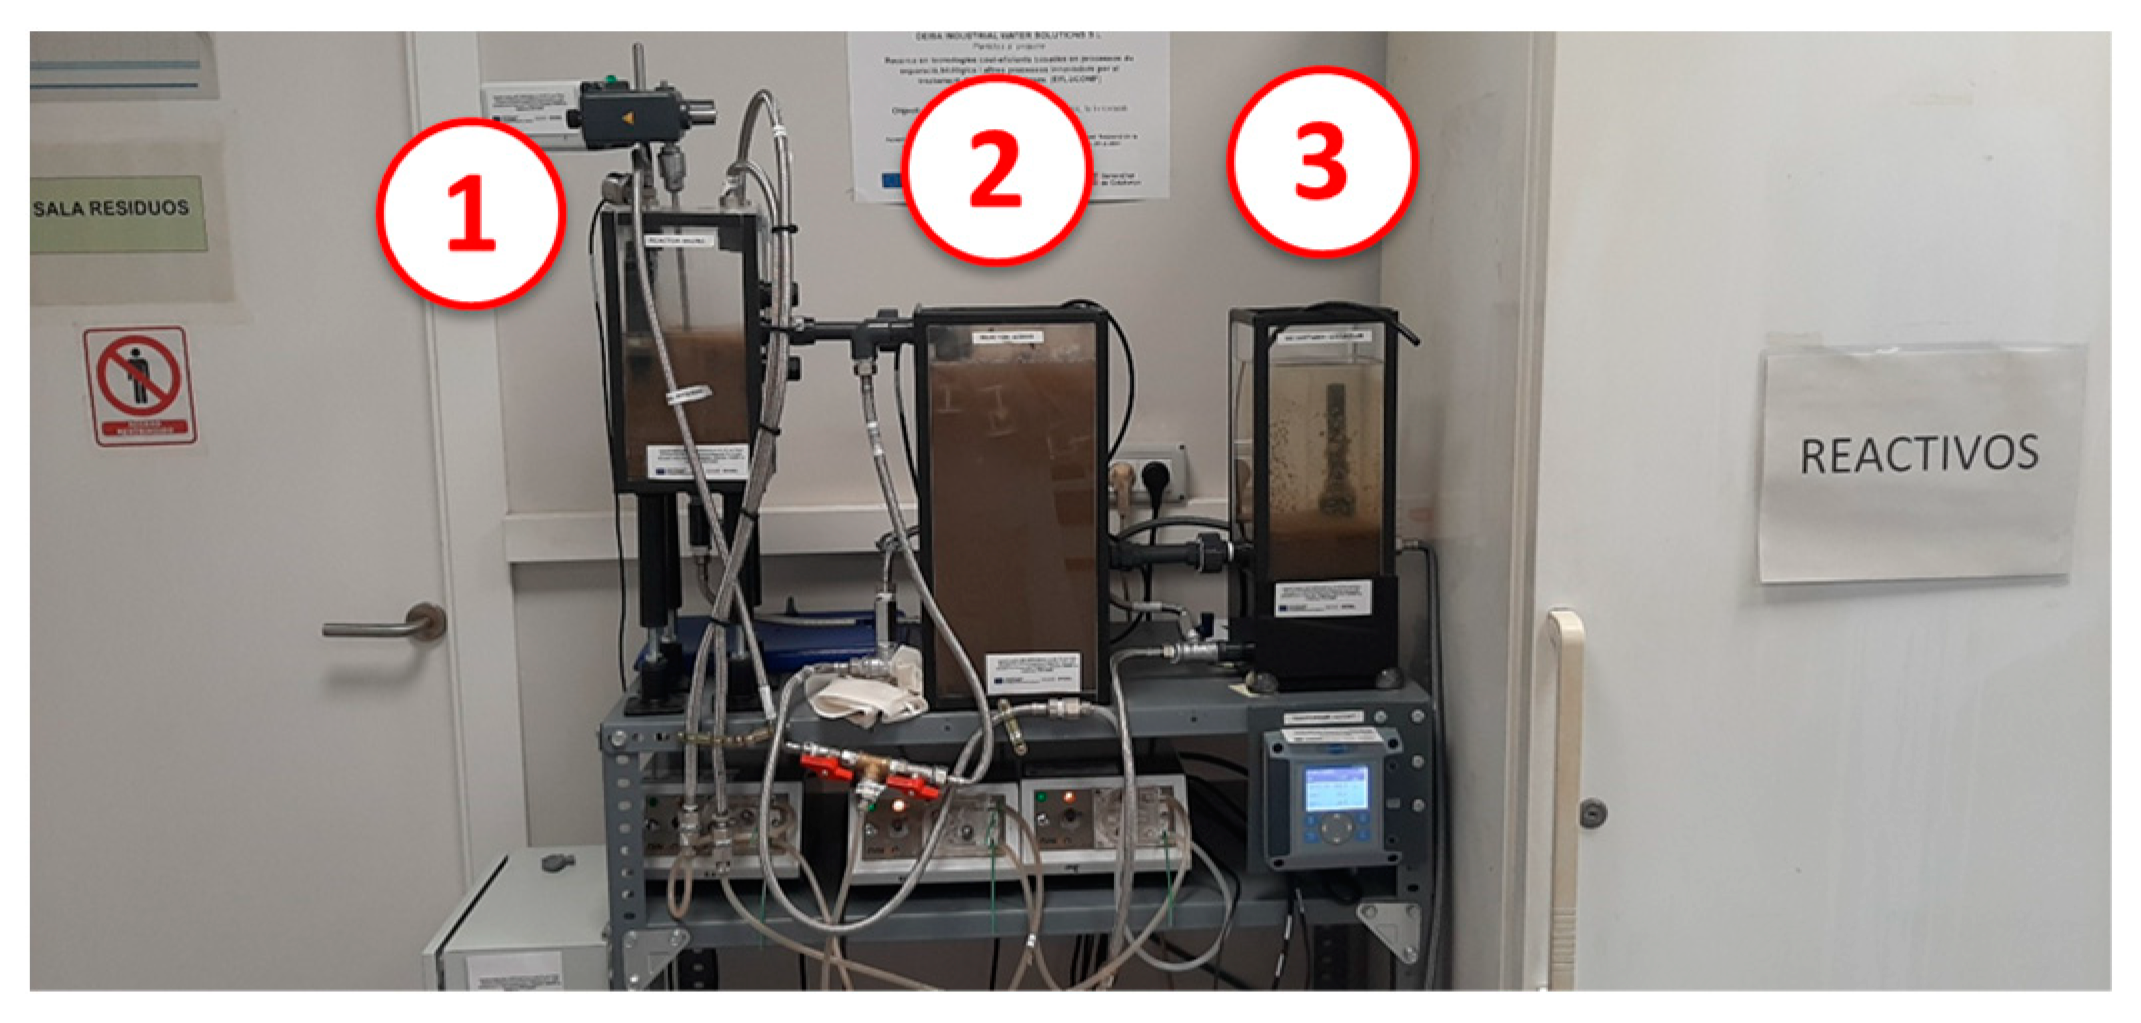
2.3.1. Real Hospital Wastewater

Wastewaters came from a hospital located in Catalonia (Spain), equipped with a wastewater treatment plant based on conventional ASP (from now on HWWTP), consisting of a coarse grate and a grease removal system followed by a biological tank with ASP and a sedimentation tank.
The characterisation of real hospital wastewaters was performed by taking 3 composite samples of 2 L each (2 replicates of 1 L) at the inlet and 3 composite samples of 2 L each (2 replicates of 1 L) at the outlet of the HWWTP, during 3 consecutive days. A composite sample of 1 L was immediately refrigerated, maintained at 4 °C, and analysed within the following 24 h for the measurements of: TOC, COD, biological or biochemical oxygen demand (BOD5), pH, conductivity (EC), temperature (T), turbidity, total suspended solids (TSS), total nitrogen (TN), chlorides, sulphates, phosphates, total phosphorus, N-Nitrate (N-NO3), N-Nitrite (N-NO2), and fluorides. Elemental analysis was also performed (B, Al, P, Cr, Mn, Fe, Ni, Cu, Zn, As, Se, Cd, Sn, Ba, Hg, Pb). The remaining 1 L of the composite sample was used to analyse 28 drugs selected among the most refractory compounds in literature and the most present in Catalonia [12,24,25]. Particularly, 14 analgesics and anti-inflammatory drugs (KTP, naproxen, ibuprofen, indomethacin, acetaminophen, salicylic acid, diclofenac, phenazone, propylphenazone, piroxicam, tenoxicam, meloxicam, oxycodone, and codeine) and 14 psychiatric drugs (CBZ, E-CBZ, 2-hydroxycarbamazepine, acridone, sertraline, citalopram, venlafaxine, trazodone, fluoxetine, norfluoxetine, paroxetine, diazepam, LZP, and alprazolam) were analysed.
The physicochemical and microbiological characterisations of the water samples taken at the head and effluent of the HWWTP are shown in Table 1, and the results of the elemental analysis are shown in Table 2. (the values that exceeded the discharge limit are highlighted in bold). The presented results include the standard deviation (±) for 2 replicates. See the description of the analytical methods in Section 2.5.
The inlet and outlet average values of the concentrations of the 28 drugs selected for this study are presented in the following Figure 3 in logarithmic scale to improve the visualization of the very low concentrations. The analytical method is described in Section 2.5.
Acetaminophen, a pain reliever, was the compound detected at higher concentrations (out of range of the graph) in the inlet flows, with the highest average concentration (of >153 µg/L). Other pain relievers, such as ibuprofen, salicylic acid, KTP, diazepam, acridone, and naproxen, were also detected in variable concentrations, between 0.1 and 6 µg L−1. Among the psychiatric drugs, CBZ and its metabolites (E-CBZ, 2-hydroxycarbamazepine) were detected in average concentrations between 0.09 and 8 µg L−1 in the inlet waters. All the other drugs (among the 28 originally selected for the screening) were detected in concentrations < 1 µg L−1. Most of the analgesic and anti-inflammatory compounds, including acetaminophen, were removed above 90%, except for KTP, which was removed by a factor of 83%, and acridone and diazepam, whose percentage of removal was below 50%. On the other hand, compounds for psychiatric use, such as CBZ and its metabolites, presented low rates of elimination (in most cases below 70%). In some cases, outlet concentration exceeded the one found at the inlet, which can be explained by sample variability but also by the release of compounds absorbed in the activated sludge.

2.3.2. Synthetic Hospital Wastewater

Based on the results of the analysis of the selected 28 drugs in the effluent of the HWWTPs, four of the most refractory drugs were selected to prepare the synthetic wastewater for running the set of experiments for the optimisation of EO and O3. Particularly, CBZ, LZP, KTP, and E-CBZ were selected, since no significant variation in their concentration was recorded between influent and effluent. A working standard solution of each drug (10 mg L−1 each) was prepared in MeOH to ensure good homogenisation and was kept refrigerated at 4 °C. The working standard solution containing all the 4 selected pharmaceuticals was obtained after mixing individual stock solutions.

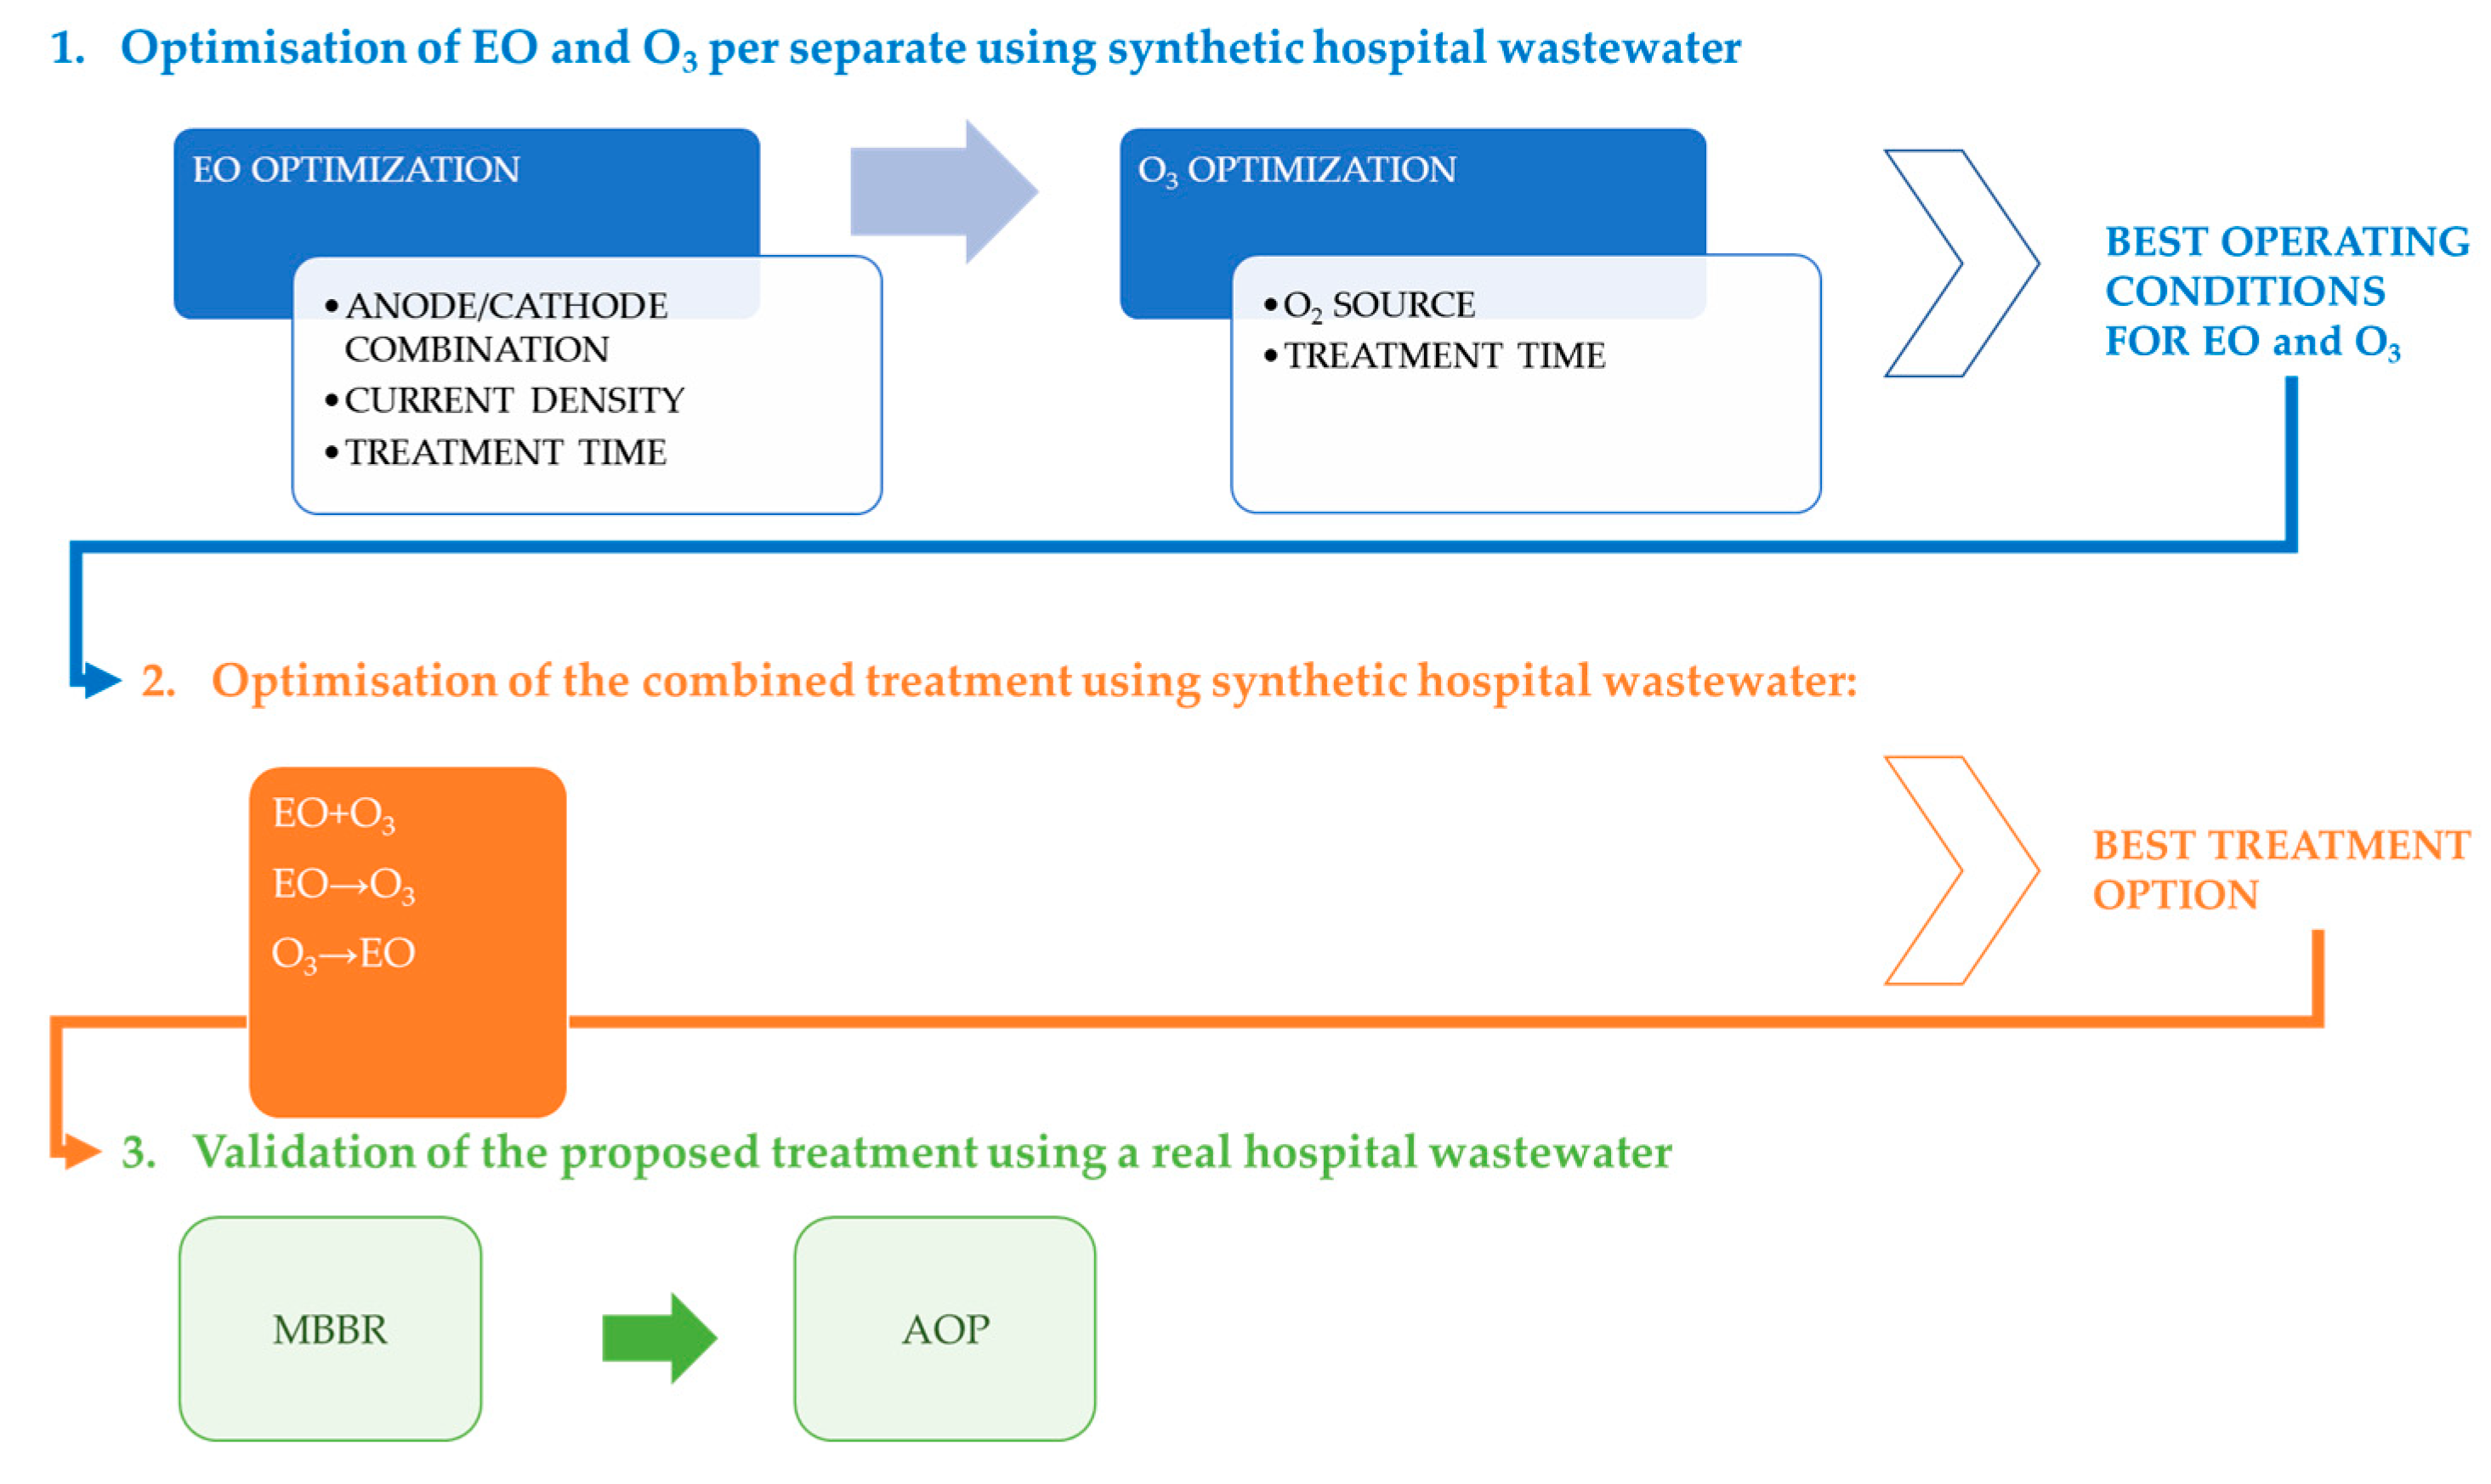
2.4. Experimental Design

The present study was performed following an experimental design based on 3 main steps, summarised in Figure 4.
Each step described in Figure 4 is detailed below.
Optimisation of EO and O3 separately using synthetic hospital wastewater: To take into consideration the possible influence of the interaction among the 4 selected drugs, it was decided to first proceed to the optimisation of EO/O3 by using only one model compound, that is CBZ, and then to further validate the optimal operational conditions determined for CBZ removal with the remaining 3 drugs alone and in mixture. Although, as shown in Figure 3, the selected compounds were found in a concentration around <1–8 µg L−1, they were added in an initial concentration of 1 mg L−1, which was the lowest possible concentration that could be followed by the available analytical equipment, throughout the AOP treatment.
Prior to each experiment, the synthetic wastewater was prepared by adding 100 mL of the stock solutions containing only CBZ, LZP, KTP, and E-CBZ or the mixture of them (CBZ+KTP+LZP+E-CBZ) in 1 L of tap water. The initial TOC was about 1000 mg L−1, mostly due to MeOH than to the spiked pharmaceuticals, which, when mixed, contributed for a total of 2 mg L−1. If needed, pH was adjusted using the basic or acidic solutions described in Section 2.1, before levelling to 1 L with tap water.
In the case of EO tests, tap water was used as the water matrix to prepare the synthetic wastewater, except for the experiments testing different electrolytes, where deionised water was used. Once ready, the synthetic wastewater was added to the mixing/feeding reactor and left recirculating among the latter and the electrochemical cell for 15 min at 1 L min−1 to ensure perfect mixing conditions. After 15 min of recirculation, the initial concentration of the pharmaceuticals was checked. The EO test started by switching on the power supply set at the working voltage. Samples of 1.5 mL were taken at different times (0, 5, 15, 30, 60, 90, and 120 min) to analyse the variation in the concentration of the model pollutant/s ([CBZ], [KTP], [LZP], [E-CBZ], alone or in mixture). In the case of the EO tests performed with the mixture of the 4 drugs, the reduction of TOC was also monitored. T, pH, and EC were measured at the beginning and at the end of each test. All the experiments were performed in semi-batch mode (batch with recirculation, recirculation flowrate: 1 L min−1) and were kept constant T at 25 °C with a maximum treatment time (tR) of 120 min. For all experimental runs, total treated volume (Vt) was fixed to 1 L.
The optimisation of EO was carried out by fixing the anodic material (BDD) and the distance among the electrodes (D = 6 mm) and varying the cathodic material (Pt/Ti and stainless steel to reduce costs) and the voltage (10, 20, and 40 V corresponding to a current density of 4, 13, and 35 mA/cm2, respectively) that were selected as process variables to be investigated. Concerning electrode materials, BDD was selected as anodic material due to its reported efficiency in the oxidation of bio-refractory organic compounds derived from the lower adsorption of OH on its surface with respect to other anodic materials [26,27]. Regarding the cathodic material, Pt/Ti and stainless steel were selected as some of the cheapest options. Moreover, a literature review [18,28,29,30] pointed out that CBZ removal through electrooxidation has not been studied yet with the particular combination of the BDD anode and Pt/Ti cathode. D was fixed to an intermediate value since, despite some studies that have shown that a small electrode distance is generally helpful thanks to the drop in ohmic voltage and to improvements in mass transfer, according to some other studies, by increasing the distance between electrodes, it was possible to increase the efficiency in TOC removal [31].
Once the optimal combination of electrodes and voltage was determined for CBZ degradation, its effectiveness was assessed for the elimination of all 4 selected model compounds alone and mixed in a concentration of 1 mg L−1 each.
It must be stressed that, contrary to most of the previous published works, the present study tested the EO performance without adding chemicals (e.g., electrolytes) to reduce costs. However, the effect of increasing EC by adding different electrolytes (MgSO4, Na2SO4 and K2SO4) was also tested for CBZ degradation under optimal operational conditions for EO. Each electrolyte was added to a matrix of deionised water (in which CBZ was spiked in a concentration of 1 mg L−1) in a concentration that ensured reaching an EC similar to that of an average influent to a conventional sewage system (≈700 µS cm−1). Deionised water was used instead of tap water to discard the influence of other possible electrolytes contained in tap water.
The experiments performed for EO optimisation are summarised in Table 3.
Concerning the O3 tests, the starting protocol followed was the same as described for EO, except for the initial homogenisation of the synthetic wastewater added to the mixing/feeding reactor that was ensured by using a mixing plate. The O3 test started by switching on the O3 generator. Samples of 1.5 mL were taken at different times (0, 5, 15, 30, 60, 90, and 120 min) to analyse the variation in the concentration of the model pollutant/s ([CBZ], [KTP], [LZP], [E-CBZ], alone or in mixture). In the case of the O3 tests performed with the mixture of the 4 drugs, the reduction of TOC was also monitored. T, pH, and EC were measured at the beginning and at the end of each test. All the experiments were performed in batch mode (without recirculation) and were kept constant T at 25 °C and during a maximum tR of 120 min. For all experimental runs, Vt = 1 L.
For the optimisation of the technology, the effect of the feed source (O2 and air) used for O3 production and of O3 dose (varying QR between a minimum (0.5 L min−1) and a maximum (3 L min−1)) was investigated. The gas pressure of both air and O2 was set between 0.5 and 1 bar, and QA was 2 L min−1. Once the optimal combination of source to produce O3 and O3 dose was determined for CBZ degradation, its effectiveness was assessed for the elimination of all 4 selected model compounds alone and mixed in a concentration of 1 mg L−1 each. Table 4 summarises the set of assays performed to optimise O3 technology.
Optimisation of the combined treatment using synthetic hospital wastewater: The best operational conditions were applied to validate EO and O3 in sequential and simultaneous combination for the degradation of the 4 model CECs per separately and in mixture. The experiments were carried out in semi-batch mode, with a recirculation flowrate between the mixing/feeding reactor and the cell of 1 L min−1. No adjustment of EC or pH was performed, although both parameters were monitored at the beginning and at the end of each test. The efficiency of the combined treatment was evaluated in terms of both degradation of each model compound and TOC decrease, for which samples of 1.5 mL were taken at different times (0, 5, 15, 30, 60, 90, and 120 min). The two sequential application options (EO→O3 and O3→EO) were studied by performing first EO treatment for 60 min and then O3 treatment for the subsequent 60 min, and vice versa. In the case of simultaneous application, a 120 min EO + O3 test was conducted.
Validation of the proposed AOP treatment using real hospital wastewater: The AOP solution that showed the best performance was applied in combination with a preliminary biological treatment (MBBR) for treating real hospital wastewater, following the degradation of 28 drugs (selected among the most used). The MBBR was operated with a fixed average mass load of 0.121 Kg COD/Kg settled sludge volume, fixing an average daily feed of 4.8 L d−1 and keeping an average suspended solid concentration in a range between 1800 and 2000 mg L−1 (normally in the range of 1000–5000 mg/L). Once steady-state conditions were reached, the MBBR effluent was treated by the best performing AOP solution (previously determined with synthetic hospital wastewater). The experimental protocol followed was the same described above for the AOP experiments, although the Vt was 2 L instead of 1 L to ensure enough sampling volume to analyse the 28 drugs targeted for real hospital wastewaters without affecting the experiment. Particularly, 230 mL samples were taken at 0, 60, and 120 min, analysing TOC, COD, pH, EC, T, and pharmaceutical concentration. Finally, after 120 min, the last sample was taken to measure all the parameters (TOC, COD, TSS, pH, EC, T, toxicity, drug concentration). At the end of the test, TSS and toxicity were also analysed, along with the residual concentrations of dissolved O3 (DO3) and dissolved O2 (DO2) after 20, 40, 60, and 240 min from the end of the test, to verify the feasibility of a possible recirculation to the biological treatment, since the O3 treatment elevated the DO2 concentration of the effluent, favouring the biological process [32].
Experiments were also performed to evaluate the disinfection capacity of the proposed AOP treatment solution. A total of 1 L of wastewater was added to the mixing/feeding reactor and allowed to recirculate for 15 min at 1 L min−1 to ensure its homogeneity. After that, a first sample was taken to measure the initial concentrations of both E. coli and Total Flora. Afterwards, the optimal AOP treatment was applied, and samples were taken after 15 and 60 min to quantify E. coli and Total Flora. Bacteria regrowth was also assessed after 1 week rest at room temperature.
The results reported for all the experiments were the average values from at least duplicate runs. In all the cases, the standard errors were lower than 10%.

2.5. Analytical Techniques

2.5.1. Pharmaceuticals

The analysis of water samples was carried out following the method described by Gros et al. [33]. Water samples were filtered through 1 μm GFF, followed by 0.45 μm PVDF. An appropriate volume of a 0.1 M Na2EDTA solution was added to the different types of water to achieve a final concentration of 0.1% (g solute/g solution). To detect pharmaceuticals in the effluent, being at lower concentrations than the ones present in the influent, twice the volume of sample was needed. Hence, 25 mL of influent sample and 50 mL of effluent sample were taken and analysed.
Water samples were spiked with an appropriate volume of a standard mixture containing surrogate standards, to have a concentration of 200 ng L−1 in influent and 100 ng L−1 in effluent wastewater. Samples were extracted by solid phase extraction using Oasis HLB cartridges (60 mg, 3 mL). The cartridges were pre-conditioned with methanol (5 mL) and HPLC water (5 mL). After sample loading, the cartridges were rinsed with 6 mL of HPLC grade water at a rate of 2 mL min−1 and dried for 5 min to remove excess water. Finally, the analytes were analysed with 8 mL of pure methanol at a flow rate of 1 mL min−1. Extracts were evaporated to dryness under a gentle stream of purified nitrogen (>99.9%) using the Reacti-Therm III nitrogen evaporator (TS-18824) (Thermo Fisher Scientific, Driesch, Germany) and then reconstituted to 1 mL with a final ratio of methanol/water (10:90, v/v). Finally, 10 μL of a 1 ng L−1 standard mix containing all isotopically labelled standards was added to the extract as the internal standard.
The analysis of the selected model compounds (CBZ, LZP, KTP, E-CBZ) in synthetic wastewater was performed by means of Ultra Performance Liquid Chromatography coupled to a Mass Spectrometer (UPLC/MS) combined with a Photodiode Array Detector (PDA). For this purpose, the UPLC/PDA/MS Aquity UPLC Waters Corporation (Milford, USA) was used as equipment. The analytes were separated with an isocratic method using a C-18 analytical column (Xterra RP18 150 × 3.9 × 5 µm) and as a mobile phase, acetonitrile with 0.1% acetic acid and water with 0.2% acetic acid, in a 50:50 ratio. The column temperature was maintained at 40 ± 5 °C. The injection volume was 10 µL. UV-VIS detection was performed at different wavelengths (190–400 nm). Mass spectrometry was performed using a simple Quadrupole UPLC/MS system from Waters Aquity Corporation (Milford, MA, USA), consisting of a sample manager, a binary solvent manager, a column manager, a PDA detector, and a simple MS Quadrupole detector. MS control and spectral processing were performed using Masslynx software, version 4.1 (Waters). Mass spectrometry was performed using a simple Quadrupole detector equipped with an electrospray ionisation source. Positive ionisation was used in the selected ion monitoring mode. The capillary voltage was set at 3.5 kV. The source and desolation temperatures were optimised and kept at 150 and 350 °C, respectively. The desolation gas was supplied at a flow rate of 700 L h−1 and the gas cone was set at 50 L h−1. The pressure of the collision gas (nitrogen) was maintained at 5 psi. The flow rate used was 0.4 mL min−1. Calibration curves were weekly prepared for each compound, covering a range of concentrations from 0 to 1 mg L−1, were prepared by successive dilutions in milli-Q water, starting from a buffer solution of 1000 mg L−1 of each compound in MeOH (to ensure total dilution), and were kept refrigerated at −20 °C.

2.5.2. Other Parameters

TOC was determined by the SHIMADZU TOC ANALYZER (model TOC-V CSH TNM-1, Columbia, USA). The calibration of the equipment was monthly performed in the ranges 0–10, 0–100, and 0–1000 mg L−1. The quantification of COD was evaluated through spectrophotometry, using analytical kits supplied by HACH (ISO 15705) and a HACH Lange DR 3900 UV-VIS spectrophotometer (Bizkaia, Spain). An amount of 2 mL of sample was added directly to the analysis kit that was introduced into the digester at 148 °C for 2 h. After the digestion time, the sample was stirred and cooled to room temperature for 10 min. Finally, the COD was analysed using the spectrophotometer, adjusting the wavelength between 400 and 500 nm.
BOD5 was assessed using the respirometry method with Oxitop bottles (Respirometric degradability tests according to OECD 301F/DIN EN ISO 9408).
The content of anions was analysed with ion chromatography (ICS 3000 Dionex, Sunnyvale, USA). The sample was filtered with 0.45 µm nylon filters and properly diluted with ultrapure water. The quantification was performed by interpolation in a calibration curve prepared with commercial standards of the corresponding anions. The parameters of the chromatographic method used are indicated in the Table 5:
Cations were analysed with Microwave Digestion followed by Inductively Coupled Mass Spectrometry. A total of 10 mL of sample was digested with 10 mL of concentrated ultrapure nitric acid (HNO3 70%) in an analytical microwave system (CEM Mars) at 190 °C. The obtained digestion residue was properly diluted to analyse the elements of interest by ICPMS (Agilent 7500). The quantification was performed by interpolation in a multi-elemental calibration curve prepared with commercial standards of the elements of interest.
The determination of TSS was carried out by following the standard method 2540d (Standard Methods Online—Standard Methods for the Examination of Water and Wastewater). EC and pH were measured using an Intellical ™ CDC401 and an Intellical PHC101 sensor. DO2 was analysed using an ODEON (Aqulabo, Ponsel MESURE) probe. DO3 measurements were carried out using an ATI (Analytical Technology) model Q46 analyser.

2.5.3. Toxicity

Toxicity analysis was performed by the Microtox® Acute Toxicity Test (ISO 11348-3, 1998), using a Microtox® M-500 analyser from SDI. The toxic effect was calculated from the decay of the luminescence of the bacteria V. fischeri, after 15 min of incubation at 15 °C. Results were expressed in Equitox m−3.

2.5.4. Disinfection Tests

Disinfection capacity was measured by detecting and quantifying the E. coli and Total Flora contained in the influent and effluent of the AOP treatment. E. coli was detected and quantified by Enterobacteriaceae/E. coli laminocultures (Red Bile Violet Dextrose Agar (VRBG)/chromogenic E. coli). Total Flora was detected and quantified by Total Flora/Enterobacteriaceae laminocultures (Plate count agar + TTC/Red Bile Violet Dextrose (VRBG)). The slide culture was kept in contact with the sample for a maximum of 3 s and then incubated for 24 h at 37 °C. Results were reported in CFU mL−1 following a specific legend provided by the manufacturer.

3. Results and Discussion

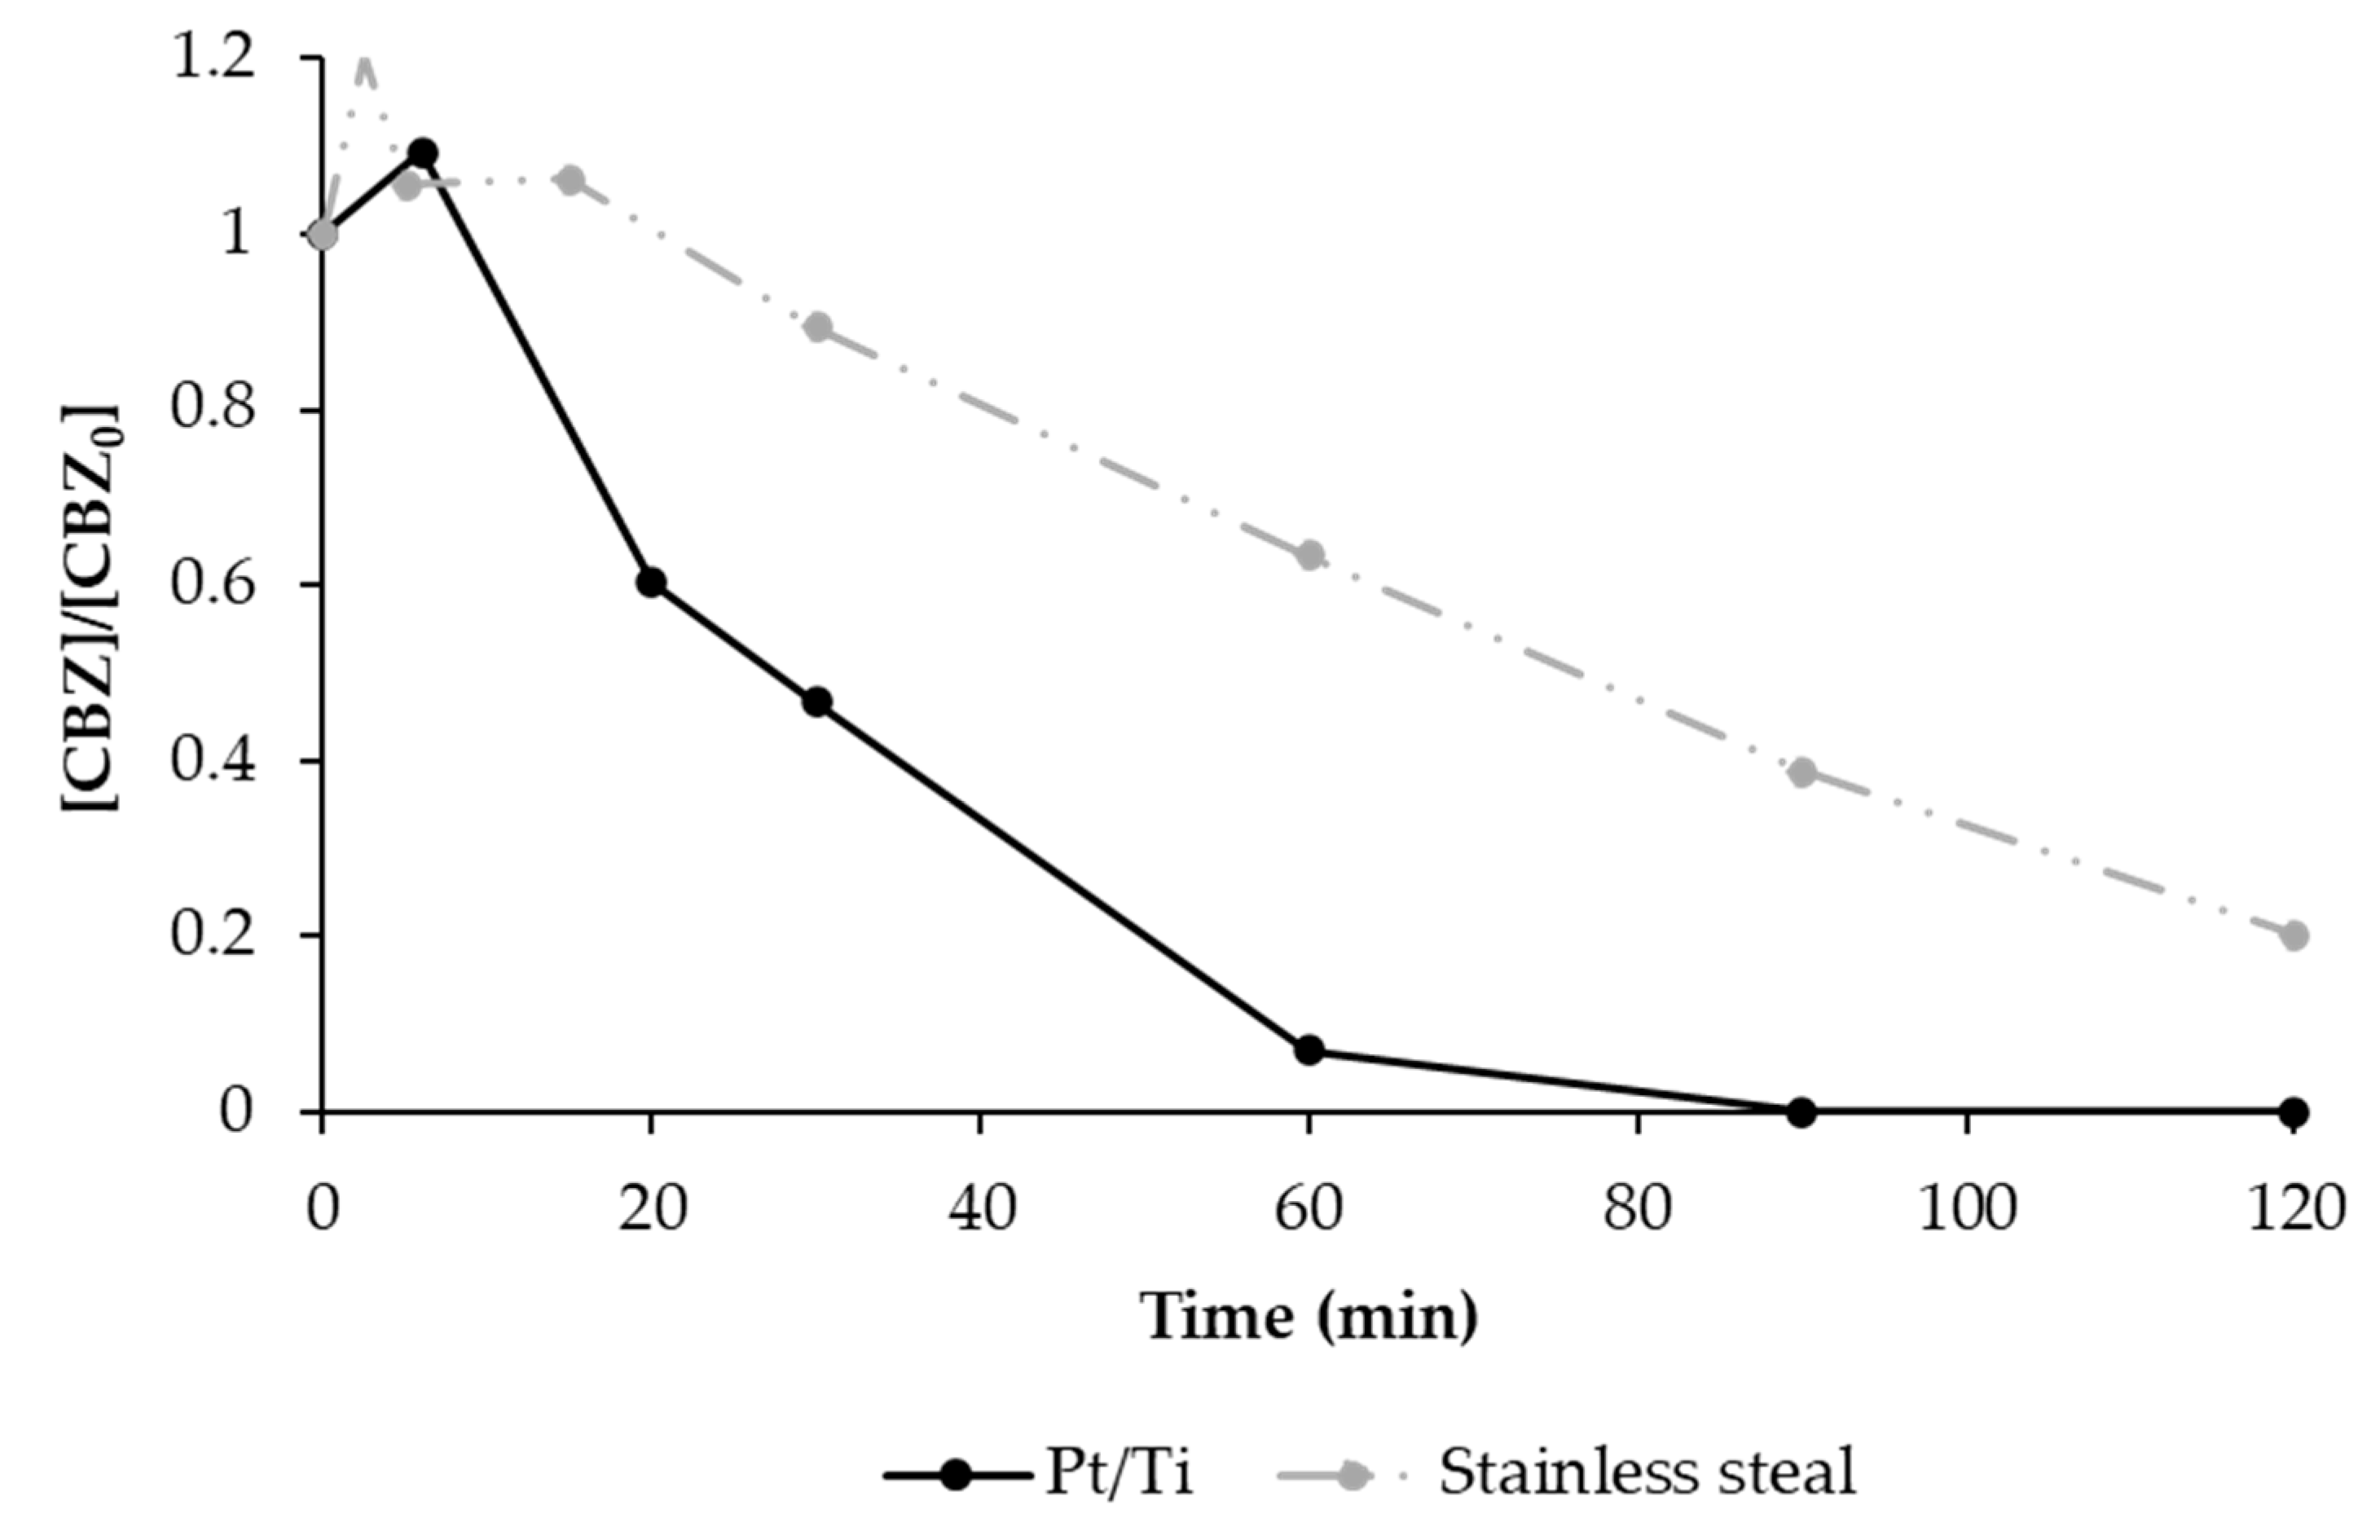
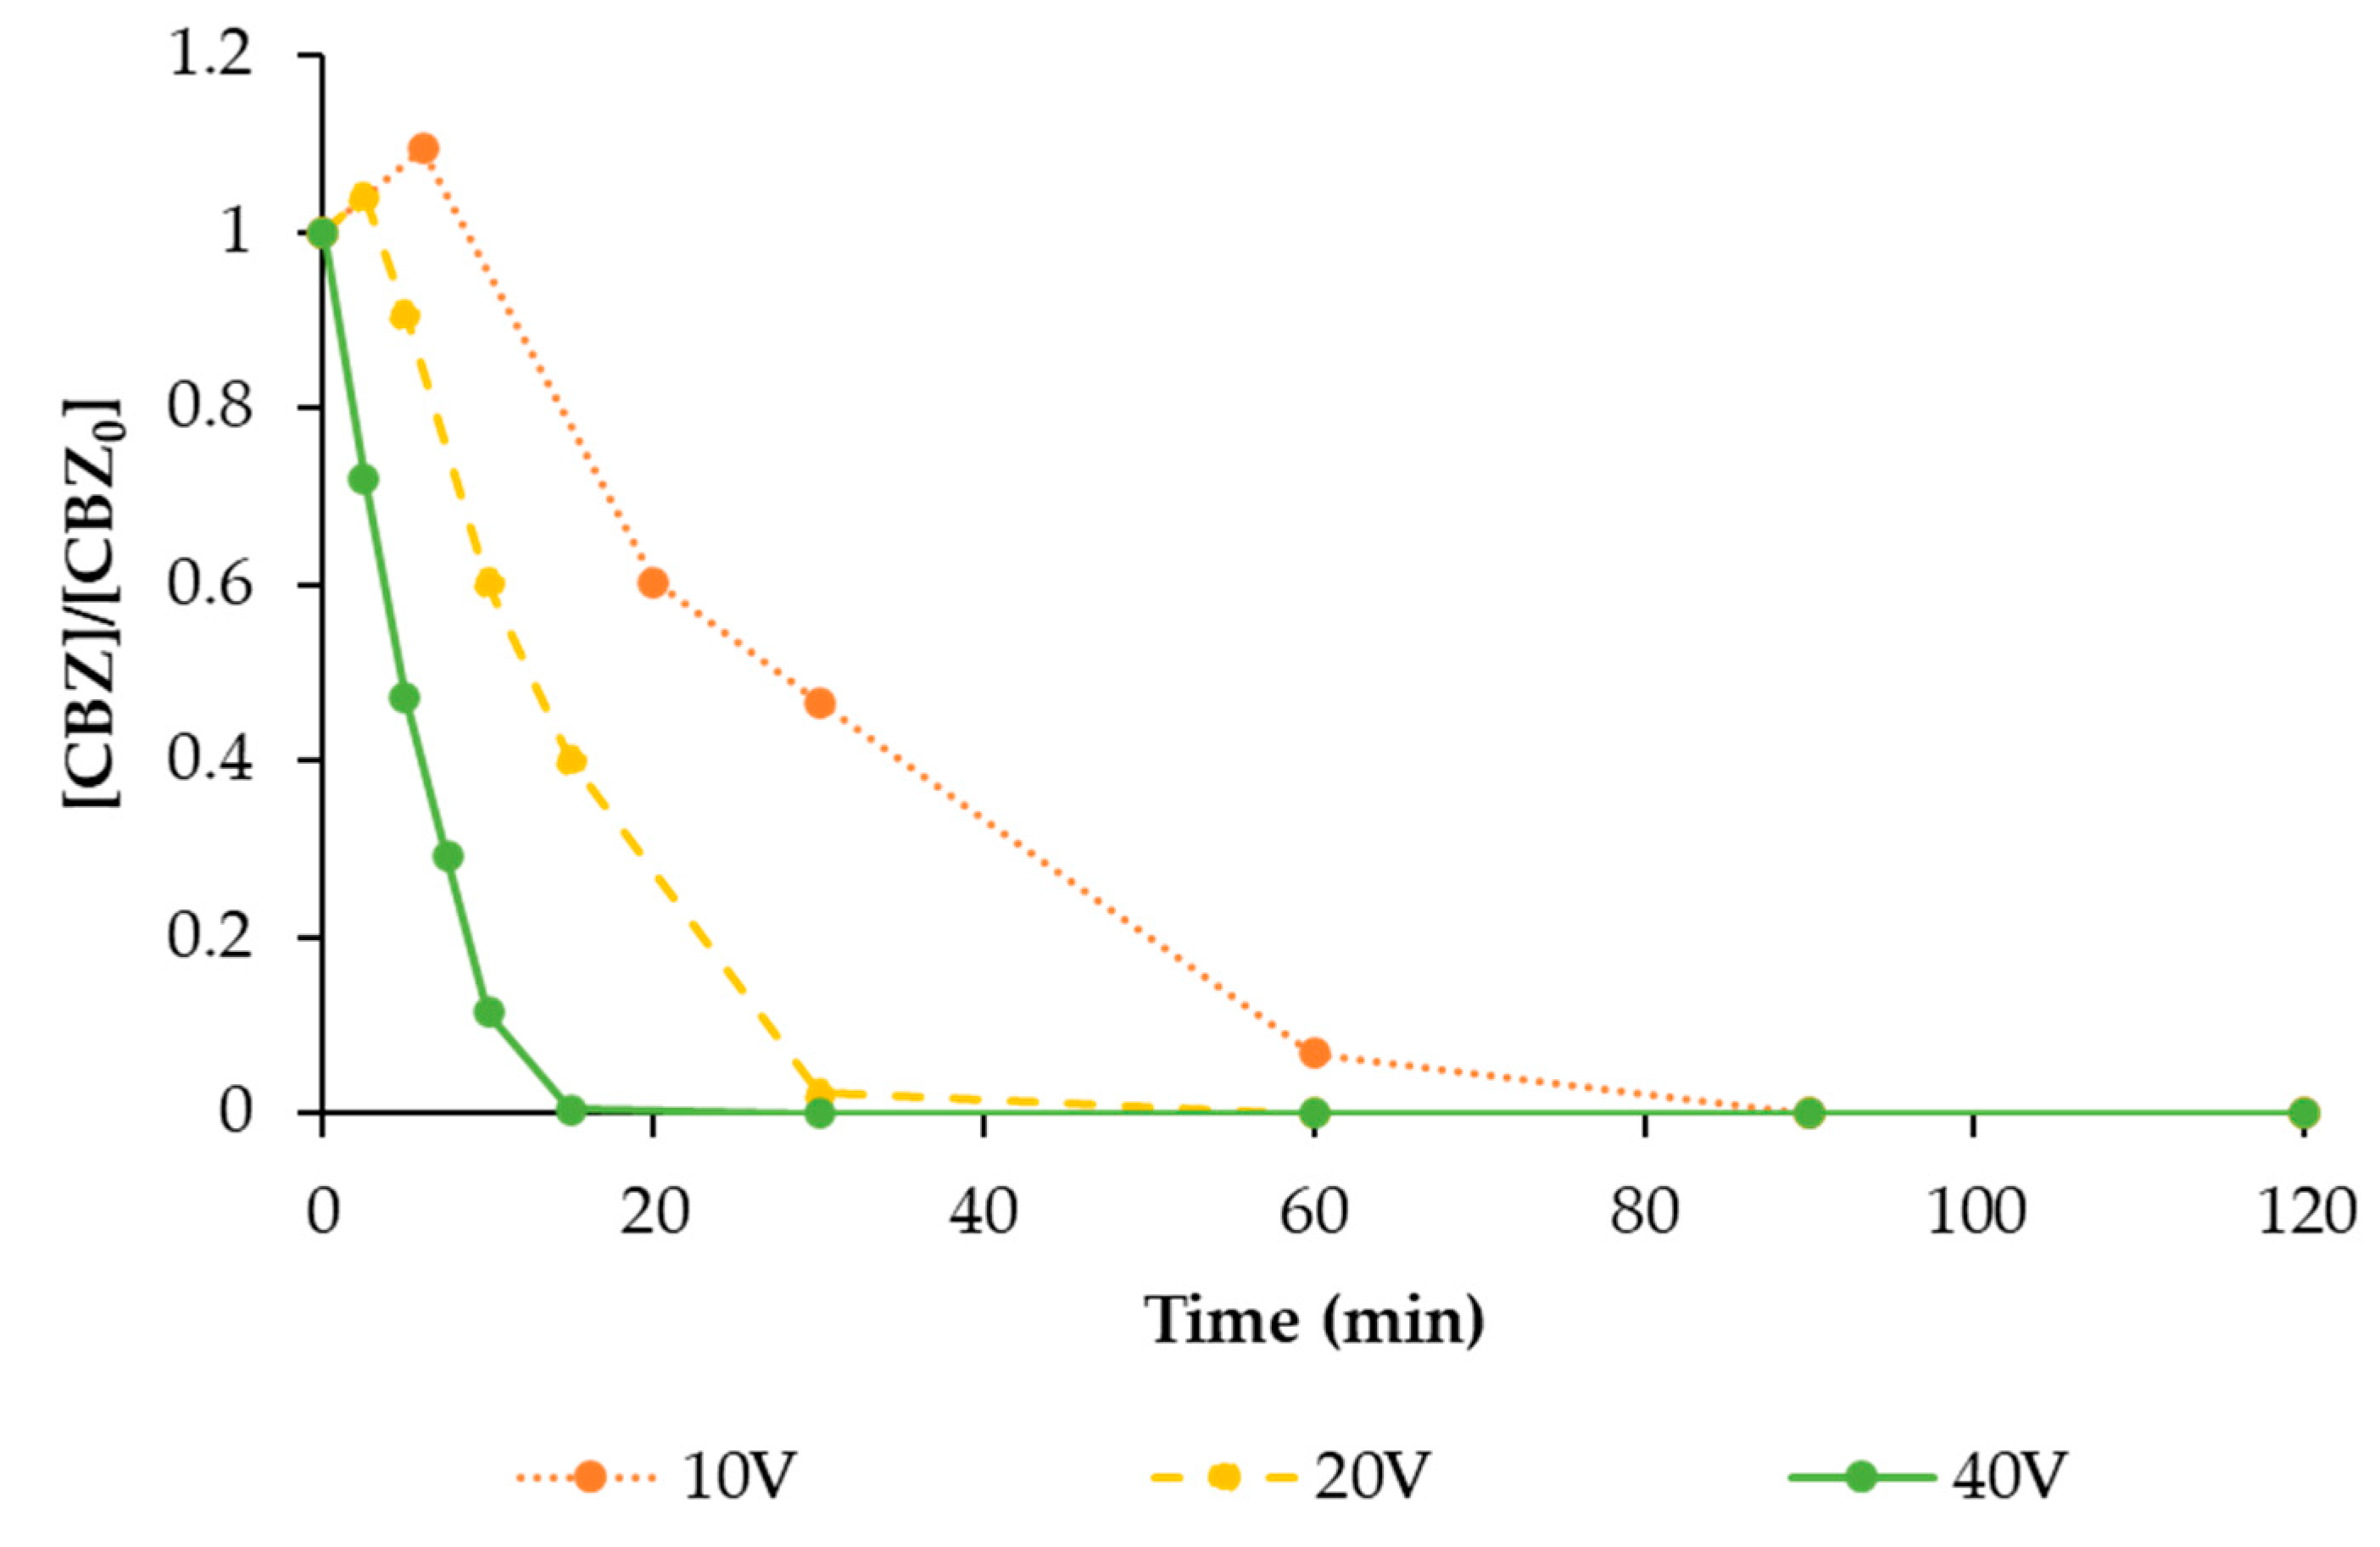
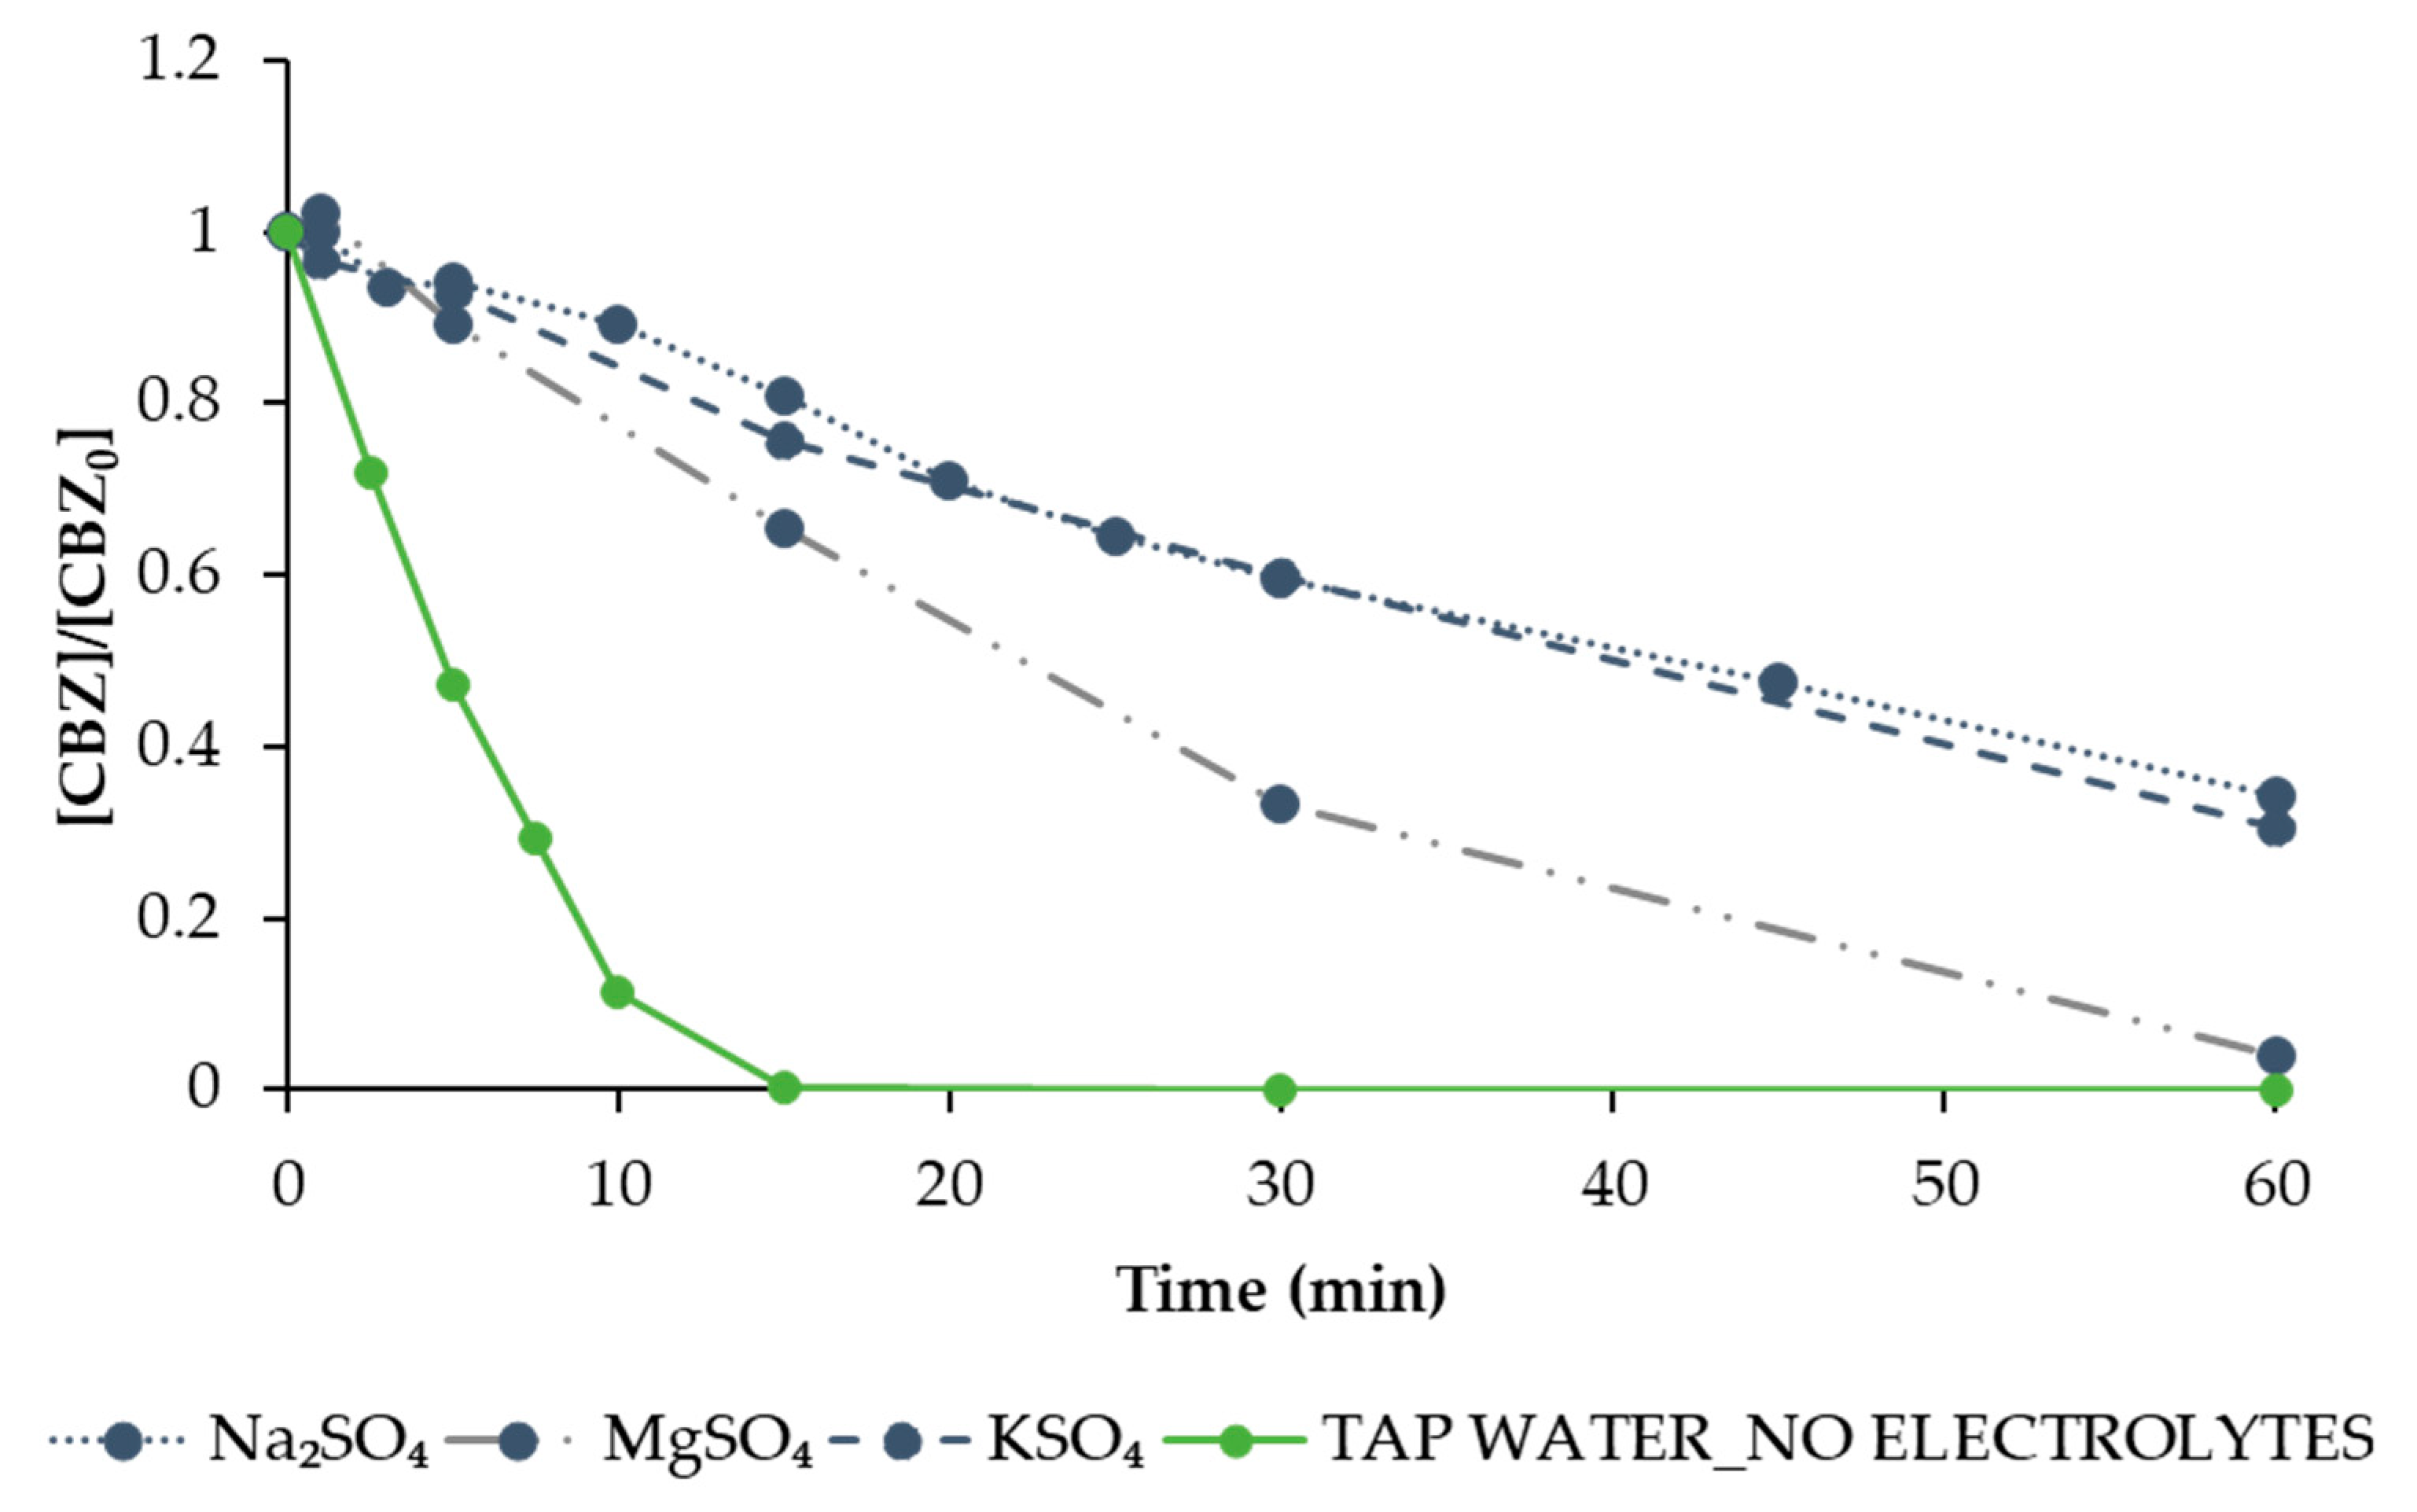
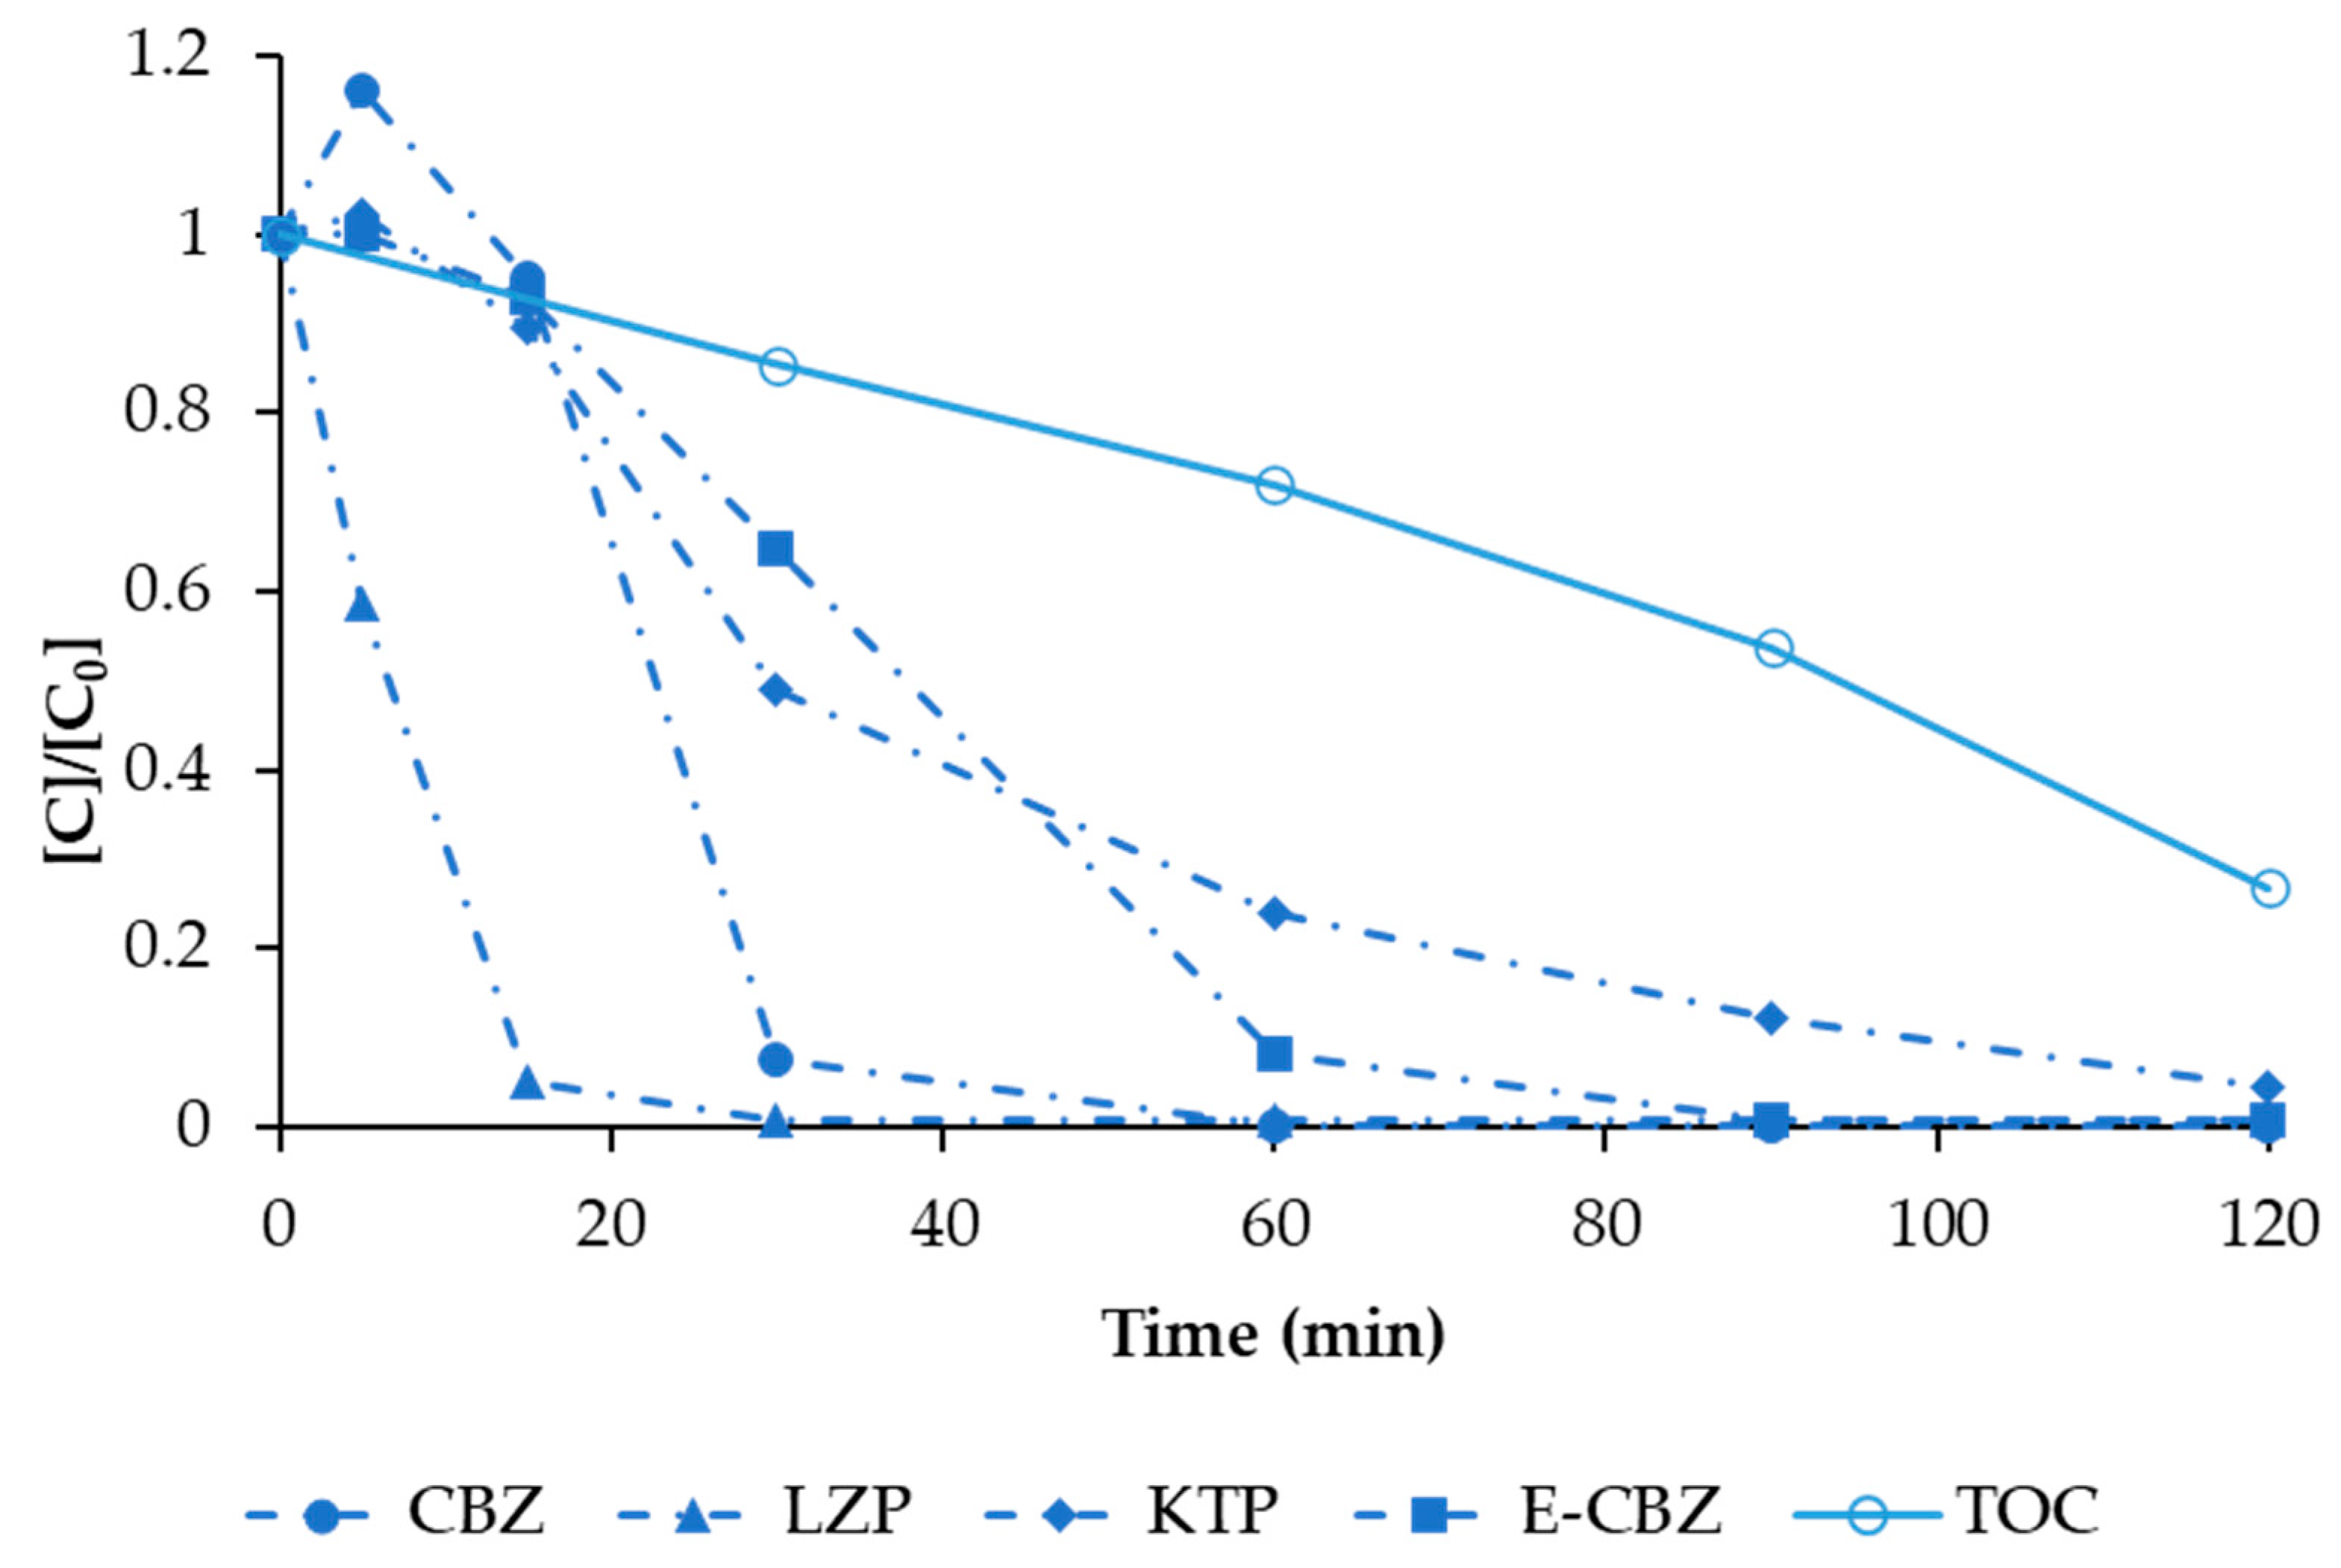
3.1. Optimisation of EO Treatment

The effect of the cathodic material on the efficiency of EO was first tested for CBZ removal. As can be observed in Figure 5, Pt/Ti allows 94% degradation in 60 min against the 40% removal obtained using the cathode in stainless steel. Moreover, when using only Pt/Ti as a cathode, it was possible to degrade CBZ below the detection limit of the HPLC equipment during the studied treatment time.
This result confirms the conclusions that arose by a recent study by Medel et al. (2020 [34]), that not only the anodic material but also the cathodic material must be taken into account for the potential OH production on its surface, which of course affects degradation pathways and EO performance.
Then, the effect of voltage (and therefore, current density) on EO efficiency was tested for CBZ removal, using Pt/Ti as a cathode, since it showed the best performance in terms of CBZ degradation. Results are shown in Figure 6.
Applied voltage and therefore current density are important processing conditions for electrochemical treatment because an excessive current density can lead to a significant increase of operational costs both for electricity consumption and because the lifetime of the anode material may be reduced. Hence, many authors have studied their optimisation.
As pointed out by similar works by other authors [35,36,37], a direct relationship between voltage and EO performance was observed: by doubling the applied voltage, the degradation rate was almost tripled (in 15 min about 25% degradation of CBZ was reached applying 10 V, which increased to 60% when voltage was increased to 20 V). When 40 V was applied, the concentration of CBZ decreased below the HPLC detection limit in only 15 min.
The results of the evaluation of the influence of the electrolyte on EO efficiency determined in case of fixing the operational conditions that better performed for CBZ removal (BDD anode, Pt cathode and 40 V) are shown in Figure 7. Three electrolytes were tested, namely MgSO4, Na2SO4, and K2SO4. As also observed by previous works [35,36], the change in the type of support electrolyte can provide large differences in the removal efficiencies. In the present study, MgSO4 showed the best results in terms of percentage removal of CBZ, allowing for achieving 96% removal in 60 min against the 70% CBZ removal recorded for the other two electrolytes tested in this study (Na2SO4 and K2SO4). However, despite its better performance, MgSO4 generated an important problem of precipitation of solids. Consequently, the use of MgSO4 as an electrolyte is not recommended. As can be observed, the percentage removal of CBZ observed when using Na2SO4 and K2SO4 (dissolved in deionized water) was lower than the one observed, under the same conditions but without electrolytes, using tap water. This can be explained by the presence of ions in the tap water, allowing the generation of several active radicals (not only OH due to H2O hydrolysis) that synergically participate in CBZ degradation.
Then, the operational conditions that better performed in terms of CBZ removal (Pt/Ti cathode and 40 V) were tested for the removal of all the other model compounds separately (Figure 8) and in mixture in a concentration of 1 mg L−1 each (Figure 9).
The highest degradation rate was observed for LZP, which decreased below the detection limit in just 5 min. On the other hand, E-CBZ resulted in being the compound that was more difficult to degrade, with a negligible degradation (about 20%) until 80 min of treatment. At this point, the voltage was increased to 75 V to check if it was possible to obtain a higher degradation rate (dash dot line in Figure 8). By increasing the voltage, it was finally possible to reach 95% degradation of E-CBZ in the remaining 40 min. The E-CBZ resulted in being the bottleneck of the EO operational conditions. Hence, for the EO treatment of the mixture of the four compounds, a voltage of 75 V was applied (Figure 9).
Very few studies on the electrochemical degradation of the main metabolites of CBZ, among which there is E-CBZ, can be found in literature. However, a very recent study published in 2023 by Mussa et al. [38] showed a similar trend for 10,11-dihydro-10-hydroxy carbamazepine electrochemical oxidation, highlighting the need of high energy consumption and long treatment times.
As can be observed, the interaction among the four compounds in mixture slightly modified the single degradation rates, slightly slowing the process. However, ≥95% degradation was observed for all the compounds in a maximum time of 120 min. In any case, the compounds that were more difficult to degrade remained to be KTP and E-CBZ, and the highest degradation rate was also observed for LZP. A significant TOC degradation was also observed, reaching 75% degradation in 120 min; however, due to the presence of MeOH in the stock solution prepared with the mixture of the four selected model compounds, it was not possible to evaluate the carbon balance and relate it to the degradation of the model compounds.

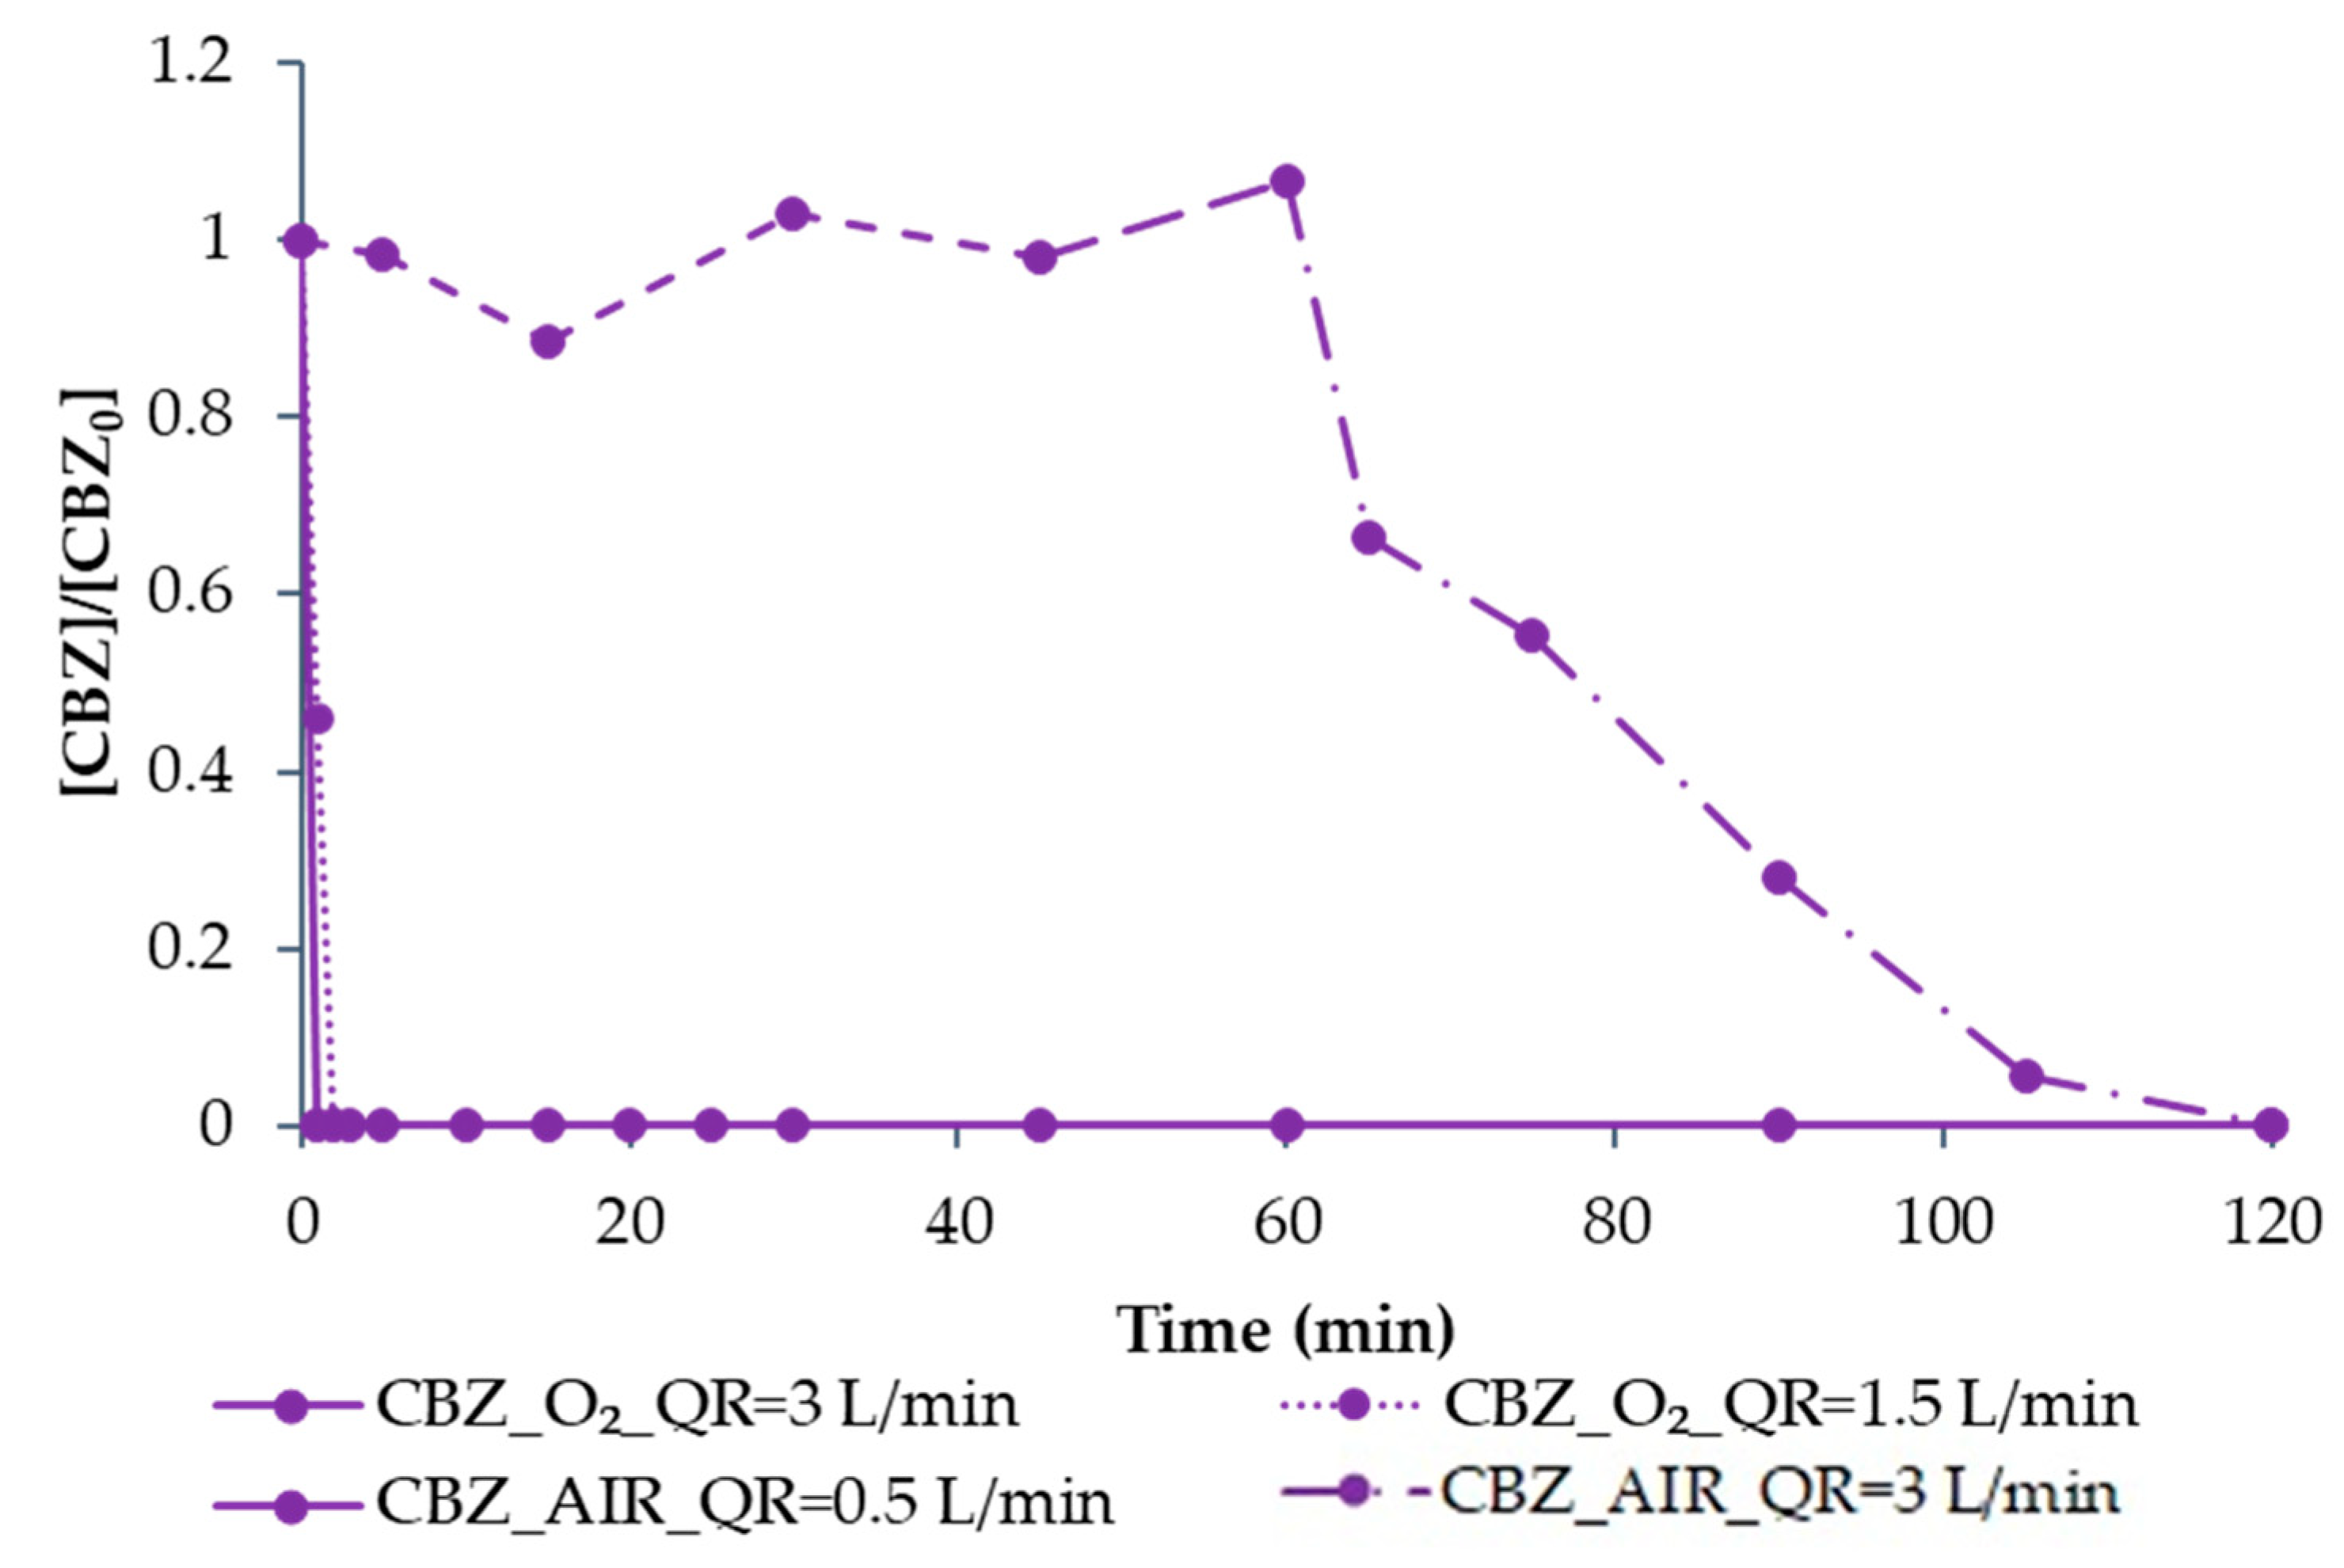
3.2. Optimisation of O3 Treatment

As for EO, the optimisation of O3 was first performed using CBZ as a model compound, comparing different feed sources (air/O2) and inlet QR (between 0.5 and 3 L min−1). As shown in Figure 10, when using air as feed and fixing QR = 0.5 L min−1, no CBZ degradation was observed in 60 min. Therefore, QR was increased to 3 L min−1, which is why, at min 60, a change in the CBZ degradation rate can be observed. The 100% removal of CBZ was achieved in the next 60 min of the experimental run. This can be probably explained by the low initial concentration of CBZ that requires higher ozone doses for effective degradation, as pointed out by Alharbi et al. [39].
Subsequently, QR = 3 L min−1 was fixed, using O2 as feed, reaching 100% CBZ degradation in less than 1 min. With the aim of reducing O2 consumption (and therefore, treatment costs), QR was reduced to 1.5 L min−1, also observing a fast degradation of CBZ, which was completely removed in just 2 min.
Hence, as also concluded by other authors [39], ozone treatment resulted in being a very effective process for CBZ degradation when an adequate ozone dose was used.
Afterwards, the O3 treatment of LZP, KTP and E-CBZ (individually) was tested using O2 as feed and fixing QR = 1.5 L min−1 for LZP, since in the previous tests, it resulted in being more easily degradable than KTP and E-CBZ. for which QR was fixed to 3 L min−1. Results are shown in Figure 11. As can be observed, LZP decreased below the detection limit in just 10 min, while, regarding KTP and E-CBZ, even if a greater QR was fixed (=3 L min−1), E-CBZ decreased below the detection limit after 90 min of reaction, and a degradation of about 94% of KTP was reached after 120 min. A lower reactivity to O3 treatment in the degradation of KTP and E-CBZ has also been highlighted by other authors [40,41] and the presence of both substances in mixture seems to worsen the O3 performance.
The removal of the four mixed compounds was therefore performed using O2 as feed and QR = 3 L min−1 (operational conditions that better performed for the elimination of all four selected CECs). Under these conditions, an inlet O3 concentration of 23 ± 2 g Nm−3 was recorded, which corresponds to an O3 dose of 0.07 g O3 min−1 (a total of 8 g O3 for 120 min of treatment).
As can be seen in Figure 12, the degradation rate of E-CBZ and KTP was affected when treated in mixture, since no degradation of E-CBZ and only 27% removal of KTP was observed after 120 min of treatment. This result is in agreement with previous similar works [40,41] and is probably due to the competitor behaviour of the selected compounds, as most of the O3 is probably used to degrade CBZ and LZP and their metabolites rather than KTP and E-CBZ.
Concerning TOC, also shown in Figure 12, no decrease was observed until the end of experiments. This result can be attributed to a non-complete mineralisation of the compounds, which are partially degraded into metabolites. Other authors also experienced similar results. Adil et al. [42] recently published a work on pharmaceutical degradation by ozone treatment and observed that mineralisation of the target compounds was less effective than their decomposition both in individual solutions and in mixture.
In the specific case of CBZ, Alharbi et al. [39] identified seven ozonation by-products characterized by higher molecular weights than the parent compound and more resistant toward O3, with one by-product (1-(2-benzaldehyde)-4-hydro-(1H,3H)-quinazoline-2-one) persistent even to high concentrations of O3.
For this reason, it is of great importance to study the combination of other AOPs that may be an effective way to remove undesired oxidation by-products.

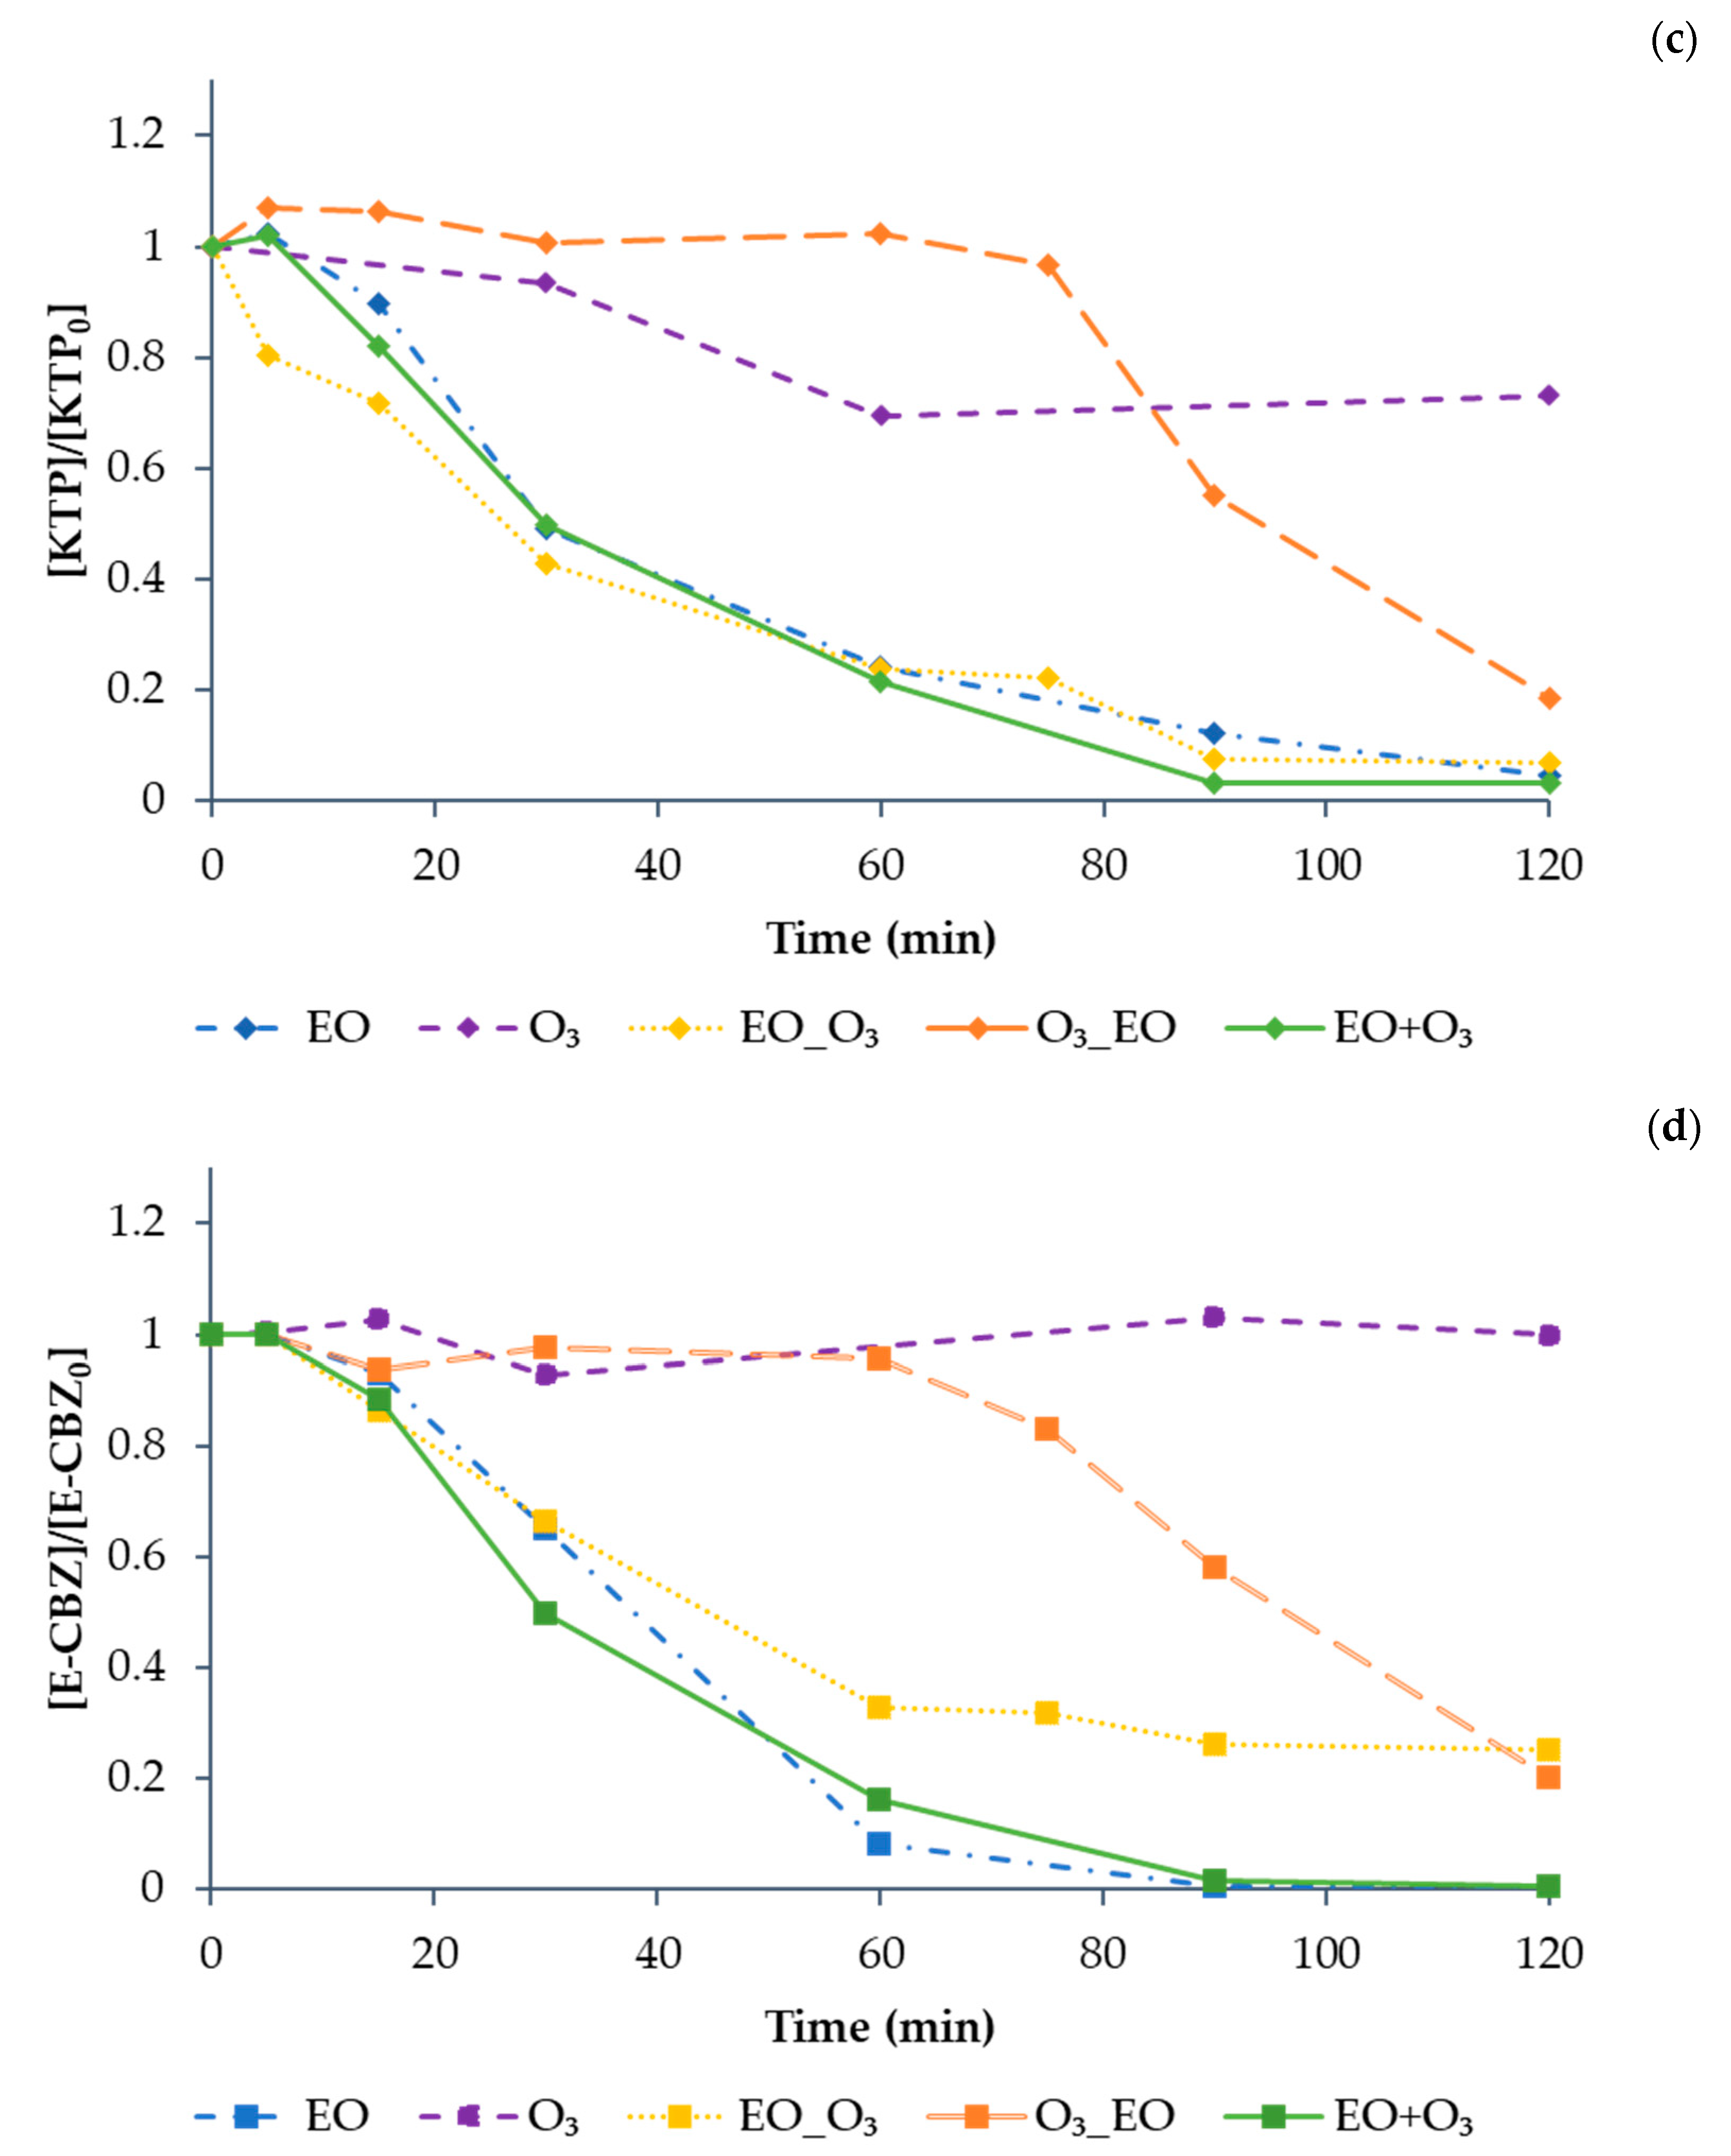
3.3. Sequential and Simultaneous Combination of EO and O3

Results of the sequential (EO-O3 and O3-EO) and simultaneous (EO+O3) combined treatment for the mixture of compounds are shown in Figure 13 (results are shown one by one for the sake of clarity). The simultaneous combination (EO+O3) was the only treatment option that allowed the complete degradation of all model CECs in a maximum of 120 min. CBZ and LZP decreased below the detection limit in less than 5 min, while KTP and E-CBZ were no more detected in about 90 min, confirming them to be the most difficult compounds to be degraded. Moreover, the EO+O3 treatment allowed a significant decrease of TOC (about 70% degradation in 120 min). However, due to the presence of MeOH in the stock solution prepared with the mixture of the four selected model compounds, it was not possible to evaluate the carbon balance and relate it to the degradation of the model compounds.
On the contrary, O3-EO was not effective in the degradation of KTP and E-CBZ, confirming the results obtained applying only the O3 treatment (see Figure 12). As expected, according to the efficiency shown by EO applied alone (see Figure 9), EO-O3 showed better results, reaching, after 120 min, 80% degradation of E-CBZ and 99% degradation of KTP.
The slower degradation rate of KTP due to O3 treatment agrees with literature data. A study by Li et al. [43] recently highlighted that KTP degradation by O3 can be described by a second-order rate constant, while the combination of EO and O3 has a significant synergic effect on KTP degradation.
In any case, the existence of synergistic effects due to the combination of O3 and EO treatments has been reported by other authors [44,45], making it possible to increase organic matter removal and decrease the electrical consumption in comparison with their individual application.

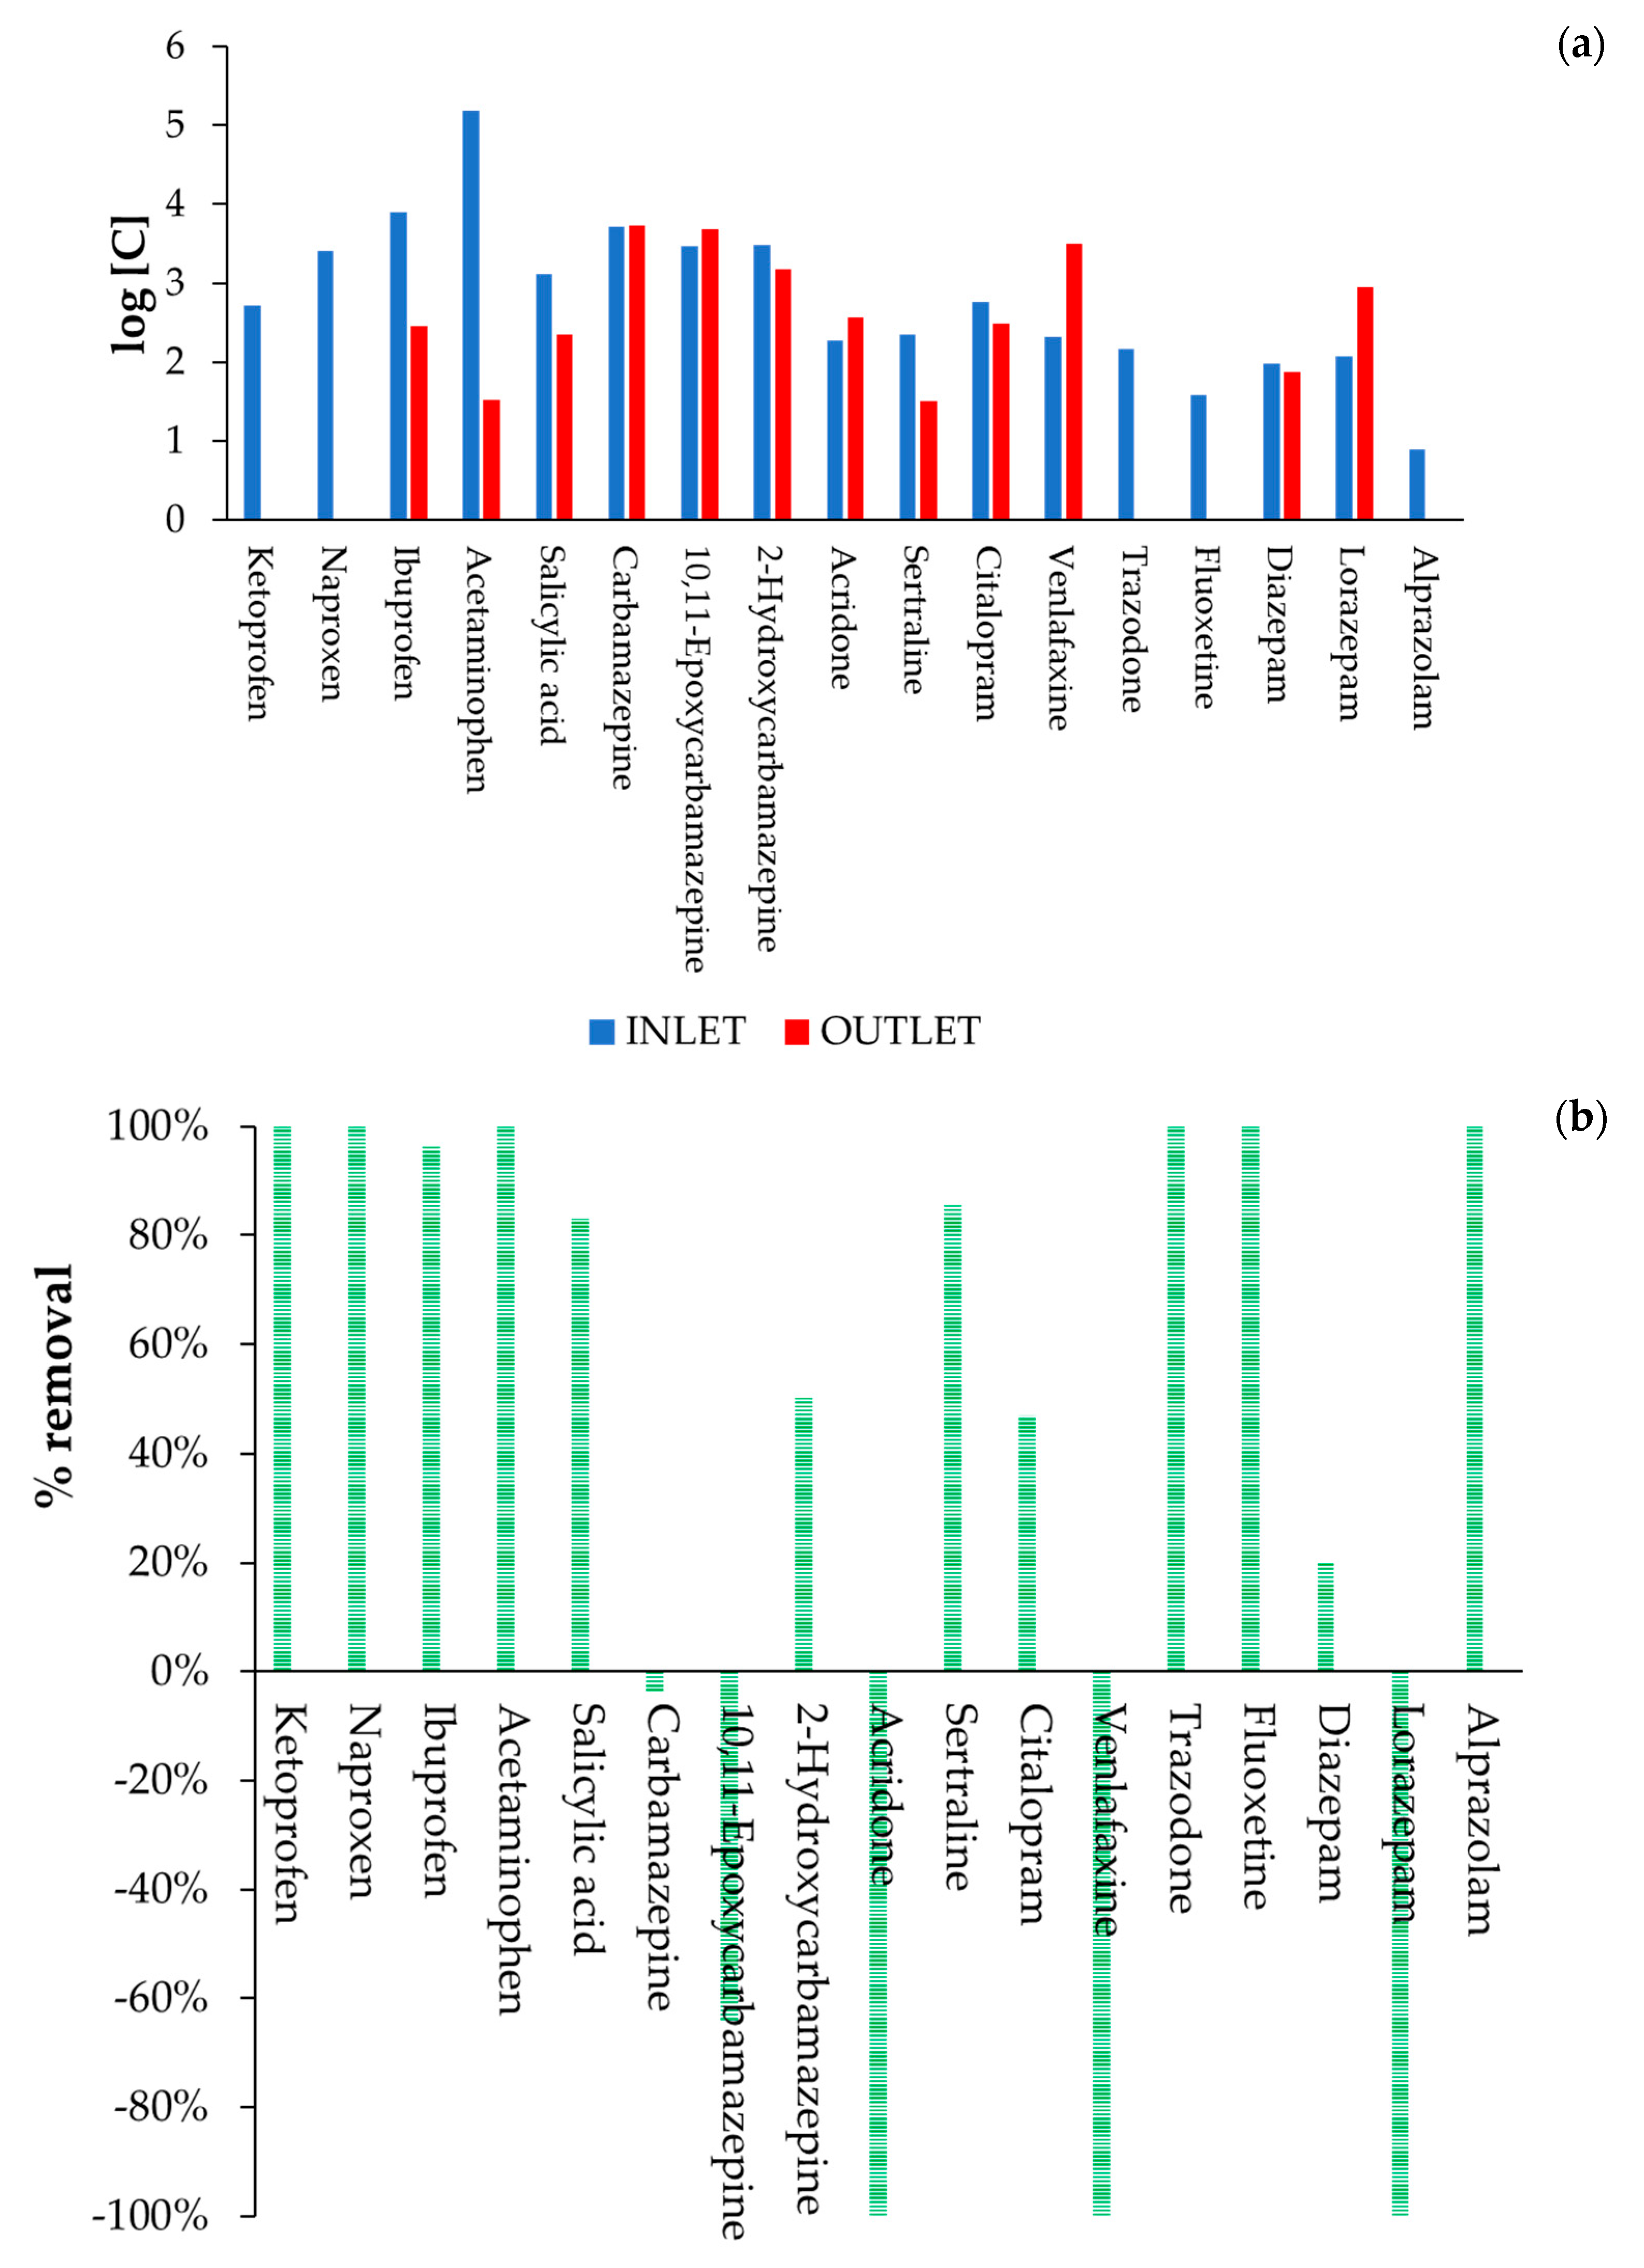
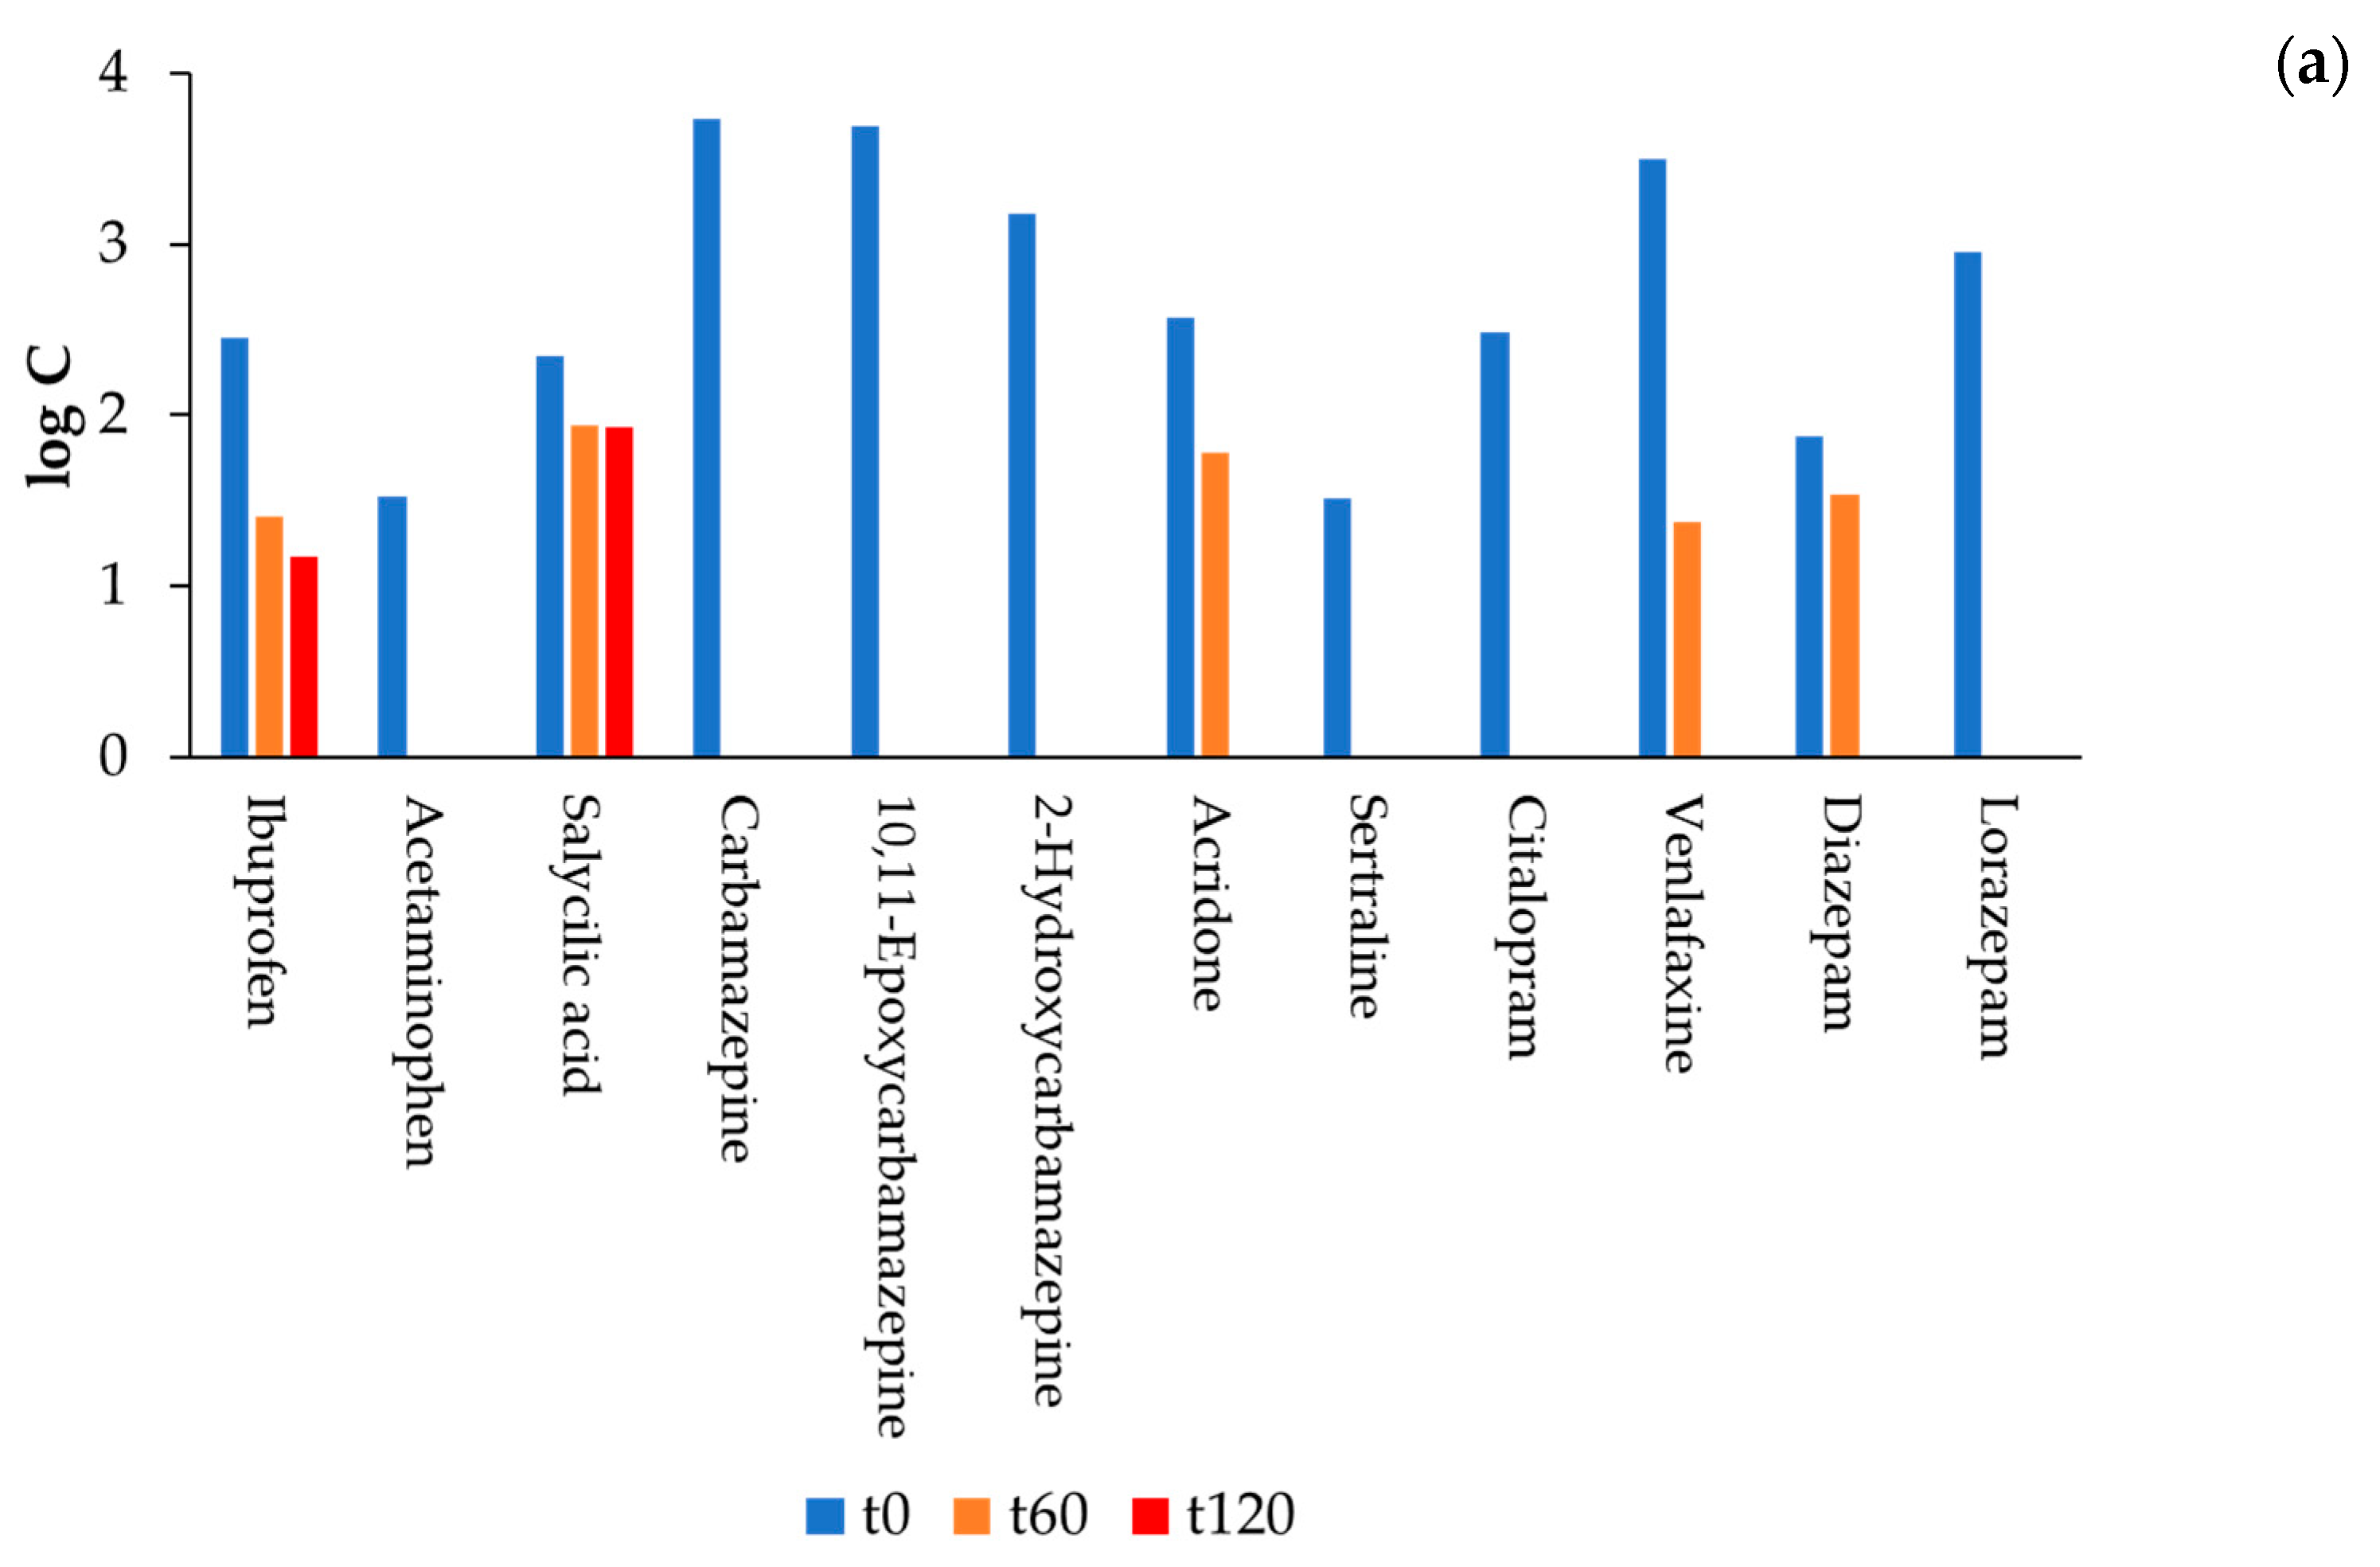
3.4. Validation with Real Hospital Wastewater

The AOP combination that showed the best performance in terms of removal of the four selected model CECs was tested for the treatment of real hospital wastewater previously treated by a MBBR.
As explained in Section 2.3, the real hospital wastewater was characterized by analysing 28 drugs selected among the most refractory compounds in the literature and the most present in Catalonia. As shown in Figure 3, 9 of the 28 drugs selected for this study were not found in the real hospital wastewater. Hence, MBBR performance was determined considering the percentage removal of the 19 compounds that were originally detected in the real hospital wastewater, according to the following formula [(C0-Cf)/Cn] × 100, where C0 and Cf are the inlet and outlet concentrations of each compound, respectively.
Results in terms of both MBBR inlet and outlet concentrations recorded for each of the 19 drugs detected in the real hospital wastewater, as well as the respective percentage removal, are presented in Figure 14a,b, respectively. The results in Figure 14a are presented in logarithmic scale to improve the visualization of the very low concentrations.
In addition, for comparative purposes, the removal efficiency of the 19 detected drugs was also determined for HWWTP based on conventional ASP, starting with the recorded inlet and outlet concentrations shown in Figure 3. Results are presented in Figure 15.
It must be considered that the percentage removal of the 19 detected drugs by MBBR was calculated starting with the same inlet concentrations used to determine the HWWTP performance.
Both MBBR and HWWTP showed similar results for the removal of most of the anti-inflammatory/analgesic and pain reliever drugs detected in the real hospital wastewaters, with a percentage removal between 96% and 100% of ibuprofen, naproxen, and acetaminophen by both treatment systems. However, HWWTP showed a higher decrease of salicylic acid (96%) than MBBR (82%), while MBBR showed a higher decrease of ketoprofen (100%) than conventional HWTTP (82%). These results are in agreement with previously published works studying occurrence and removal efficiencies of nonsteroidal anti-inflammatory drugs (NSAIDs) by municipal wastewater treatment plants, which reported very high removal efficiencies of all NSAIDs [46,47]. Conversely, acridone showed quite low biodegradability in both treatment systems, with a percentage removal of about only 40%, which agrees with the percentage removal recorded by other authors [48].
Concerning psychiatric drugs, both HWWTP and MBRR showed low removal efficiencies for CBZ and its main metabolites, with a slightly higher removal efficiency for 2-Hydroxycarbamazepine. These results are in agreement with literature data that reported the very recalcitrant nature of CBZ and its metabolites [37,49,50,51,52]. Low removal efficiencies were also reported both for HWWTP and MBBR in the treatment of diazepam, LZP, and citalopram, which was in agreement with the work recently published by Mir-Tutusaus et al. [46]. Citalopram and venlafaxine have been reported as some of the most recalcitrant substances according to previous studies [37,49,51,53]. However, despite MBBR showing very low removal efficiency of venlafaxine, in agreement with the literature review, HWWTP showed a higher removal rate, between 60 and 70%.
The authors believe that the comparison between HWWTP and MBBR is affected by the fact that HWWTP operated and treated the same influent for several years, and therefore, biomass acclimation has reached the highest level. On the contrary, MBBR was only performed for a few months in the present study.
Trazodone was the only psychiatric drug that was removed in high percentages (between 90% and 100%) both by HWWTP and MBBR, in agreement with previous studies using similar treatments [46]. Medium removal efficiency was recorded for sertraline by HWWTP (56%), as shown by other authors [19], achieving up to 85% when using MBBR technology. Moreover, MBBR allowed the total removal of fluoxetine and alprazolam, in contrast with HWWTP (33% and 11%, respectively). Negative values of % removal were observed for some substances, confirming that the release of compounds adsorbed in the activated sludge must be considered (together with sample variability).
Then, finally, the performance of the optimised AOP (EO+O3, BDD anode, Pt cathode, 75 V, O2 as O3 source, and QR = 3 L min−1) applied after MBBR was determined by calculating the percentage removal of the drugs that were still detected in the MBBR effluent. The AOP performance was evaluated, determining the percentage removal of the drugs by applying the formula [(C0-Cf)/Cn] × 100, where C0 is the inlet concentration to the AOP (corresponding to the outlet concentration of MBBR), and Cf is the outlet concentration after 120 min of AOP treatment, of each compound. Results are shown in Figure 16b. Conversely, Figure 16a presents the AOP inlet (0 min) and outlet (120 min) concentrations of the drugs still detected after MBBR, together with the concentrations after 60 min of treatment, determined with the aim of optimising the treatment time and, consequently, the operational cost of the AOP. The results presented in Figure 16a are in logarithmic scale to improve the visualization of the very low concentrations.
The selected AOP showed great potential as polishing treatment after MBBR since, in a maximum of 120 min, all the most refractory compounds to MBBR, such as CBZ and its metabolites, LZP, acridone, and venlafaxine, were completely eliminated, with the only exception being salicylic acid, which was reduced by 18% in the first 60 min with no further reduction in the next 60 min of treatment (with a final concentration of 85.4 ng L−1) and of ibuprofen which was removed by 43% after 60 min of treatment, which increased to 52% after another 60 min of treatment.
The toxicity and disinfection capacity of the proposed AOP were also assessed. Concerning the results of the toxicity tests, a value in the range of 2.12 ± 0.4 Equitox m−3 was observed in the treated affluent. This value is slightly higher than the toxicity of the initial sample (1.07 ± 0.6 Equitox m−3) but, in any case, lower than the discharge limits, which, depending on the reference legislation, are in the range of 10–50 Equitox m−3. This behaviour could be due to the formation of oxidation by-products that slightly increase the toxicity of the effluent, and it is quite common and reported by other authors [22,23]. In the specific case of CBZ, for instance, Garcia-Gomez et al. [29] identified the formation of oxidation by-products more toxic than the parent compound highlighted by an increase of toxicity during EO treatment.
Finally, the analysis of microbiological contaminants in the effluent was performed, showing that the simultaneous combination of EO and O3 allowed for the total inactivation/elimination of both E. coli and Total Flora, in a maximum time of 60 min. The obtained results confirmed not only the high disinfection performance of the O3 treatment, one of the most used technologies for disinfection [54], but also the promising use of electrochemical technologies for disinfection purposes [55,56] and of their combination [45]. Residual concentrations of DO3 and DO2 were also measured at the final effluent to check the feasibility of a possible recirculation to the biological aerobic treatment. A concentration of DO2 > 35 mg L−1 was detected at the end of the AOP treatment, which remained constant for the following 60 min. Then, after 240 min, it dropped to a value of 11 mg L−1. In the case of DO3, a value of 0.9 mg L−1 was detected at the end of the treatment, which dropped to <0.1 mg L−1 in 60 min. Therefore, the effluent from the AOP treatment could be recirculated to the biological system after 60 min rest, with >35 mg O2 L−1 and <0.1 mg O3 L−1, reducing aeration costs to maintain O2 concentration in the aeration tank (usually between 1.0 and 2.0 mg O2 L−1 [57]).

4. Conclusions

The treatment of biologically pre-treated hospital wastewaters through EO and O3 treatments has been evaluated and optimised in terms of electrode materials, applied voltage, feed source, inlet O3 flowrate to the mixing/feeding reactor, and treatment time. The EO operational conditions that showed the best removal of CBZ in an initial concentration of 1 mg L−1 were: BDD anode, Pt/Ti cathode, and an applied voltage of 75 V (corresponding to 68 mA cm−2). For O3 treatment, the best CBZ removal efficiencies were obtained using O2 as a feed source and an inlet O3-rich gas flowrate of 3 L min−1. When applying the optimal conditions to treat the mix of the four pharmaceuticals (CBZ, LZP, KTP, and E-CBZ), EO showed removal efficiencies above 99% for all pharmaceuticals but in different reaction times (60 min for CBZ, 30 min for LZP, 90 min for E-CBZ, and 120 min for KTP). On the contrary, O3 treatment did not allow a significant reduction of E-CBZ and KTP in 120 min of treatment, while >99% removal of CBZ and LZP was observed in less than 5 min. Hence, E-CBZ and KTP were the most refractory compounds to both AOPs (EO and O3). The complete removal of all pharmaceuticals in mixture was only reached via the simultaneous combination of EO+O3. In this case, >99% removal of KTP and E-CBZ was reached in 90 min, while CBZ and LZP were eliminated in less than 5 min. However, to reach a significant TOC reduction of 75%, 120 min of EO+O3 treatment was required. The simultaneous combination of EO+O3 was validated for the treatment of real hospital wastewaters previously treated by a MBBR process. It was proven that EO+O3 is a very promising polishing treatment for biologically treated hospital wastewaters, allowing for the >95% removal of most of the pharmaceuticals recalcitrant to biological treatments, with the sole exception of salicylic acid and ibuprofen, for which alternative treatments would need to be studied. To reach this result, no chemical reactants (neither electrolytes nor chemicals for pH adjustment) were added, and only energy consumption must be considered as operational cost. To validate the use of EO+O3 for real applications, it is of great importance to prove the safety of AOPs (since the generation of toxic oxidation by-products can occur), as well as its disinfection efficiency, a strategic factor due to the raising consciousness around AMR. The proposed AOPs (EO+O3) ensured a safe effluent, with toxicity values under the established limit, while presenting a great disinfection potential, fully inactivating both E. coli and Total Flora in 60 min and preventing bacteria regrowth.
The present study has shown that, to efficiently treat hospital wastewaters (or other kind of wastewaters containing pharmaceuticals), it is necessary to combine novel biological treatments (which can improve the ASP performance) with AOPs to efficiently remove CECs, micropollutants, and bacteria. Moreover, it is important to exploit the synergies between different AOPs to both improve process performance and reduce operational costs. For example, ozonation reaction could be improved using catalysts (e.g., H2O2) or UV irradiation. Despite the good results, more investigation effort is needed to develop an economically affordable train of technologies. However, to speed up the investigation on this front, a legislative change must be pursued. A further step will also be to investigate the potential of the proposed train of technologies in ARG/ARB removal to tackle this urgent global issue for human health.

Author Contributions

Conceptualization: S.S.P. and F.A.; methodology: F.A., J.A., M.P. and R.G.C.; validation: F.A.; formal analysis: F.A.; investigation: F.A., J.A., M.P. and R.G.C.; resources: S.S.P., M.P. and R.G.C.; data curation: F.A., M.P. and R.G.C.; writing—original draft preparation: F.A.; writing—review and editing: S.S.P.; visualization: S.S.P. and F.A.; supervision: S.S.P.; project administration: S.S.P. and F.A.; funding acquisition: S.S.P. All authors have read and agreed to the published version of the manuscript.

Funding

This research has been carried out under the EFLUCOMP project, co-funded by the EU trough the European Regional Development Fund (FEDER)-COMRDI16-1-0065. EFLUCOMP is one of the six projects of the RIS3CAT Water Community accredited by the Generalitat de Catalunya through the Agency for Business Competitiveness (ACCIÓN) financed by the European Regional Development Fund (FEDER) of the European Union within the framework of the FEDER Operational program of Catalonia 2014-2020.

Data Availability Statement

All relevant data are included in the paper.

Acknowledgments

The authors would like to acknowledge the EU and Catalonia region for funding EFLUCOMP project (COMRDI16-1-0065).

Conflicts of Interest

The authors declare no conflict of interest.

References

  1. Majumder, A.; Gupta, A.K.; Ghosal, P.S.; Varma, M. A review on hospital wastewater treatment: A special emphasis on occurrence and removal of pharmaceutically active compounds, resistant microorganisms, and SARS-CoV-2. J. Environ. Chem. Eng. 2021, 9, 104812. [Google Scholar] [CrossRef]
  2. Rapti, I.; Kosma, C.; Albanis, T.; Konstantinou, I. Solar photocatalytic degradation of inherent pharmaceutical residues in real hospital WWTP effluents using titanium dioxide on a CPC pilot scale reactor. Catal. Today 2022, in press. [Google Scholar] [CrossRef]
  3. Kooijman, G.; De Kreuk, M.K.; Houtman, C.; Van Lier, J.B. Perspectives of coagulation/flocculation for the removal of pharmaceuticals from domestic wastewater: A critical view at experimental procedures. J. Water Process Eng. 2020, 34, 101161. [Google Scholar] [CrossRef]
  4. Rodriguez-Mozaz, S.; Lucas, D.; Barceló, D. Full-Scale Plants for Dedicated Treatment of Hospital Effluents. In Hospital Wastewaters. The Handbook of Environmental Chemistry; Verlicchi, P., Ed.; Springer: Cham, Switzerland, 2018; Volume 60. [Google Scholar] [CrossRef]
  5. Pinheiro, M.; Martins, I.; Raimundo, J.; Caetano, M.; Neuparth, T.; Santos, M.M. Stressors of emerging concern in deep-sea environments: Microplastics, pharmaceuticals, personal care products and deep-sea mining. Sci. Total Environ. 2023, 876, 162557. [Google Scholar] [CrossRef]
  6. Mackuľak, T.; Černanský, S.; Fehér, M.; Birošová, L.; Gál, M. Pharmaceuticals, drugs, and resistant microorganisms—Environmental impact on population health. Curr. Opin. Environ. Sci. Health 2019, 9, 40–48. [Google Scholar] [CrossRef]
  7. Available online: https://publications.europa.eu/en/publication-detail/-/publication/a90868de-d1f9-11e4-9de8-01aa75ed71a1 (accessed on 1 March 2019).
  8. Chávez, A.M.; Ribeiro, A.R.; Moreira, N.F.F.; Silva, A.M.T.; Rey, A.; Álvarez, P.M.; Beltrán, F.J. Removal of Organic Micropollutants from a Municipal Wastewater Secondary Effluent by UVA-LED Photocatalytic Ozonation. Catalysts 2019, 9, 472. [Google Scholar] [CrossRef]
  9. Bláha, M.; Grabicová, K.; Shaliutina, O.; Kubec, J.; Randák, T.; Zlábek, V.; Buric, M.; Veselý, L. Foraging behaviour of top predators mediated by pollution of psychoactive pharmaceuticals and effects on ecosystem stability. Sci. Total Environ. 2019, 662, 655–661. [Google Scholar] [CrossRef]
  10. Li, S.; Ondon, B.S.; Ho, S.H.; Li, F. Emerging soil contamination of antibiotics resistance bacteria (ARB) carrying genes (ARGs): New challenges for soil remediation and conservation. Environ. Res. 2023, 219, 115132. [Google Scholar] [CrossRef]
  11. Ivanová, L.; Fáberová, M.; Mackulak, T.; Grabic, R.; Bodík, I. Estimation of amount of selected pharmaceuticals sorbed onto digested sludge from wastewater treatment plant Bratislava Petrzalka. Environ. Res. 2017, 155, 31–35. [Google Scholar] [CrossRef]
  12. Azzam, M.I.; Ezzat, S.M.; Othman, B.A. Antibiotics resistance phenomenon and virulence ability in bacteria from water environment. Water Sci. 2021, 31, 109–121. [Google Scholar] [CrossRef]
  13. Duarte, A.C.; Rodrigues, S.; Afonso, A.; Nogueira, A.; Coutinho, P. Antibiotic Resistance in the Drinking Water: Old and New Strategies to Remove Antibiotics, Resistant Bacteria, and Resistance Genes. Pharmaceuticals 2022, 15, 393. [Google Scholar] [CrossRef] [PubMed]
  14. Azuma, T.; Katagiri, M.; Sekizuka, T.; Kuroda, M.; Watanabe, M. Inactivation of Bacteria and Residual Antimicrobials in Hospital Wastewater by Ozone Treatment. Antibiotics 2022, 11, 862. [Google Scholar] [CrossRef] [PubMed]
  15. Checa, M.; Beltrán, F.J.; Rivas, F.J.; Cordero, E. On the role of a graphene oxide/titania catalyst, visible LED and ozone in removing mixtures of pharmaceutical contaminants from water and wastewater. Environ. Sci. Water Res. Technol. 2020, 6, 2352–2364. [Google Scholar] [CrossRef]
  16. Dao, K.C.; Yang, C.C.; Chen, K.F.; Tsai, Y.P. Recent Trends in Removal Pharmaceuticals and Personal Care Products by Electrochemical Oxidation and Combined Systems. Water 2020, 12, 1043. [Google Scholar] [CrossRef]
  17. Chen, L.; Zhou, Z.; Shen, C.; Xu, Y. Inactivation of antibiotic-resistant bacteria and antibiotic resistance genes by electrochemical oxidation/electro-Fenton process. Water Sci. Technol. 2020, 81, 2221–2231. [Google Scholar] [CrossRef]
  18. García-Espinoza, J.D.; Mijaylova-Nacheva, P.; Avilés-Flores, M. Electrochemical carbamazepine degradation: Effect of the generated active chlorine, transformation pathways and toxicity. Chemosphere 2018, 192, 142–151. [Google Scholar] [CrossRef]
  19. Elkacmi, R.; Bennajah, M. Advanced oxidation technologies for the treatment and detoxification of olive mill wastewater: A general review. J. Water Reuse Desalination 2019, 9, 463–505. [Google Scholar] [CrossRef]
  20. Wang, W.; Niu, Q.; Zeng, G.; Zhang, C.; Huang, D.; Shao, B.; Zhou, C.; Yang, Y.; Liu, Y.; Guo, H.; et al. 1D porous tubular g-C3N4 capture black phosphorus quantum dots as 1D/0D metal-free photocatalysts for oxytetracycline hydrochloride degradation and hexavalent chromium reduction. Appl. Catal. B-Environ. 2020, 273, 119051. [Google Scholar] [CrossRef]
  21. Guo, H.; Niu, H.Y.; Wang, W.J.; Wu, Y.; Xiong, T.; Chen, Y.R.; Su, C.Q.; Niu, C.G. Schottky barrier height mediated Ti3C2 MXene based heterostructure for rapid photocatalytic water disinfection: Antibacterial efficiency and reaction mechanism. Sep. Purif. Technol. 2023, 312, 123412. [Google Scholar] [CrossRef]
  22. Sharma, A.; Ahmad, J.; Flora, S.J.S. Application of advanced oxidation processes and toxicity assessment of transformation products. Environ. Res. 2018, 167, 223–233. [Google Scholar] [CrossRef]
  23. Wang, J.; Wang, S. Toxicity changes of wastewater during various advanced oxidation processes treatment: An overview. J. Clean. Prod. 2021, 315, 128202. [Google Scholar] [CrossRef]
  24. Clària, J. Los nuevos antiinflamatorios. Med. Integral 2001, 38, 175–183. [Google Scholar]
  25. Bonilla, L.; Garcia, A. Fàrmacs, Així Ens Mediquem Els Catalans/Fármacos, Como Nos Medicamos Los Catalanes. 20 February 2022. Available online: https://interactius.ara.cat/es/asi-nos-medicamos-los-catalanes (accessed on 12 June 2023).
  26. Sopaj, F.; Rodrigo, M.A.; Oturan, N.; Podvorica, F.I.; Pinson, J.; Oturan, M.A. Influence of the anode materials on the electrochemical oxidation efficiency. Application to oxidative degradation of the pharmaceutical amoxicillin. Chem. Eng. J. 2015, 262, 286–294. [Google Scholar] [CrossRef]
  27. Vatistas, N. Electrocatalytic Properties of BDD Anodes: Its Loosely Adsorbed Hydroxyl Radicals. Int. J. Electrochem. 2012, 2012, 507516. [Google Scholar] [CrossRef]
  28. Feier, B.; Florea, A.; Cristea, C.; Săndulescu, R. Electrochemical detection and removal of pharmaceuticals in waste Waters. Curr. Opin. Electrochem. 2018, 11, 1–11. [Google Scholar] [CrossRef]
  29. García-Gómez, C.; Drogui, P.; Zaviska, F.; Seyhi, B.; Gortáres-Moroyoqui, P.; Buelna, G.; Neira-Sáenz, C.; Estrada-Alvarado, M.; Ulloa-Mercado, R.G. Experimental design methodology applied to electrochemical oxidation of carbamazepine using Ti/PbO2 and Ti/BDD electrodes. J. Electroanal. Chem. 2014, 732, 1–10. [Google Scholar] [CrossRef]
  30. Guitaya, L.; Azaïs, A.; Zaviska, F.; Drogui, P.; Blais, J.F.; Gourich, B. Electrochemical Oxidation as Treatment for Contaminated Wastewaters by Carbamazepine: Process Optimization Through Response Surface Methodology. Water Air Soil Pollut. 2017, 228, 384. [Google Scholar] [CrossRef]
  31. Lourinho, G.; Brito, P.S.D. Electrolytic Treatment of Swine Wastewater: Recent Progress and Challenges. Waste Biomass 2021, 12, 553–576. [Google Scholar] [CrossRef]
  32. United States Environmental Protection Agency, Office of Water Washington, D.C., 832-F-99-063 September 1999. Wastewater Technology Fact Sheet Ozone Disinfection. Available online: https://www.epa.gov/sites/default/files/2015-06/documents/ozon.pdf (accessed on 15 April 2023).
  33. Gros, M.; Rodríguez-Mozaz, S.; Barceló, D. Fast and comprehensive multi-residue analysis of a broad range of human and veterinary pharmaceuticals and some of their metabolites in surface and treated waters by ultra-high-performance liquid chromatography coupled to quadrupole-linear ion trap tandem mass spectrometry. J. Chromatogr. A 2012, 1248, 104–121. [Google Scholar] [CrossRef]
  34. Medel, A.; Treviño-Reséndez, J.; Brillas, E.; Meas, Y.; Sirés, I. Contribution of cathodic hydroxyl radical generation to the enhancement of electro-oxidation process for water decontamination. Electrochim. Acta 2020, 331, 135382. [Google Scholar] [CrossRef]
  35. Guzmán-Duque, F.L.; Palma-Goyes, R.E.; González, I.; Peñuela, G.; Torres-Palma, R.A. Relationship between anode material, supporting electrolyte and current density during electrochemical degradation of organic compounds in water. J. Hazard. Mater. 2014, 278, 221–226. [Google Scholar] [CrossRef] [PubMed]
  36. Kul, S.; Boncukcuŏglu, R.; Erdem Yilmaz, A.; Ali Fil, B. Treatment of Olive MillWastewater with Electro-Oxidation Method. J. Electrochem. Soc. 2015, 162, G41–G47. [Google Scholar] [CrossRef]
  37. Nielsen, U.; Hastrup, C.; Klausen, M.M.; Pedersen, B.M.; Kristensen, G.H.; Jansen, J.L.; Bak, S.N.; Tuerk, J. Removal of APIs and bacteria from hospital wastewater by MBR plus O3, O3 + H2O2, PAC or ClO2. Water Sci. Technol. 2013, 67, 854–862. [Google Scholar] [CrossRef] [PubMed]
  38. Mussa, Z.H.; Al-Qaim, F.F. Electrochemical degradation of 10,11-dihydro-10-hydroxy carbamazepine as the main metabolite of carbamazepine. Environ. Sci. Pollut. Res. 2023, 30, 50457–50470. [Google Scholar] [CrossRef] [PubMed]
  39. Alharbi, S.K.; Price, W.E.; Kang, J.; Fujioka, T.; Nghiem, L.D. Ozonation of carbamazepine, diclofenac, sulfamethoxazole and trimethoprim and formation of major oxidation products. Desalination Water Treat. 2016, 57, 29340–29351. [Google Scholar] [CrossRef]
  40. Illés, E.; Szabó, E.; Takács, E.; Wojnárovits, L.; Dombi, A.; Gajda-Schrantz, K. Ketoprofen removal by O3 and O3/UV processes: Kinetics, transformation products and ecotoxicity. Sci. Total Environ. 2014, 472, 178–184. [Google Scholar] [CrossRef]
  41. Kharel, S.; Stapf, M.; Miehe, U.; Ekblad, M.; Cimbritz, M.; Falås, P.; Nilsson, J.; Sehlén, R.; Bregendahl, J.; Bester, K. Removal of pharmaceutical metabolites in wastewater ozonation including their fate in different post-treatments. Sci. Total Environ. 2021, 759, 143989. [Google Scholar] [CrossRef]
  42. Adil, S.; Maryam, B.; Kim, E.J.; Dulova, E. Individual and simultaneous degradation of sulfamethoxazole and trimethoprim by ozone, ozone/hydrogen peroxide and ozone/persulfate processes: A comparative study. Environ. Res. 2020, 189, 109889. [Google Scholar] [CrossRef]
  43. Li, X.; Wang, Y.; Wang, B.; Huang, J.; Deng, S.; Yu, G. Combination of ozonation and electrolysis process to enhance elimination of thirty structurally diverse pharmaceuticals in aqueous solution. J. Hazard. Mater. 2019, 368, 281–291. [Google Scholar] [CrossRef]
  44. Bergmann, M.H. Electrochemical disinfection–State of the art and tendencies. Curr. Opin. Electrochem. 2021, 28, 100694. [Google Scholar] [CrossRef]
  45. Sanchis, S.; Gali, D.; Salab, V.; Gomez, P.; Pinedo, J.; Donato, J.; Berlanga, J.G.; Garcia-Montaño, J. Advanced hybrid electro-oxidation & O3 technology for water reuse in the fruit and vegetable process industry. Water Sci. Technol. 2021, 84, 1159. [Google Scholar] [CrossRef] [PubMed]
  46. Mir-Tutusaus, J.A.; Jaén-Gil, A.; Barceló, D.; Buttiglieri, G.; Gonzalez-Olmos, R.; Rodriguez-Mozaz, S.; Caminal, G.; Sarrà, M. Prospects on coupling UV/H2O2 with activated sludge or a fungal treatment for the removal of pharmaceutically active compounds in real hospital wastewater. Sci. Total Environ. 2021, 773, 145374. [Google Scholar] [CrossRef] [PubMed]
  47. Thalla, A.K.; Vannarath, A.S. Occurrence and environmental risks of nonsteroidal anti-inflammatory drugs in urban wastewater in the southwest monsoon region of India. Environ. Monit. Assess. 2020, 192, 193. [Google Scholar] [CrossRef]
  48. Kosjek, T.; Andersen, H.R.; Kompare, B.; Ledin, A.; Heath, E. Fate of Carbamazepine during Water Treatment. Environ. Sci. Technol. 2009, 43, 6256–6261. [Google Scholar] [CrossRef]
  49. Escolà Casas, M.; Chhetri, R.K.; Ooi, G.; Hansen, K.M.S.; Litty, K.; Christensson, M.; Kragelund, C.; Andersen, H.R.; Bester, K. Biodegradation of pharmaceuticals in hospital wastewater by staged Moving Bed Biofilm Reactors (MBBR). Water Res. 2015, 83, 293–302. [Google Scholar] [CrossRef] [PubMed]
  50. Falås, P.; Longrée, P.; la Cour Jansen, J.; Siegrist, H.; Hollender, J.; Joss, A. Micropollutant removal by attached and suspended growth in a hybrid biofilm-activated sludge process. Water Res. 2013, 47, 4498–4506. [Google Scholar] [CrossRef]
  51. Kovalova, L.; Siegrist, H.; Singer, H.; Wittmer, A.; McArdell, C.S. Hospital wastewater treatment by membrane bioreactor: Performance and efficiency for organic micropollutant elimination. Environ. Sci. Technol. 2012, 46, 1536–1545. [Google Scholar] [CrossRef]
  52. Onesios, K.; Yu, J.; Bouwer, E. Biodegradation and removal of pharmaceuticals and personal care products in treatment systems: A review. Biodegradation 2009, 20, 441–466. [Google Scholar] [CrossRef]
  53. Metcalfe, C.D.; Chu, S.; Judt, C.; Li, H.; Oakes, K.D.; Servos, M.R.; Andrews, D.M. Antidepressants and their metabolites in municipal wastewater, and downstream exposure in an urban watershed. Environ. Toxicol. Chem. 2010, 29, 79–89. [Google Scholar] [CrossRef]
  54. Shi, Q.; Chen, Z.; Yan, H.; Xu, M.; Cao, K.F.; Mao, Y.; Chen, X.; Hu, H.Y. Identification of significant live bacterial community shifts in different reclaimed waters during ozone and chlorine disinfection. Sci. Total Environ. 2023, 896, 165199. [Google Scholar] [CrossRef]
  55. Can, W.; Yao-Kun, W.; Qing, Z.; Min, J. Treatment of secondary effluent using a three-dimensional electrode system: COD removal, biotoxicity assessment, and disinfection effects. Chem. Eng. J. 2014, 243, 1–6. [Google Scholar] [CrossRef]
  56. Rathinavelu, S.; Divyapriya, G.; Joseph, A.; Nambi, I.M.; Muthukrishnan, A.B.; Jayaraman, G. Inactivation behavior and intracellular changes in Escherichia coli during electro-oxidation process using Ti/Sb–SnO2/PbO2 anode: Elucidation of the disinfection mechanism. Environ. Res. 2022, 210, 112749. [Google Scholar] [CrossRef] [PubMed]
  57. Fan, H.; Qi, L.; Liu, G.; Zhang, Y.; Fan, Q.; Wang, H. Aeration optimization through operation at low dissolved oxygen concentrations: Evaluation of oxygen mass transfer dynamics in different activated sludge systems. J. Environ. Sci. 2017, 55, 224–235. [Google Scholar] [CrossRef] [PubMed]
Figure 1. Set-up for EO and O3 experiments. Each of the numbers in the picture corresponds to the equipment described in the diagram and indicated by the same number in the text.
Water 15 03180 g001
Figure 2. The MBBR used for the biological treatment of the hospital wastewater (1: feeding tank; 2: activated sludge biological reactor; 3: decanter).
Water 15 03180 g002
Figure 3. Average concentrations ([C]) of the 28 drugs selected for this study detected at the inlet (blue bar) and outlet (red bar) of HWWTP.
Water 15 03180 g003
Figure 4. Experimental design followed.
Water 15 03180 g004
Figure 5. The degradation of CBZ during EO treatment applying 10 V voltage (4 mA cm−2) for 120 min, fixing the BDD anode, and using Pt/Ti (solid line) and stainless steel (dash/dot line) as cathodes. Values are normalised with respect to the initial concentration.
Water 15 03180 g005
Figure 6. The degradation of CBZ (solid circle symbol) during EO treatment with a maximum tR = 120 min with a BDD anode and Pt/Ti cathode, varying the applied voltage (10 V, 20 V, and 40 V, corresponding to a current density of 4, 13, and 35 mA cm−2, respectively). Values are normalised with respect to the initial concentration.
Water 15 03180 g006
Figure 7. The degradation of CBZ (solid circle symbol) by EO treatment under optimal operational conditions in terms of CBZ removal (BDD anode, Pt cathode, 40 V), varying the electrolyte between Na2SO4 (dot line), MgSO4 (slash dot line), and KSO4 (slash line) and tap water (solid line). Values are normalised with respect to the initial concentration.
Water 15 03180 g007
Figure 8. The degradation of CBZ (solid circle symbol), LZP (solid triangle symbol), KTP (solid rhombus symbol), and E-CBZ (solid square symbol) obtained by EO treatment under the optimal operational conditions for CBZ removal (BDD anode, Pt/Ti cathode, 40 V = 35 mA cm−2). To degrade E-CBZ, the voltage was increased to 75 V (dash dot line). Values are normalised with respect to the initial concentration.
Water 15 03180 g008
Figure 9. The degradation of CBZ (solid circle symbol), KTP (solid rhombus symbol), LZP (solid triangle symbol), and E-CBZ (solid square symbol), in a mixture (1 mg L−1 each for a total of 4 mg L−1), by EO treatment under the operational conditions (BDD anode, Pt/Ti cathode, 75 V = 68 mA cm−2) that allowed the removal of E-CBZ (the compound that resulted in being more difficult to degrade). The decrease of TOC (empty circle symbol) is also shown. Values are normalised with respect to initial concentration.
Water 15 03180 g009
Figure 10. The degradation of CBZ by O3, fixing air as feed and changing QR between 0.5 L min−1 (dash line) and 3 L min−1 (dash dot line) and fixing O2 as feed and varying QR between 3 L min−1 (full line) and 1.5 L min−1 (dot line). All values are normalised with respect to the initial concentration.
Water 15 03180 g010
Figure 11. The degradation of LZP (solid triangle symbol), KTP (solid rhombus symbol), and E-CBZ (solid square symbol) separately (1 mg L−1 each) by O3 treatment using O2 as feed and a QR of 1.5 (dot line) and 3 L min−1 (solid line). The values represented are values normalised to the initial concentration.
Water 15 03180 g011
Figure 12. The degradation of CBZ (solid circle symbol), LZP (solid triangle symbol), KTP (solid rhombus symbol), and E-CBZ (solid square symbol) in a mixture (1 mg L−1 each for a total of 4 mg L−1) and TOC decrease (empty circle symbol) by O3 treatment using O2 as feed and QR = 3 L min−1. The values represented are normalised with respect to the initial concentrations.
Water 15 03180 g012
Figure 13. The degradation of (a) CBZ (solid circle symbol), (b) LZP (solid triangle symbol), (c) KTP (solid rhombus symbol), (d) E-CBZ (solid square symbol), and (e) TOC for the pharmaceuticals treated in mixture for 120 min by EO (dash dot line), O3 (dash line), EO-O3 (dot line), O3-EO (large slash line), and EO+O3 (full line), under previously determined optimal conditions (EO: BDD anode, Pt cathode, 75 V; O3 = QR = 3 L min−1, O2 as feed). All values are normalised with respect to the initial concentration.
Water 15 03180 g013aWater 15 03180 g013bWater 15 03180 g013c
Figure 14. (a) MBBR inlet and outlet concentrations and (b) percentage removal for each of the 19 drugs detected in the real hospital wastewater. The results in Figure 14a are presented in logarithmic scale to improve the visualization of the very low concentrations.
Water 15 03180 g014
Figure 15. HWWTP percentage removal for each of the 19 drugs detected in the real hospital wastewater, calculated starting from the recorded inlet and outlet concentrations shown in Figure 3.
Water 15 03180 g015
Figure 16. (a) Concentrations of the nine drugs that were not eliminated by MBBR, before (t0), after 60 min (t60) and 120 min (t120) of treatment via the optimised AOP (EO+O3, BDD anode, Pt cathode, 75 V, O2 as O3 source, and QR = 3 L min−1). It must be noted that, from the 28 compounds analysed, only 11 were detected in the wastewater; (b) percentage removal after 120 min of the optimised AOP of the nine drugs that were not eliminated by MBBR.
Water 15 03180 g016aWater 15 03180 g016b
Table 1. Physicochemical and microbiological characterisations of the studied wastewaters, along with discharge limits.
Parameter Analytical Method HWWTP Discharge Limit *
(Units) InletOutlet
pH Potentiometry6.96 ± 0.076.96 ± 0.095.5–9
TSS
(mg L−1)
UNE-EN 872:2005216.22 ± 82.4814.17 ± 3.6325
BOD5
(mg O2 L−1)
SM 5210 B (APHA 1992)275.95 ± 106.24<306
COD
(mg O2 L−1)
UNE 77004:2002643.67 ± 196.6945.1 ± 17.64 ***30
BOD5/COD 0.43 -
Turbidity
(NTU)
UNE-EN ISO 7027:2001190.12 ± 67.057.88 ± 3.69-
TOC
(mg C L−1)
UNE-EN 1484:199854.12 ± 12.111.89 ± 2.5-
EC
(µS cm−1)
Conductometry1107.06 ± 43.88761.56 ± 54.741000
Chlorides
(mg Cl L−1)
IC150.63 ± 2.28131.89 ± 18.09200
Sulphates
(mg SO4−2 L−1)
IC33.79 ± 10.3737.98 ± 8.87250
Phosphates
(mg PO4−3 L−1)
IC9.83 ± 3.345.58 ± 3.84 ***0.7
Total phosphorus
(mg P L−1)
ICP-MS6.4–103.6–10 ***0.4
N-Nitrate
(mg N-NO3 L−1)
IC<0.110.84 ± 10.5350
N-Nitrite
(mg N-NO2 L−1)
IC0.01 ± 0.010.03 ± 0.020.03
Total Iron
(mg Fe L−1)
ICP-MS1.25 ± 0.80.21 ± 0.0222
Fluorides
(mg F L−1)
IC<0.1<0.1NCA-MA **
* Royal Decree 849/1986 (https://www.boe.es/buscar/act.php?id=BOE-A-1986-10638, accessed on 19 May 2023); ** environmental quality standard expressed as annual average concentration for inland surface waters; *** values that exceed the discharge limit are highlighted in bold.
Table 2. Elemental analysis of the inlet and outlet of the studied wastewaters, along with discharge limits.
Elemental AnalysisHWWTP
(Units)InfluentEffluentDischarge Limit *
B
(mg L−1)
<1<12
Al
(mg L−1)
1.3 ± 1.081.09 ± 1.09 **1
P
(mg L−1)
<10<1010
Cr IV
(mg L−1)
<0.02<0.020.2
Mn
(mg L−1)
0.03 ± 0.0170.02 ± 0.0071
Fe
(mg L−1)
1.25 ± 0.80.21 ± 0.022
Ni
(mg L−1)
<0.01<0.012
Cu
(mg L−1)
<0.05<0.050.2
Zn
(mg L−1)
<0.050.3 ± 0.33
As
(mg L−1)
<0.5<0.50.5
Se
(mg L−1)
<0.3<0.30.03
Cd
(mg L−1)
<0.05<0.050.1
Sn
(mg L−1)
<0.02<0.0210
Ba
(mg L−1)
0.02 ± 0.020.15 ± 0.111
Hg
(mg L−1)
<0.01<0.010.05
Pb
(mg L−1)
<0.1<0.10.2
* Royal Decree 849/1986 (https://www.boe.es/buscar/act.php?id=BOE-A-1986-10638, accessed on 19 May 2023); ** values that exceed the discharge limit are highlighted in bold.
Table 3. Set of assays performed for EO optimisation.
EO Optimisation
AnodeCathodeVoltage Recirculation Flowrate [C0] ContaminantTtRDVtElectrolyte
ID EXP. (V)(L min−1)(mg L−1) °CMinmmL
Effect of the cathode (model contaminant: CBZ)
E1BDDStainless steel1011CBZ2512061//
E2BDDPt1011CBZ2512061
Effect of voltage (model contaminant: CBZ)
E3BDDoptimal1011CBZ2512061//
E4BDDoptimal2011CBZ2512061//
E5BDDoptimal4011CBZ2512061//
Validation of the operational conditions for the removal of selected pharmaceuticals
E6BDDoptimaloptimal11LZP2512061//
E7BDDoptimaloptimal11KTP2512061//
E8BDDoptimaloptimal11E-CBZ2512061//
E9BDDoptimaloptimal11 each MIXTURE 2512061//
Effect of electrolytes
E10BDDoptimaloptimal11CBZ2512061MgSO4
E11BDDoptimaloptimal11LZP2512061Na2SO4
E12BDDoptimaloptimal11LZP2512061K2SO4
Table 4. Set of assays performed for O3 optimisation.
O3 Optimisation
Feed SourceGas PressureQR QA O3 Production Rate Recirculation Flowrate [C0]Contaminant TtRVt
ID EXP (Bar)(L min−1)(L min−1)(g h−1)(L min−1)(mg L−1) °CMinL
E13AIR0.5–10.5→32501CBZ251201
E14O20.5–132501CBZ251201
E15O20.5–11.52501CBZ251201
E16O20.5–11.52501LZP251201
E17O20.5–11.5→32501E-CBZ251201
E18O20.5–132501KTP251201
E19O20.5–132501 eachMIXTURE251201
Table 5. Chromatographic methods used to detect anions of interest.
Parameter
Column and pre-column Thermo Scientific™ Dionex™ IonPac™ AG11 and AS11
Flow1 mL min−1
Injection volume25 µL
Mobile phase and gradientA. Ultrapure water/B. NaOH 100 mM
0–15 min: 90% A and 10% B
5–35 min: Gradient 10% B to 50% B
DetectionConductimetric detector
Disclaimer/Publisher’s Note: The statements, opinions and data contained in all publications are solely those of the individual author(s) and contributor(s) and not of MDPI and/or the editor(s). MDPI and/or the editor(s) disclaim responsibility for any injury to people or property resulting from any ideas, methods, instructions or products referred to in the content.

