Abstract
The objective of this study was to model the operation of a vertical-flow constructed wetland (VF-CW) for domestic wastewater, using Monte-Carlo simulations and selected probability distributions of various random variables. The analysis was based on collected wastewater quality data, including the values of the pollutant indicators BOD5 (biochemical oxygen demand), CODCr (chemical oxygen demand), and TSS (total suspended solids), in the 2017–2020 period. Anderson–Darling (A–D) statistics were applied to assess the fit of the theoretical distributions to the empirical distributions of the random variables under study. The selection of the best-fitting statistical distributions was determined using the percentage deviation (PBIAS) criterion. Based on the analyses that were performed, the best-fitting statistical distributions for the pollution indicators of the raw wastewater were the generalised extreme value distribution for BOD5, the Gaussian distribution for CODCr, and the log-normal distribution for TSS. For treated effluent, the log-normal distribution was the best fit for BOD5 and CODCr; the semi-normal distribution, for TSS. The new data generated using the Monte-Carlo method allowed the reliability of the VF-CW operation to be assessed by determining the reliability indices, i.e., the average efficiency of the removal of pollutants (η), the technological efficiency index (R), the reliability index (CR), and the risk index of the negative control of the sewage treatment plant operation (Re). The obtained results indicate that only in the case of CODCr, the analysed treatment facility may fail to meet the requirements related to the reduction of organic pollutants to the required level, which is evidenced by the values of the indicators CR = 1.10, R = 0.49, and η = 0.82. In addition, the risk index of the negative operation of the facility (Re) assumes a value of 1, which indicates that during the period of its operation, the VF-CW system will not operate with the required efficiency in relation to this indicator. The novelty of this work is the implementation of the indicated mathematical simulation methods for analysing the reliability of the operation of the domestic wastewater treatment facility.
1. Introduction
Domestic treatment facilities have been increasingly used in recent years in non-urbanised areas, where the construction and development of sewerage networks is not possible or is economically infeasible [1,2,3,4,5,6]. According to Statistics Poland (GUS) (2020) [7], a total of 74.8% of the population in Poland uses wastewater treatment plants, of which 45.2% are in non-urbanised areas. The number of domestic sewage disposal systems totals 2,427,800, 87.8% of which are septic tanks, and 12.2% are domestic treatment facilities. A very important aspect of the operation of domestic treatment facilities is the regular checking of the quality of sewage flowing from the plant. The operation of domestic treatment facilities differs significantly from that recommended for large-scale plants. One of the main problems with domestic treatment facilities is the high irregularity of the sewage flow and its variable composition. Therefore, a system should be selected to ensure that the required environmental effect is achieved. In addition, the system should feature low maintenance requirements and operating costs [8]. Moreover, the influences of user-dependent and non-user-dependent factors should be taken into account, as those directly affect the performance of domestic treatment facilities. One such factor is the temperatures of the air and wastewater, which fundamentally affect the biological processes in the system. As shown in a study by Martin et al. (2007) [9] on the assessment of the efficiency of domestic wastewater treatment in small treatment systems, most of the analysed facilities exceeded the discharge limit values. Thus, especially in countries where climatic conditions show a large fluctuation in the air temperature throughout the year, the selected solutions should ensure reliable operation with a simultaneous high efficiency for pollution decomposition [10].
Constructed wetland (CW) systems are one of the increasingly popular solutions for treating small quantities of wastewater. They have simple designs, low operating costs, and aesthetic appearances. Compared with other solutions, CW systems show a fairly high efficiency for pollutant removal [11]. Pollutant breakdown in CW systems is based on natural processes, including vegetation, soil, and microorganism activities [12]. These systems are also currently used to treat industrial and mining wastewater, rainwater, agricultural waste, and leachate from landfills [13]. Commonly used aquatic macrophytes, e.g., Phragmites australis, Eichhornia crassipes, Typha domingensis, Panicum elephantipes, Scirpus americanus, Myriophyllum spicatum, and Typha latifolia, can assimilate pollutants in their tissues, while an extensive root and rhizome system facilitates the uptake of pollutants, along with heavy metals (copper, lead, cobalt, zinc, cadmium, and chromium); nutrients; organic matters; and micropollutants [14]. The rate of remediation in CW systems depends on the processes of sedimentation, flocculation, precipitation, complexation, redox potential, ion exchange, and phytoremediation [15]. Also, factors, such as the pH, composition of raw wastewater, retention time, and activity of microorganisms, directly affect their treatment processes [16]. The use of a suitable bed fill that simultaneously provides a substrate for plant growth, along with development and physical processes, is an important issue in treatment processes. Sand and fine gravel—which are inexpensive and have good permeability and porosity—are the most common aggregates used to fill CW beds [17]. As recent studies have shown, the use of other porous materials (e.g., zeolite, clay shale, or sediments) allows for higher removal efficiencies for organic pollutants and ammonium-based nitrogen than those in the case of conventionally filled beds [18,19]. All these factors affect the efficiency and reliability of pollutant removal in CW systems. For this reason, it is necessary to systematically monitor the quality of the effluent flowing from the treatment plant, as it is the primary tool to evaluate the performance of the system. One commonly used method for assessing the performance of domestic wastewater treatment facilities is the determination of reliability indicators [20]. This involves comparing the pollutant values at the outfall with the permissible values set out in relevant regulations. The obtained results are meaningful for facility operators and represent the current state of the functioning of the system. However, this approach is very simplified, as it is based on an empirical sample of analysed random variables. In the case of a wastewater treatment facility, the reliability of operation is defined as the percentage of time during which the required pollutant concentration of the treated wastewater is compliant with standards [21]. The variability in the values of pollutant indicators for wastewater should be considered as a probability function that determines numerous physical and chemical characteristics of wastewater and, thus, makes it possible to perform mathematical simulations to assess wastewater treatment facilities’ performance in a manner that is more meaningful than in the case of a series of short-term observations of the analysed pollutant indicators. Currently used mathematical methods for assessing the operational reliability of sewage treatment systems consist of simulating the values of pollutants in treated sewage for an adopted probability distribution, e.g., Weibull distribution or normal distribution [22,23,24,25]. The use of a specific form of probability distribution is a simplified method, as the magnitudes of pollution indicators for wastewater are indeterminate, so they can usually be described by more than one probability distribution. Based on this premise, the best-fit function should be selected from a group of probability distributions.
This study uses the Monte-Carlo method, which is a numerical technique used to estimate mathematical values, especially for problems that are difficult to solve by analytical methods. The principle of this method is to generate random samples of data used to approximate the solution of the problem. This method is applicable to short data sequences for which the probability distribution is known. It allows the number of data to be extended (generated); thus, a reliable assessment of the performance of the analysed wastewater treatment system can be made. However, there are certain limitations to be taken into account, including the randomness, accuracy of the method, uniformity, difficulty in modelling, dimensionality, and sampling uniformity. The randomness in the Monte-Carlo method is a result of the random number generator that is used, which means that the results will always be subject to a degree of uncertainty associated with randomness. Simulation results may vary with different runs, which can be a problem for some applications for which full determinism is required. The accuracy of the Monte-Carlo method depends on the number of samples that are generated: the more samples, the more accurate the approximation of the value is. In some cases, obtaining a stable and accurate result involves generating a very large number of samples, which can be time-consuming and computationally expensive. The uniformity of the sampling is very important for obtaining accurate results. Difficulty in modelling can arise from complex processes or systems that require the creation of complex models. This can lead to longer calculation times and can increase the computing power demand. The dimensionality in this method can result in a significant increase in time because as the number of variables or dimensions increases, the number of samples that will be needed to obtain accurate results increases exponentially. Despite these limitations, the Monte-Carlo method is a very useful tool for numerical analysis and is very widely used in many areas of science, engineering, and finance. With the right approach to these limitations, the Monte-Carlo method can be an effective tool for solving various numerical problems [26,27].
Therefore, in this work, we created a model that simulates the reliability of the operation of a vertical-flow constructed wetland (VF-CW) using selected probability distributions. This will make it possible to determine the values of the operational reliability indicators for the treatment facility based on not only the scale of the empirical sample itself but also predicted values that reflect the impact of independent factors on the operation of the plant. There are two main aspects of this study: to determine the best-fit probability distribution functions and, based on selected probability distributions, simulate the values of pollutant indicators for raw and treated wastewater using the Monte-Carlo method. Based on the generated data series, the operational reliability of the wastewater treatment system was determined.
Currently, household wastewater treatment plants in Poland are not controlled by local government employees. Therefore, the owners of such facilities do not regularly analyse the quality of the sewage discharged into the environment. The data presented in this Article are a very valuable source of information, allowing for the assessment of the operation of VF-CWs in the period 2017–2020, in terms of the removal of three basic pollutants. An innovation of this study is that it points to the implementation of such a model for analyses related to the reduction of pollutants in raw and treated wastewater in a domestic VF-CW system. To date, this type of model to simulate the efficiency of the facility has only been developed for collective treatment plants to the best of our knowledge.
2. Materials and Methods
The analysis was carried out based on the available data, including the values of the following pollution indicators in the 2017–2020 period for treated sewage (42 samples): biochemical oxygen demand (BOD5), chemical oxygen demand (CODCr), and total suspended solids (TSS). Raw sewage samples were taken from a septic tank, and treated sewage samples were taken at the inlet to an absorption well. Sampling and transport were carried out in accordance with Polish Standards [28,29]. BOD5 was measured using the dilution method and a WTW OxiTop 538 portable meter PN-EN1899-1:2002 [30]. CODCr was determined using a miniaturised method and sealed tubes in accordance with PN-ISO 15705:2005 [31]. The total suspended solids were determined using the weighing method in accordance with PN-EN 872:2002 [32]. The analysis consisted of the following stages: preliminary data analysis, selection of the theoretical function, best-fit empirical distribution, modelling the values of the pollution indicators for sewage, and determining the values of the reliability coefficients for the treatment plant based on the simulation results. Figure 1 illustrates the methodology employed in this study. Based on the current legal standards in Poland [33,34], the following values of analysed pollutant indicators are mandatory for wastewater treatment plants serving up to 2000 Population Equivalents (PEs): BOD5—40 mgO2·dm−3; CODCr—150 mgO2·dm−3; TSS—50 mg·dm−3. By law, only two samples may not meet these requirements.
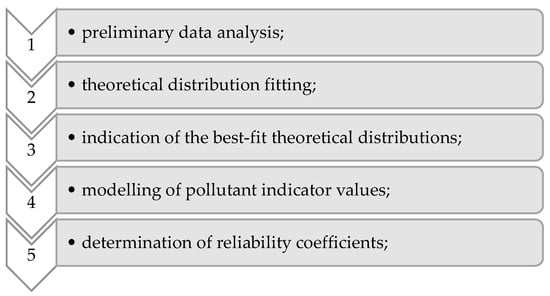
Figure 1.
The flowchart of the methodology used in this study.
2.1. Description of Study Object
The object of this study (VF-CW) is in the village of Gawłówek, Poland (Figure 2). It was established in 2013 for the treatment of regular domestic wastewater (kitchen, toilet, washing machine, and shower). The facility consists of two sedimentation chambers and a tank with an active volume of 2 m3 connected to a single vertical flow bed (VF-CW). The dimensions of the deposit are 1.0 m deep × 12 m2 surface area × 1% slope. The projected capacity of the treatment plant is 0.4 m3∙d−1. The hydraulic load of the VF beds is approximately 0.033 m3∙m2∙d−1. To protect the environment from contamination, a 1 mm thick, high-density polyethylene lining was used to seal the bed. The bed was filled with medium sand with a top layer of humus, in which Glyceria maxima was planted. Treated wastewater from the bed was directed to the dry well with a working capacity of 1.9 m3. The main task of the dry well is to discharge sewage into the ground after pre-treatment in the filtration layer. An overview of the study object is shown in Figure 3.
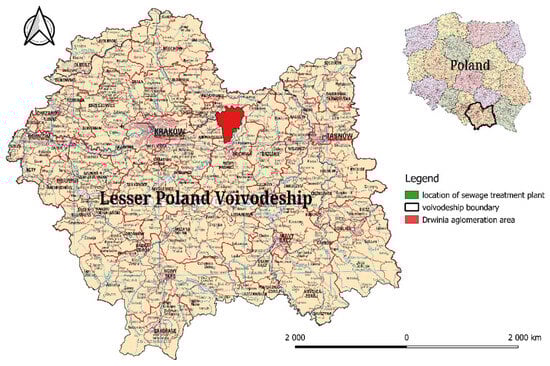
Figure 2.
The location of Gawłówek village against the background of the Lesser Poland Voivodeship in Poland.
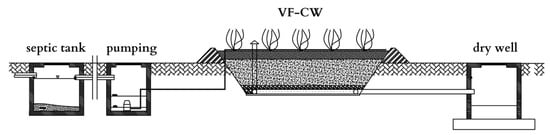
Figure 3.
Schematic of the VF-CW.
2.2. Preliminary Data Analysis
The preliminary data analysis of the pollution concentration indicators for the raw and treated sewage included the calculation of basic descriptive statistics, such as minimum (min) and maximum (max) values, mean (mean) values, and median (median) values, and measures of dispersion, including the standard deviation (s) and coefficient of variation (Cs).
2.3. Theoretical Distribution Fitting
Probability distribution fitting is the process of finding the probability distribution that best describes a set of random data/variables. The purpose for fitting distributions is to make probability predictions or to predict the frequency of parameters in specific functions. Fitting an appropriate statistical distribution to the data is an important step in statistical analysis. The concept of this study, based on the concentration of pollutants in raw and treated sewage, was to determine the theoretical distributions best suited to the empirical distributions for the random variables that were tested. The following theoretical distributions were analysed: Weibull distribution, Johnson SB, General Extreme Values (GEV), Half-normal distribution, Log-normal distribution, Pareto distribution, Gaussian Mixture Model (GMM), Normal distribution, Triangular distribution, and Rayleigh distribution. The distributions of the individual distributions, f(x), are described by the following functions [35,36,37,38,39,40,41]:
Weibull distribution
where κ—shape parameter; α—scale parameter.
Johnson SB distribution
where x—variable; κ shape parameters; α—scale parameter; —location parameter.
General Extreme Values (GEV) distribution
where κ—shape parameter; α—scale parameter; ξ—location parameter.
Half-normal distribution
where σ—variance value.
Log-normal distribution
Pareto distribution
where κ—shape parameter.
Gaussian Mixture Model (GMM) distribution
where T—number of components; —weights such that ; —multi-variate Gaussian distribution.
Normal distribution
where σ2—variance value; μ—mean value.
Triangular distribution
where a—lower limit; b—upper limit; m—mode.
Rayleigh distribution
where α—scale parameter.
The Anderson–Darling (A–D) test was used to assess the compatibility of the theoretical distributions with the empirical distributions of the pollutant indicators. It is characterised by statistics that are sensitive over the entire range of distributions, but it also allows for a higher probability for finding differences between distributions. This makes it a better estimate of compliance than other tests. The hypotheses for the Anderson–Darling test are as follows: H0 data follow a specified distribution, and H1 data do not follow a specified distribution. The A–D statistics are described by the following correlations [42,43,44]:
The hypothesis was verified based on the p value of the test; it was assumed that if the p value was less than α = 0.05, the null hypothesis that the data come from this distribution was to be rejected.
2.4. Indication of the Best-Fit Theoretical Distributions
When random variables were described by more than one theoretical distribution, the fits of the theoretical and empirical distributions were assessed using the percentage bias (PBIAS) criterion as follows [45]:
The percentage bias (PBIAS) defines the average tendency of the estimated values to be greater or less than the observed values. Accordingly, it was assumed that the closer the PBIAS value is to 0%, the greater the agreement between the compared values. Positive values indicate the model’s underestimation, and negative values indicate its overestimation [46,47,48]. The PBIAS fit scales described by Archibald et al. [49], Donigian et al. [50], Moriasi et al. [47], Singh et al. [51], and Van Liew et al. [52] indicate that −10% < PBIAS < +10% means a very good fit, ±10% ≤ PBIAS < ±15% means a good fit, ±15% ≤ PBIAS < ±25% means a satisfactory fit, and PBIAS ≥ ±25% means an unsatisfactory fit.
2.5. Modelling of Pollutant Indicator Values
The modelling of the pollutant indicator values for the raw and treated wastewater was carried out using the Monte-Carlo method. This method is defined as the use of a sequence of random numbers to build a sample from a hypothetical population from which the statistical estimators of the parameters for the problem to be solved can be determined [53]. In the works of Schauberger et al. [54], Hendren et al. [55], and Barton et al. [56], the Monte-Carlo method was described as a tool for analysing the operations of water and wastewater management facilities. In practice, it consists of creating a stochastic model describing a real phenomenon and then re-implementing this model using randomly generated variables and statistically analysing the obtained results. In this study, the Monte-Carlo method was used as a tool for assessing the reliability of pollutant removal at the specified wastewater treatment facility. For this purpose, simulations were performed for finding the theoretical distributions that best fit the empirical distributions of the analysed pollution indicators (BOD5, CODCr, and TSS). The new data generated in this way were subjected to statistical analysis. The procedure of this method is based on the generation of 365 random values of the pollution indicators. Each series of simulations was repeated 100 times. From each generated set, a 24 element data set was randomly determined. In each series, the number of simulation observations that did not meet the technological efficiency condition, i.e., whether the simulated values were greater than the acceptable levels, was determined. The control performance score of the WWTP was determined as follows: control indicator (CF) = 1 in the case of a negative assessment result, i.e., if the number of non-compliant samples exceeded the maximum number of these samples; otherwise, CF = 0.
2.6. Determination of Reliability Coefficients for the Operation of the CW System
In the next stage, the values of the following operation reliability indices for the sewage treatment facility were estimated based on the simulation: the technological efficiency index (R), the reliability index (CR), the risk index of the negative control of the sewage treatment plant operation (Re), and the reduction coefficient (η). The values of the indicators were determined from the following formulae [57,58]:
where Nsym—number of simulations that were carried out; NXperm—number of samples from simulations not meeting the limit values for the analysed pollutant indicator.
where —the average value of a given indicator for the simulations that were carried out; —the limit value of the concerned indicator.
where —the sum of the results of the plant operation checks for the simulations that were carried out; Nsym—number of simulations that were carried out.
where Cout—the indicator of the average concentration of pollution in the sewage outflowing from the bed (mg·dm–3); Cin—the indicator of the average concentration of pollution in the sewage flowing into the bed (mg·dm–3).
3. Results and Discussion
3.1. Preliminary Analysis
The first step in the analysis of the results was to determine the descriptive statistics for the observational series of analysed indicators from the organic group (BOD5 and CODCr) and the total suspended solids (TSS) in raw and treated wastewater. Table 1 reports the results of the analysis, and Figure 4 shows the changes in the values of the analysed indicators for the inflow and outflow of sewage in relation to the permissible values.

Table 1.
Results of preliminary data analysis for pollutant indicators BOD5, CODCr, and TSS for inflow and outflow of sewage.

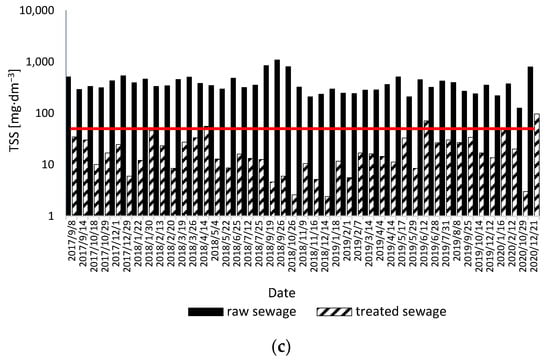
Figure 4.
The values of the pollutant indicators for raw and treated sewage and corresponding permissible levels (a) BOD5; (b) CODCr; (c) TSS.
The conclusion that can be drawn from the analysis of the results summarised in Table 1 and Figure 4 is that the differences between the extreme values for BOD5, CODCr, and TSS in raw sewage were 89%, 58%, and 88%, respectively. In Gawłówek, the composition of the raw sewage discharged from households is typical of that of domestic sewage in southern Poland, as indicated by the results of a study by Kaczor [59]. Additionally, taking into account the values of the coefficient of variation (Cs) for the observational series of indicators of pollution in sewage, the changes in their values were high (BOD5 and TSS) or average (CODCr). The size variability of the indicators is a typical feature for domestic wastewater and has been noted and confirmed in the works of other authors, including Jóźwiakowksi et al. [60], Jucherski et al. [61], and Zhang et al. [62]. For the treated sewage, the difference between the extreme values of the BOD5 indicator was 98%, with an average value of 13.3 mgO2·dm−3. In the study period, this indicator exceeded the permissible value (40 mgO2·dm−3) once. For CODCr, the difference between the extreme values was 63%, and the average value was 162 mgO2·dm−3. Moreover, 21 observations exceeding the permissible value of 150 mgO2·dm−3 were recorded in the analysis period. The last analysed indicator was TSS, for which the difference between the extreme values was 98%, with an average value of 21.5 mg∙dm−3. In the sampling period, three samples did not meet the requirements in relation to the permissible values of the total suspended solids (TSS) in the outflow (40 mg∙dm−3). A comparison of the mean and median values obtained for the analysed pollution indicators for the raw and treated wastewater suggests that the obtained values are similar. This is because the analysed data series is homogeneous and has no extremes. The exceedance of the permissible values could be determined by important factors affecting the effectiveness of the wastewater treatment, e.g., the volume of the wastewater inflow, the temperature of the wastewater, or the pollutant load in the wastewater flowing into the treatment facility. As reported by Wałęga et al. [63], the quality of wastewater is strongly determined by the characteristics of the farm where the wastewater is generated. Higher concentrations of pollutants in the effluent flowing into the treatment plant may be due to the sparing use of water by residents. Uneven trends in water consumption by inhabitants in households can cause large fluctuations in drains, which can expose systems to unstable operation. The temperature and plant density are the factors that clearly correlate with the pollution removal effect of CW systems. Temperatures above 20 °C are conducive to the multiplication and growth of microorganisms and ensure high microbial activity and a strong ability to absorb and decompose organic matter, which ultimately allows densely grown plants to absorb increasing volumes of organic compounds from wastewater. In addition, plants with a highly developed root system can strongly absorb organic matter [62,64]. The analyses of the pollutant values of the treated wastewater show that higher concentrations were recorded in the autumn–winter and winter–spring periods, when the temperature decreased. The efficiency for removing contaminants will, thus, drop sharply owing to low temperatures, where plants go into a dormant phase and most microbial activity slowly decreases [65,66].
3.2. Fitting the Theoretical Distributions
The fit of the theoretical distributions to the empirical distributions of the observational series of analysed pollution indicators for the wastewater inflow and outflow was determined using the functions presented in Section 2.3. The fit of the tested distributions was assessed using the Anderson–Darling test (A–D) for a significance level of 0.05. When the obtained p-value was below α = 0.05, the theoretical functions did not match the empirical functions for the analysed indicator measurement series. The results of the analysis are presented in Table 2.
Table 2.
Results for fitting theoretical distributions to empirical distributions of random variables.
From the results of the analysis for fitting the theoretical distribution to the empirical one, the following distributions cannot be applied in the case of indicators from the organic group (BOD5 and CODCr) and total suspended solids in raw sewage: Halfnormal, Pareto, Triangular, and Rayleigh. In the case of the treated wastewater, the results of the A–D test for the observational series showed that the p-values were below 5% for the Triangular and Rayleigh distributions for the indicators from the organic group (BOD5 and CODCr) and for the Half-normal and Pareto distributions in the case of the CODCr indicator. Therefore, the H0 hypothesis—stating that the analysed theoretical distribution is consistent with the empirical distribution—should be rejected in this case. In the case of the total suspended solids, the analysis of the fit of the theoretical distribution to the empirical distribution showed a lack of consistency in this indicator for the Triangular and Rayleigh functions (p < 0.05). The analysis for fitting the theoretical distribution to the empirical one showed that the Triangular distribution could not be used to describe any of the observational series of the analysed pollution indicators (Table 2). The inapplicability of this distribution is due to the homogeneous nature of this function. As Stain and Keblis [67], Pereira et al. [68], and Młyński et al. [69] have stated in their studies, the Triangular distribution is described by the parameters of the upper and lower limits, i.e., the most probable maximum and minimum values, respectively. In the case of wastewater, the values of the individual quality parameters depend on many factors that vary over time. Thus, the prediction of the most likely minimum and maximum values for a Triangular distribution is problematic. In practice, only a few types of random variables can be described by this distribution.
3.3. Indication of the Best-Fit Probability Distribution
The analysis of the fit of the theoretical and empirical distributions (Section 3.2) showed that the observational series of pollutant indicators from the organic group and the total suspended solids in the raw and treated sewage can be described by more than one theoretical distribution. The best-fit distribution was selected based on the PBIAS criterion (described in Section 2.4) and the quantile–quantile fit graph. The results of the analysis are presented in Table 3 and Figure 5 and Figure 6, and the best-fit statistical distributions are shown for the random variables for the raw and treated wastewater.
Table 3.
Results of percentage bias analysis for tested indicators of pollution.
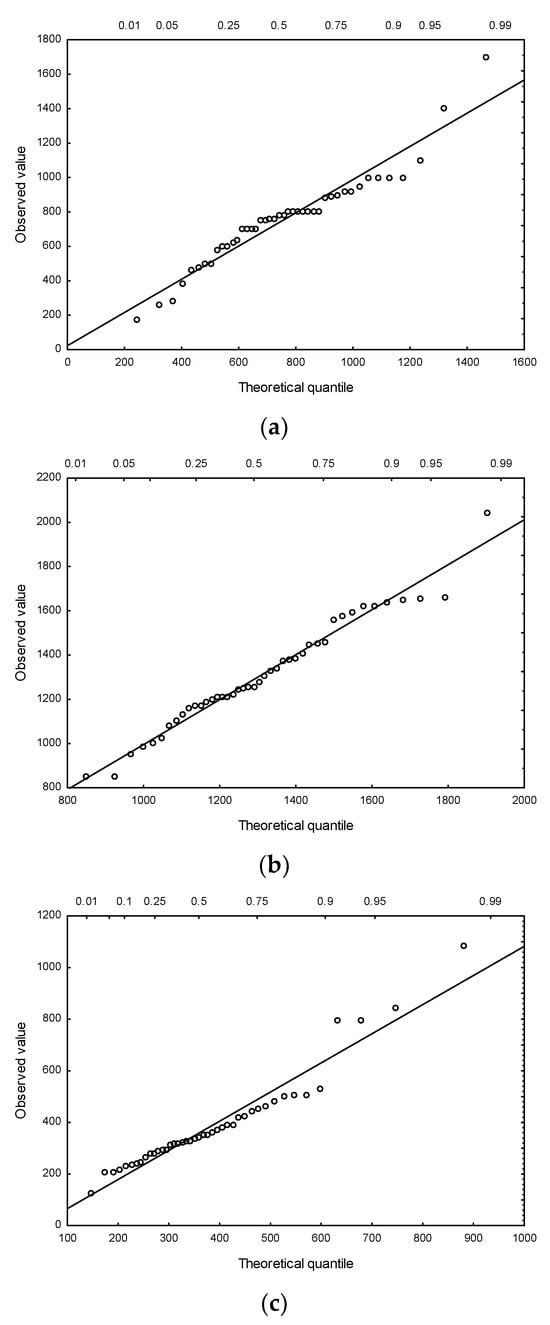
Figure 5.
Q–Q plots of best-fit theoretical distributions of the random-variable distributions for indicators for raw sewage (a) BOD5 (GEV distribution); (b) CODCr (Gaussian distribution); (c) TSS (Log-normal distribution).
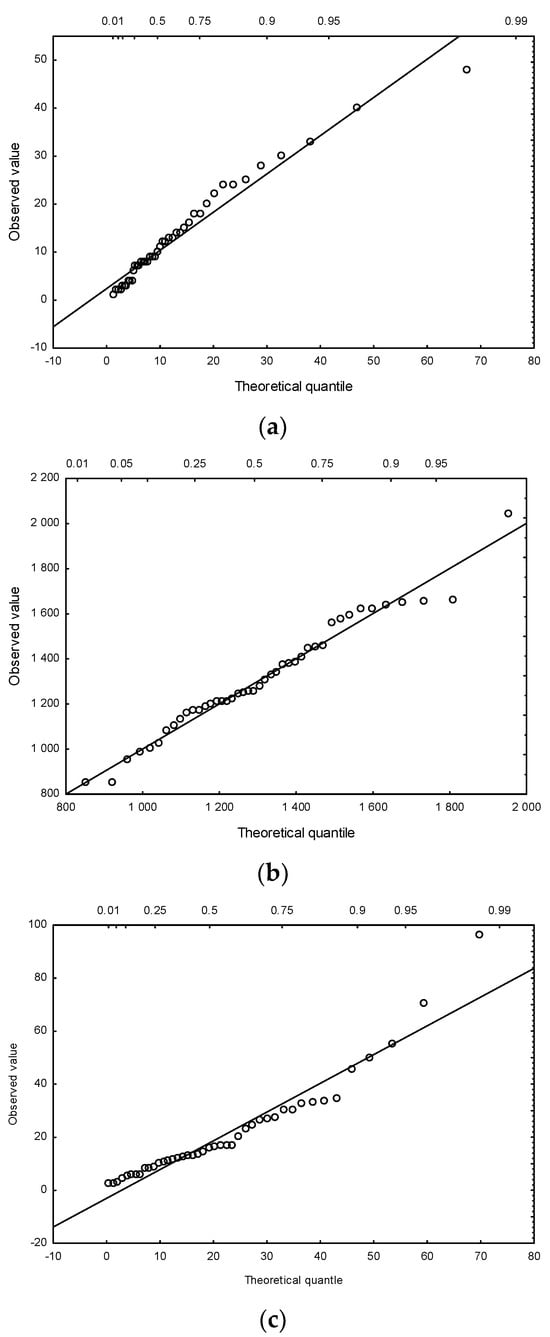
Figure 6.
Q–Q plot of best-fit statistical distributions of indicators for treated wastewater (a) BOD5 (Log-normal distribution); (b) CODCr (Log-normal distribution); (c) TSS (Half-normal distribution).
The results of the empirical-to-theoretical distribution fitting analysis of the observational series for the raw wastewater, as presented in Table 3 and Figure 5, suggest that the best-fitting distributions, in the case of the indicators from the organic group, are as follows: the General Extreme Values (GEV) distribution for the extreme values of BOD5, the Gaussian distribution for CODCr, and the Log-normal distribution for the total suspended solids. For the treated wastewater (Figure 6), Log-normal is the best-fitting distribution for BOD5 and CODCr, as indicated by PBIAS values of −0.987 and −0.132, respectively. For the total suspended solids, the Halfnormal distribution turned out to be the best-fitting theoretical distribution.
3.4. Determination of Reliability Coefficients for the Operation of VF-CW
Based on the results of the best-fitting statistical distributions, the values of the pollutant indicators for the treated sewage were simulated using the Monte-Carlo method. In the case of the organic indicators, the modelling was based on a Log-normal distribution; in the case of the total suspended solids, it was based on a Halfnormal distribution. The following three reliability indicators for the operation of the VF-CW system were determined based on the simulation results: reliability coefficient (CR), technological efficiency index (R), and the risk index of the negative operation of the plant (Re). The obtained results are presented in Table 4.
Table 4.
Values of pollutant removal efficiency indicators for a VF-CW system according to Monte-Carlo simulations.
The values of the plant operation reliability index (CR) for BOD5 and TSS indicate the reliable operation of the VF-CW. This is also evidenced by the results of the technological efficiency indicators (R), which are close to one. This suggests that the number of samples that do not meet the requirements for wastewater quality at the outflow from the facility may occur only occasionally during the operation of the VF-CW system. Additionally, for both analysed indicators of contaminants, the value of the risk index of the negative control of the treatment plant operation (Re) clearly indicates that the number of samples exceeding the permissible values of these indicators at the outlet is lower than the acceptable value for a treatment plant serving a PE below 2000. The high degree of reduction obtained for both indicators confirms the effective distribution of these pollutants at the analysed treatment facility. Only in the case of CODCr, the obtained simulation results indicated that the domestic treatment system might not meet the requirements related to the reduction of organic contaminants to the required level. The values of the reliability index (CR), technological efficiency (R), and the average efficiency of the pollutant removal (η) confirmed that the concentration of organic compounds at the outflow may be higher than the permissible concentration set out in the regulation [34]. Moreover, the value of the risk index of the negative operation of the facility (Re) was one for this indicator, which indicates that the VF-CW system will not operate with the required efficiency in relation to this indicator during the period of the system’s operation. The simulation results suggest that the processes of the biological wastewater treatment in the facility may be disturbed. As studies have shown, the degree of pollutant decomposition described by CODCr in VF-CW systems is lower than that described by BOD5, which is due to the presence of components with low biodegradability in wastewater [70]. Similar results showing the reduced removal efficiency of CODCr pollutants in subsurface vertical-flow wastewater systems were obtained in other studies [71,72]. The decomposition of organic compounds determined by BOD5 and CODCr occurs by the interaction of microbial and physical mechanisms using dissolved oxygen. The removal of BOD5 occurs through sedimentation and microbial degradation processes carried out by aerobic bacteria residing in the peri-root zone of the CW system. CODCr is mainly removed by sedimentation and filtration, and the presence of plants negligibly affects its removal efficiency [73,74]. The simulation results showed that the CODCr at the outflow was significantly higher than the values set out in the regulation. The oxygen released from the roots was below the volume needed for the aerobic degradation of the O2-demanding molecule. Higher concentrations of organic pollutants in the effluent may be caused by higher concentrations of these pollutants at the inlet to the facility [75]. The fats and oils used for frying food, leftover protein- and carbohydrate-rich foods, chemicals, detergents, soaps, and shampoos discharged from households can result in higher concentrations of hard-to-degrade compounds in the effluent and can hinder their decomposition by microorganisms [59]. The temperature is yet another factor that can affect the biological processes taking place in the bed and can affect CODCr reduction. A drop in temperature below 5 degrees reduces the efficiency of organic compound decomposition in a vertical flow bed [76]. A possible solution for increasing the CODCr removal efficiency in the analysed CW system is the artificial oxygenation of the bed, as demonstrated by [77]. Another way to increase the removal efficiency of hardly biodegradable compounds is to recirculate treated wastewater back into the system, which is supposed to ensure increased aerobic bacterial activity through extensivereactions between pollutants and microorganisms [72,78]. The use of Monte-Carlo simulations as a tool for assessing the reliability of the operation of VF-CW systems is a new concept. To the best of our knowledge, there are currently no published studies that would allow comparison with our results. To date, this method has been used in the work of [25,69], where the authors simulated the values of pollution indicators for collective wastewater treatment plants. In both cited works, the authors stated unequivocally that the Monte-Carlo method is an effective tool for assessing the reliability of the operation of the analysed facilities and that it allows the modelling of wastewater quality parameters at different stages of treatment.
4. Conclusions
The objective of this study was to assess the reliability of the Monte-Carlo method as a tool for modelling the operational reliability of a vertical-flow wetland constructed for the treatment of domestic wastewater. In the first stage of the study, the changes in the values of the pollutant indices (BOD5, CODCr, and TSS) for raw and treated wastewater were characterised based on the acquired data. Then, the fit of the theoretical distributions to the empirical distributions was determined for the random variables. The fit was analysed for 10 probability distributions. The fit of the theoretical distributions to the empirical distributions was assessed using A–D statistics, and the best-fitting distributions were selected using the PBIAS criterion. For the raw wastewater, the theoretical distributions that best fit the empirical distributions are as follows: the generalised distribution of extreme values for BOD5, the Gaussian distribution for CODCr, and the Log-normal distribution for TSS. For the treated wastewater, the Log-normal distribution is best-fitting for BOD5 and CODCr, while the Half-normal distribution is best-fitting for TSS. The simulated values of the pollutant indicators were analysed in terms of their likely variations. The results indicate that there may be problems with the reduction of CODCr organic compounds at the studied wastewater treatment facility. The Monte-Carlo simulation method used in this study is a useful tool for modelling the operational reliability of a VF-CW. However, it is important to identify the correct theoretical distribution for the analysed random variables to allow new data to be generated while maintaining the current correlation structures between the random variables. The values generated in this way can be helpful for evaluating the operation of the treatment plant and preparing different scenarios for its operation. The prediction of changes in the quality of wastewater flowing into and effluent leaving the treatment facility allows necessary changes in or reconstruction of existing elements of the treatment plant to be planned, which is related to the rational planning of expenses and work to be incurred by the owner. The presented Monte-Carlo simulation method should be implemented to assess the reliability of the operations of other types of domestic wastewater treatment plants, e.g., horizontal-flow constructed wetlands, hybrid wastewater treatment plants, wastewater treatment plants using activated sludge technology, sequencing batch reactor (SBR) wastewater treatment plants, and wastewater treatment plants with ground filters, in terms of removing pollutants from not only the organic group and total suspended solids but also the total nitrogen and total phosphorus. The obtained results of the analyses would be a valuable source of information for future wastewater treatment facility operators in terms of the reliability of the operation of these plants in different scenarios.
Author Contributions
Conceptualisation: K.M.; methodology, K.M. and P.Ś.; software, K.M.; validation, K.M., J.M.R.T. and A.A.; formal analysis, K.M.; investigation, K.M. and K.J.; resources, K.M.; data curation, K.M.; writing—original draft preparation, K.M.; writing—review and editing, K.M.; visualisation, K.M.; supervision, K.M.; project administration, K.M.; funding acquisition, W.C. All authors have read and agreed to the published version of the manuscript.
Funding
This research received no external funding.
Data Availability Statement
The datasets generated and analyzed in the current study may be obtained from the corresponding author upon reasonable request.
Conflicts of Interest
The authors declare no conflict of interest.
References
- Steer, D.; Fraser, L.; Boddy, B.; Seibert, B. Efficiency of small constructed wetlands for subsurface treatment of single-family domestic effluent. Ecol. Eng. 2002, 18, 429–440. [Google Scholar] [CrossRef]
- Brix, H.; Arias, C.A. The use of vertical flow constructed wetlands for on-site treatment of domestic wastewater: New Danish guidelines. Ecol. Eng. 2005, 25, 491–500. [Google Scholar] [CrossRef]
- Seo, D.C.; DeLaune, R.D.; Park, W.Y.; Lim, J.S.; Seo, J.Y.; Lee, J.; Cho, J.S.; Heo, J.S. Evaluation of a hybrid constructed wetland for treating domestic sewage from individual housing units surrounding agricultural villages in South Korea. J. Environ. Monit. 2009, 11, 134–144. [Google Scholar] [CrossRef] [PubMed]
- Mikosz, J. Wastewater management in small communities in Poland. Desaliation Water Treat. 2013, 51, 2461–2466. [Google Scholar] [CrossRef]
- Jóźwiakowski, K.; Mucha, Z.; Generowicz, A.; Baran, S.; Bielińska, J.; Wójcik, W. The use of multi-criteria analysis for selection of technology for a household WWTP compatible with sustainable development. Arch. Environ. Prot. 2015, 41, 76–82. [Google Scholar] [CrossRef]
- Pawełek, J.; Bugajski, P. The development of household wastewater treatment plants in Poland—Advantages and disadvantages. Acta Sci. Pol. Form. Circumiectus 2017, 16, 3–14. (In Polish) [Google Scholar] [CrossRef]
- GUS. Municipal Infrastructure in 2020; Rocznik Statystyczny Rzeczypospolitej Polskiej; Główny Urząd Statystyczny: Warszawa, Poland, 2021. (In Polish)
- Mucha, Z.; Mikosz, J. Rational application of small wastewater treatment plants according to sustainability criteria. Czas. Tech. Sr. 2009, 106, 91–100. (In Polish) [Google Scholar]
- Martín, I.; Betancort, J.R.; Pidre, J.R. Contribution of non-conventional technologies for sewage treatment to improve the quality of bathing waters (ICREW project). Desalination 2007, 215, 82–89. [Google Scholar] [CrossRef]
- Bugajski, P.; Kaczor, G. The assessment of working sewage treatment plant at Wadowice before the modernization. Przemysł Chem. 2008, 87, 44–426. (In Polish) [Google Scholar]
- Orlik, T.; Jóźwiakowski, K. Evaluation of two BATEX wastewater treatment plants with a filtration outlet. Inżynieria Rol. 2003, 3, 109–119. (In Polish) [Google Scholar]
- Keffala, C.; Ghrabi, A. Nitrogen and bacterial removal in constructed wetlands treating domestic waste water. Desalination 2005, 185, 383–389. [Google Scholar] [CrossRef]
- De Filippis, L.F. Role of Phytoremediation in Radioactive Waste Treatment. In Soil Remediation and Plants; Academic Press: San Diego, CA, USA, 2015; pp. 207–254. [Google Scholar]
- Yeh, T.Y.; Chou, C.C.; Pan, C.T. Heavy metal removal within pilot-scale constructed wetlands receiving river water contaminated by confined swine operations. Desalination 2009, 249, 368–373. [Google Scholar] [CrossRef]
- Sheoran, A.S.; Sheoran, V. Heavy metal removal mechanism of acid mine drainage in wetlands: A critical review. Miner. Eng. 2006, 19, 105–116. [Google Scholar] [CrossRef]
- Arivoli, A.; Mohanraj, R.; Seenivasan, R. Application of vertical flow constructed wetland in treatment of heavy metals from pulp and paper industry wastewater. Environ. Sci. Pollut. Res. 2015, 22, 13336–13343. [Google Scholar] [CrossRef]
- Hendy, I.; Zelenakova, M.; Pietrucha-Urbanik, K.; Salama, Y.; Abu-hashim, M. Decentralized Constructed Wetlands for Wastewater Treatment in Rural and Remote Areas of Semi-arid Regions. Water 2023, 15, 2281. [Google Scholar] [CrossRef]
- Haynes, R.J. Use of industrial wastes as media in constructed wetlands and filter beds—Prospects for removal of phosphate and metals from wastewater streams. Crit. Rev. Environ. Sci. Technol. 2015, 45, 1041–1103. [Google Scholar] [CrossRef]
- Hua, T.; Haynes, R.J.; Zhou, Y.F.; Boullemant, A.; Chandrawana, I. Potential for use of industrial waste materials as filter media for removal of Al, Mo, As, V and Ga from alkaline drainage in constructed wetlands—Adsorption studies. Water Resour. 2015, 71, 32–41. [Google Scholar] [CrossRef] [PubMed]
- Młyński, D.; Chmielowski, K.; Młyńska, A. The assesment of the efficency and stability of work sewage treatment plant in Zabajka. Inżynieria Ekol. 2016, 47, 123–130. (In Polish) [Google Scholar] [CrossRef]
- Olyaei, M.A.; Karamouz, M.; Asce, F.; Farmani, R. Framework for assessing flood reliability and resilience of wastewater treatment plants. J. Environ. Eng. 2018, 144, 1–14. [Google Scholar] [CrossRef]
- Bugajski, P.; Almeida, M.A.A.; Kurek, K. Reliablity of sewage treatment plants processing sewage from school buildings located in non-urban areas. Infrastruct. Ecol. Rural. Areas 2016, 4, 1547–1557. [Google Scholar]
- Marzec, M. Reliability of removal of selected pollutants in different technological solutions of household wastewater treatment plants. J. Water Land Dev. 2017, 35, 141–148. [Google Scholar] [CrossRef]
- Jóźwiakowski, K.; Bugajski, P.; Mucha, Z.; Wójcik, W.; Jucherski, A.; Nastwany, M.; Siwiec, T.; Mazur, A.; Obroślak, R.; Gajewska, M. Reliability and efficiency of pollution removal during long-term operation of a one-stage constructed wetland system with horizontal flow. Sep. Purif. Technol. 2017, 187, 60–66. [Google Scholar] [CrossRef]
- Młyński, D.; Bugajski, P.; Młyńska, A. Application of the mathematical simulation methods for the assessment of the wastewater treatment plant operation work reliability. Water 2019, 11, 873. [Google Scholar] [CrossRef]
- Mitrenga, D. Methodological Basis of the Monte Carlo Stochastic Simulation. Stud. Ekon. Uniw. Ekon. W Katowicach 2014, 204, 164–180. (In Polish) [Google Scholar]
- Ferson, S. What Monte Carlo methods cannot do. Hum. Ecol. Risk Assess. Int. J. 1996, 4, 990–1007. [Google Scholar] [CrossRef]
- PN-C-04620-02:1974; Water and Sewage—Sampling—General Provision and Scope of the Standard. Polski Komitet Normalizacji, Miar i Jakości: Warszawa, Poland, 1975. (In Polish)
- PN-EN 25667-2:1999; Water Quality—Sampling—Guidance on Sampling Techniques. Polski Komitet Normalizacyjny: Warszawa, Poland, 1999. (In Polish)
- Water Quality—Determination of Biochemical Oxygen Demand after n Days (BOD)—Part 1: Dilution and Vaccination Method with the Addition of Allythiourea; Polski Komitet Normalizacyjny: Warszawa, Poland, 2002. (In Polish)
- Water Quality—Determination of the Chemical Oxygen Demand Index (ST-COD)—Small-Scale Sealed-Tube Method; Polski Komitet Normalizacyjny: Warszawa, Poland, 2005. (In Polish)
- Water Quality—Determination of Suspended Solids—Method by Filtration trough Filters; Polski Komitet Normalizacyjny: Warszawa, Poland, 2007. (In Polish)
- Regulation of the Minister of Environment of November 18, 2014 Laying down Conditions for the Introduction of Sewage into Water or Soil and Substances Particularly Harmful to the Aquatic Environments (No 2014 Item 1800). Available online: https://isap.sejm.gov.pl/isap.nsf/download.xsp/WDU20140001800/O/D20141800.pdf (accessed on 10 September 2023). (In Polish)
- Rozporządzenie Ministra Gospodarki Morskiej i Żeglugi Śródlądowej z dnia 12 lipca 2019 r.w Sprawie Substancji Szczególnie Szkodliwych dla Środowiska Wodnego Oraz Warunków, Jakie Należy Spełnić przy Wprowadzaniu do wód lub do Ziemi ścieków, a Także przy Odprowadzaniu wód Opadowych lub Roztopowych do wód lub do Urządzeń Wodnych. Regulation of the Minister of Maritime Economy and Inland Navigation of 12 July 2019 on Substances Particularly Harmful to the Aquatic Environment and Conditions to Be Met during Sewage Discharge into the Water or into the Ground and during Rainwater or Snowmelt Discharge into the Water or into the Water Devices. Available online: https://isap.sejm.gov.pl/isap.nsf/download.xsp/WDU20190001311/O/D20191311.pdf (accessed on 10 September 2023). (In Polish)
- Jagiełło, R.; Beker, C.; Jagodziński, A.M. Goodness of fit evaluation of the breast height diameter distributions of beech stands differing in age with selected theoretical distributions. Sylwan 2016, 160, 107–119. (In Polish) [Google Scholar]
- Glickman, T.S.; Xu, F. The distribution of the product of two random variables. Stat. Probab. Lett. 2008, 78, 2821–2826. [Google Scholar] [CrossRef]
- Wang, X. Vehicle Noise and Vibration Refinement; Woodhead Publishing: Cambridge, UK, 2010. [Google Scholar]
- Zoran, D.; Weiss, Y. From learning models of natural image patches to whole image restoration. In Proceedings of the 2011 International Conference on Computer Vision, Barcelona, Spain, 6–13 November 2011; pp. 479–486. [Google Scholar]
- Yu, G.; Sapiro, G.; Mallat, S. Solving inverse problems with piecewise linear estimators: From gaussian mixture models to structured sparsity. IEEE Trans. Image Process. 2012, 21, 2481–2499. [Google Scholar]
- Wałęga, A.; Rutkowska, A.; Policht-Latawiec, A. Sensitivity of beta and Weibull synthetic unit hydrographs to input parameter changes. Pol. J. Environ. Stud. 2014, 1, 221–229. [Google Scholar]
- Alam, M.A.; Emuro, K.; Farnham, C.; Yuan, J. Best-fit probability distributions and return periods for maximum monthly rainfall in Bangladesh. Climate 2018, 6, 9–25. [Google Scholar] [CrossRef]
- Zeng, X.; Wang, D.; Wu, J. Evaluating the three methods of goodness of fit test for frequency analysis. J. Risk Anal. Crisis Response 2015, 5, 178–187. [Google Scholar] [CrossRef]
- Evans, D.L.; Drew, J.H.; Leemis, L.M. The distribution of the Kolmogorov–Smirnov, Cramer–von Mises, and Anderson–Darling test statistics for exponential populations with estimated parameters. Comput. Probab. Appl. 2017, 247, 165–190. [Google Scholar]
- Jäntschi, L.; Bolboacă, S.D. Computation of probability associated with Anderson–Darling statistic. Mathematics 2018, 6, 88–104. [Google Scholar] [CrossRef]
- Ajmal, M.; Waseem, M.; Kim, D.; Kim, T.W. A Pragmatic Slope-Adjusted Curve Number Model to Reduce Uncertainty in Predicting Flood Runoff from Steep Watersheds. Water 2020, 12, 1469. [Google Scholar] [CrossRef]
- Gupta, H.V.; Sorooshian, S.; Yapo, P.O. Status of automatic calibration for hydrologic models: Comparison with multilevel expert calibration. J. Hydrol. Eng. 1999, 4, 135–143. [Google Scholar] [CrossRef]
- Moriasi, D.N.; Arnold, J.G.; Van Liew, M.W.; Bingner, R.L.; Harmel, R.D.; Veith, T.L. Model evaluation guidelines for systematic quantification of accuracy in watershed simulations. Trans. ASABE 2007, 50, 885–900. [Google Scholar] [CrossRef]
- Yuan, Y.; Nie, J.; McCutcheon, S.C.; Taguas, E.V. Initial abstraction and curve numbers for semiarid watersheds in south eastern Arizona. Hydrol. Process. 2014, 28, 774–783. [Google Scholar] [CrossRef]
- Archibald, J.A.; Buchanan, B.; Fuka, D.R.; Georgakakos, C.B.; Lyon, S.W.; Walter, M.T. A simple, regionally parameterized model for predicting nonpoint source areas in the northeastern US. J. Hydrol. Reg. Stud. 2014, 1, 74–91. [Google Scholar] [CrossRef]
- Donigian, A.S.; Imhoff, J.C.; Bicknell, B.R. Predicting water quality resulting from agricultural nonpoint-source pollution via simulation: HSPF. In Agricultural Management and Water Quality; Iowa State University Press: Ames, IA, USA, 1983; pp. 200–249. [Google Scholar]
- Singh, J.; Knapp, H.V.; Arnald, J.G.; Demissie, M. Hydrologic modeling of the Iroquois River watershed using HSPF and SWAT. J. Am. Water Resour. Assoc. 2004, 41, 343–360. [Google Scholar] [CrossRef]
- Van Liew, M.W.; Arnold, J.G.; Garbrecht, J.D. Hydrologic simulation on agricultural watersheds: Choosing between two models. Trans. ASAE 2003, 46, 1539–15512. [Google Scholar] [CrossRef]
- Halton, J.H. A retrospective and prospective survey of the Monte Carlo method. SIAM Rev. 1970, 12, 1–63. [Google Scholar] [CrossRef]
- Schauberger, G.; Piringer, M.; Baumann-Stanzer, K.; Knauder, W.; Petz, E. Use of a Monte Carlo technique to complete a fragment set of H2S emission rates from a wastewater treatment plant. J. Hazard. Mater. 2013, 263, 694–701. [Google Scholar] [CrossRef] [PubMed]
- Hendren, C.O.; Badireddy, A.R.; Casman, E.; Wiesner, M.R. Modeling nanomaterial fate in wastewater treatment: Monte Carlo simulation of silver nanoparticles (nano-Ag). Sci. Total Environ. 2013, 449, 418–425. [Google Scholar] [CrossRef] [PubMed]
- Barton, L.E.; Auffan, M.; Durenkamp, M.; McGrath, S.; Bottero, J.; Wiesner, M.R. Monte Carlo simulations of the transformation and removal of Ag, TiO2, and ZnO nanoparticles in wastewater treatment and land application of biosolids. Sci. Total Environ. 2015, 511, 535–543. [Google Scholar] [CrossRef] [PubMed]
- Andraka, D.; Dzienis, L. Modeling of risk in the operation of wastewater treatment plants. Rocz. Ochr. Sr. 2013, 15, 1111–1125. [Google Scholar]
- Kurek, K.; Bygajski, P.; Operacz, A.; Młyński, D.; Wałęga, A. Technological reliability of sewage treatment plant with the Pomiltek Mann type bioreactor. J. Water Land Dev. 2020, 46, 146–152. [Google Scholar]
- Kaczor, G. Concentrations of the pollutants in the sewage drained from the rural sewerage systems in lesser Poland voivodeship. Infrastrukt. Ekol. Teren. Wiej. 2009, 9, 97–104. (In Polish) [Google Scholar]
- Jóźwiakowski, K.; Bugajski, P.; Kurek, K.; Carvalho, F.; Almeida, A.; Siwiec, T.; Borowski, G.; Czekała, W.; Dach, J.; Gajewska, M. The efficiency and technological reliability of biogenic compounds removal during long-term operation of a one-stage subsurface horizontal flow constructed wetland. Sep. Purif. Technol. 2018, 202, 216–226. [Google Scholar] [CrossRef]
- Jucherski, A.; Nastawny, M.; Walczowski, A.; Jóźwiakowski, K.; Gajewska, M. Assessment of the technological reliability of a hybrid constructed wetland for wastewater treatment in a mountain eco-tourist farm in Poland. Water Sci. Technol. 2017, 75, 2649–2658. [Google Scholar] [CrossRef]
- Zhang, L.; Zhang, L.; Liu, Y.D.; Shen, Y.W.; Liu, H.; Xiong, Y. Effect of limited artificial aeration on constructed wetland treatment of domestic wastewater. Desalination 2010, 250, 915–920. [Google Scholar] [CrossRef]
- Wałęga, A.; Chmielowski, K.; Młyński, D. Influence of the Hybrid Sewage Treatment Plant’s Exploitation on Its Operation Effectiveness in Rural Areas. Sustainability 2018, 10, 2689. [Google Scholar] [CrossRef]
- Lu, S.; Pei, L.; Bai, X. Study on method of domestic wastewater treatment through new-type multi-layer artificial wetland. Int. J. Hydrogen Energy 2015, 40, 11207–11214. [Google Scholar] [CrossRef]
- Kuschk, P.; Wiener, A.; Kappelmeyer, U.; Weissbrodt, E.; Kästner, M.; Stottmeister, U. Annual cycle of nitrogen removal by a pilot-scale subsurface horizontal flow in a constructed wetland under moderate climate. Water Resour. 2003, 37, 4236–4242. [Google Scholar] [CrossRef] [PubMed]
- Kadlec, R.H.; Reddy, K. Temperature Effects in Treatment Wetlands. Water Environ. Res. 2001, 73, 543–557. [Google Scholar] [CrossRef]
- Stein, W.; Keblis, M. A new method to simulate the triangular distribution. Math. Comput. Model. 2009, 49, 1143–1147. [Google Scholar] [CrossRef]
- Pereira, E.J.S.; Pinho, J.T.; Galhardo, M.A.B.; Macêdo, W.M. Methodology of risk analysis by Monte Carlo Method applied to power generation with renewable energy. Renew. Energy 2014, 69, 347–355. [Google Scholar] [CrossRef]
- Młyński, D.; Młyńska, A.; Chmielowski, K.; Pawełek, J. Investigation of the Wastewater Treatment Plant Processes Efficiency Using Statistical Tools. Sustainability 2020, 12, 10522. [Google Scholar] [CrossRef]
- Vymazal, J. The use of sub-surface constructed wetlands for wastewater treatment in the Czech Republic: 10 years experience. Ecol. Eng. 2002, 18, 633–646. [Google Scholar] [CrossRef]
- Abdelhakeem, S.G.; Aboulroos, S.A.; Kamel, M.M. Performance of a vertical subsurface flow constructed wetland under different operational conditions. J. Adv. Res. 2016, 7, 803–814. [Google Scholar] [CrossRef]
- Ilyas, H.; Masih, I. The performance of the intensified constructed wetlands for organic matter and nitrogen removal: A review. J. Environ. Manag. 2017, 198, 372–383. [Google Scholar] [CrossRef]
- Sehar, S.; Sumera, S.; Naeem, I.; Perveen, N.; Ahmed, S. A comparative study of macrophytes influences on wastewater treatment through subsurface flow hybrid constructed wetland. Ecol. Eng. 2015, 81, 62–69. [Google Scholar] [CrossRef]
- Zhu, D.; Suna, C.; Zhang, H.; Wub, Z.; Jia, B.; Zhang, Y. Roles of vegetation, flow type and filled depth on livestock wastewater treatment through multi-level mineralized refuse-based constructed wetlands. Ecol. Eng. 2012, 39, 7–15. [Google Scholar] [CrossRef]
- Gajewska, M. Złoża hydrofitowe z pionowym przepływem ścieków charakterystyka procesów i zastosowań. Wydaw. Pol. Akad. Nauk. 2019, 150, 1–309. Available online: https://kis.pan.pl/images/stories/pliki/pdf/Monografie/Monografia-M-Gajewska-vol-150.pdf (accessed on 10 September 2023). (In Polish).
- Soroko, M. Annual Treatment Of Wastewater From Small Fruit And Vegetable Processing Plant In The Reed Bed System with Vertical Flow. Woda Sr. Obsz. Wiej. 2011, 11, 289–298. [Google Scholar]
- Wu, H.; Fan, J.; Zhang, J.; Ngo, H.H.; Guo, W.; Hu, Z.; Liang, S. Decentralized domestic wastewater treatment using intermittently aerated vertical flow constructed wetlands: Impact of influent strengths. Bioresour. Technol. 2015, 176, 163–168. [Google Scholar] [CrossRef]
- Wu, S.; Kuschk, P.; Brix, H.; Vymazal, J.; Dong, R. Development of constructed wetlands in performance intensifications for wastewater treatment: A nitrogen and organic matter targeted review. Water Resour. 2014, 57, 40–55. [Google Scholar] [CrossRef]
Disclaimer/Publisher’s Note: The statements, opinions and data contained in all publications are solely those of the individual author(s) and contributor(s) and not of MDPI and/or the editor(s). MDPI and/or the editor(s) disclaim responsibility for any injury to people or property resulting from any ideas, methods, instructions or products referred to in the content. |
© 2023 by the authors. Licensee MDPI, Basel, Switzerland. This article is an open access article distributed under the terms and conditions of the Creative Commons Attribution (CC BY) license (https://creativecommons.org/licenses/by/4.0/).