Article

Potential Use of Precipitates from Acid Mine Drainage (AMD) as Arsenic Adsorbents

by
Karina Torres-Rivero
1,2,*,
Julio Bastos-Arrieta
3,4,
Antonio Florido
1,2 and
Vicenç Martí
1,2
1
Departament d’Enginyeria Química, Escola d’Enginyeria de Barcelona Est (EEBE), Universitat Politècnica de Catalunya, BarcelontaTEch (UPC), Av. Eduard Maristany 16, 08019 Barcelona, Spain
2
Barcelona Research Center for Multiscale Science and Engineering, Av. Eduard Maristany 16, 08019 Barcelona, Spain
3
Departament d’Enginyeria Química i Química Analítica, Facultat de Química, Universitat de Barcelona, Martí i Franquès 1-11, 08028 Barcelona, Spain
4
Institut de Recerca de l’Aigua (IdRA), Universitat de Barcelona (UB), 08028 Barcelona, Spain
*
Author to whom correspondence should be addressed.
Water 2023, 15(18), 3179; https://doi.org/10.3390/w15183179
Submission received: 29 June 2023 / Revised: 6 August 2023 / Accepted: 16 August 2023 / Published: 6 September 2023

Abstract

:
The role of precipitates from acid mine drainage (AMD) in arsenic removal in water is a process to be investigated in more detail. The present study is focused on the potential use of two AMD precipitates using oxidation and Ca(OH)2 (OxPFe1) or CaCO3 (OxPFe2) as As(V) adsorbents and the comparison of their performance with two commercial adsorbents (nanohematite and Bayoxide®). The AMD’s supernatants and precipitates were characterized using several techniques and assessed with theoretical speciation and mass balance methods. Gypsum was identified by XRD and assessed as the main component of the precipitates. Amorphous iron hydroxide was assessed as the second component (22% in mass), and jurbanite or aluminum hydroxide were present in the third likely phase. The equilibrium adsorption of As(V) in water at a pH between 4 and 6 was tested with the four adsorbents, and the Langmuir model correlated well. The maximum adsorption capacity (qmax) had the highest value for OxPFe1 and the lowest value for nanohematite (that could be explained in terms of the adsorbent surface speciation). The two precipitates have limited application to the adsorption of very low concentrations of arsenic because they have a binding constant (b) lower than the commercial adsorbents and could release a small amount of the arsenic contained in the precipitate.

1. Introduction

Among common inorganic pollutants, arsenic has been primarily studied because it represents a threat to human health and other living organisms [1,2,3]. Arsenic can be found in the environment from natural sources (volcanic emissions, minerals) and anthropogenic sources such as mining activities, fossil fuel combustion, etc. Arsenic is present in the earth’s mineral deposits and can be dissolved in surface and groundwater. The presence of arsenic in water sources could be attributed to acid mine drainage (AMD) generation from mining activities or groundwater contamination from spent pyrites in brownfields [4,5,6,7]. To limit harmful arsenic exposure [8,9,10], World Health Organization and the European Union have implemented a guideline of 10 µg L−1 in water intended for human consumption [11,12].
Arsenic can be removed from water using techniques such as oxidation [13,14] and precipitation, coagulation [15], electrocoagulation [16], co-precipitation [17,18], membrane technology [19,20], reverse osmosis [21,22], electrodialysis [23,24], and ion exchange technology [25,26]. In particular, the oxidation methodology implies the oxidation of arsenic (V) species, which can be further eliminated using the dosage of alkali, enhancing coagulation/filtration, and lime softening [7]. The conventional ODAS method (oxidation (O), dosing with alkali (DA), and sedimentation (S)) is based on the strategy to precipitate soluble ions into less soluble forms [27,28]. Because Fe(II) ions could be present in the studied AMD samples, a pre-oxidation stage with the addition of an oxidizing agent is needed. Then the pH is raised through alkali dosing to force the precipitation of species containing the metal ions, and finally the sludge is separated from the treated water [29]. Also, when Fe(III) is added (e.g., coagulation) or present in sufficient excess, there is a precipitation of iron hydroxide that adsorbs arsenic [13,17].
Compared to the methods mentioned earlier, adsorption technology does not involve sophisticated equipment, does not expend very long procedures and analysis time, is safe to handle and operate, and can be very effective at low arsenic concentrations [14]. Adsorption is a surface phenomenon based on the interaction between the adsorbent (solid surface) and the adsorbate (molecules or ions present in solution). This water treatment procedure has been reported to be efficient in removing arsenite and arsenate with 95% quantitative efficiency. It depends on van der Waals forces and the electrostatic attraction forces among absorbed molecules [15]. In addition, the adsorption efficiency can be influenced by the exposure period, pH, presence of other species, adsorbent dose, initial arsenic concentration, and temperature [4]. Different adsorbents can be used to remove arsenic from water, including activated carbon [30,31], clay minerals [29,32], zeolites [33,34], hydrotalcite [35,36], and several oxides (manganese dioxide, titanium dioxide, lanthanum dioxide, and iron oxides) [37,38].
The use of iron adsorbents has evolved with time from iron oxides and hydroxides in granular and micronized form to nanoparticles, materials modified with nanoparticles, and nanocomposites. Despite the better performance of the newly developed materials shown at the lab scale (e.g., maximum adsorption capacity), their cost still limits their application at the industrial scale [39,40] especially at low levels of contamination. This reason and the development of the Circular Economy concept point to the use of low-cost byproducts as adsorbents [41,42] to improve the cost of processes vs. commercial products, generally led by iron adsorbents.
Many studies reported the use of iron oxides [39,40], oxyhydroxides [41,43], and hydroxides, including amorphous hydrous ferric oxide (FeO-OH) [44], goethite (α-FeO-OH) [45,46], and hematite (α-Fe2O3) [9,47] that exhibit good to excellent reactivity in terms of arsenic adsorption. In all the reviewed studies, acidic pH in the range 2–6 was optimal for adsorption of As(V), and the operation below the pH at the zero point charge (pHPZC) was a paramount condition to increase the adsorption at higher concentrations [9,39,47]. From the mentioned iron adsorbents, hematite, due to pHPZC limitations, showed better adsorption at low concentrations, but goethite was a better adsorbent in wider concentration ranges [9,40,47].
The aim of the present work is to study the As(V) elimination present in AMD using the ODAS approach and the characterization and use of the obtained precipitates as arsenic adsorbents, leading to an adsorption performance comparison with other iron-based commercial adsorbents.

2. Materials and Methods

2.1. Reagents

Calcium hydroxide (Ca(OH)2) and calcium carbonate (CaCO3) were purchased from Sigma Aldrich (Darmstadt, Germany) and Fluka (Seelze, Germany), respectively. To oxidize Fe(II) to Fe(III), a 30% hydrogen peroxide solution from Merck (Darmstadt, Germany) was added. Deionized water (DI) obtained from a Milli-Q 185 system (Millipore, Burlington, MA, USA) was used to prepare all solutions.
Granular Bayoxide® E-33 (Apliclor Water Solutions, Sant Martí Sesgueioles, Barcelona, Spain), with a particle size range between 0.315 and 10 mm, was used as the starting material. This solid has iron hydroxide adsorbent (α-FeOOH, goethite) as a main component, according to [48]. Nanohematite, an iron (III) oxide nanopowder, was provided by Sigma Aldrich (St. Louis, MO, USA) with a reported particle size below 50 nm.
To perform the granulometric study, sodium carboxymethyl cellulose was purchased from Sigma Aldrich (Darmstadt, Germany).
A previous screening of three different AMD samples, Tharsis, Cueva de la Mora, and Peña del Hierro mines, to determine the elements and their concentrations, was performed. Therefore, it was decided to work with AMD wastewater samples from the Peña del Hierro abandoned mine in Huelva, Spain (See Figure 1) due to their high content of iron and aluminum and the presence of arsenic.

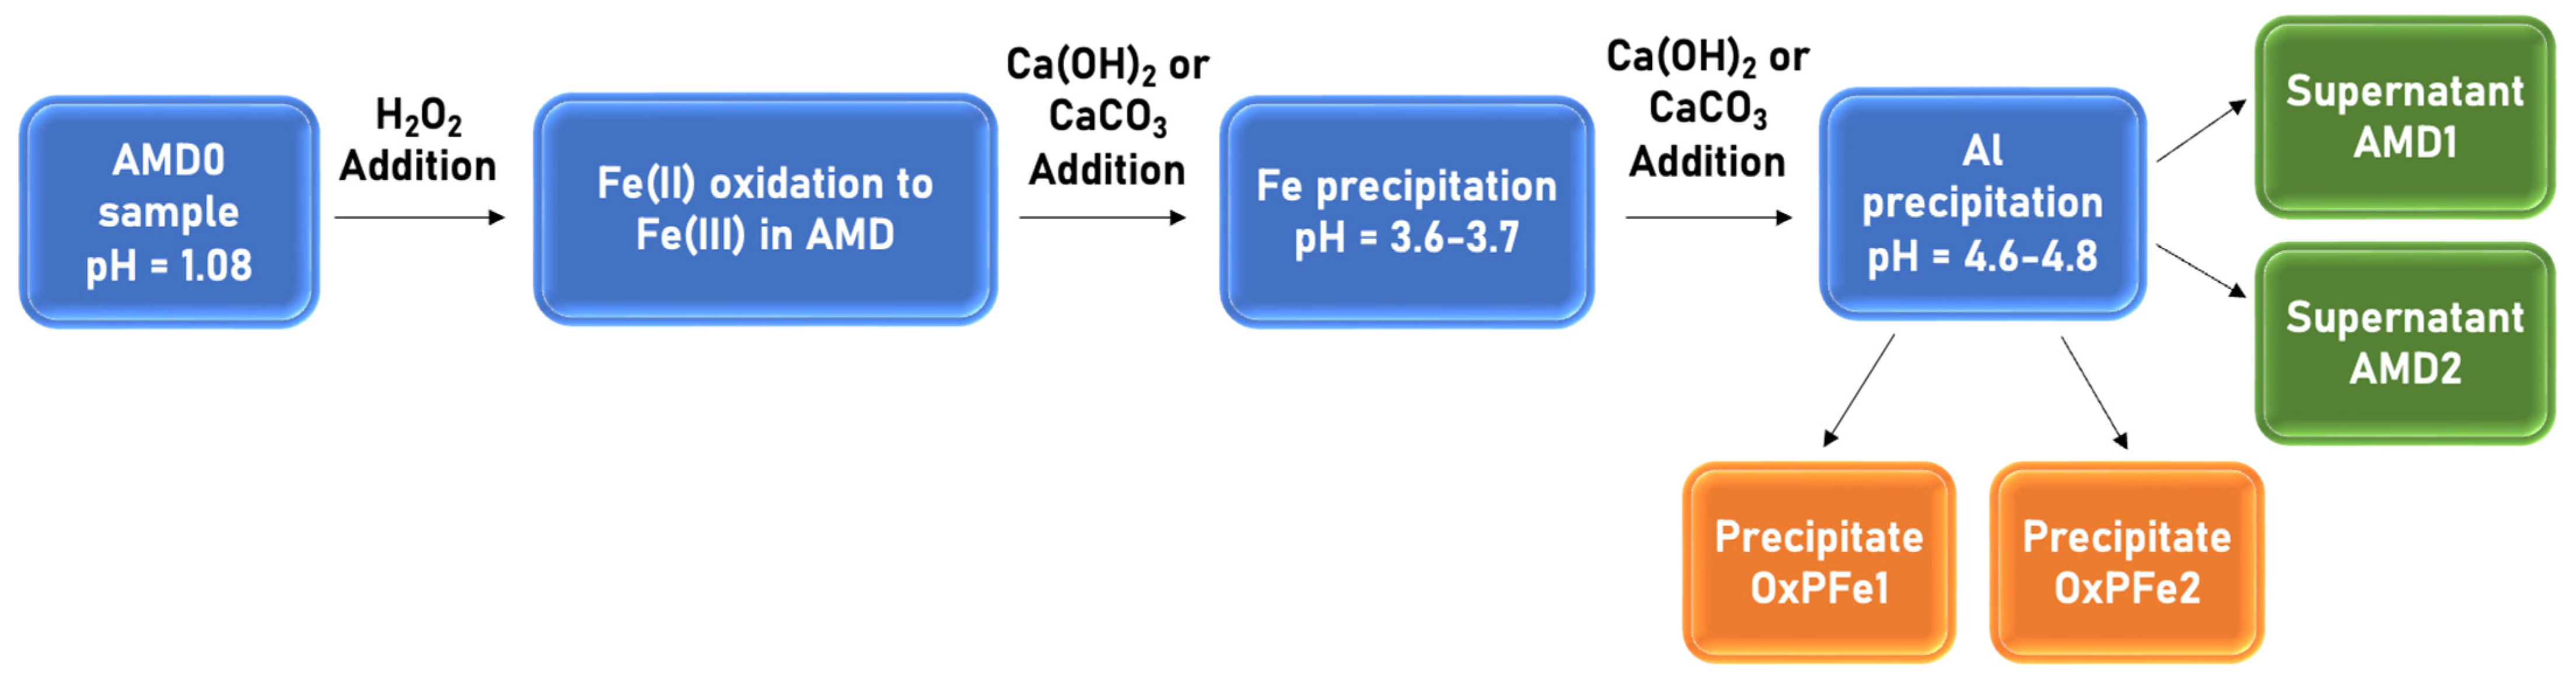
2.2. OxPFe Precipitate Obtention

Peña del Hierro acid waters (AMD0) followed a previous pretreatment of oxidation (O), dosing with alkali (DA), and sedimentation (S) using the ODAS approach, shown in Figure 2.
In this study, 400 mL of AMD0 was mixed with 45 mL of H2O2 35% (v/v), which represented twice the stoichiometric amount required to oxidize Fe (II) to Fe (III).
As a second step, Fe and Al were precipitated by increasing the initial AMD sample pH using two types of alkali solids (Ca(OH)2 and CaCO3). A theoretical pH in the range of 3.7–3.8 and 4.6–4.8 for Fe and Al precipitation, respectively, needs to be reached. For this purpose, 9.65 g of Ca(OH)2 or 8.53 g of CaCO3 were added to the AMD sample. Two different precipitates were obtained: OxPFe1 using Ca(OH)2, and OxPFe2 using CaCO3.
Each precipitate was separated from the supernatant using a centrifuge (model Centronic BLT) purchased from J.P. Selecta (Abrera, Barcelona, Spain) for 8 min at 4000 rpm. The solid was dried overnight at 60 °C and later analyzed by X-ray diffraction.
The supernatant obtained after precipitation was named AMD1 (from precipitate OxPFe1) and AMD2 (from precipitate OxPFe2). These treated AMDs and the initial AMD (AMD0) were also analyzed by inductively coupled plasma mass and optical emission spectrometers ICP-MS model 7800 by Agilent Technologies (Santa Clara, CA, USA), and ICP-OES Model 5110 by Agilent Technologies (Santa Clara, CA, USA). The samples were acidified with 3% nitric acid and filtered using syringe filters of 0.22 μm, while the solids underwent the same procedures (see Section 2.3).

2.3. Acid Mine Drainage and Supernatant Characterization

For AMD0 characterization, a sample of the raw AMDs was diluted in a proportion of 1:10 and analyzed by ICP-MS and ICP-OES to determine the element concentrations in the sample.
In addition, the initial pH and redox potential were determined using a Crison Basic 20 pH meter (Alella, Barcelona, Spain). The pH electrode model was 50-14T, whose working pH range is between 0 and 14, according to the supplier.
The conductivity measurements were performed using a Crison EC-meter GLP 31 (Alella, Barcelona, Spain), and a conductivity cell model Sension+ 5070 from Hach (Derio, Bizkaia, Spain) was used. The conductivity cell’s working range was from 0.2 µS cm−1 to 200 mS cm−1. Sulfate concentration was analyzed by ion chromatography (Dionex ICS-1000 and Dionex ICS-1110) (Waltham, MA, USA) for raw AMD and both treated AMD samples. The column IONPAC® AS23 for anions and a mixture of 4.5 mmol/L Na2CO3 and 0.8 mmol/L NaHCO3 as eluent were used. All the samples were diluted using DI in order to have a maximum SO42− concentration of 300 mg/L.

2.4. Adsorbent Preparation

Four different solids were used to carry out the adsorption studies: two commercial solids, nanohematite and Bayoxide®, and the OxPFe1 and OxPFe2 precipitates were obtained (see Figure 2).
To reduce the solid particle size of the Bayoxide® adsorbent, 5 g were added to 250 mL of deionized water in a volumetric flask and placed in an ultrasonic bath at 20 kHz (ATU Ultrasonidos, ATM40-2L-CD, Paterna, Valencia, Spain) for 90 min. The sonicated solid was dried in an oven at 85 °C for 20 h. The Bayoxide® and both OxPFe1 and OxPFe2 solids were milled using an agate mortar, and the obtained solids were sieved at a size of 40 µm.

2.5. Adsorbents Characterization

The content of total calcium, iron, and aluminum in the adsorbents was determined by sampling 100 mg for acid digestion using 8 mL of HNO3 (65% Suprapure®, Scharlab) and final dilution to 50 mL with MilliQ® Water. After filtering the digested solid with a 0.45 µm filter, the total iron and calcium contents were obtained using an Atomic Absorption Spectrometry (AAS) instrument (Analytik Jena GmbH, contrAA 800, Jena, Germany). In the case of the determination of total sulfur, an aliquot of 0.8 g of the sample was analyzed by bt S/C analyzer (CS-200, Leco). To identify possible crystalline phases, X-ray diffraction (XRD) analyses were carried out. A Bruker D8 Advance A25 X-ray diffractometer (Billerica, MA, USA) was used with a Bragg–Brentano configuration θ–θ. The equipment has a Cu X-ray tube, which allows it to work up to 40 kV and 40 mA. The spectrum was recorded from 4 °C to 60 °C with steps of 0.020 °C. The identification of mineral phases was performed with EVA software (Version 8.5).
The solid surface characterization was performed using the scanning electron microscopy (SEM) Gemini Ultra Plus model from ZEISS® (Jena, Germany) coupled with a spectrometer (EDX, Oxford Instrument, Oxon, UK). The Mastersizer 3000 equipment from Malvern Analytics (Malvern, UK), employing the laser light scattering principle, was used to determine the iron-based solids’ particle size distribution.
In addition, the determination of the point of zero charge (PZC) was performed using the immersion technique [50]. A total amount of 625 mg of the different sorbent solids were put in contact with 0.03 M KNO3 solutions adjusted at different pH values, between 3 and 12. The pH was adjusted using solutions of 0.1 M HNO3 and 0.1 M KOH, as required. The suspensions were agitated for 24 h in a shaker at 96 rpm until an equilibrium pH value (pHeq) was reached. The ΔpH (pHi-pHeq) was calculated and represented in a graphic versus the initial pH value in order to obtain the pHPZC for every studied adsorbent.

2.6. Theoretical Speciation of Supernatant AMD and Mass Balance of Precipitates

The Aqion software 8.1.5 [51], based on the USGS PHREEQC database, was used to determine the equilibrium species in the supernatant and the probable precipitated phases by estimating their saturation index, SI.
S I = log I A P K s
where IAP is the Ion Activity Product and Ks is the solubility equilibrium constant. The hypothetical solid species found in the literature and previous equilibrium studies were used as inputs to calculate the total amount of elements present in the adsorbent. The theoretical concentration C i , c a l c of the 4 elements Ca, Fe, Al, and S in the precipitated phase could be expressed as a mass balance from the following solid phases added, modeled, and described in the literature: U = CaCO3, V = Al(OH)3, W = AlSO4OH·5H2O (jurbanite), X = Fe(OH)3, Y = CaSO4·H2O (gypsum), Z = Ca(OH)2 (lime). Considering the percentage of each element in every species, the following equations are obtained (Equation (2) only for OxPFe1 and Equation (3) only for OxPFe2).
C a c a l c = 0.2328 · Y + 0.5409 · Z
C a c a l c = 0.2328 · Y + 0.4004 · U
F e c a l c = 0.5226 · X
A l c a l c = 0.3459 · V + 0.1172 · W
  S c a l c = 0.1862 · Y + 0.229 · W
In order to find the optimal mass % concentration of the phases, Ci,calc (U, V, W, X, Y, and Z) in the precipitate that explain the experimental elemental composition C i , e x p of the 4 elements, the quadratic error S S e r r has been calculated as Equation (7).
S S e r r = i = 1 n C i , e x p C i ,   c a l c 2
To obtain the minimum error, the Solver function in Microsoft Excel™ software (version 16.74) with the GRG non-linear solving method was used to minimize SSerr as the objective function, changing V, W, X, Y, Z, or U.

2.7. Batch As(V) Adsorption Experiments

As(V) solutions were prepared from a proper dilution of a 1000 mg/L ICP standard solution using deionized water (DI). The As(V) initial concentrations were analyzed by ICP-OES. The initial solutions had a pH between 4 and 4.5 due to the acidic nature of the ICP standards.
Equilibrium tests were performed by putting in contact 20 mg of solid (Bayoxide, nanohematite, OxPFe1, and OxPFe2) and 250 mL of every As(V) solution for 96 h in aerobic conditions, and under vertical stirring conditions using an Orbital stirrer Rotabit Selecta (Abrera, Barcelona, Spain). The equilibrium batch tests were performed by putting in contact 50, 100, 250, and 500 µg L−1, 1, 2.5, 5, 7.5, and 10 mg L−1 of As(V) solution. Once the As(V) solutions and the different solids were put in contact, pH and redox potential measurements were performed.
The As(V) adsorption onto the studied solids was calculated from the following mass balance equation:
q = C o C · V m  
where q is the amount of As(V) adsorbed onto the material at time t (mg g−1), Co is the As(V) concentration at initial time, and a C is the As(V) at time t (mg L−1); V corresponds to the volume of As(V) solution used in the batch experiment (L), and m is the mass of adsorbent used in the experiment (g).
Langmuir isotherms (Equation (7)) were used to fit the experimental equilibrium data C e and q e were obtained from the corresponding equilibrium.
  q e = q m a x · b · C e 1 + b · C e  
In a Langmuir isotherm qmax is the maximum adsorption capacity (mg g−1) and b, the binding constant (L mg−1). Ce and qe are the values under equilibrium in the Langmuir isotherm. To estimate the maximum adsorption capacity (qmax) and the binding constant (b), the quadratic error SSerr has been calculated, as Equation (10) shows.
S S e r r = i = 1 n [ C e , e x p C e , c a l c ] 2
The Solver function in Microsoft ExcelTM software (version 16.74) with the GRG non-linear solving method was used to minimize S S e r r as the objective function, changing the Ce,calc value. The subscript exp corresponds to experimental values and the subscript calc corresponds to the Langmuir model.
Expression (9) could be simplified to a linear model with a slope qmax·b, if Ce is very low and reaches a constant value of qe (the asymptotic value), when Ce is very high.

3. Results

3.1. Raw AMD and Treated Supernatant Characterization

As the analytical results showed, the original acid sample from Peña de Hierro mine (AMD0) had a very acidic pH with a high content of metals, metalloids, and sulfate (see Table 1). The major elements for the AMD0 were identified as Fe and Al; some minor elements such as Cu, Zn, and As, among others, were shown. Moreover, high conductivity can also be observed. All the concentrations listed in Table 1 are already expressed considering the dilution factor used.
As the concentration of the elements was determined by ICP-OES, the corresponding limits of detection are summarized in Table S1 in the Supplementary Materials (see Table S1).
After the ODAS treatment (see Figure 2) for both AMD1 and AMD2, almost all the element concentrations decreased considerably. Only in the case of Ca did the metal increase due to the Ca addition in the treatment. In the cases of AMD1 and AMD2, the iron concentration results indicated practically complete elimination (>99.99%) in both cases. Regarding the aluminum concentration, it decreased by 90.7% and 99.1% for AMD1 and AMD2, respectively. The value of total sulfur was measured by ICP-OES out of the standard range, and thus sulfate, with a proper dilution was better measured by ion chromatography. Sulfate concentration decreased by 41.9% in the lime treatment and only 6.2% in the calcite treatment.
In the case of arsenic, the removal efficiency was higher than 99.97% using both alkali agents. This result was attributed to the presence of Fe(III), as the mass ratio of Fe/As is higher than 680, which promotes the formation of Fe(OH)3 that adsorbs arsenic [13,17] or the formation of the precipitate scorodite (FeAsO4·2H2O) in small amounts [52].
Other metal ions (Cu, Zn, Mg, Ni, Cd, Pb, Na, and K) reduced their concentrations but not as drastically as former ions. In these cases, some coprecipitation–sorption with the mentioned precipitates could explain these slighter effects.
Regarding pH, for both precipitation treatments, it increased as expected, reaching a value of 6.66 and 4.09 for lime and calcite, respectively. In addition, the oxidation redox potential (ORP) values were 280 and 361 mV for Ca(OH)2 and CaCO3, respectively. These two parameters were considered to establish the arsenic speciation. From theoretical chemical equilibrium diagrams for arsenic [42], the predominant species for arsenic will be H2AsO4-. Finally, the conductivity values after the iron and aluminum precipitation decreased compared to the initial value. This was the expected behavior due to the dissolved ion precipitation, confirmed by a decrease in their initial concentration.

3.2. Adsorbents Characterization

3.2.1. Calcium, Iron, Aluminum and Sulfate Content Determination

The total content of Ca, Fe, Al, and S for every studied adsorbent (commercial and after the AMD treatment) was analyzed and is presented in Table 2.
Nanohematite is mainly composed of ferric oxide. The Fe content is around 52% (see Table 2) though the theoretical value of Fe2O3 is 70%. Additionally, the Bayoxide E-33®, which is based on goethite, has a percentage close to the theoretical value of 62.9% (assuming pure goethite). Previous references for the same adsorbent indicated 52% Fe for Bayoxide [53], thus the Fe% of 63.6 matches very well with the goethite composition. Concerning OxPFe1 and OxPFe2 solids, the 11.7% iron content was 5 to 6 times lower than nanohematite and goethite. The aluminum content of 1.4% in both cases is a consequence of the almost complete elimination of iron and the 90–99% elimination of aluminum in AMD1 and AMD2, respectively. From the iron balance in the process of precipitation (assuming that no iron is present in lime or calcite), it could be estimated that there is a yield of 190 g of precipitate per liter.
In the case of calcium, OxPFe1 exhibits higher values due to the higher amount of lime (with a higher percentage of calcium) compared to calcite. Sulfate elimination is also slightly higher in OxPFe2.

3.2.2. X-ray Diffraction Analyses

The crystal structures of the obtained OxPFe1 and OxPFe2 precipitates were analyzed by XRD. In Figure 3A,B, the X-ray diffraction spectra of both precipitates are shown.
As could be seen, gypsum is clearly detected in both precipitates, as the XRD pattern from the Crystallography Open Database (COD) confirmed. No other crystal structures were identified in the precipitates, but the presence of amorphous phases cannot be discarded.

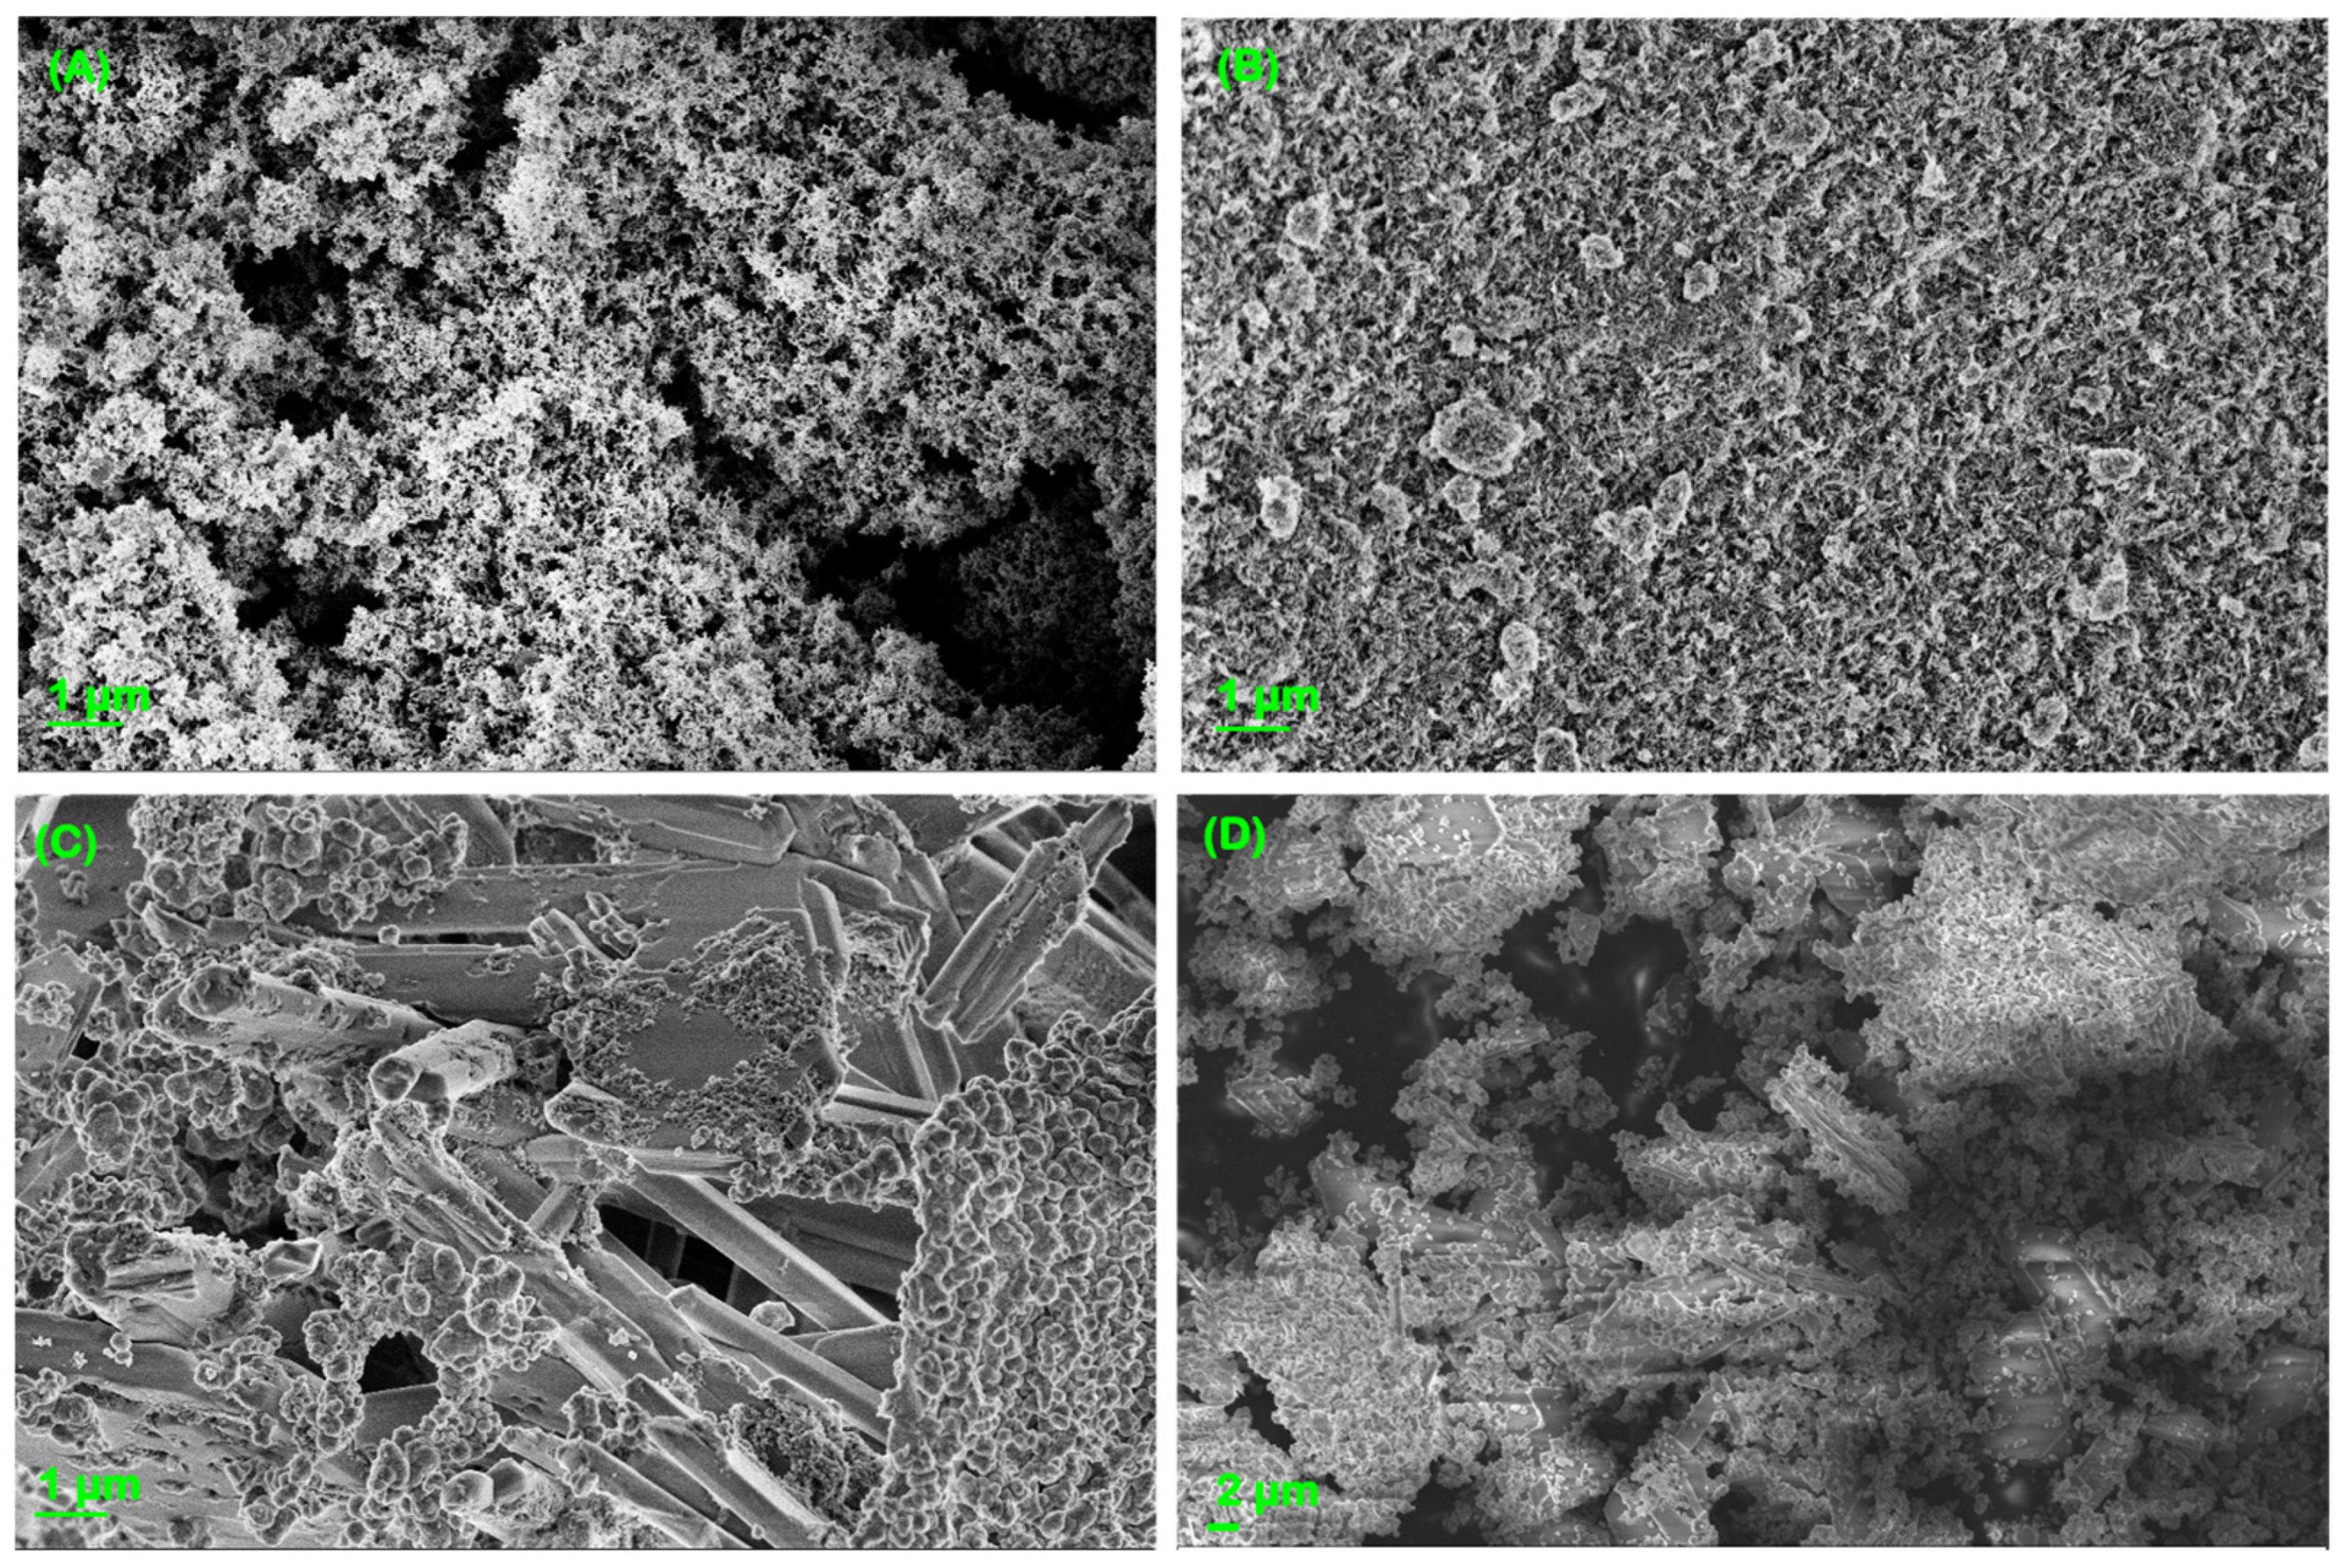
3.2.3. Scanning Electron Microscopy (SEM) and Energy Dispersive X-ray Spectroscopy (EDX) Characterization

In Figure 4A–D, scanning electron micrographs of the nanohematite, Bayoxide®, OxPFe1, and OxPFe2, respectively, are shown.
To determine the surface structure and elemental composition of the commercial adsorbents, and the obtained precipitated solids and have a better comprehension of the adsorption mechanisms that could happen on the solid surface, scanning electron microscopy and energy dispersive X-ray spectroscopy (EDX) characterization were performed (See Figures S1–S4 in Supplementary Materials). Figure 4A corresponds to the hematite structure and is in good agreement with other hematite microscopic characterizations reported in the bibliography [54,55]. The EDX analyses show that the adsorbent elemental composition was iron and oxygen (See Figure S1). As the SEM images confirmed, the hematite aggregates have granular shapes and porous structures that are in the order of nanometers according to the photo scale (See Figure S2). Figure 4B corresponds to a sonicated Bayoxide SEM micrograph, in which can be identified nanoflakes related to the goethite structure. The EDX elemental analysis also shows that they correspond to iron and oxygen, which is in good agreement with the information reported in the literature [56].
Figure 4C,D correspond to the SEM micrographs of OxPFe1 and OxPFe2, respectively. It is important to note that the gypsum needles can be identified in both solids. This information is corroborated by the XRD analysis (see Section 3.2.2). The EDX mapping confirms the presence of Ca, S, Fe, O, and Al elements, which are related to gypsum, and apparently iron hydroxide and other aluminum minerals. Other minoritarian elements were also identified, such as silicon and magnesium (See Figures S3 and S4).
A precipitate with iron hydroxide and also an aluminum phase, which could be jurbanite (AlSO4OH·5H2O) or Al(OH)3, is expected. This will be related to the observation of high concentrations of sulfur in the adsorbents (associated with sulfate), iron, and aluminum, as the ICP-OES confirmed, before and after the treatment using the different alkali agents. Moreover, these solids have been reported in the literature [57].

3.2.4. Adsorbent Particle Size Distribution and pH Point of Zero Charge (pHPZC) Determination

From the granulometry studies, the percentile 10, 50, and 90 values for each adsorbent were obtained (see Table 3).
With the exception of OxPFe2, which was finer than the other solids, the results showed similar sizes in the microscopic range, which means that adsorption studies will not be altered by size effects. As could be seen, the term nano in nanohematite refers to the nanostructure and not to the size.
The pHPZC for every studied solid in this investigation was determined by the immersion technique (see Section 2.5). The point of zero charge has an important effect on arsenic adsorption by determining the net zero charge on the solid surface. The corresponding pHPZC values were calculated (see Figure S5) and are summarized in Table 4. At pH < pHPZC, the adsorbent has a positive charge, attracting more anions, like in the case of arsenate. If the pH > pHPZC, it causes a negative charge surface and, in consequence, unfavorable performance in the adsorption of arsenate. The speciation of arsenate as a function of pH also plays a role in these interactions.

3.2.5. Theoretical Speciation of Supernatant AMD and Mass Balance of Precipitates

The Aqion software 8.2.6 was used to predict the main dissolved species and mineral phases in chemical equilibrium and those phases that have precipitated. For this, the analytical concentration of the total amount of calcium, aluminum, sulfate, and iron, as well as pH and redox potential for AMD1 and AMD2 from Table 1, were introduced as inputs in the software.
As the first step, the software analyzed the charge balance between anions and cations in the input data (solution 1). For both cases (AMD1 and AMD2), the charge balance was not balanced. For that reason, a second solution, where the charge was adjusted by adding more sulfate (10 meq L−1 in the case of AMD1 and 26.9 meq L−1 for AMD2), was introduced. It is important to note that for the Aqion software, the validity and quality of the water analyses depend on the charge-balance error (CBE) and should be less than 5%. After the sulfate compensation, the equilibrium solution was supersaturated, and some minerals precipitated. The precipitation caused the final pH to increase while the redox potential was maintained (solution 3).
AMD1 and AMD2 had as their main dissolved species Ca2+, CaSO4, and SO42−, but differed in the case of aluminum species due to the pH. AMD1 (with a higher pH than AMD2) showed hydrolyzed species (Al(OH)4, Al(OH)3, and Al(OH)2+), while AMD2 showed Al3+ and AlSO4+ dissolved species.
In order to determine the main precipitation phases, the Aqion software calculates the saturation index (SI). If this value was ˃0, the solution was supersaturated, and in consequence, the mineral would precipitate, giving a final SI = 0. Values far away from 0 indicate that precipitation of the phase is unlikely. Due to the uncertainty of the ionic strength and its effect on equilibrium, phases in the range −1 to 1 are described as the most probable phases. AMD1 solutions showed aluminum and iron amorphous hydroxides (Al(OH)3, Fe(OH)3) as precipitated minerals, and AMD2 simulation solutions evidenced gypsum (CaSO4·2H2O) as a precipitated mineral (S = 0).
Additionally, other potential precipitated phases (SI > 0) that were common in AMD1 and AMD2 were goethite (FeOOH), hematite (Fe2O3), and diaspore (AlOOH). PFE-AMD1 solutions also showed alkaline phases such as magnetite (Fe3O4), gibbsite (Al(OH)3, and boehmite (AlOOH), while AMD2 solutions showed jurbanite (AlSO4OH·5H2O). These phases match the dissolved species explained previously. As it could be seen, goethite and hematite were phases that could be present, and that is because they were chosen for arsenic adsorption comparison. As it was observed in the XRD spectra, gypsum was the identified solid for both analyzed AMD samples, confirming the information of the precipitated phase under the experimental conditions discussed above. The precipitation of amorphous phases such as Fe(OH)3 and Al(OH)3 is also compatible with XRD results, which are sensitive to crystalline species.
Thus, considering the information about the theoretical speciation of solid phases and the results of Table 2, a mass balance speciation model based on stoichiometry has been used (see Section 2.6). This model allows us to identify the number of phases in OxPFe1 and OxPFe2.
The mass balance results indicated that Al(OH)3 and Ca(OH)2 (or CaCO3) were estimated as having zero mass % contribution. The absence of Ca(OH)2 and CaCO3 is coherent with the acid-neutral equilibrium pH found in the supernatants, and the lack of Al(OH)3 seems to be due to the competence with jurbanite. The quantified phases obtained by mass balance are shown in Table 5.
The results showed an important percentage of gypsum, which matches the XRD and SEM results and could explain the observed pale orange color of the precipitates. The higher amount of jurbanite in OxPFe2 vs. OxPFe1 is consistent with the lower pH observed in AMD2 vs. AMD1. This effect is described in the literature [57]. The total amount of species accounted for the mass balance was 93.7% of the composition of the solid, with a low error.
The mass balance results of gypsum and jurbanite were the same if Fe2O3 or FeOOH were used instead of Fe(OH)3, but the percentage explained was lower. The jurbanite % was the same if AlOOH was used instead of Al(OH)3.

3.2.6. Batch Adsorption Experiments

In Figure 5, the experimental data for As(V) adsorption using nanohematite, Bayoxide®, OxPFe1, and OxPFe2 are presented. Moreover, the maximum adsorption capacity (qmax) and Langmuir constant (b) for the interaction between As(V) and all the adsorbents and their product (qmax·b), which represent the slope of the linear model at very low concentrations, are shown in Table 5.
It is important to note that in the case of Langmuir adjustment, using all the adsorbents, the reached values of Ce (mg L−1), using As(V) Co values of 50 and 100 µg L−1, were discarded in order to have a better adjustment to the model.
These background Ce values between 1 and 6 µg L−1 could be due to the arsenic release mechanism, describing a possible equilibrium between As releasing and adsorption mechanisms.
Results from Table 6 show better qmax values for OxPFe1, similar qmax results for OxPFe2 and Bayoxide, and lower values for nanohematite.
For arsenate adsorption, values of qmax in the range 0.2–4 mg g−1 for hematite at pH = 4–6 have been described in the literature [42,58]. The use of Bayoxide for arsenate adsorption showed to be optimal at pH 4 to 6, giving values of qmax in the range 20–40 mg g−1 [59]. As can be seen, the values from these references are close to the obtained values.
In the case of precipitates, the composition could be based on ferric hydroxide, as in the case of GFH or gibbsite (aluminum hydroxide), with respective values of qmax = 8.5 mg g−1 and qmax = 4.6 mg g−1 [42]. Similar values have been obtained for the mentioned phases in several reviews about As(V) adsorption [60,61]. It has to be remembered that the precipitates were mixed with gypsum and other phases, and thus, the qmax observed refers to the mass of the mixture instead of a unique phase.
The two precipitates reached saturation qmax at a higher concentration than the commercial adsorbents (b values much lower than the commercial adsorbents).
These results are interesting because they show a different behavior when dealing with high concentrations of arsenic (e.g., AMD) compared to very low concentrations (e.g., low-impacted groundwater or surface water). For very low concentrations, the product qmax·b better expresses the performance of equilibrium adsorption. For this very low concentration case, Table 6 shows that the commercial adsorbents will work better than the obtained precipitates as they present a higher slope.
It must be taken into account that at very low levels of arsenic, there is an additional limitation with the possible arsenic released from the precipitates when changing pH-redox conditions [52], and thus the obtained precipitates cannot be applied to ensure this removal at low levels of arsenic.
Experimental graphics to observe the pH and ORP behavior before and after putting in contact the As(V) solutions and the studied solids are shown in Figure S6 in Supplementary Materials. The results indicate that the pH range in all experiments was 4–6 and the ORP was in the range of 270–400 mV. Taking this information (pH, redox conditions, and total arsenic concentration), the software SPANA (version 2020-June-08) [62] was used to elaborate a fraction diagram (see Figure S7 in the Supplementary Materials). As it could be seen, despite the variation in conditions, the predominant species was H2AsO4 in accordance with previous references [42,52].

3.2.7. Adsorption Mechanisms

The study of the interaction between the aqueous species (H2AsO4) and each different adsorbent under equilibrium conditions has to be assessed to establish adsorption mechanisms. Stumm and Morgan [63] and Drever [64] presented the mechanistic models for the adsorption of inorganic anions onto metal (Me) hydr(oxide) as a surface complexation model that is valid, among other things, for iron (hematite, goethite, and iron hydroxide) and aluminum (γ-alumina, gibbsite) minerals. For these solids, at pH values below pHPZC the speciation of the surface of the adsorbent is neutral (=Me-OH) and partially positively charged (=Me-OH2+), and at pH values above pHPZC, it is neutral (=Me-OH) and partially negatively charged (=Me-O).
In the case of nanohematite (Figure S6 of Supplementary Materials), it could be seen that adsorption takes place mainly at pH above pHPZC, which means that the expected charge of the solid was negative. In the rest of the cases (Bayoxide, OxPFe1, and OxPFe2), the pH was above pHPZC, giving the adsorbents a positive charge. This behavior will explain the lower qmax obtained in nanohematite vs. the rest of the adsorbents because the adsorbent and the arsenic species had the same charge.
The potential mechanisms of complexation for anions as arsenate at pH 4–6 [63] include monodentate complexation, deprotonation of the ligand at the surface, and bidentate complexation:
=Me-OH + H2AsO4 ↔ =Me-H2AsO4 + OH
=Me-H2AsO4 ↔ =Me-HAsO4 + H+
2 (=Me-OH) + H2AsO4 ↔ (=Me)2-H2AsO4+ + 2 OH
Mechanisms involving a combination of expressions (11) and (12) for ferric hydroxide have been reported in the literature at pH 2–6 [65] from FTIR and zeta potential characterization. Reference [66] for akageneite (β-FeOOH) demonstrated, using FTIR and EXAFS, that bidentate complexes (as the ones of expression (13)) were formed only with a pH above 6. A review of the use of FTIR to elucidate the adsorption of arsenates onto several iron oxides [58] showed bidentate complexation for hematite at pH = 4 and for ferrihydrite at acidic-neutral pH.

4. Conclusions

The present paper has shown that AMD precipitates could be useful for As(V) adsorption. The study of the adsorption of the precipitates and two commercial reference adsorbents (nanohematite and Bayoxide) showed that the precipitates exhibit similar or higher qmax values than Bayoxide, but lower b values, which indicate saturation after higher equilibrium concentrations.
In terms of efficiency of As(V) adsorption, this means that at very high concentrations of As(V), these precipitates (after a complementary, detailed study about kinetics, breakthroughs and scaling up) could replace the commercial adsorbents. On the contrary, the results at very low concentrations of As(V) would show better efficiency for commercial adsorbents due to adsorption equilibrium and the fact that some As from AMD precipitates (either adsorbed or forming phases as scorodite) could be released. Gypsum has been identified as the main component of the two precipitates by XRD and EDX, and amorphous iron hydroxide has been estimated as the likely phase described in the literature of coagulation and precipitation. In the case of aluminum phases, mass balance matched well with jurbanite, which was more abundant in the case of OxPeF2 (due to the lower pH of the supernatant) vs. OxPeF1, but speciation of OxPeF1 with software Aqion 8.2.6 pointed to Al(OH)3 phases.
The theoretical arsenic species in the supernatants as well as in the adsorption experiments is H2AsO4, based on many pH and ORP measurements. The adsorption was performed below pHPZC in the case of Bayoxide, OxPeF1, and OxPeF2, and above pHPZC in the case of nanohematite. Under this situation, hematite is expected to have a negative charge as the As species, which could explain the lower qmax values vs. the other adsorbents. Future work will address testing kinetics, scaling up results, and conducting an economic study for comparison with commercial sorbents.

Supplementary Materials

The following supporting information can be downloaded at: https://www.mdpi.com/article/10.3390/w15183179/s1. Table S1: ICP-OES limits of detection for every element concentration presented in Peña del Hierro AMD0, AMD1, and AMD2. Figure S1: Energy dispersive X-ray (EDX) mapping analysis of nanohematite. Figure S2: Energy dispersive X-ray (EDX) mapping analysis of Bayoxide®. Figure S3: Energy dispersive X-ray (EDX) mapping analysis of OxPFe1. Figure S4: Energy dispersive X-ray (EDX) mapping analysis of OxPFe2. Figure S5: Calculated point of zero charge (pHPZC) using the immersion technique for (A) Bayoxide®, (B) nanohematite, (C) OxPFe1, and (D) OxPFe2. Figure S6: pH and oxidation redox potential (ORP) values before and after putting in contact the studied solids and the As(V) solutions (A,B) Bayoxide; (C,D) Nanohematite; (E,F) OxPFe1, and (G,H) OxPFe2. Figure S7. Theoretical aqueous speciation of As(V) as a function of adsorption conditions (redox potential (ORP) = 0.35 V, total As(V) corresponding to 3.7 mg/L).

Author Contributions

Conceptualization, V.M. and K.T.-R.; methodology, V.M.; investigation, K.T.-R.; data curation, K.T.-R.; writing—original draft preparation, K.T.-R., V.M., J.B.-A. and A.F.; writing—review and editing, K.T.-R., V.M., J.B.-A. and A.F.; supervision, V.M. and A.F.; project administration, V.M. and A.F.; funding acquisition, V.M. All authors have read and agreed to the published version of the manuscript.

Funding

This research was funded by MCIN/AEI/10.13039/501100011033/FEDER “Una manera de hacer Europa” with the projects CGL2017-87216-C4-3-R, as well as by the Generalitat de Catalunya (Project 2021SGR00596).

Data Availability Statement

The data presented in this study is available on request from the corresponding author.

Acknowledgments

The authors would like to thank CSIC-IDAEA for XRD characterization and Aguasanta Miguel Sarmiento from the Ciencias de la Tierra Department, Huelva University, for taking the acid mine samples from Huelva Mines.

Conflicts of Interest

The authors declare no conflict of interest. The funders had no role in the design of the study; in the collection, analysis, or interpretation of data, in the writing of the manuscript, or in the decision to publish the results.

References

  1. Guo, H.; Stüben, D.; Berner, Z. Removal of arsenic from aqueous solution by natural siderite and hematite. Appl. Geochem. 2007, 22, 1039–1051. [Google Scholar] [CrossRef]
  2. Su, C.; Jiang, L.; Zhang, W. A review on heavy metal contamination in the soil worldwide: Situation, impact and remediation techniques. Environ. Skept. Crit. 2014, 3, 24–38. [Google Scholar]
  3. Casiot, C.; Egal, M.; Elbaz-Poulichet, F.; Bruneel, O.; Bancon-Montigny, C.; Cordier, M.-A.; Gomez, E.; Aliaume, C. Hydrological and geochemical control of metals and arsenic in a Mediterranean river contaminated by acid mine drainage (the Amous River, France); preliminary assessment of impacts on fish (Leuciscus cephalus). Appl. Geochem. 2009, 24, 787–799. [Google Scholar] [CrossRef]
  4. Sarkar, A.; Paul, B. The global menace of arsenic and its conventional remediation—A critical review. Chemosphere 2016, 158, 37–49. [Google Scholar] [CrossRef]
  5. Singh, R.; Singh, S.; Parihar, P.; Singh, V.P.; Prasad, S.M. Arsenic contamination, consequences and remediation techniques: A review. Ecotoxicol. Environ. Saf. 2015, 112, 247–270. [Google Scholar] [CrossRef]
  6. Paikaray, S. Arsenic Geochemistry of Acid Mine Drainage. Mine Water Environ. 2015, 34, 181–196. [Google Scholar] [CrossRef]
  7. Martí, V.; Jubany, I.; Fernández-Rojo, L.; Ribas, D.; Benito, J.A.; Diéguez, B.; Ginesta, A. Improvement of As(V) Adsorption by Reduction of Granular to Micro-Sized Ferric Hydroxide. Processes 2022, 10, 1029. [Google Scholar] [CrossRef]
  8. Giles, D.E.; Mohapatra, M.; Issa, T.B.; Anand, S.; Singh, P. Iron and aluminium based adsorption strategies for removing arsenic from water. J. Environ. Manag. 2011, 92, 3011–3022. [Google Scholar] [CrossRef]
  9. Mamindy-Pajany, Y.; Hurel, C.; Marmier, N.; Roméo, M. Arsenic adsorption onto hematite and goethite. Comptes Rendus Chim. 2009, 12, 876–881. [Google Scholar] [CrossRef]
  10. Alka, S.; Shahir, S.; Ibrahim, N.; Ndejiko, M.J.; Vo, D.-V.N.; Manan, F.A. Arsenic removal technologies and future trends: A mini review. J. Clean. Prod. 2021, 278, 123805. [Google Scholar] [CrossRef]
  11. WHO. Guidelines for Drinking-Water Quality, 4th ed.; World Health Organization: Geneva, Switzerland, 2017; ISBN 978-92-4-154995-0.
  12. The European Union Parliament. Directive (EU) 2020/2184 of the European Parliament. Off. J. Eur. Union 2020, 435, 1–62. [Google Scholar]
  13. Bissen, M.; Frimmel, F.H. Arsenic— a Review. Part II: Oxidation of Arsenic and its Removal in Water Treatment. Acta Hydrochim. Hydrobiol. 2003, 31, 97–107. [Google Scholar] [CrossRef]
  14. Liu, R.; Qu, J. Review on heterogeneous oxidation and adsorption for arsenic removal from drinking water. J. Environ. Sci. 2021, 110, 178–188. [Google Scholar] [CrossRef] [PubMed]
  15. Song, S.; Lopez-Valdivieso, A.; Hernandez-Campos, D.J.; Peng, C.; Monroy-Fernandez, M.G.; Razo-Soto, I. Arsenic removal from high-arsenic water by enhanced coagulation with ferric ions and coarse calcite. Water Res. 2006, 40, 364–372. [Google Scholar] [CrossRef] [PubMed]
  16. Lakshmanan, D.; Clifford, D.A.; Samanta, G. Comparative study of arsenic removal by iron using electrocoagulation and chemical coagulation. Water Res. 2010, 44, 5641–5652. [Google Scholar] [CrossRef] [PubMed]
  17. Nur, T.; Loganathan, P.; Ahmed, M.B.; Johir, M.A.H.; Nguyen, T.V.; Vigneswaran, S. Removing arsenic from water by coprecipitation with iron: Effect of arsenic and iron concentrations and adsorbent incorporation. Chemosphere 2019, 226, 431–438. [Google Scholar] [CrossRef]
  18. Wang, J.W.; Bejan, D.; Bunce, N.J. Removal of Arsenic from Synthetic Acid Mine Drainage by Electrochemical pH Adjustment and Coprecipitation with Iron Hydroxide. Environ. Sci. Technol. 2003, 37, 4500–4506. [Google Scholar] [CrossRef]
  19. Marino, T.; Figoli, A. Arsenic Removal by Liquid Membranes. Membranes 2015, 5, 150–167. [Google Scholar] [CrossRef]
  20. He, Y.; Liu, J.; Han, G.; Chung, T.-S. Novel thin-film composite nanofiltration membranes consisting of a zwitterionic co-polymer for selenium and arsenic removal. J. Memb. Sci. 2018, 555, 299–306. [Google Scholar] [CrossRef]
  21. Akin, I.; Arslan, G.; Tor, A.; Cengeloglu, Y.; Ersoz, M. Removal of arsenate [As(V)] and arsenite [As(III)] from water by SWHR and BW-30 reverse osmosis. Desalination 2011, 281, 88–92. [Google Scholar] [CrossRef]
  22. Chen, A.S.C.; Wang, L.; Sorg, T.J.; Lytle, D.A. Removing arsenic and co-occurring contaminants from drinking water by full-scale ion exchange and point-of-use/point-of-entry reverse osmosis systems. Water Res. 2020, 172, 115455. [Google Scholar] [CrossRef]
  23. Aliaskari, M.; Schäfer, A.I. Nitrate, arsenic and fluoride removal by electrodialysis from brackish groundwater. Water Res. 2021, 190, 116683. [Google Scholar] [CrossRef] [PubMed]
  24. Hansen, H.K.; Gutiérrez, C.; Leiva Gonzalez, J.; Lazo, A.; Hansen, M.E.; Lazo, P.; Ottosen, L.M.; Ortiz, R. Combined Electrodialysis and Electrocoagulation as Treatment for Industrial Wastewater Containing Arsenic and Copper. Membranes 2023, 13, 264. [Google Scholar] [CrossRef] [PubMed]
  25. Lee, C.-G.; Alvarez, P.J.J.; Nam, A.; Park, S.-J.; Do, T.; Choi, U.-S.; Lee, S.-H. Arsenic(V) removal using an amine-doped acrylic ion exchange fiber: Kinetic, equilibrium, and regeneration studies. J. Hazard. Mater. 2017, 325, 223–229. [Google Scholar] [CrossRef] [PubMed]
  26. Rathi, B.S.; Kumar, P.S.; Ponprasath, R.; Rohan, K.; Jahnavi, N. An effective separation of toxic arsenic from aquatic environment using electrochemical ion exchange process. J. Hazard. Mater. 2021, 412, 125240. [Google Scholar] [CrossRef]
  27. Younger, P.L.; Banwart, S.A.; Hedin, R.S. Mine Water; Environmental Pollution; Springer: Dordrecht, The Netherlands, 2002; Volume 5, ISBN 978-1-4020-0138-3. [Google Scholar]
  28. Trumm, D. Selection of active and passive treatment systems for AMD—Flow charts for New Zealand conditions. N. Z. J. Geol. Geophys. 2010, 53, 195–210. [Google Scholar] [CrossRef]
  29. Mohapatra, D.; Mishra, D.; Chaudhury, G.R.; Das, R.P. Arsenic adsorption mechanism on clay minerals and its dependence on temperature. Korean J. Chem. Eng. 2007, 24, 426–430. [Google Scholar] [CrossRef]
  30. Meez, E.; Tolkou, A.K.; Giannakoudakis, D.A.; Katsoyiannis, I.A.; Kyzas, G.Z. Activated Carbons for Arsenic Removal from Natural Waters and Wastewaters: A Review. Water 2021, 13, 2982. [Google Scholar] [CrossRef]
  31. Asadullah, M.; Jahan, I.; Ahmed, M.B.; Adawiyah, P.; Malek, N.H.; Rahman, M.S. Preparation of microporous activated carbon and its modification for arsenic removal from water. J. Ind. Eng. Chem. 2014, 20, 887–896. [Google Scholar] [CrossRef]
  32. Foroutan, R.; Mohammadi, R.; Adeleye, A.S.; Farjadfard, S.; Esvandi, Z.; Arfaeinia, H.; Sorial, G.A.; Ramavandi, B.; Sahebi, S. Efficient arsenic(V) removal from contaminated water using natural clay and clay composite adsorbents. Environ. Sci. Pollut. Res. 2019, 26, 29748–29762. [Google Scholar] [CrossRef]
  33. Chutia, P.; Kato, S.; Kojima, T.; Satokawa, S. Arsenic adsorption from aqueous solution on synthetic zeolites. J. Hazard. Mater. 2009, 162, 440–447. [Google Scholar] [CrossRef] [PubMed]
  34. Jeon, C.-S.; Baek, K.; Park, J.-K.; Oh, Y.-K.; Lee, S.-D. Adsorption characteristics of As(V) on iron-coated zeolite. J. Hazard. Mater. 2009, 163, 804–808. [Google Scholar] [CrossRef] [PubMed]
  35. Dias, A.C.; Fontes, M.P.F. Arsenic (V) removal from water using hydrotalcites as adsorbents: A critical review. Appl. Clay Sci. 2020, 191, 105615. [Google Scholar] [CrossRef]
  36. Gillman, G.P. A simple technology for arsenic removal from drinking water using hydrotalcite. Sci. Total Environ. 2006, 366, 926–931. [Google Scholar] [CrossRef]
  37. Zhu, M.; Paul, K.W.; Kubicki, J.D.; Sparks, D.L. Quantum Chemical Study of Arsenic (III, V) Adsorption on Mn-Oxides: Implications for Arsenic(III) Oxidation. Environ. Sci. Technol. 2009, 43, 6655–6661. [Google Scholar] [CrossRef]
  38. Youngran, J.; FAN, M.; Van Leeuwen, J.; Belczyk, J.F. Effect of competing solutes on arsenic(V) adsorption using iron and aluminum oxides. J. Environ. Sci. 2007, 19, 910–919. [Google Scholar] [CrossRef]
  39. Siddiqui, S.I.; Chaudhry, S.A. Iron oxide and its modified forms as an adsorbent for arsenic removal: A comprehensive recent advancement. Process Saf. Environ. Prot. 2017, 111, 592–626. [Google Scholar] [CrossRef]
  40. Gallegos-Garcia, M.; Ramírez-Muñiz, K.; Song, S. Arsenic Removal from Water by Adsorption Using Iron Oxide Minerals as Adsorbents: A Review. Miner. Process. Extr. Metall. Rev. 2012, 33, 301–315. [Google Scholar] [CrossRef]
  41. Abdallah, E.A.M.; Gagnon, G.A. Arsenic removal from groundwater through iron oxyhydroxide coated waste productsA paper submitted to the Journal of Environmental Engineering and Science. Can. J. Civ. Eng. 2009, 36, 881–888. [Google Scholar] [CrossRef]
  42. Mohan, D.; Pittman, C.U. Arsenic removal from water/wastewater using adsorbents—A critical review. J. Hazard. Mater. 2007, 142, 1–53. [Google Scholar] [CrossRef]
  43. Kim, L.; Thanh, N.T.; Toan, P.V.; Minh, H.V.T.; Kumar, P. Removal of Arsenic in Groundwater Using Fe(III) Oxyhydroxide Coated Sand: A Case Study in Mekong Delta, Vietnam. Hydrology 2022, 9, 15. [Google Scholar] [CrossRef]
  44. Habuda-Stanić, M.; Kalajdžić, B.; Kuleš, M.; Velić, N. Arsenite and arsenate sorption by hydrous ferric oxide/polymeric material. Desalination 2008, 229, 1–9. [Google Scholar] [CrossRef]
  45. Laksmipathiraj, P.; Narasimhan, B.; Prabhakar, S.; Bhaskarraju, G. Adsorption of arsenate on synthetic goethite from aqueous solutions. J. Hazard. Mater. 2006, 136, 281–287. [Google Scholar] [CrossRef] [PubMed]
  46. Luengo, C.; Brigante, M.; Avena, M. Adsorption kinetics of phosphate and arsenate on goethite: A comparative study. J. Colloid Interface Sci. 2007, 311, 354–360. [Google Scholar] [CrossRef] [PubMed]
  47. Mamindy-Pajany, Y.; Hurel, C.; Marmier, N.; Roméo, M. Arsenic (V) adsorption from aqueous solution onto goethite, hematite, magnetite and zero-valent iron: Effects of pH, concentration and reversibility. Desalination 2011, 281, 93–99. [Google Scholar] [CrossRef]
  48. Kunaschk, M.; Schmalz, V.; Dietrich, N.; Dittmar, T.; Worch, E. Novel regeneration method for phosphate loaded granular ferric (hydr)oxide—A contribution to phosphorus recycling. Water Res. 2015, 71, 219–226. [Google Scholar] [CrossRef]
  49. Nieto, J.M.; Sarmiento, A.M.; Olías, M.; Canovas, C.R.; Riba, I.; Kalman, J.; Delvalls, T.A. Acid mine drainage pollution in the Tinto and Odiel rivers (Iberian Pyrite Belt, SW Spain) and bioavailability of the transported metals to the Huelva Estuary. Environ. Int. 2007, 33, 445–455. [Google Scholar] [CrossRef]
  50. Fiol, N.; Villaescusa, I. Determination of sorbent point zero charge: Usefulness in sorption studies. Environ. Chem. Lett. 2009, 7, 79–84. [Google Scholar] [CrossRef]
  51. Aqion Software 2023. Available online: https://www.aqion.de (accessed on 10 February 2023).
  52. Lu, P.; Zhu, C. Arsenic Eh–pH diagrams at 25 °C and 1 bar. Environ. Earth Sci. 2011, 62, 1673–1683. [Google Scholar] [CrossRef]
  53. Kalaitzidou, K.; Mitrakas, M.; Raptopoulou, C.; Tolkou, A.; Palasantza, P.-A.; Zouboulis, A. Pilot-Scale Phosphate Recovery from Secondary Wastewater Effluents. Environ. Process. 2016, 3, 5–22. [Google Scholar] [CrossRef]
  54. Qureshi, A.A.; Javed, S.; Javed, H.M.A.; Jamshaid, M.; Ali, U.; Akram, M.A. Systematic Investigation of Structural, Morphological, Thermal, Optoelectronic, and Magnetic Properties of High-Purity Hematite/Magnetite Nanoparticles for Optoelectronics. Nanomaterials 2022, 12, 1635. [Google Scholar] [CrossRef]
  55. Lian, J.; Duan, X.; Ma, J.; Peng, P.; Kim, T.; Zheng, W. Hematite (α-Fe2O3) with Various Morphologies: Ionic Liquid-Assisted Synthesis, Formation Mechanism, and Properties. ACS Nano 2009, 3, 3749–3761. [Google Scholar] [CrossRef]
  56. Lalley, J.; Han, C.; Mohan, G.R.; Dionysiou, D.D.; Speth, T.F.; Garland, J.; Nadagouda, M.N. Phosphate removal using modified Bayoxide® E33 adsorption media. Environ. Sci. Water Res. Technol. 2015, 1, 96–107. [Google Scholar] [CrossRef]
  57. Domènech, C.; Ayora, C.; de Pablo, J. Sludge weathering and mobility of contaminants in soil affected by the Aznalcollar tailing dam spill (SW Spain). Chem. Geol. 2002, 190, 355–370. [Google Scholar] [CrossRef]
  58. Di Iorio, E.; Cho, H.G.; Liu, Y.; Cheng, Z.; Angelico, R.; Colombo, C. Arsenate retention mechanisms on hematite with different morphologies evaluated using AFM, TEM measurements and vibrational spectroscopy. Geochim. Cosmochim. Acta 2018, 237, 155–170. [Google Scholar] [CrossRef]
  59. Lin, T.F.; Liu, C.C.; Hsieh, W.H. Adsorption kinetics and equilibrium of arsenic onto an iron-based adsorbent and an ion exchange resin. Water Supply 2006, 6, 201–207. [Google Scholar] [CrossRef]
  60. Jagirani, M.S.; Balouch, A.; Abdullah; Mahar, A.M.; Mustafai, F.A.; Rajar, K.; Tunio, A.; Sabir, S.; Samoon, M.K. Review: Arsenic Remediation by Synthetic and Natural Adsorbents. Pak. J. Anal. Environ. Chem. 2017, 18, 18–36. [Google Scholar] [CrossRef]
  61. Nicomel, N.; Leus, K.; Folens, K.; Van Der Voort, P.; Du Laing, G. Technologies for Arsenic Removal from Water: Current Status and Future Perspectives. Int. J. Environ. Res. Public Health 2015, 13, 62. [Google Scholar] [CrossRef] [PubMed]
  62. Puigdomènech, I.; Colàs, E.; Grivé, M.; Campos, I.; García, D. A tool to draw chemical equilibrium diagrams using SIT: Applications to geochemical systems and radionuclide solubility. MRS Proc. 2014, 1665, 111–116. [Google Scholar] [CrossRef]
  63. Stumm, W.; Morgan, J.J. Aquatic Chemistry: An Introduction Emphasizing Chemical Equilibria in Natural Waters, 2nd ed.; Wiley-VCH Verlag GmbH: New York, NY, USA, 1981; ISBN 0471091731. [Google Scholar]
  64. Drever, J.I. The Geochemistry of Natural Waters, 3rd ed.; Prentice Hall: Englewood Cliffs, NJ, USA, 1997; ISBN 0132727900. [Google Scholar]
  65. Pham, T.T.; Ngo, H.H.; Tran, V.S.; Nguyen, M.K. Removal of As (V) from the aqueous solution by a modified granular ferric hydroxide adsorbent. Sci. Total Environ. 2020, 706, 135947. [Google Scholar] [CrossRef]
  66. Guan, X.-H.; Wang, J.; Chusuei, C.C. Removal of arsenic from water using granular ferric hydroxide: Macroscopic and microscopic studies. J. Hazard. Mater. 2008, 156, 178–185. [Google Scholar] [CrossRef] [PubMed]
Figure 1. (A) Eastern part of the Iberian Pyrite Belt map with sampling points, stream gauge stations, rain gauges, and mines. In blue: Tharsis, Cueva de Mora and Peña del Hierro mines. H1 and H2 correspond to two stations for chemical and geochemical metal characterization. Adapted from Nieto et al. [49] (B) Peña del Hierro mines satellite view.
Water 15 03179 g001
Figure 2. OxPFe1 and OxPFe2 precipitate obtention using AMD’s schema.
Water 15 03179 g002
Figure 3. X-Ray diffraction spectra were obtained for (A) OxPFe1 solid (using Ca(OH)2 as an alkali agent) and (B) OxPFe2 solid (using CaCO3 as an alkali agent).
Water 15 03179 g003
Figure 4. Scanning electron micrographs of (A) nanohematite, (B) Ultrasonicated Bayoxide®, (C) OxFPe1, and (D) OxPFe2.
Water 15 03179 g004
Figure 5. Experimental data and Langmuir adjustment for As(V) adsorption isotherms using (A) Nanohematite, (B) Bayoxide®, (C) OxPFe1, and (D) OXPFe2.
Water 15 03179 g005
Table 1. Analytical parameters (elements and sulfate dissolved concentration, pH, redox potential, and conductivity) determination of raw PFe-AMD (AMD0) and treated PFe-AMD using Ca(OH)2 (AMD1) or CaCO3 (AMD2).
Analytical ParameterPFe-AMD0
C (mg L−1)
PFe-AMD1
C (mg L−1)
PFe-AMD2
C (mg L−1)
Fe22,1460.290.49
Al2379.54221.1320.65
S519.98 *195.98 *339.63 *
Mg357.2232.236.65
Cu96.7436.0831.65
Ca78.64390.60628.56
Zn71.2739.7036.99
As32.360.010.01
Ni1.130.340.32
Cd0.580.110.11
Pb0.570.010.004
Na38.234.036.13
K29.183.182.25
SO42−350.67203.47328.87
pH1.086.664.09
ORP (mV)640280361
Conductivity (mS cm−1)49.554.025.28
Note: * Out of range measurement.
Table 2. Total calcium, iron, aluminum, and sulfate content analyzed for the Nanohematite, Bayoxide, OxPFe1, and OxPFe2 solids.
Sample/ElementCa (%)Fe (%)Al (%)S (%)
Nanohematite<0.552.2<0.5NA *
Bayoxide®<0.563.6<0.5NA *
OxPFe114.111.71.413.6
OxPFe212.311.71.414.3
Note: * NA: Not applicable.
Table 3. Percentiles d10, d50, and d90 of the studied adsorbents.
Adsorbentd10 (µm)d50 (µm)d90 (µm)
Nanohematite3.66 ± 0.0819.31 ± 0.4447.20 ± 3.14
Bayoxide®1.79 ± 0.0215.30 ± 0.2834.50 ± 0.88
OxPFe12.27 ± 0.0510.40 ± 0.3634.80 ± 1.73
OxPFe20.883 ± 0.0022.08 ± 0.0127.70 ± 0.54
Table 4. pHPZC Values Estimated for the Adsorbents Using the Immersion Technique.
AdsorbentpHPZCValidity Range *
Nanohematite4.23–10
Bayoxide®8.24–10
OxPFe15.73–11
OxPFe25.83–10
Note: * Range in which exists linearity between ΔpH vs. initial pH.
Table 5. Stoichiometric mass balance model to explain phases in OxPFe1 and OxPFe2 solids.
Phases (Mass %)GypsumFe(OH)3JurbaniteTotal (%)SSerr
OxPFe160.722.410.097.3<0.01
OxPFe254.022.417.397.30.56
Table 6. Maximum adsorption capacity (qmax), Langmuir constant (b), and its product were estimated using the nonlinear regression of the adsorption isotherm experimental data.
Adsorbentqmax (mg g−1)b (L mg−1)SSerrqmax·b (L g−1)
Nanohematite5.06149.620.67757
Bayoxide®17.4024.949.21434
OxPFe124.849.0429.9224
OxPFe217.954.8120.986
Disclaimer/Publisher’s Note: The statements, opinions and data contained in all publications are solely those of the individual author(s) and contributor(s) and not of MDPI and/or the editor(s). MDPI and/or the editor(s) disclaim responsibility for any injury to people or property resulting from any ideas, methods, instructions or products referred to in the content.

