Article

Glass Eel Restocking Experiments in Typologically Different Upland Rivers: How Much Have We Learned about the Importance of Recipient Habitats?

1
Laboratory of Fish Demography and Hydroecology, Management of Aquatic Resources and Aquaculture Unit, Freshwater and Oceanic Science Unit of Research-FOCUS, University of Liège, 22 Quai E. Van Beneden, B-4020 Liège, Belgium
2
Agriculture, European Policies and International Agreements Department, SPWARNE-DPEA-Public Service of Wallonia, 15 Avenue Prince de Liège, B-5100 Jambes, Belgium
3
Agriculture, Natural Resources & Environment, Non-Navigable Water Department, SPWARNE-DDRCB-Public Service of Wallonia, 15 Avenue Prince de Liège, B-5100 Jambes, Belgium
4
Fisheries Service, SPWARNE-DNF-Public Service of Wallonia, 15 Avenue Prince de Liège, B-5100 Jambes, Belgium
5
Agriculture, Natural Ressources & Environnement, Wildlife & Forestry Department, SPWARNE-DNF-Public Service of Wallonia, 15 Avenue Prince de Liège, B-5100 Jambes, Belgium
*
Author to whom correspondence should be addressed.
Water 2023, 15(17), 3133; https://doi.org/10.3390/w15173133
Submission received: 2 June 2023 / Revised: 30 July 2023 / Accepted: 28 August 2023 / Published: 31 August 2023
(This article belongs to the Special Issue Freshwater Biodiversity: Conservation and Management)

Abstract

:
The efficiency of glass eel restocking as a conservation measure to restore the altered local eel stocks has never been evaluated by integrating the dimension of typological diversity of freshwater habitats in eel recruitment performance in terms of the abundance, density, growth, silvering, survival, catchability and eel yields. Here, we used the electrofishing method during a 6-year study to catch eels, and the most appropriate Jolly–Seber model was applied to estimate the demographic parameters in open populations. We found that most eels were yellow eels in the growth phase with a low abundance (eels 3+: 2.8% and eels 5+: 7.1%) of silver eels, which were only males at the MII migrating phase. Eel recruitment performance varied between sector/river habitats. Restocked eels showed annually positive allometric growth type with good length increments and better condition factors. They have survived in almost all sectors with a survival rate > 0.810. Eels were more abundant and denser (maximum 0.128 individuals m−2) in one sector with a high quality of habitats offering optimal living conditions in terms of the protection against predators and water flow, settlement and food availability, as revealed by it having the highest eel yields. In contrast, no eels were found in two sectors whose habitats offered a high threat of predation, poor burial properties and insufficient protection against water flow. Sector/river habitats play a key role in the success of yellow eel production and certainly, over time, future genitor production. This study provides recommendations for the management of eels and their habitats during restocking aimed at the conservation of this threatened species.

1. Introduction

Anguilla anguilla, commonly known as the European eel, is a critically threatened fish characterized by its panmictic and semelparous nature [1,2,3,4]. It breeds in the Sargasso Sea, exhibits remarkable adaptability with respect to phenotypic traits and colonizes an extensive spectrum of habitats encompassing marine, brackish and freshwaters, which potentially affects its growth and survival [5,6,7,8]. The prevalence of the eel, which exceeds that of most other teleost fish, can be attributed to its exceptional migratory adaptability as a marine species that originally experienced a continental developmental phase in which diadromy was not mandatory [7,9,10]. Significant numbers of eels stay and grow in the marine and brackish habitats for their entire life and never enter or live in freshwater habitats [1,7,11]. The eel’s migratory plasticity would be a fitness compromise between the pursuit of the most productive environments, which offer ample space, shelter and food, and the active avoidance of the intra- and interspecific competition, favoring movement towards less productive habitats to minimize the impact of competition on their overall fitness [10,12,13,14]. Marine and brackish habitats allow better eel growth than freshwater [15,16]. In contrast, freshwater river/stream habitats allow better eel survival because there is generally less risk of inter- and intraspecific agonistic interaction and predation, and eel density is also lower there due to the population diffusion process [17,18,19,20]. The river/stream ecosystems have an increased shelter availability, providing better burial conditions for increased eel protection [21,22,23,24]. In freshwater habitats, however, eels frequently encounter detrimental factors that include increased exposure to pathogens and pollutants, difficulties in downstream migration, mortality stemming from turbine operation and decreased growth rates [20,23,25,26,27,28].
Since the 1980s, stocks of this species in its whole distribution area dramatically declined, raising serious concerns, which led to its classification as critically endangered [29]. There exist multiple factors that contribute to the eel decline, which may cumulatively intensify the adverse impact. These include overfishing, obstacles to both up- and downstream migration, habitat degradation, pollution and contamination by pathogens during its growing phase [30,31,32,33]. As the species colonizes freshwater habitats through population density pressure, this decline is more perceptible in inland zones distant from coastal regions [34,35]. This phenomenon can be ascribed to a substantial decrease in juvenile recruitments in marine environments, coupled with the cessation of the young eels’ upstream colonization process. Within the Belgian Meuse basin, situated over 320 km upstream of the North Sea, there has been a notable decrease in the local eel stocks. The numbers of wild yellow eels that migrate through the Dutch Meuse from the sea and ascend towards the river’s headwaters have exhibited a significant decline over the period of 1992 to 2020 [22,23,24,28,35,36]. Several streams that formerly harbored prolific eel stocks have become depleted of eels as a result of the reduction in glass eel recruitment within the North Sea [37]. It is likely that the eels in the Belgian Meuse basin will become extinct within the next decade if restocking measures are not implemented [24,28,36]. Consequently, optimizing the restocking of eels is imperative, as is comprehending the benefits of this approach in the context of typological heterogeneity in freshwater river/stream habitats.
As the species has not yet been bred in captivity [38], eel restocking remains dependent on the wild-caught young stages of eels like elvers and glass eels. These are translocated from areas with elevated eel densities to rivers/streams that have minimal or no natural eel colonization [21,39,40,41,42,43,44,45]. The efficacy of restocking has been a topic of debate. However, for nations that are geographically distant from the ocean and situated within the species’ natural boundaries, restocking appears to be the only solution to enhance the eel stocks in freshwater ecosystems [22,24,28,44,45,46]. Some scientific works have employed the electrofishing methodology to capture the eels and have reported the success of growth, survival, sex ratio, quality and health of the individuals [21,22,24,28,40,44,45,46]. Other studies, using the telemetry method, have stated the success of restocked eels in mobility, habitat utilization, resilience after extreme environmental events, ubiquity and sedentary lifestyles [22,47]. Restocking for scientific objectives has been implemented in Belgium/Wallonia, along with persistent surveillance of the reintroduced eels through the utilization of electrofishing and telemetry techniques. The application of eel monitoring mechanisms has identified high growth and survival rates, stocks composed mainly of females and a low prevalence and load of pathogens and contaminants [22,23,24,28,46]. However, these results were gained without integrating the dimension of the typological diversity of freshwater habitats.
For this reason, many biological aspects of the species after restocking in freshwater river/stream habitats—such as initiation of the silvering process, density, growth and demographic parameters, e.g., survival, catchability and yields in eel recruitment—are still insufficiently understood, especially when including the dimension of typologically different freshwater habitats. Yet, they hold significant implications for implementing conservation approaches for this threatened fish. This investigation was conducted over a 6-year period since the glass eel release in 2017; it included six rivers, which are typologically distinct on the hydromorphological, physicochemical and trophic levels and which were regularly fished to assess the success levels of the local eel stock restoration. More specifically, it aimed at understanding sector/river levels and time/age after restocking to (1) evaluate the eel abundance and density; (2) characterize the growth performance; (3) precisely determine the onset age of the biological phenomenon called “silvering”; and (4) examine the riverine habitat impacts on the eel demographic parameters including the survival, catchability and yields in the eel recruitment assessed using the adequate Jolly–Seber model to estimate the local eel stocks in open populations [23,28].

2. Materials and Methods
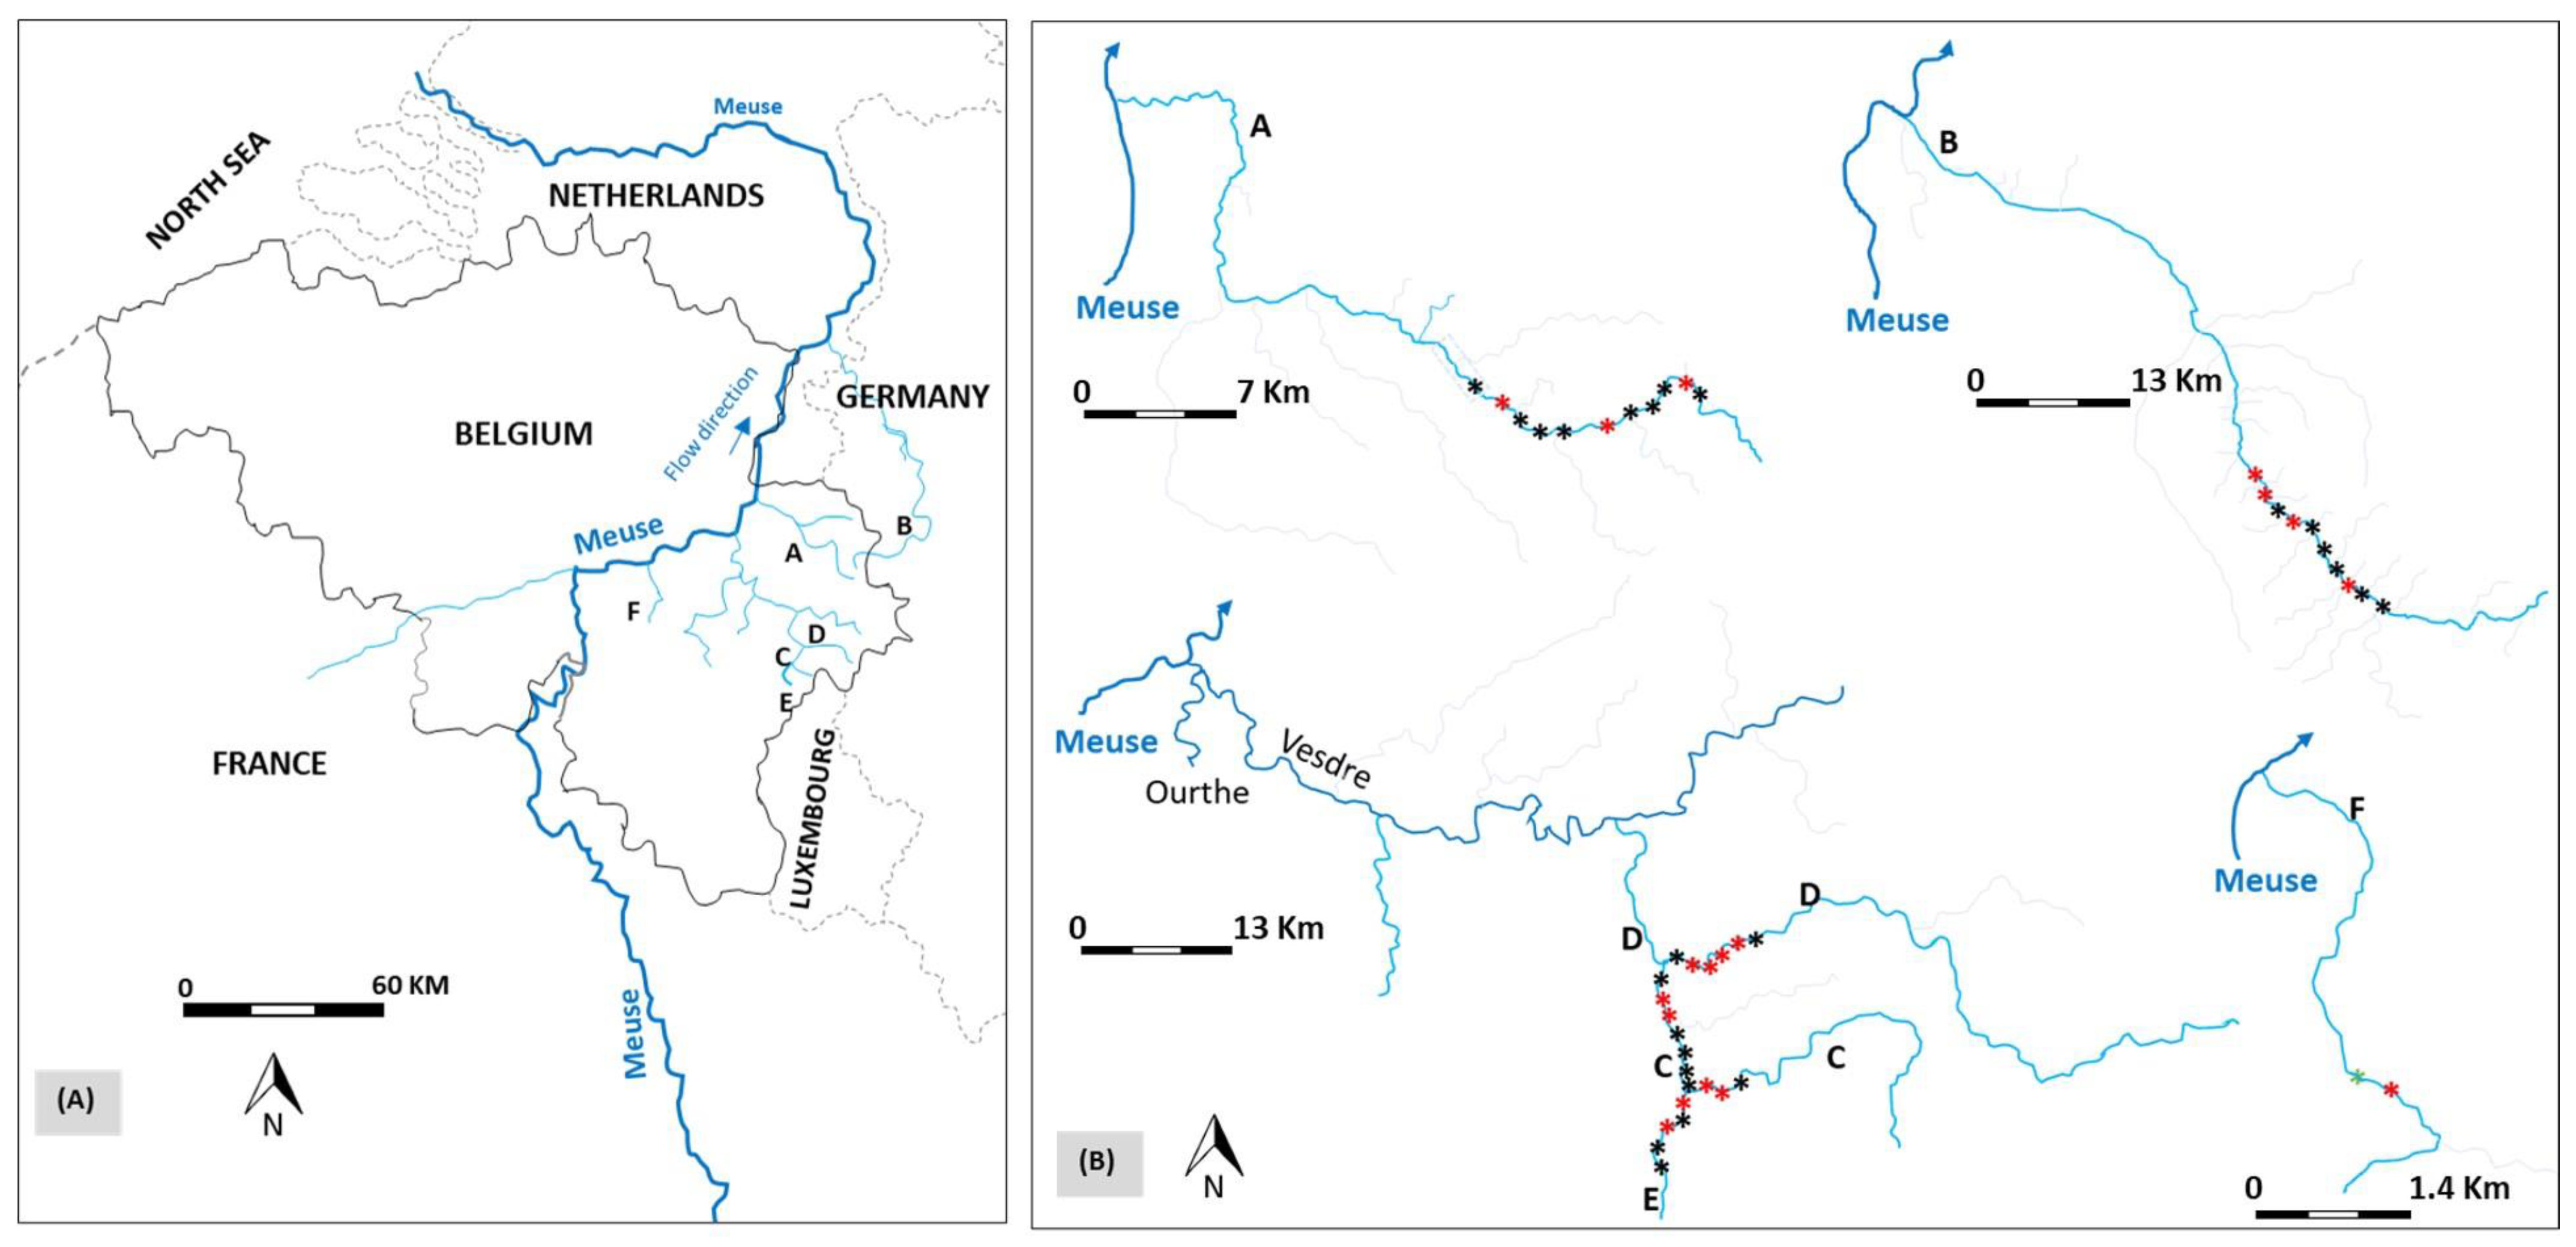
2.1. Study Area

The study was carried out in Southern Belgium, in the six following upland rivers: Berwinne (A), Gueule (B), Wayai (C), Hoegne (D), Winamplanche (E) and Oxhe (F) (Figure 1). They belong to the Belgian Meuse River and were selected to receive glass eels on the basis of their typological difference on the hydromorphological, physicochemical and trophic levels, as described by our previous research [24,47]. The experimental sites were situated at a distance exceeding 320 km from the North Sea. The thermal patterns of these rivers exhibit regularity, with temperatures exceeding 8 °C from April to the end of October [22,24,48,49]. Furthermore, the glass eel stage is absent, and there is a drastic decline, if not total absence, of yellow eels [35,36,50,51,52]. Rivers A and F are direct tributaries of the Meuse, alkaline, typical of the brown trout Salmo trutta fish zone, have a similar width and exhibit morphodynamic units of runs and rapids alternating with pools [24,47,53,54]. The occurrence of large stones (particle diameter 13–25 cm) and blocks (26–102 cm) is prevalent in eutrophic river A, whereas in oligotrophic river F, large and fine (6.4–12.8 cm) stones were found to be more frequent [54]. The eutrophic, alkaline and deep river B flows into the Meuse in the Netherlands, displays high species richness, abundant fine stone and coarse gravel (0.8–1.6 cm) substrates, high vegetation cover and runs and rapids alternating with lentic channels and is typical of the lower grayling Thymallus thymallus fish zone [50]. Rivers C, D and E are oligotrophic with runs and rapids, hosting dense brown trout populations that prey on young eels [24]. River E flows into C, which is a tributary of D, then the rivers Vesdre, Ourthe and finally Meuse in Belgium. Rivers C and D are typical upper and lower brown trout fish zones, respectively [53], with boulders (>102.4 cm) and blocks as the main substrates [54]. Boulders and coarse pebbles dominate in E which is typical of the brown trout zone [53,54]. D and E have acidic properties due to their alkaline-poor substrates.

2.2. Restocking Using Glass Eels

On the date of arrival, 21 March 2017, 17.3 kg of glass eels captured on the French Atlantic coast were released into the selected rivers. These glass eels had the following characteristics: pigment stages from VB to VIA2, total length (mean ± standard error) of 67.0 ± 3.6 mm, weight of 0.23 ± 0.04 g, Fulton’s condition factor of 0.0007 ± 0.00009 and free of pathogens [20,24,55,56]. Five rivers, A to E, each had 5 to 11 release sites (density: 1.07 ± 0.37 ind. m−2) spaced at least 250 m apart, of which 2 to 4 restocked sites were surveyed. After a full day in the field, river F had received the rest of the glass eels which were released at a single site (3.75 ind. m−2). This site was investigated together with an unrestocked neighboring site. We had a total of 43 restocked sites and 19 fished sites. All of these sites were chosen because of accessibility on foot, efficient electrofishing and suitable eel habitat presence [22,24,46].

2.3. Eel Collection and Tagging

Restocked eels were collected in autumn by electrofishing (EFKO, 3.0 kVA FEG 5000, 150–300/300–600 volt DC), and using hand nets (diameter 40 × 40 cm, mesh 2 × 2 mm) [23,24,25,46]. At each site, a river stretch of 200 m was fished. From 2017 (eels 0+) to 2022 (eels 5+), we performed six electrofishing sessions [24]. Additional electrofishing sessions were performed in spring 2018 and 2019 on a more eel productive site, sector 2 in river A. We anesthetized with eugenol (0.5 mL L−1), measured (total length [TL], ±1 mm; weight [W], ±0.01 g) and tagged the untagged (tag: half duplex, 134.2 kHz, size 12 × 2 mm, weight in air 0.095 g) eels captured during each electrofishing session using the techniques described in [22,24,47,57]. After the complete dissipation of the anesthetic effects, eels were released into their capture location. No instances of mortality were observed because of tagging.

2.4. Demographic Metrics in Eels

The following formulae were used to demographically characterize the restocked eels:
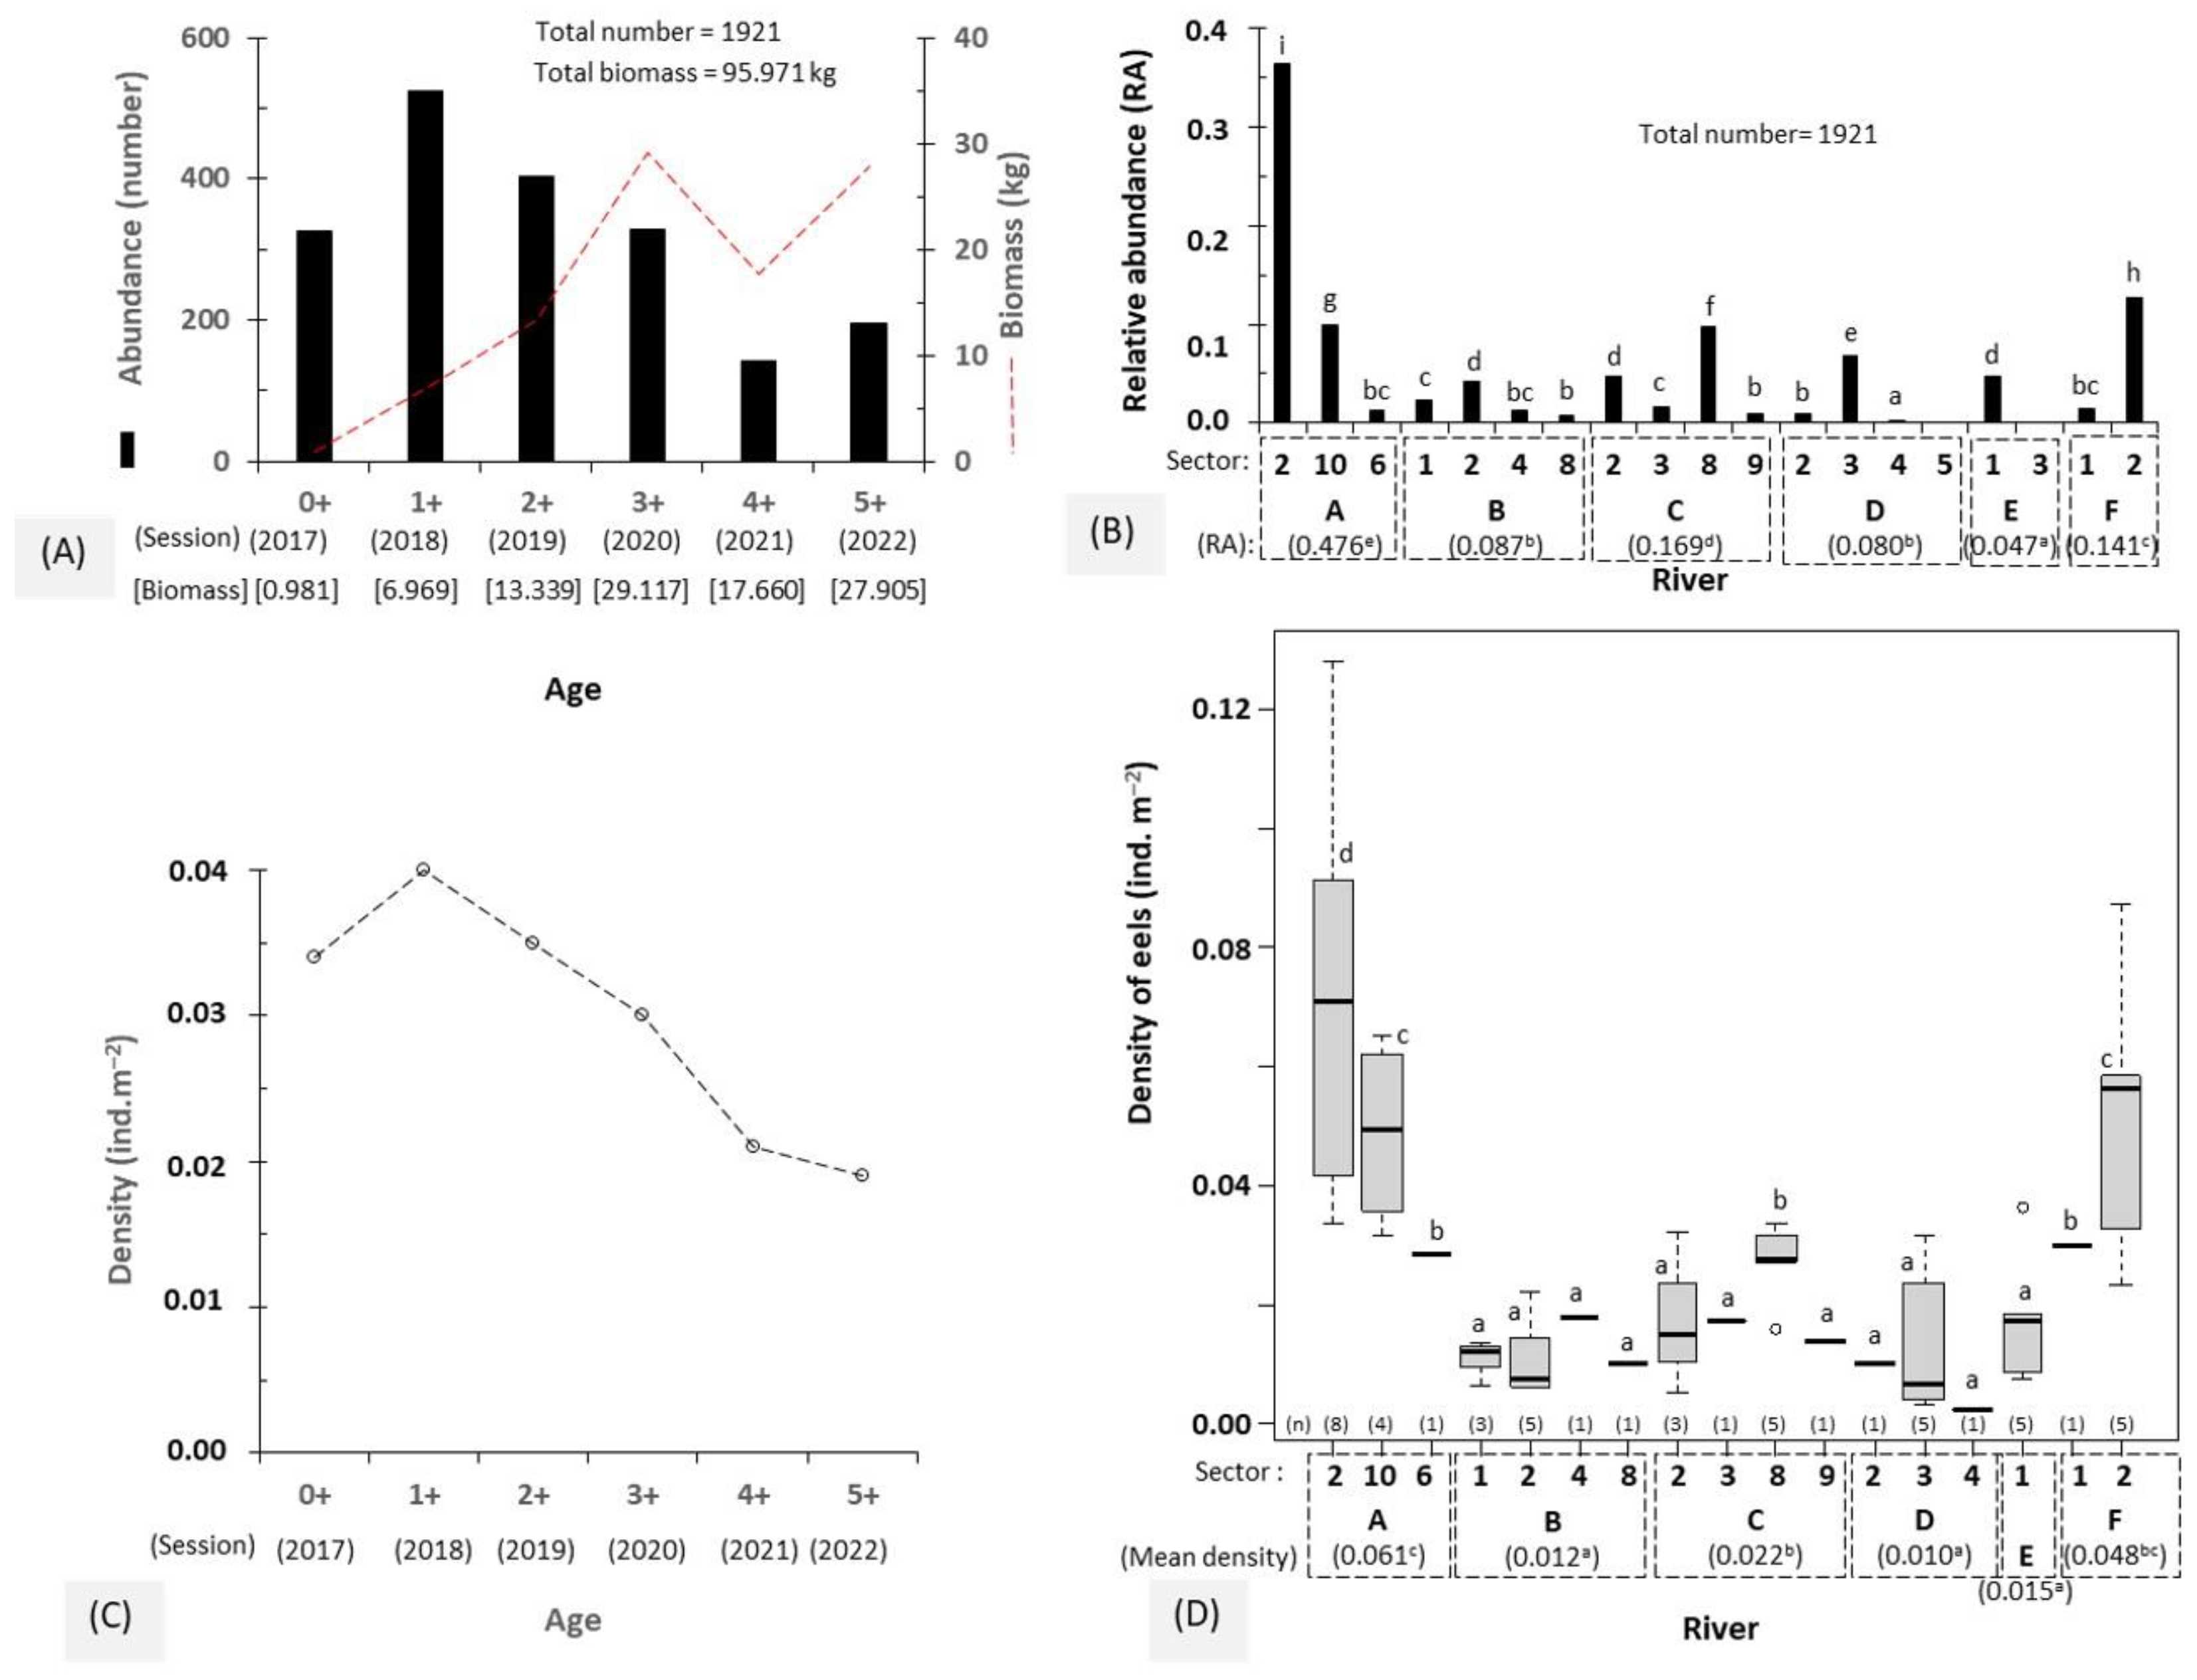
  • The observed abundance is determined by counting the number of individuals caught at each age, and the biomass is the sum of the weights of all eels caught at each age. Age is expressed as the number of years after the glass eel restocking in the rivers. A value of 0+ means that the eels are in their first-year river life.
  • The relative abundance is defined as the total number of eels captured in a sector/river divided by the sum of all eels caught in all sectors/rivers.
  • The eels’ density is represented by the ratio between the number of eels caught and the total area electro-fished at each eel age.
  • The Durif Silvering Index was assessed to ascertain the eel developmental phase. This index is predicated upon the variables of TL, pectoral fin length (±1 mm) and mean eye diameter (±1 mm) [58,59]. Given that eels restocked in rivers are in the growth phase during their first two years (from 0+ in 2017 to 1+ in 2018), we evaluated this index in these individuals from their third year (2+ in 2019) of river life.
  • The condition factor of Fulton (K) was calculated using the following mathematical formula: K = 100 × W [g] × [(TL [cm])3]−1 [60,61].
  • The length (TL) and weight (W) relationship at each age was calculated using the equation W = a × TL b that was logarithmically transformed into a linear relation as log10 (W) = b × log10 (TL) + log10 (a), where W is the weight (g), TL is total length (cm) and a and b are the coefficients. a is the intercept or coefficient referring to body shape, and b indicates the slope or growth coefficient to identify the type of growth with b = 3 meaning isometric growth, b < 3 negative allometric growth and b > 3 positive allometric growth [62].
  • The mean annual TL increment (G in mm.year−1) was assessed in eels 5+ using the following formula: G = (TL − TL0) × (T)−1, where TL is the TL (mm) at their capture, TL0 is the TL (mm) of glass eels at release and T is the age after restocking [63]. It was also evaluated between two successive ages using the following equation: G = (TLi + 1 − TLi) × (T)−1, where TLi + 1 and TLi were the TL of eels at ages i + 1 and i, respectively.
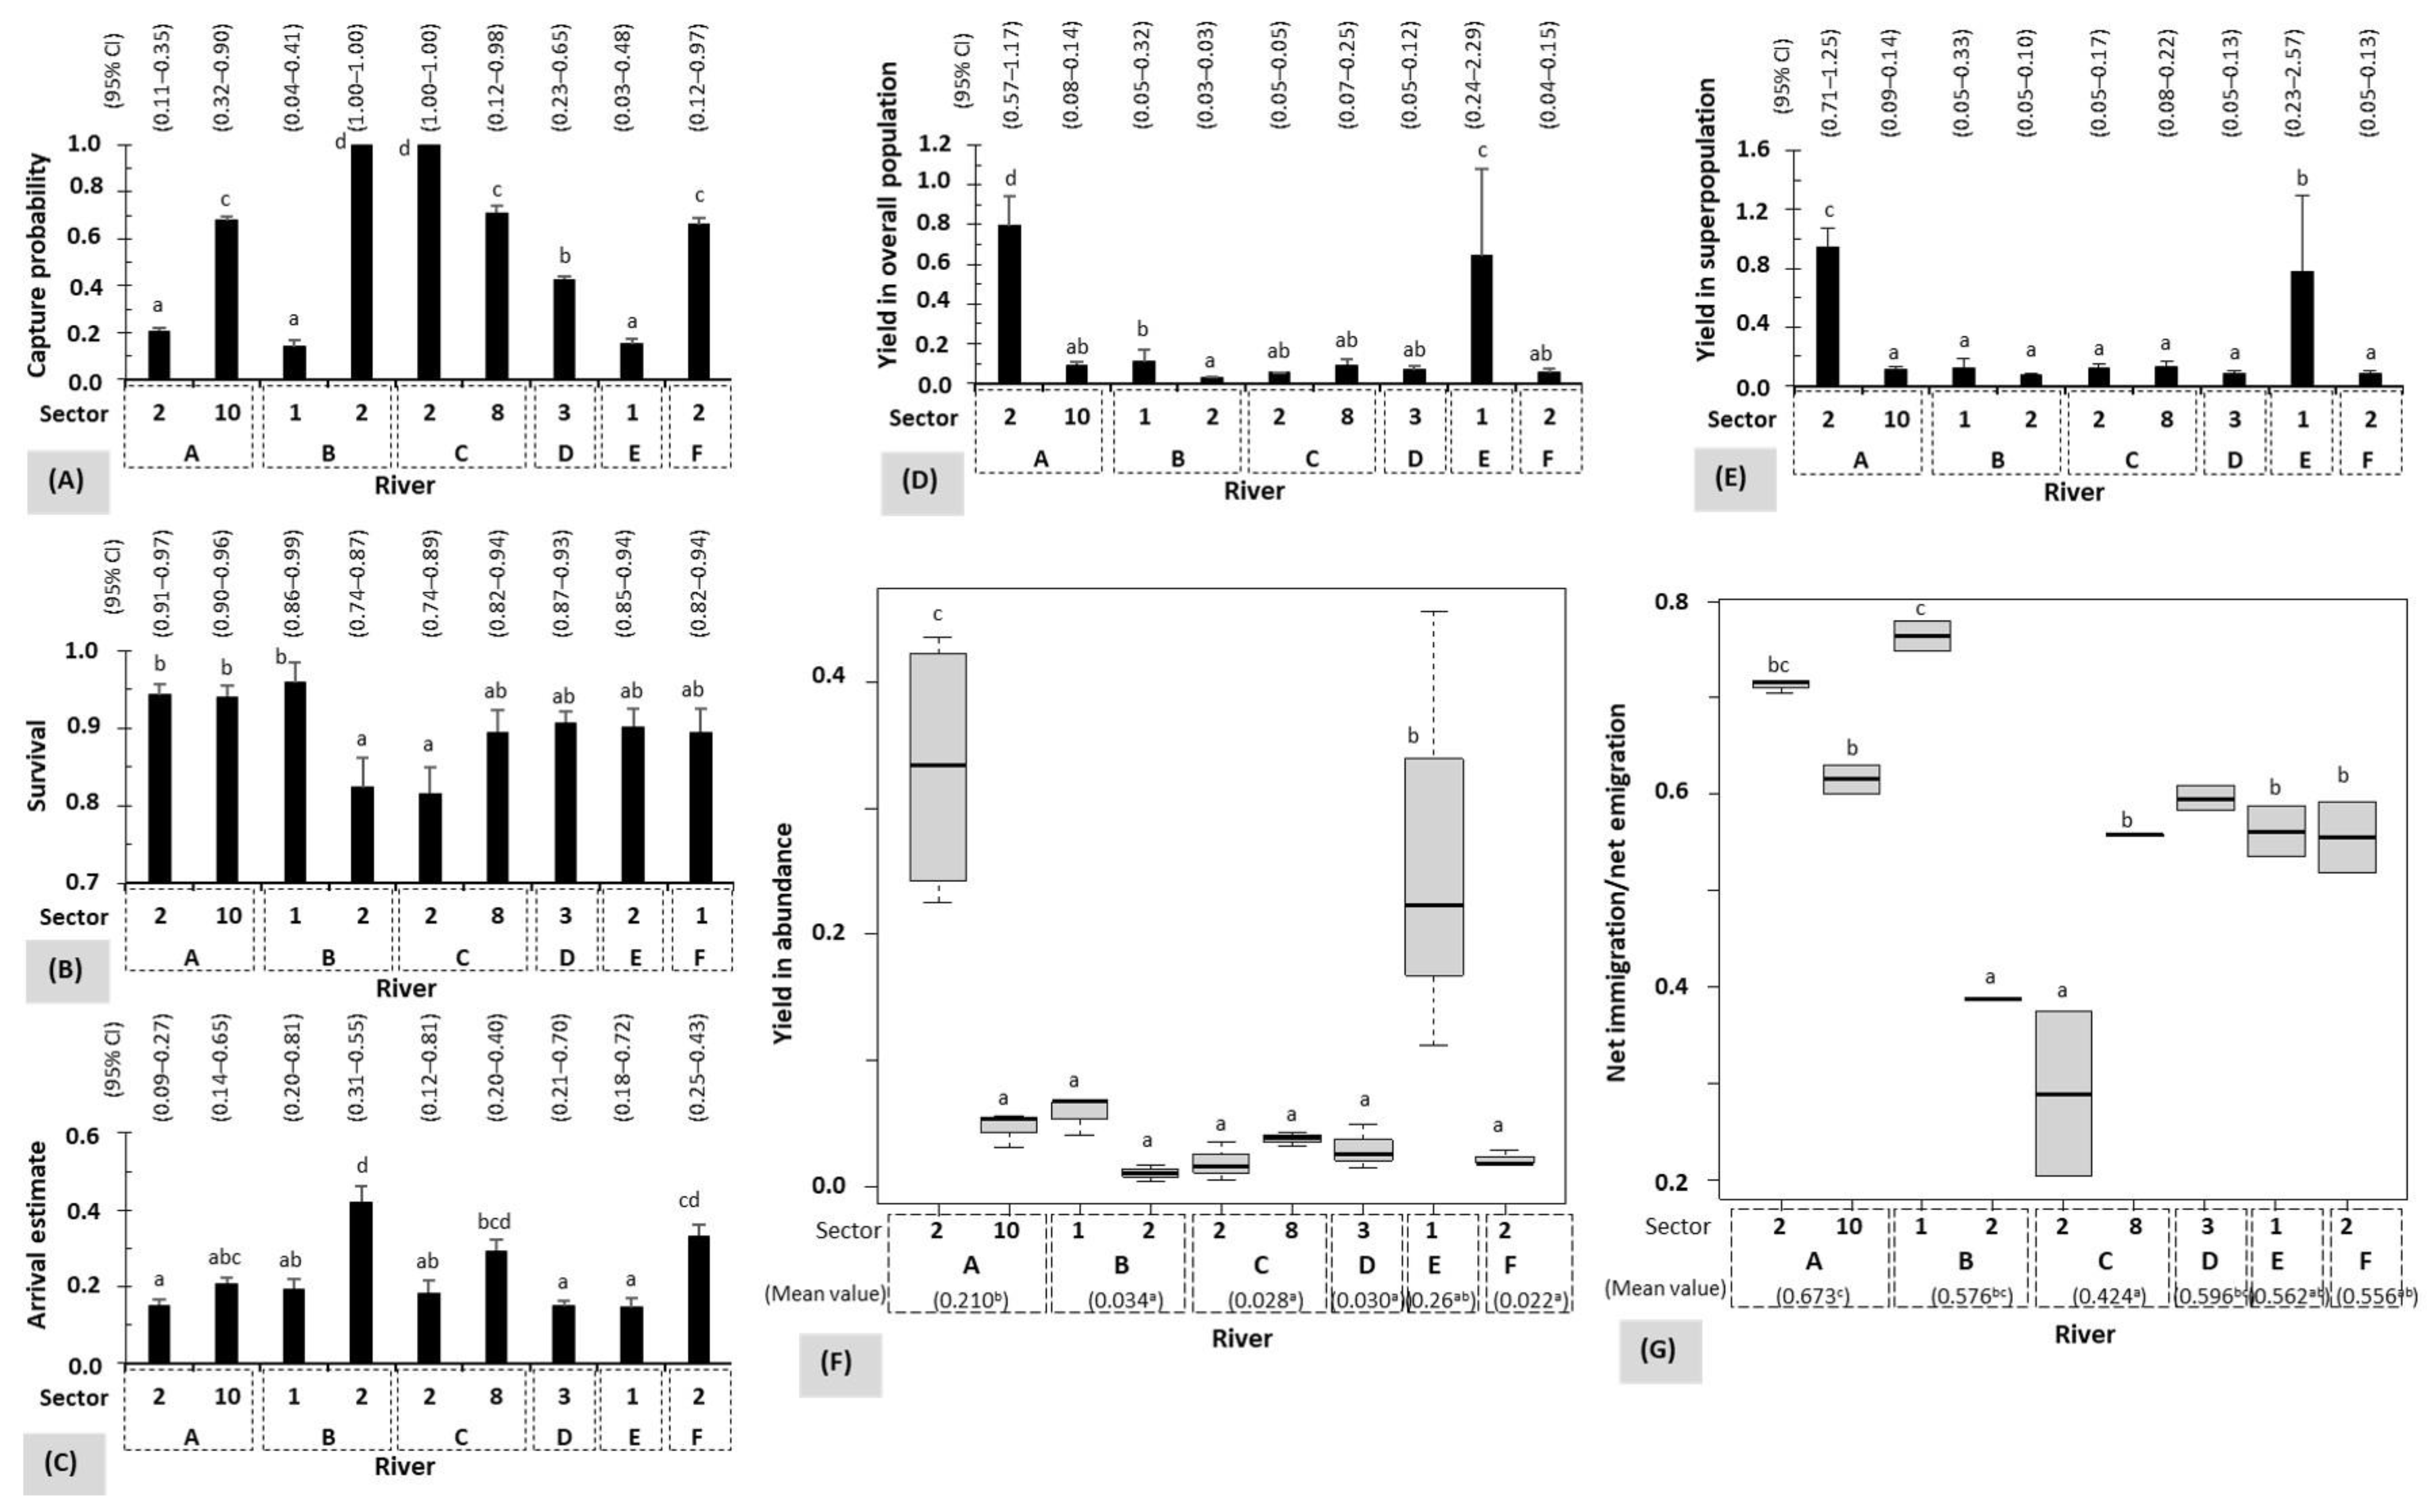
  • The demographic parameters of eels 0+ (2017) to 3+ (2020) were estimated using the Jolly–Seber method by means of the Program MARK 8.0 POPAN module [64,65,66,67]. The strategy involved conducting multiple capture–mark–recapture sessions on the same site at different time intervals. We selected only data collected in autumn from 2017 to 2020. Data from 2021 (eels 4+) to 2022 (eels 5+) were not used in this demographic evaluation due to changes observed in the sites/sectors after the severe floods of July 2021, which completely changed the availability in cryptic habitats [47]. The model used was {p(.}, ϕ{.}, pent{t}, N(.)}, where p(.}, ϕ{.} and N(.) are constant over time and represent the capture probability, survival and overall population, respectively; pent{t} is the arrival probability varying with time or age [23,28,67]. Overall population was all individuals who inhabited the site throughout the study duration. This model also determined the superpopulation (N*-hat) that is constant over time, and the estimated abundance (N-hat i), net immigration (B-hat i) and net emigration (B*-hat i) which vary with time or session i. Superpopulation included eels that occasionally frequented the site and disappeared prior to the counting operation. It was selected based on Akaike’s Quasi-Probability Information Criterion (QAICc), species biology and study design as the same unaltered sampling site/sector was fished over a three (2018–2020) to four (2017–2020) year period. To allow objective comparisons between sites/rivers, demographic parameters were standardized as the yields in estimated abundance, overall population and superpopulation and the ratio between net immigration and net emigration. Yields were the quotient between the value of each estimated parameter and the number of glass eels released.

2.5. Statistical Analyses

Relationships between the age and density, mean annual TL increment and K were tested using Pearson’s correlation coefficients (r). We used the Fisher’s exact test (FET) to compare the relative eel abundance between sectors/rivers and between silvering phases as well as the estimated probability of capture, survival and arrival and the yields in overall population and superpopulation between rivers. Data of eels’ density, TL and K at each age, yield in abundance and immigration-to-emigration net ratio between rivers were shown in box plots and analyzed using the nonparametric Kruskal–Wallis (KW) test followed by the post hoc Dunn’s test (PD) with the Bonferroni correction for multiple pairwise comparisons of mean rank sums. In these box plots, line inside the box was median values; hinges indicated first and third quartiles and circles showed outliers. All statistical analyses were made with the Rcmdr 2.3.-2, Hmisc and dunn.test packages of R statistical software version 3.3 [68,69,70] and the significance level was set at p < 0.05.

3. Results

3.1. Abundance and Density of Eels

We electrofished 44.2% (n = 19) of the 43 restocked sites/sectors. In two of the 19 sectors fished, notably sectors 5 (in river D) and 3 (in E), no eels were captured (Figure 2). We captured 1921 eels, corresponding to 95.971 kg biomass, over the course of eight electrofishing sessions performed from 2017 to 2022. The relative abundance of eels caught differed between sectors within the same river as well as between the rivers studied (Figure 2). It peaked significantly in sector 2 in river A (FET, p < 2.200 × 10⁻¹⁶). Among rivers, river A had the greatest contribution, corresponding to nearly half of the observed abundance of eels (FET, p < 2.200 × 10⁻¹⁶). The density of eels decreased significantly with the age from 0.040 ind. m−2 in 2018 (eels 1+) to 0.019 ind. m−2 in 2022 (eels 5+) (Pearson’s correlation coefficients: r = −0.884, p = 0.019). It stayed above 0.025 ind. m−2 from 2017 (eels 0+) to 2020 (eels 3+). After age 3+, abundance as well as density of eels decreased. We observed a significantly high eel density in sectors 2 (maximum 0.128 ind. m−2) and 10 (0.065 ind. m−2) in river A, and in sector 2 (0.087 ind. m−2) in F (KW test: df = 16, χ2 = 36.926, p = 2.148 × 10⁻³; PD test: p < 0.05). Between rivers, A and F showed the highest densities of eels (KW test: df = 5, χ2 = 33.293, p = 3.292 × 10⁻⁶; PD test: p < 0.05).

3.2. Growth Performance of Eels

The mean TL of eels increased with age (r = 0.999, p = 3.135 × 10⁻⁵) after restocking in the rivers, from 67 mm in 2017 (glass eels) to 400 mm in 2022 (eels 5+), which means an annual average TL increment of 67 mm year−1 (Figure 3). Between two successive ages, the annual average TL increments varied from 34 mm year−1 (eels 4+ to 5+) to 128 mm year−1 (glass eels to eels 1+), but they were not related to age (r = −0.789, p = 0.113). The annual average TL increment was 77 mm year−1 from eels 0+ to 1+. At each age, eels showed a large TL variability, which also increased with age (r = 0.984, p = 3.631 × 10⁻⁴). A positive length–weight relationship was observed in these eels, whose lengths explained 90 to 96% (adjusted R2, p < 2.200 × 10⁻¹⁶) of the variance in weights (Table 1). The a coefficient varied between −2.810 and −3.137 while b ranged from 3.019 to 3.285, meaning a positive allometric growth (b > 3.0 indicating a tendency to be thick and therefore have optimal growth conditions). K, as a fitness indicator, was positively related to age (r = 0.851, p = 0.032), with its highest mean value of 0.194 recorded in eels 4+ (in 2021: KW test: df = 5, χ2 = 126.410, p < 2.200 × 10⁻¹⁶; PD test: p < 0.01). Between rivers, eels at the same age tended to be significantly larger in river C and smaller in F (eels 0+ to 5+, KW test: range, df = 4–5, χ2 = 30.413–76.617, p = 1.223 × 10⁻⁵ to 4.215 × 10⁻¹⁵; PD test: p < 0.05). The mean annual TL increment in the eels was 64 and 82 mm year−1 in F and C, respectively. It was 70 mm year−1 in A, the river with the greatest eel abundance. In this last river, TL tended annually to be close to that of river C with large eels (Supplementary Figure S1).

3.3. Silvering Stage of Eels

Fine analysis of the Durif Silvering Index estimation revealed that up to age 5+, more than 75% of the eels were still in the growth phase (Figure 4). This phase included the FI growth phase (mean TL, range: 263 mm eels 2+ to 367 mm eels 4+) and FII female growth phase (mean TL: 469 mm eels 3+ to 556 mm eels 4+). The FIII female pre-migrant phase only appeared at age 5+ and represented 16.8% of the 113 individual eels 5+ (TL, mean = 524 mm, and range = 403–706 mm). The MII male migrating phase appeared at low abundances accounting for 2.8% (n = 3; TL, range = 304–384 mm) and 7.1% (n = 8; 345–398 mm) for eels at ages 3+ and 5+, respectively (FET, p < 2.200 × 10⁻¹⁶). These MII males were in rivers A (sector, 2: n = 1 eel 3+ and 1 eel 5+; 10: n = 1 eel 3+ and 4 eels 5+), B (sector 2: n = 1 eel 3+ and 1 eel 5+) and F (sector 2: 2 eels 5+). We also observed a high number of silvering phases including FI, FII, FIII and MII when eels had reached age 5+. At this age, silver eels were low and only represented by male individuals. The low abundance of males (11.4%, n = 4, 255–331 mm) has also been recorded by gonadal microscopic examination from n = 35 eels 5+ sampled and studied in a laboratory. The male had a tiny paired elongated gonad structure (testis) attached dorsally to the body wall, while the more abundant female individuals (88.6%, n = 31, 244–621 mm) revealed a large gonadal structure with oocytes.

3.4. Influence of Rivers in Recruitment Yields

As for the abundance of eels caught, the estimated demographic parameters related to recruitment also varied between sectors within the same river (Figure 5 and Table S1 in the Supplementary Materials). We observed significantly higher yields in eel recruitment in sector 2 in river A, particularly in terms of the yields in overall population (estimate = 0.794, FET, p < 0.05), superpopulation (estimate = 0.941, FET, p < 0.01) and abundance (mean = 0.332, KW test: df = 8, χ2 = 23.153, p = 3.174 × 10⁻³; PD test: p < 0.05) as well as the immigration-to-emigration net ratio (mean = 0.712, KW test: df = 8, χ2 = 16.737, p = 3.297 × 10⁻²; PD test: p < 0.05). Conversely, the capture probability (estimate = 0.207) and arrival probability (mean = 0.151) were low in sector 2 in river A (FET, p < 0.05), while they peaked in sector 2 in river B (capture probability, estimate = 1.000 and arrival probability, mean = 0.422) (FET, p < 0.0001). The monthly survival probability was high and above 0.810 in all sectors/rivers, with its highest values observed in sector 1 (estimate = 0.958) in river B and sectors 2 (estimate = 0.942) and 10 (estimate = 0.940) in river A. The lowest values of survival were observed in sector 2 (estimate = 0.823) in river B and sector 2 (estimate = 0.816) in river C (FET, p < 0.05). The emigration was higher than immigration in all sectors/rivers as expressed by the immigration-to-emigration net ratio < 1. Emigration peaked in two sectors with the lowest immigration-to-emigration net ratios, notably sector 2 (net immigration/net emigration, mean = 0.389) in river B and sector 2 (0.290) in river C. In sector 2 in river B, high emigration was accompanied by a high arrival of eels (0.422), while in sector 2 in river C, high emigration was accompanied by a low arrival of eels (0.182). This explains why the lowest survival levels of eels were found in these two sectors as the species does not breed in freshwater.

4. Discussion

We provide in the present study new insights on the role of glass eel host habitat during their life in freshwater after restocking operations. It involved six typologically different rivers that were annually surveyed using the electrofishing method to catch the restocked eels. Indeed, the host habitat has a crucial importance in the restocking success and efficiency, in terms of the abundance, density, growth and demography parameters of the recruited eels. Undoubtedly, the new knowledge gained from this study, with regards to the drastic eel stock decline, should help to improve the restocking practice using imported glass eels released in freshwater through an optimal selection of habitats to be restocked. This should lead countries farther from the sea to improve the eel host habitats and the local stocks as well as, probably over time, increase restocked-origin silver eel production [22,24,28,44,45,46,47].
The decreasing abundance and density of eels observed after age 3+ (after 2020) could be related to the extraordinary floods observed in July 2021. These have destroyed habitats and caused eels to move downstream in search of new shelters, as highlighted by a telemetry study previously performed on the same sites [47]. However, each year, the density of the eels stayed overall above 2 individuals per 100 m−2 with the highest density of 4 individuals per 100 m2 observed in 2018 (eels 1+) before the flooding events. These densities are higher than those recently observed in a study performed from 2015–2020 by Dorow et al. [71], who reported a mean eel density of up to almost 2 individuals (yellow eels TL > 36 cm) per 100 m2 in a lagoon located along the Baltic Sea coastline in Germany. At the level of the river sector, we observed up to 13 individuals per 100 m2 in sector 2 in A with a greater abundance of the recruited eels. Similar recruitment after restocking has already been reported in our previous study, which was performed in a highly productive habitat that was a brook belonging to the same Meuse River basin [28]. The sector with the highest eel density (sector 2 in A) was also the best contributor in terms of eel abundance. It has a high recruitment rate due to its high habitat quality offering optimal living conditions to eels in terms of the high protection against predators and water flow, food availability and water physicochemical quality. The sector with a high abundance of eels, sector 2 in A, had a bottom substrate made up of 74.6% large-grained materials (26.8% blocks and 47.8% large stones) and a low threat of predation through a low brown trout density evaluated at 0.2 individuals per 100 m2. In contrast, in the sectors without eels, we observed a high threat of predation through a high presence of brown trout that was assessed at 0.9 individuals per 100 m2 in sector 3 (with dominant fine-grained riverbed material represented by 73.4% coarse pebbles) in E and 2.4 individuals per 100 m2 in sector 5 (with very large-grained riverbed material represented by 65% boulders) in D. The very unbalanced riverbed material composition, the high abundance of brown trout and the succession of runs and rapids observed in sectors 3 in E and 5 in C do not provide optimal conditions for growing, burying, protecting and settling of eels. Similarly, the difference in the abundance and density levels observed between the sectors within the same river as well as between the rivers is explained by the diversity of the host habitat quality for the young eels because this quality changed between the sectors within the same river as well as between the rivers studied. In addition, rivers D (sector 5) and E (sector 3) are acidic and the very low availability of cryptic shelters and the high-water currents, rather than the acidity of these two rivers, would explain the absence of eels in these two sectors, as the species exhibits cryptic behavior. In contrast, the abundance of cryptic shelters in sector 2 in F, without a glass eel release site but located near sector 1 with a glass release site, explains the good performance in the abundance and density of eels observed. Eels can live in very acidic rivers (pH 4–5) because they have a biological mechanism that regulates blood ions [72,73].
Eels restocked in freshwater grew in body length, which was positively correlated to the weight. In a 6-year study since 2017, annual growth coefficient b (range 3.019 to 3.285) was of a positive allometric growth type (b > 3.0), indicating, therefore, optimal growth conditions for eels in the rivers studied. The growth performance expressed as a mean annual increment of eel length varied in these rivers between 64 and 82 mm year−1 with river A having the greatest abundance/density of eels being set at 70 mm year−1. Also, in this last river, the size of the eels tended annually to be close to that of river C with the largest eels. Undoubtedly, performance levels of both the annual length increment and the body size of eels observed in river A could translate this sector/river into a good habitat for eels. The annual length increments of our results were higher than those recorded in many European waters (20–50 mm year−1: [74]; 36–51 mm year−1: [21]; 22 mm year−1: [75]; 23–49 mm year−1: [40]; 24–62 mm year−1: [46]; 30–69 mm year−1: [76]; 31 mm year−1: [22]). From 2017 to 2019, the same study site revealed yearly growth rates of 21–192 mm year−1 (mean = 88 mm year−1) [23]. This variability in annual length increments is explained by the difference in eel ages, study methods and growing habitats. Silm et al. [76] reported that eel growth rates decreased with age. This has also been observed in this study but without this relationship being significant (r = −0.782, p = 0.118). Additionally, due to cold temperatures and insufficiently protective shelters, Pedersen [77] noted a lack of or weak growth of eels that were restocked in rivers. Similarly, by K showing mean values fluctuating from 0.162 (eels 0+) to 0.194 (eels 4+), this study provides an additional encouraging element for the success of the glass eel restocking performed in freshwater. Positive K values of restocked eels were already reported in our previous study that was conducted in a brook with mean values of 0.166 in eels 4+ and 0.197 in eels 7+ [28]. They have also been observed in Estonian eels (mean values: K = 0.19, age = 8 years) [76]. K values in our study are in the upper range of K values determined in eels that have completed the growth stage (K = 0.16–0.22 [78]).
Silvering degree assessment was suggested in our sites by Nzau Matondo et al. [24] after studying the eels 2+ (in 2019). Our recent results revealed that most eels 5+ (in 2022) were mainly yellow eels at the growth phase and only a few individuals have reached the silver eel migrating stage, accounting for 2.8% (n = 3; TL, range = 304–384 mm in 2020) in eels 3+ and 7.1% (n = 8; 345–398 mm in 2022) in eels 5+. These silver eels were all males at MII stage; some of these tagged individuals were detected downstream during their seaward migration leaving the rivers thanks to detection antennas placed at the river mouths. As the species has sex-specific life-history strategies, these lead to length and age differences between the sexes during the silver eel migrating stage [6,59,79]. Our study also demonstrated that, from ages 3+ to 5+, the restocked male eels can silver and migrate to the sea because they have the life-history strategy of minimizing the yellow eel stage duration. Their observed lengths and ages in this study corroborated the lengths of 29–39 cm recorded in tributaries of the Minho River in Portugal [80] and the age around 6 years recognized in Western Europe [80] for male silver individuals. Other studies reported that male eels stay in freshwater for 3–8 years and female eels for 5–12 years before their reproductive migration to the sea [18,22,42]. A low abundance of the silver eel phase could indicate a low abundance of males and, therefore, could mean that the eel stocks in our study areas are predominantly female, as observed during the sexing of samples and the results of a study conducted in a brook [28]. Females have the life-history strategy of optimizing body size to achieve a greater fecundity and they display high energetic demands because they take a long time to mature. These leads them to spend a longer lifespan in freshwater and to silver at large sizes of 40–130 cm [6,59,79]. A higher ratio of females in eel stocks is an interesting biological trait for the conservation of this endangered species. This finding suggests that the habitats in our study area are favorable for eel growth.
With the estimated demographic parameters related to recruitment varying in sectors located inside the same river, the right choice of the sector or the habitat itself should no longer be neglected when selecting environments for eel restocking. This influences substantially the success of eel recruitment. In this 4-year study since the glass eel release in 2017, survival was high (monthly >81%) in all sectors/rivers restocked in their typological diversity at the hydromorphological, physicochemical and trophic levels. A particularly high monthly survival rate (>90%) was previously reported in an 8-year study of restocked eels performed in a brook that was highly productive [28]. Undoubtedly, the species is hardy with a remarkable adaptability to a wide range of aquatic environments during its freshwater life phase. They can tolerate environmental (drought, severe flooding, river acidity) and physiological (long fasting periods) conditions that only a few other species can survive [24,47,81]. The observed survival (>81%) was in the higher range of survival of 5–97% assessed in diverse aquatic environments, study durations and demographic assessment methods (survivals: 55–75% in a eutrophic lake, 8-year study and adjusted Petersen estimate [82]; 5–45% in small lakes, 6-year study and Bailey’s modification of the Lincoln–Petersen estimate [83]; 30% in a marsh, 3-year study and multistate capture–recapture model [42]; 91% in a brook, 8-year study and Jolly–Seber model [28]; and 95–97% in rivers, 3-year study and Jolly–Seber model [23]). In our study, the lowest survivals of eels estimated under conditions of high emigration accompanied by high arrival of eels (sector 2 in river B) as well as high emigration with low arrival of eels (sector 2 in river C) clearly demonstrated that the species does not breed in freshwater as well as the importance of the recipient habitat quality, or rather of its carrying capacity, which plays an important role in the recruitment level and, therefore, in the restoration goals of the local eel stocks altered through restocking operations. Moreover, all the eel recruitment descriptors, e.g., the yields in overall population, superpopulation and abundance as well as survival were evaluated at their maximum levels in one sector, sector 2 in A, having high habitat quality and hosting capacity with high availability of good cryptic shelters and high abundance of diverse prey. The hydromorphological, physicochemical and trophic characteristics of the habitats in this sector should serve as a model of the habitat to be selected for the glass eel restocking operations but also a model of the habitat to be recreated to improve the quality of the recipient habitats in freshwater. Sector 2 in A had the abiotic (elevated conductivity and total hardness, great riverbed roughness and abundant run, pool and riffle) and biotic (less predation threat and high prey availability and diversity) features which provided suitable living environments for eel survival and growth [24,47,83,84,85,86,87].

5. Conclusions

Through this study, we concluded that glass eel restocking practices are efficient to produce yellow eel phase and, certainly in the long term, to produce future genitors called silver eels escaping to the ocean. However, the observed high diversity between sectors in the same river as well as between rivers in terms of eel abundance, density, growth and yields in recruitment could suggest the existence of a certain preference for habitat in this very rustic species currently threatened with extinction. As the species exhibits a highly sedentary and cryptic lifestyle, this preferred habitat type should provide greater protection and abundant prey [12,22,44,45,84]. Its characteristics are defined by many authors as a eutrophic alkaline riverine habitat with numerous cryptic shelters, pools and riffles. These are favorable to a high eel density and biodiversity because of a primary production that is higher [22,24,28,47,85,86]. Such habitats should be selected and restocked with priority for enhancing the local eel stocks, but they should also be recreated in the rivers via artificial inputs of ecological shelters (blocks) that are environmentally friendly to improve the low riverbed roughness observed in some sectors/rivers. Similarly, the low abundance of males at ages 3+ and 5+ and their onset of silvering, and the absence of the silvering process in females, could suggest that the eel sexing is performed early at age 2+ (mean TL = 247 mm) before any possible silvering process and downstream migration to assess the sex ratio, which is the element with a capital importance in fish population management as well as in the evaluation of the restored eel stock quality. For this, the sexing method using histological sections of the eel gonads will be the most appropriate as it has already successfully sexed very young eels of 200–299 mm [28]; however, this method requires sacrificing individuals. The high density of eels observed in sector 2 (in A) should be reduced through the artificial distribution/translocation of eels from this sector to other intra- and inter-river sectors with little or no colonization by eels but with quality recipient habitats available for eels. Another question would consist of examining the possibility to use the sector 2 (in A) as the first host environment in freshwater for glass eels captured at an early stage when they enter the estuaries, as at this stage and time they are free of pathogens [20]. This should facilitate a good organization of restocking operations through a young eel translocation carried out without haste and in accordance with the rules of the art, from this host environment to other suitable and more productive recipient habitats, which can sometimes be far from each other while remaining located within the natural range of the species. However, for all these, studies are requested to better understand the benefits of these eel transfers. Also, as Desprez et al. [42] have suggested further studies assessing the quality of the eel genitors, we recommend in our river conditions that ages 4+ and 5+ constitute key ages for assessing the quality of restocked-origin male genitors produced in terms of fat accumulation and contamination to pathogens and pollutants. Considering the very encouraging signals resulting from the first eel sanitary evaluation in freshwater [20,28], eel restocking would be a powerful management tool to achieve the eel conservation objectives. However, our study suggests that this practice should be accompanied in continental freshwaters by the improvement/creation of the cryptic habitats conducive to the survival and growth of juveniles and safe downstream routes for genitor adults escaping to the sea as well as safe upstream routes for future catadromous offspring colonizing freshwater habitats [23,24,28,35,36,87,88].

Supplementary Materials

The following supporting information can be downloaded at: https://www.mdpi.com/article/10.3390/w15173133/s1, Figure S1: Total length according to age and river. n indicates the number of eels measured (Kruskal–Wallis and Dunn’s tests, p < 0.05); Table S1: Detailed eel recruitment parameters of Jolly-Seber model. B-hat and B*-hat were assessed between sampling occasions. CI means confidence interval and SE indicates standard error.

Author Contributions

B.N.M. and M.O. designed the restocking experiments, participated in the electrofishing sessions, analyzed the data, performed the statistical analyses and wrote the manuscript; X.R., F.D., F.F., O.D., C.P., S.V. and P.O. helped in the restocking experiments design, data analysis, manuscript revision and funding acquisition; J.P.B., A.D., J.G. and S.R. helped in the capture and tagging of restocked eels during electrofishing sessions and the manuscript revision. All authors have read and agreed to the published version of the manuscript.

Funding

The research was funded by the ‘Definition of the scientific and technical bases for an optimisation and evaluation of the efficiency of European glass eel (Anguilla anguilla) restocking practices’ project financially supported by the European Maritime Affairs and Fisheries Fund and the Wallonia Public Service, grant number FEAMP No. 44-1604-008.

Institutional Review Board Statement

There was no introduction or captive rearing of fish. In accordance with the regulations of our institution and country, it was deemed unnecessary to acquire a bioethical permit for the implementation of the present field study. Nevertheless, all interventions have been executed in consideration of the fish welfare.

Data Availability Statement

Study data are available upon request to corresponding author.

Acknowledgments

Authors express their sincere gratitude to the Editor in Chief and the Special Issue Editor as well as to the anonymous reviewers for their insightful feedback in support of enhancing the overall quality of this paper.

Conflicts of Interest

The authors declare no conflict of interest.

References

  1. Tzeng, W.N.; Wang, C.H.; Wickström, H.; Reizenstein, M. Occurrence of the semi-catadromous European eel Anguilla anguilla in the Baltic Sea. Mar. Biol. 2000, 137, 93–98. [Google Scholar] [CrossRef]
  2. Als, T.D.; Hansen, M.M.; Maes, G.E.; Castonguay, M.; Riemann, L.; Aarestrup, K.; Munk, P.; Sparholt, H.; Hanel, R.; Bernatchez, L. All roads lead to home: Panmixia of European eel in the Sargasso Sea. Mol. Ecol. 2011, 20, 1333–1346. [Google Scholar] [CrossRef] [PubMed]
  3. Dannewitz, J.; Maes, G.E.; Johansson, L.; Wickström, H.; Volckaert, F.A.M.; Järvi, T. Panmixia in the European eel: A matter of time. Proc. R. Soc. B Biol. Sci. 2005, 272, 1129–1137. [Google Scholar] [CrossRef]
  4. Marohn, L.; Jakob, E.; Hanel, R. Implications of facultative catadromy in Anguilla anguilla. Does individual migratory behaviour influence eel spawner quality? J. Sea Res. 2013, 77, 100–106. [Google Scholar] [CrossRef]
  5. Moriarty, C. The Yellow Eel. In Eel Biology; Aida, K., Tsukamoto, K., Yamauchi, K., Eds.; Springer: Tokyo, Japan, 2003; pp. 89–105. [Google Scholar]
  6. Tesch, F.W.; Thorpe, J.E. The Eel, 3rd ed.; Blackwell Science: Oxford, UK, 2003. [Google Scholar]
  7. Daverat, F.; Limburg, K.; Thibault, I.; Shiao, J.; Dodson, J.; Caron, F.; Tzeng, W.; Iizuka, Y.; Wickström, H. Phenotypic plasticity of habitat use by three temperate eel species, Anguilla anguilla, A. japonica and A. rostrata. Mar. Ecol. Prog. Ser. 2006, 308, 231–241. [Google Scholar] [CrossRef]
  8. Denis, J.; Rabhi, K.; Le Loc’h, F.; Lasram, F.B.R.; Boutin, K.; Kazour, M.; Diop, M.; Gruselle, M.-C.; Amara, R. Role of estuarine habitats for the feeding ecology of the European eel (Anguilla anguilla L.). PLoS ONE 2022, 17, e0270348. [Google Scholar] [CrossRef]
  9. Tsukamoto, K.; Arai, T. Facultative catadromy of the eel Anguilla japonica between freshwater and seawater habitats. Mar. Ecol. Prog. Ser. 2001, 220, 265–276. [Google Scholar] [CrossRef]
  10. Edeline, E. Adaptive phenotypic plasticity of eel diadromy. Mar. Ecol. Prog. Ser. 2007, 341, 229–232. [Google Scholar] [CrossRef]
  11. Harrod, C.; Grey, J.; McCarthy, T.K.; Morrissey, M. Stable isotope analyses provide new insights into ecological plasticity in a mixohaline population of European eel. Oecologia 2005, 144, 673–683. [Google Scholar] [CrossRef]
  12. Gross, M.R.; Coleman, R.M.; McDowall, R.M. Aquatic Productivity and the Evolution of Diadromous Fish Migration. Science 1988, 239, 1291–1293. [Google Scholar] [CrossRef] [PubMed]
  13. Arai, T.; Chino, N. Diverse migration strategy between freshwater and seawater habitats in the freshwater eel genus Anguilla. J. Fish Biol. 2012, 8, 442–455. [Google Scholar] [CrossRef]
  14. Arai, T. Ecology and evolution of migration in the freshwater eels of the genus Anguilla Schrank, 1798. Heliyon 2020, 6, e05176. [Google Scholar] [CrossRef] [PubMed]
  15. Daverat, F.; Tomás, J. Tactics and demographic attributes in the European eel Anguilla anguilla in the Gironde watershed, SW France. Mar. Ecol. Prog. Ser. 2006, 307, 247–257. [Google Scholar] [CrossRef]
  16. Daverat, F.; Beaulaton, L.; Poole, R.; Lambert, P.; Wickström, H.; Andersson, J.; Aprahamian, M.; Hizem, B.; Elie, P.; Yalçin-özdilek, S.; et al. One century of eel growth: Changes and implications: One century of eel growth. Ecol. Freshw. Fish 2012, 21, 325–336. [Google Scholar] [CrossRef]
  17. Jonsson, B.; Jonsson, N. Partial migration: Niche shift versus sexual maturation in fishes. Rev. Fish Biol. Fish. 1993, 3, 348–365. [Google Scholar] [CrossRef]
  18. Van den Thillart, G.V.; Van Ginneken, F.; Korner, R.; Heijmans, R.; Van der Linden, R.; Gluvers, A. European eel endurance swimming. J. Fish Biol. 2004, 65, 312–318. [Google Scholar] [CrossRef]
  19. Imbert, H.; Labonne, J.; Rigaud, C.; Lambert, P. Resident and migratory tactics in freshwater European eels are size dependent. Freshw. Biol. 2010, 55, 1483–1493. [Google Scholar] [CrossRef]
  20. Delrez, N.; Zhang, H.; Lieffrig, F.; Mélard, C.; Farnir, F.; Boutier, M.; Donohoe, O.; Vanderplasschen, A. European eel restocking programs based on wild-caught glass eels: Feasibility of quarantine stage compatible with implementation of prophylactic measures prior to scheduled reintroduction to the wild. J. Nat. Conserv. 2021, 59, 125933. [Google Scholar] [CrossRef]
  21. Pedersen, M.I. Long-term survival and growth of stocked eel, Anguilla anguilla (L.), in a small eutrophic lake. Dana 2000, 12, 71–76. [Google Scholar]
  22. Nzau Matondo, B.; Séleck, E.; Dierckx, A.; Benitez, J.-P.; Rollin, X.; Ovidio, M. What happens to glass eels after restocking in upland rivers? A long-term study on their dispersal and behavioural traits. Aquat. Conserv. Mar. Freshw. Ecosyst. 2019, 29, 374–388. [Google Scholar] [CrossRef]
  23. Nzau Matondo, B.; Benitez, J.P.; Dierckx, A.; Rollin, X.; Ovidio, M. An evaluation of restocking practice and demographic stock assessment methods for cryptic juvenile European eel in upland rivers. Sustainability 2020, 12, 1124. [Google Scholar] [CrossRef]
  24. Nzau Matondo, B.; Benitez, J.P.; Dierckx, A.; Renardy, S.; Rollin, X.; Colson, D.; Baltus, L.; Romain, V.R.M.; Ovidio, M. What are the best upland river characteristics for glass eel restocking practice? Sci. Total Environ. 2021, 784, 147042. [Google Scholar] [CrossRef] [PubMed]
  25. Belpaire, C.; Geeraerts, C.; Evans, D.; Ciccotti, E.; Poole, R. The European eel quality database: Towards a pan-European monitoring of eel quality. Environ. Monit. Assess. 2011, 183, 273–284. [Google Scholar] [CrossRef]
  26. Miller, M.J.; Feunteun, E.; Tsukamoto, K. Did a “perfect storm” of oceanic changes and continental anthropogenic impacts cause northern hemisphere anguillid recruitment reductions? ICES J. Mar. Sci. 2016, 73, 43–56. [Google Scholar] [CrossRef]
  27. Bonnineau, C.; Scaion, D.; Lemaire, B.; Belpaire, C.; Thomé, J.-P.; Thonon, M.; Leermaker, M.; Gao, Y.; Debier, C.; Silvestre, F.; et al. Accumulation of neurotoxic organochlorines and trace elements in brain of female European eel (Anguilla anguilla). Environ. Toxicol. Pharmacol. 2016, 45, 346–355. [Google Scholar] [CrossRef]
  28. Nzau Matondo, B.; Delrez, N.; Bardonnet, A.; Vanderplasschen, A.; Joaquim-Justo, C.; Rives, J.; Benitez, J.P.; Dierckx, A.; Séleck, E.; Rollin, X.; et al. A complete check-up of European eel after eight years of restocking in an upland river: Trends in growth, lipid content, sex ratio and health status. Sci. Total Environ. 2022, 807, 151020. [Google Scholar] [CrossRef]
  29. Pike, C.; Crook, V.; Gollock, M. Anguilla anguilla. The IUCN Red List of Threatened Species 2020: e.T60344A152845178. 2020. Available online: https://www.fishsec.org/app/uploads/2022/11/200709-Assessment-10.2305_IUCN.UK_.2020-2.RLTS_.T60344A152845178.en_.pdf (accessed on 9 May 2023).
  30. Feunteun, E. Management and restoration of European eel population (Anguilla anguilla): An impossible bargain. Ecol. Eng. 2002, 18, 575–591. [Google Scholar] [CrossRef]
  31. Robinet, T.; Feunteun, E. Sublethal effects of exposure to chemical compounds: A cause for the decline in Atlantic eels? Ecotoxicology 2002, 11, 265–277. [Google Scholar] [CrossRef] [PubMed]
  32. Haenen, O.L.M.; Mladineo, I.; Konecny, R.; Yoshimizu, M.; Groman, D.; Munoz, P. Diseases of eels in an international perspective: Workshop on eel diseases at the 15th international conference on the diseases of fish and shellfish, Split, Croatia, 2011. Bull. Eur. Assoc. Fish Pathol. 2012, 32, 109–115. [Google Scholar]
  33. Muñoz, P.; Barcala, E.; Peñalver, J.; Romero, D. Can inorganic elements affect herpesvirus infections in European eels? Environ. Sci. Pollut. Res. 2019, 26, 35266–35269. [Google Scholar] [CrossRef]
  34. Ibbotson, A.; Smith, J.; Scarlett, P.; Aprahamian, M.W. Colonisation of freshwater habitats by the European eel Anguilla anguilla. Freshw. Biol. 2002, 47, 1696–1706. [Google Scholar] [CrossRef]
  35. Nzau Matondo, B.; Ovidio, M. Decreased stock entering the Belgian Meuse is associated with the loss of colonisation behaviour in yellow-phase European eels. Aquat. Living Resour. 2018, 31, 7. [Google Scholar] [CrossRef]
  36. Nzau Matondo, B.; Ovidio, M. Dynamics of upstream movements of the European eel Anguilla Anguilla in an inland area of the river Meuse over the last 20 years. Environ. Biol. Fish 2016, 99, 223–235. [Google Scholar] [CrossRef]
  37. ICES. ICES Joint EIFAAC/ICES/GFCM Working Group on Eels (WGEEL); ICES Scientific Reports: Copenhagen, Denmark, 2020; 223p. [Google Scholar]
  38. Pedersen, M.I.; Rasmussen, C.H. Yield per recruit from stocking two different sizes of eel (Anguilla anguilla) in the brackish Roskilde Fjord. ICES J. Mar. Sci. 2016, 73, 158–164. [Google Scholar] [CrossRef]
  39. Prigge, E.; Marohn, L.; Hanel, R. Tracking the migratory success of stocked European eels Anguilla anguilla in the Baltic Sea. J. Fish Biol. 2013, 82, 686–699. [Google Scholar] [CrossRef] [PubMed]
  40. Simon, J.; Dörner, H.; Scott, R.D.; Schreckenbach, K.; Knösche, R. Comparison of growth and condition of European eels stocked as glass and farm sourced eels in lakes in the first four years after stocking. J. Appl. Ichthyol. 2013, 29, 323–330. [Google Scholar] [CrossRef]
  41. Ovidio, M.; Seredynski, A.; Philippart, J.C.; Nzau Matondo, B. A bit of quiet between the migrations: The resting life of the European eel during their freshwater growth phase in a small stream. Aquat. Ecol. 2013, 47, 291–301. [Google Scholar] [CrossRef]
  42. Desprez, M.; Crivelli, A.J.; Lebel, I.; Massez, G.; Gimenez, O. Demographic assessment of a stocking experiment in European eels. Ecol. Freshw. Fish 2013, 22, 412–420. [Google Scholar] [CrossRef]
  43. Kullmann, B.; Thiel, R. Bigger is better in eel stocking measures? Comparison of growth performance, body condition, and benefit-cost ratio of simultaneously stocked glass and farmed eels in a brackish fjord. Fish. Res. 2018, 205, 132–140. [Google Scholar] [CrossRef]
  44. Félix, P.M.; Costa, J.L.; Monteiro, R.; Castro, N.; Quintella, B.R.; Almeida, P.R.; Domingos, I. Can a restocking event with European (glass) eels cause early changes in local biological communities and its ecological status? Glob. Ecol. Conserv. 2020, 21, e00884. [Google Scholar] [CrossRef]
  45. Félix, P.M.; Costa, J.L.; Quintella, B.R.; Almeida, P.R.; Monteiro, R.; Santos, J.; Portela, T.; Domingos, I. Early settlement and growth of stocked European glass eels in a fragmented watercourse. Fish. Manag. Ecol. 2020, 28, 91–100. [Google Scholar] [CrossRef]
  46. Ovidio, M.; Tarrago-Bès, F.; Nzau Matondo, B. Short-term responses of glass eels transported from UK to small Belgian streams. Ann. Limnol. Int. J. Limnol. 2015, 51, 219–226. [Google Scholar] [CrossRef]
  47. Nzau Matondo, B.; Backory, L.; Dupuy, G.; Amoussou, G.; Oumarou, A.A.; Gelder, J.; Renardy, S.; Benitez, J.-P.; Dierckx, A.; Dumonceau, F.; et al. Space and Time Use of European Eel Restocked in Upland Continental Freshwaters, a Long-Term Telemetry Study. Fishes 2023, 8, 137. [Google Scholar] [CrossRef]
  48. Sadler, K. Effects of temperature on the growth and survival of the European eel, Anguilla anguilla L. J. Fish Biol. 1979, 15, 499–507. [Google Scholar] [CrossRef]
  49. Morin, A.; Lamoureux, W.; Busnarda, J. Empirical models predicting primary productivity from chlorophyll and water temperature for stream periphyton and lake and ocean phytoplankton. J. N. Am. Benthol. Soc. 1999, 18, 299–307. [Google Scholar] [CrossRef]
  50. Baras, E.; Philippart, J.C.; Salmon, B. Estimation of migrant yellow eels stock in large rivers through the survey of fish passes: A preliminary in the River Meuse (Belgium). In Stock Assessment in Inland Fisheries; Cowx, I.G., Ed.; Oxford Fishing News Books (Blackwell): London, UK, 1996; pp. 314–325. [Google Scholar]
  51. Philippart, J.C. L’érosion de la Biodiversité: Les Poissons; Université de Liège: Liège, Belgique, 2006; 320p. [Google Scholar]
  52. Philippart, J.C.; Ovidio, M.; Rimbaud, G.; Dierckx, A.; Poncin, P. Bilan des Observations Sur Les Populations de L’anguille Dans Les Sous-Bassins Hydrographiques Meuse Aval, Ourthe, Amblève et Vesdre; Commission Provinciale de Liège du Fonds Piscicole du Service Public de Wallonie: Liège, Belgique, 2010; 162p. [Google Scholar]
  53. Huet, M. Aperçu de la relation entre la pente et les populations piscicoles des eaux courantes. Schweiz. Z. Hydrol. 1949, 11, 332–351. [Google Scholar] [CrossRef]
  54. Wentworth, C.K. A scale of grade and class terms for clastic sediments. J. Geol. 1922, 30, 377–392. [Google Scholar] [CrossRef]
  55. Elie, P.; Lecomte-Finiger, R.; Cantrelle, I.; Charlon, N. Définition des limites des différents stades pigmentaires durant la phase civelle d’Anguilla anguilla (L.). Vie Milieu 1982, 32, 149–157. [Google Scholar]
  56. Baras, E.; Jeandrain, D.; Serouge, B.; Philippart, J.C. Seasonal variations in time and space utilization by radio-tagged yellow eels Anguilla anguilla (L.) in A Small Stream. Hydrobiologia 1998, 371/372, 187–198. [Google Scholar] [CrossRef]
  57. Jepsen, N.; Koed, A.; Thorstad, E.B.; Baras, E. Surgical implantation of telemetry transmitters in fish: How much have we learned? Hydrobiologia 2002, 483, 239–248. [Google Scholar] [CrossRef]
  58. Durif, C.; Dufour, S.; Elie, P. The silvering process of Anguilla Anguilla: A new classification from the yellow resident to the silver migrating stage. J. Fish Biol. 2005, 66, 1025–1043. [Google Scholar] [CrossRef]
  59. Durif, C.; Guibert, A.; Elie, P. Morphological discrimination of the silvering stages of the European eel. In Eels at the Edge Science, Status, and Conservation Concerns; American Fisheries Society: Bethesda, MD, USA, 2009; pp. 103–111. [Google Scholar]
  60. Fulton, T.W. The rate of growth of fishes. Fish. Board. Scotl. Ann. Rep. 1904, 22, 141–241. [Google Scholar]
  61. Simon, J. Age, growth, and condition of European eel (Anguilla anguilla) from six lakes in the river havel system (Germany). ICES J. Mar. Sci. 2007, 64, 1414–1422. [Google Scholar] [CrossRef]
  62. Froese, R. Cube law, condition factor and weight–length relationships: History, meta-analysis and recommendations. J. Appl. Ichthyol. 2006, 22, 241–253. [Google Scholar] [CrossRef]
  63. Kumai, Y.; Tsukamoto, K.; Kuroki, M. Growth and habitat use of two anguillid eels, Anguilla marmorata and A. Japonica, on Yakushima Island Japan. Ichthyol. Res. 2020, 67, 375–384. [Google Scholar] [CrossRef]
  64. Schwarz, C.J.; Arnason, A.N. A general methodology for the analysis of capture-recapture experiments in open populations. Biometrics 1996, 52, 860–873. [Google Scholar] [CrossRef]
  65. White, G.C.; Burnham, K.P. Program MARK: Survival estimation from populations of marked animals. Bird Study 1999, 46, 120–139. [Google Scholar] [CrossRef]
  66. Pledger, S.; Pollock, K.H.; Norris, J.L. Open Capture–Recapture Models with Heterogeneity: II. Jolly–Seber Model. Biometrics 2010, 66, 883–890. [Google Scholar] [CrossRef]
  67. Burnham, K.P.; Anderson, D.R. Model Selection and Multimodel Inference: A Practical Information-Theoretic Approach, 2nd ed.; Springer-Verlag Science and Business Média: New York, NY, USA, 2002; 454p. [Google Scholar]
  68. R Development Core Team. R: A Language and Environment for Statistical Computing; R Foundation for Statistical Computing: Vienna, Austria, 2016; Available online: https://www.R-project.org/ (accessed on 2 March 2023).
  69. Fox, J. Using the R Commander: A Point-and-Click Interface for R; Chapman and CRC Press: Boca Raton, FL, USA, 2017; Available online: http://socserv.mcmaster.ca/jfox/Books/RCommander/ (accessed on 2 March 2023).
  70. Harrell, F.E., Jr. Hmisc: Harrell Miscellaneous, Version 4.1-1; Cran: Washington DC, USA, 2018; Available online: http://CRAN.Rproject.org/package=Hmisc (accessed on 2 March 2023).
  71. Dorow, M.; Kullmann, L.; Buck, M.; Frankowski, J. Yellow eel (Anguilla anguilla) density trends along the German part of the southern Baltic Sea between 2009 and 2020. Fish. Res. 2023, 257, 106497. [Google Scholar] [CrossRef]
  72. Reynolds, C. The Effect of Acidification on the Survival of American Eel. Master’s Thesis, Dalhousie University, Halifax, NS, Canada, 2011; 78p. [Google Scholar]
  73. Larsen Bjørn, M.; Hesthagen, T.; Thorstad, E.B.; Diserud, O.H. Increased abundance of European eel (Anguilla anguilla) in acidified Norwegian rivers after liming. Ecol. Freshw. Fish 2015, 24, 575–583. [Google Scholar] [CrossRef]
  74. Bisgaard, J.; Pedersen, M.I. Mortality and growth of wild and introduced cultured eels Anguilla anguilla (L.) in a Danish stream, with special reference to a new tagging technique. Dana 1991, 9, 57–69. [Google Scholar]
  75. Mazel, V.; Charrier, F.; Legault, A.; Laffaille, P. Long-term effects of passive integrated transponder tagging (PIT tags) on the growth of the yelloweel (Anguilla anguilla (Linnaeus, 1758)). J. Appl. Ichthyol. 2013, 29, 906–908. [Google Scholar] [CrossRef]
  76. Silm, M.; Bernotas, P.; Haldna, M.; Järvalt, A.; Nõges, T. Age and growth of European eel, Anguilla anguilla (Linnaeus, 1758), in Estonian lakes. J. Appl. Ichthyol. 2017, 33, 236–241. [Google Scholar] [CrossRef]
  77. Pedersen, M.I. Does Stocking of Danish lowland streams with Elvers increase European Eel Populations? Am. Fish. Soc. Symp. 2009, 58, 149–156. [Google Scholar]
  78. van Ginneken, V.; Durif, C.; Balm, S.P.; Boot, R.; Verstegen, M.W.A.; Antonissen, E.; van den Thillart, G. Silvering of European eel (Anguilla anguilla L.): Seasonal changes of morphological and metabolic parameters. Anim. Biol. 2007, 57, 63–77. [Google Scholar] [CrossRef]
  79. Moura, A.; Dias, E.; López, R.; Antunes, C. Regional population structure of the European eel at the southern limit of its distribution revealed by otolith shape signature. Fishes 2022, 7, 135. [Google Scholar] [CrossRef]
  80. Cattrijsse, A.; Hampel, H. Life History and Habitat Use Tables. In Final Report. Subproject 1—‘Nursery Function Westerschelde’; University of Gent, Department of Biology, Marine Biology Section: Gent, Belgium, 2000; 30p. [Google Scholar]
  81. Jellyman, D.J. An enigma: How can freshwater eels (Anguilla spp.) be such a successful genus yet be universally threatened? Rev. Fish Biol. Fish. 2022, 32, 701–718. [Google Scholar] [CrossRef]
  82. Shiao, J.C.; Lozys, L.; Iizuka, Y.; Tzeng, W.N. Migratory patterns and contribution of stocking to the population of European eel in Lithuanian waters as indicated by otolith Sr:Ca ratios. J. Fish Biol. 2006, 69, 749–769. [Google Scholar] [CrossRef]
  83. Sjöberg, N.B.; Wickström, H.; Asp, A.; Petersson, E. Migration of eels tagged in the Baltic Sea and Lake Mälaren in the context of the stocking question. Ecol. Freshw. Fish 2017, 26, 517–532. [Google Scholar] [CrossRef]
  84. Cucherousset, J.; Britton, J.R.; Beaumont, W.R.C.; Nyqvist, M.; Sievers, K.; Gozlan, R.E. Determining the effects of species environmental conditions and tracking method on the detection efficiency of portable PIT telemetry. J. Fish Biol. 2010, 7, 1039–1045. [Google Scholar] [CrossRef]
  85. Keithan, E.D.; Lowe, R.L. Primary productivity and spatial structure of phytolithic growth in streams in the Great Smoky Mountains National Park, Tennessee. Hydrobiologia 1985, 123, 59–67. [Google Scholar] [CrossRef]
  86. Boulenger, C.; Crivelli, A.J.; Charrier, F.; Roussel, J.M.; Feunteun, E.; Acou, A. Difference in factors explaining growth rate variability in European eel subpopulations: The possible role of habitat carrying capacity. Ecol. Freshw. Fish 2014, 25, 281–294. [Google Scholar] [CrossRef]
  87. Verbiest, H.; Breukelaar, A.; Ovidio, M.; Philippart, J.-C.; Belpaire, C. Escapement success and patterns of downstream migration of female silver eel Anguilla anguilla in the River Meuse. Ecol. Freshw. Fish 2012, 21, 395–403. [Google Scholar] [CrossRef]
  88. Nzau Matondo, B.; Benitez, J.P.; Dierckx, A.; Philippart, J.C.; Ovidio, M. Assessment of the entering stock, migration dynamics and fish pass fidelity of European eel in the Belgian Meuse River. River Res. Appl. 2017, 33, 292–301. [Google Scholar] [CrossRef]
Figure 1. Map of study areas in Southern Belgium (A) and site locations in rivers (B) where glass eels were released. * indicates restocked sites. * indicates restocked sites surveyed. * indicates unrestocked sites surveyed.
Water 15 03133 g001
Figure 2. Abundance and biomass (A), relative abundance (B) and density (C,D) of eels according to ages and sectors/rivers. (n) indicates the number of electrofishing sessions. Rivers or sectors with at least one common letter are not statistically different (KW and PD tests, p < 0.05).
Water 15 03133 g002
Figure 3. Total length (TL) (A) and K Fulton’s condition factor (B) according to age and TL according to rivers (C). n is sample size. Ages with at least one common letter are not significantly different (KW and PD tests, p < 0.05).
Water 15 03133 g003
Figure 4. Relative abundance of silvering phase and mean TL according to silvering phase at each age of eels. (n) is the sample size.
Water 15 03133 g004
Figure 5. Capture probability (A), survival (B), arrival estimate (C), yields in overall population (D), superpopulation (E), estimated abundance (F) and immigration-to-emigration net ratio (G) of restocked eels using Jolly–Seber model. Sampling occasion number was 3 from 2018 (eels 1+) to 2020 (eels 3+) in all sectors except sector 2 in river A where it was 4 from 2017 (eels 0+) to 2020 (eels 3+). Sectors/rivers with different letters are statistically different (FET test: (AE), KW and PD tests: (FG) and p < 0.05).
Water 15 03133 g005
Table 1. Eel length–weight relationships in rivers pooled: a, intercept; b, slope; and K, Fulton’s condition factor (in mean ± standard error values). *** indicates p < 2.2 × 10⁻¹⁶. K values with different letters are significantly different (KW and PD tests, p < 0.05).
YearAgenbaF−StatisticAdjusted R²K, Mean ± SE
20170+3273.285−3.10329270.901 ***0.162 ± 0.027 a
20181+5243.019−2.8196590.950 ***0.166 ± 0.043 a
20192+4033.129−2.9597460.963 ***0.171 ± 0.034 b
20203+3293.156−2.99852770.945 ***0.174 ± 0.037 c
20214+1433.269−3.13723010.946 ***0.194 ± 0.040 e
20225+1953.102−2.9278580.944 ***0.181 ± 0.050 d
Disclaimer/Publisher’s Note: The statements, opinions and data contained in all publications are solely those of the individual author(s) and contributor(s) and not of MDPI and/or the editor(s). MDPI and/or the editor(s) disclaim responsibility for any injury to people or property resulting from any ideas, methods, instructions or products referred to in the content.

