Article

Potential Toxic-Element Pollution in Surface Water and Its Implications for Aquatic and Human Health: Source–Pathway–Receptor Model

Centre for Environmental Management, Faculty of Natural and Agricultural Sciences, University of the Free State, Bloemfontein 9300, South Africa
*
Author to whom correspondence should be addressed.
Water 2023, 15(17), 3100; https://doi.org/10.3390/w15173100
Submission received: 19 July 2023 / Revised: 16 August 2023 / Accepted: 24 August 2023 / Published: 29 August 2023
(This article belongs to the Special Issue Studies on Soil and Water Contamination)

Abstract

:
This study focused on assessing the extent of pollution in both flowing and non-flowing surface water within the Matjhabeng mining area of South Africa, with particular emphasis on the substantial impact of gold mine tailings. A comprehensive analysis of physical water-quality attributes, including potentially toxic elements (PTEs), and relevant pollution risk indices was undertaken. To comprehensively elucidate the potential risks to aquatic organisms and human health, a risk assessment framework predicated upon the source–pathway–receptor model was developed. Principal Component Analysis (PCA) was employed as a multivariate statistical tool to discern the potential origins of PTE contamination within the environment. The results substantiate pronounced pollution manifestations within the surface water milieu of the Matjhabeng mining area. Specifically, concentrations of critical PTEs, such as arsenic, cobalt, copper, iron, selenium, and zinc, exhibited transgressions of the regulatory thresholds stipulated by both the South African Department of Water Affairs and Forestry (DWAF) and the Canadian Council of the Ministers of the Environment (CCME). Additionally, concentrations of the aforementioned elements exceeded the stipulated DWAF guidelines for irrigation water usage. Pollution indices, encompassing the Single-Factor Pollution Index and the Nemerow Integrated Pollution Index, discerned moderate contamination stemming from As, while remarkably elevated pollution levels were identified for selenium. PCA elucidated 94.5% of the aggregate variance, revealing cobalt, copper, nickel, and zinc as coalescing within PC1, indicative of a common anthropogenic provenance that is conceivably linked to historical gold mine tailings. PC2 exhibited an aggregation of chromium, iron, and lead, reaffirming this shared anthropogenic etiology. The third PCA component was characterized by selenium, followed by arsenic and magnesium in the fourth. The resultant PTE contamination underscores a profound ecological and public health risk, impacting both the aquatic ecosystems and the local community within the precincts of the Matjhabeng Local Municipality (MLM) area, with consequential amplification of susceptibilities to deleterious health consequences. Urgent and concerted interventions are imperative to ameliorate the emergent decline in surface-water quality within the MLM locale. The adoption of nature-based remediation paradigms holds promise for efficaciously elevating water quality, ameliorating community health, and underpinning the long-term economic viability of the region.

1. Introduction

As an essential natural resource, water is indispensable for the survival of all living organisms on the planet. Additionally, surface water plays a crucial role in facilitating various human activities, such as agriculture, industry, mining, and recreation, and is a key driver of economic development [1,2]. However, in recent times, there has been growing concern over the pollution of surface water due to the proliferation of anthropogenic activities in the vicinity of these water sources. These activities include industrial and mining operations, wastewater treatment plants, abattoirs, and breweries, as well as agricultural practices, such as crop farming, livestock farming, and game farming [1,2]. While certain natural phenomena such as volcanic eruptions or evaporation may contribute to water pollution, the majority of water pollution is caused by human activities that take place on land [3].
Mining activities such as mine tailings are identified as the most significant sources of surface-water contamination in the vicinity of mining operations [4,5,6]. Surface-water contamination from mining activities can result from both point and diffuse sources of pollution. Point source pollution occurs when mining effluent is discharged into surface- water bodies through pipes or drains. On the other hand, mine tailing contaminants can be transmitted into surface water through wind, rainwater runoff, infiltration, the percolation of rainwater into soil and rocks, as well as groundwater flow [7,8,9,10,11]. Additionally, if a tailings dam leaks or collapses it could result in the release of contaminants from mine tailings into surface water [10,12,13,14,15,16,17,18]. Furthermore, the contaminants from polluted surface water may also leach into nearby soils and groundwater [18,19,20].
The pollution of surface water has far-reaching consequences, including threats to aquatic ecosystems, adverse socio-economic impacts, and detrimental effects on human health when communities are exposed to contaminated water [21]. Moreover, the persistence of contaminants in the environment exacerbates the overall deterioration of ecosystems and communities [22,23,24,25,26,27,28,29,30,31,32,33,34,35,36]. Potentially toxic elements (PTEs) in surface water, due to their non-biodegradable properties, can accumulate over time in specific body tissues of aquatic organisms, leading to significant threats to ecosystems [37]. These PTEs can then move from one trophic level to the next in the food chain, increasing as they are passed from a lower to a higher trophic level [38,39]. The use of surface water contaminated with PTEs for domestic purposes, recreational activities, and the irrigation of crops is a major health risk for communities [40].
Water pollution from mine tailing contamination has become a global issue, affecting various countries in Asia, Australia, Africa, and the United States [10,12,13,14,15,16,17,18]. For instance, in Mongolia in northern China, high concentrations of arsenic (As) and mercury (Hg) were found in rivers near a gold mine [41]. Similarly, in the Gold Ridge mine of Guadalcanal towards the south of Australia, river courses and sediments were contaminated with high levels of As, which were about ten times higher than the recommended levels in the area [40]. In African countries such as Kenya and Cameroon, mining activities in abandoned mining areas have resulted in high concentrations of arsenic (As), cadmium (Cd), chromium (Cr), iron (Fe), manganese (Mn), and lead (Pb) which exceeded the recommended limits in surface water [19,42,43]. These findings underscore the importance of addressing the issue of mine tailing contamination to protect the environment and human health.
The risk of surface-water pollution to aquatic organisms and human health can be evaluated using the source–pathway–receptor (SPR) model, which serves as a risk assessment framework [44]. Originally developed in the natural sciences, the SPR model describes the movement of pollutants from a specific source to a potential receptor via a transport pathway or route [45,46,47]. One of the key advantages of the SPR model is its flexibility and simplicity, which allows for the identification of the various components and their relationships within a complex system [47]. As a result, control options can be implemented to remediate pollution and mitigate the associated health risks to the community, thereby developing effective emergency procedures. This study focused on the anthropogenic sources of surface-water pollution, with particular emphasis on the pressing issue of mine tailings and mining-related contamination, to comprehensively evaluate the potential risks of PTE pollution of surface water on aquatic ecosystems and human health by using a risk assessment framework based on the innovative SPR model proposed in this study (Figure 1).
The risk assessment framework employed in this study was established through the application of the SPR model. The framework comprehensively examines the interplay of sources, pathways, and receptors of PTE pollution. Sources of contamination include various sectors, such as mining, industries, and agriculture, that release pollutants into the environment. The pathways through which these pollutants travel can be either point sources characterized by direct discharge into surface water bodies, or diffuse sources, which involve pollutants spreading through soil, groundwater, or the atmosphere. The ultimate receptors of concern are aquatic ecosystems and human health, both of which can be significantly impacted by PTE pollution. This framework offers a structured and comprehensive way to understand and assess the potential risks associated with contaminated surface water, considering the intricate relationships among sources, pathways, and receptors.
The objective of this research was to determine the potential risk of PTE pollution in surface water and its implications for aquatic organisms and human health using a risk assessment framework, based upon the SPR model proposed in this study within the case study mining area of the Matjhabeng Local Municipality (MLM). The extent of pollution risk in surface water was further assessed by analyzing indicators of pollution such as pH, temperature, electrical conductivity, turbidity, dissolved oxygen, and measuring PTEs, such as As, calcium (Ca), Cd, cobalt (Co), Cr, copper (Cu), Fe, magnesium (Mg), nickel (Ni), Pb, Se, and zinc (Zn), as well pollution risk indices, including the Single-Factor Pollution Index (PI) and Nemerow Integrated Pollution Index (NIPI).
By integrating the SPR framework, this study sought to suggest effective control measures to safeguard aquatic ecosystems and community well-being, offering actionable insights to stakeholders for targeted pollution management and sustainable water practices. Addressing contamination is critical, not only for ecological equilibrium but also for community health and economic prosperity. Remediation measures, such as nature-based solutions and wetland systems, hold promise for preserving water quality and mitigating the risks posed by contaminated water.

2. Materials and Methods

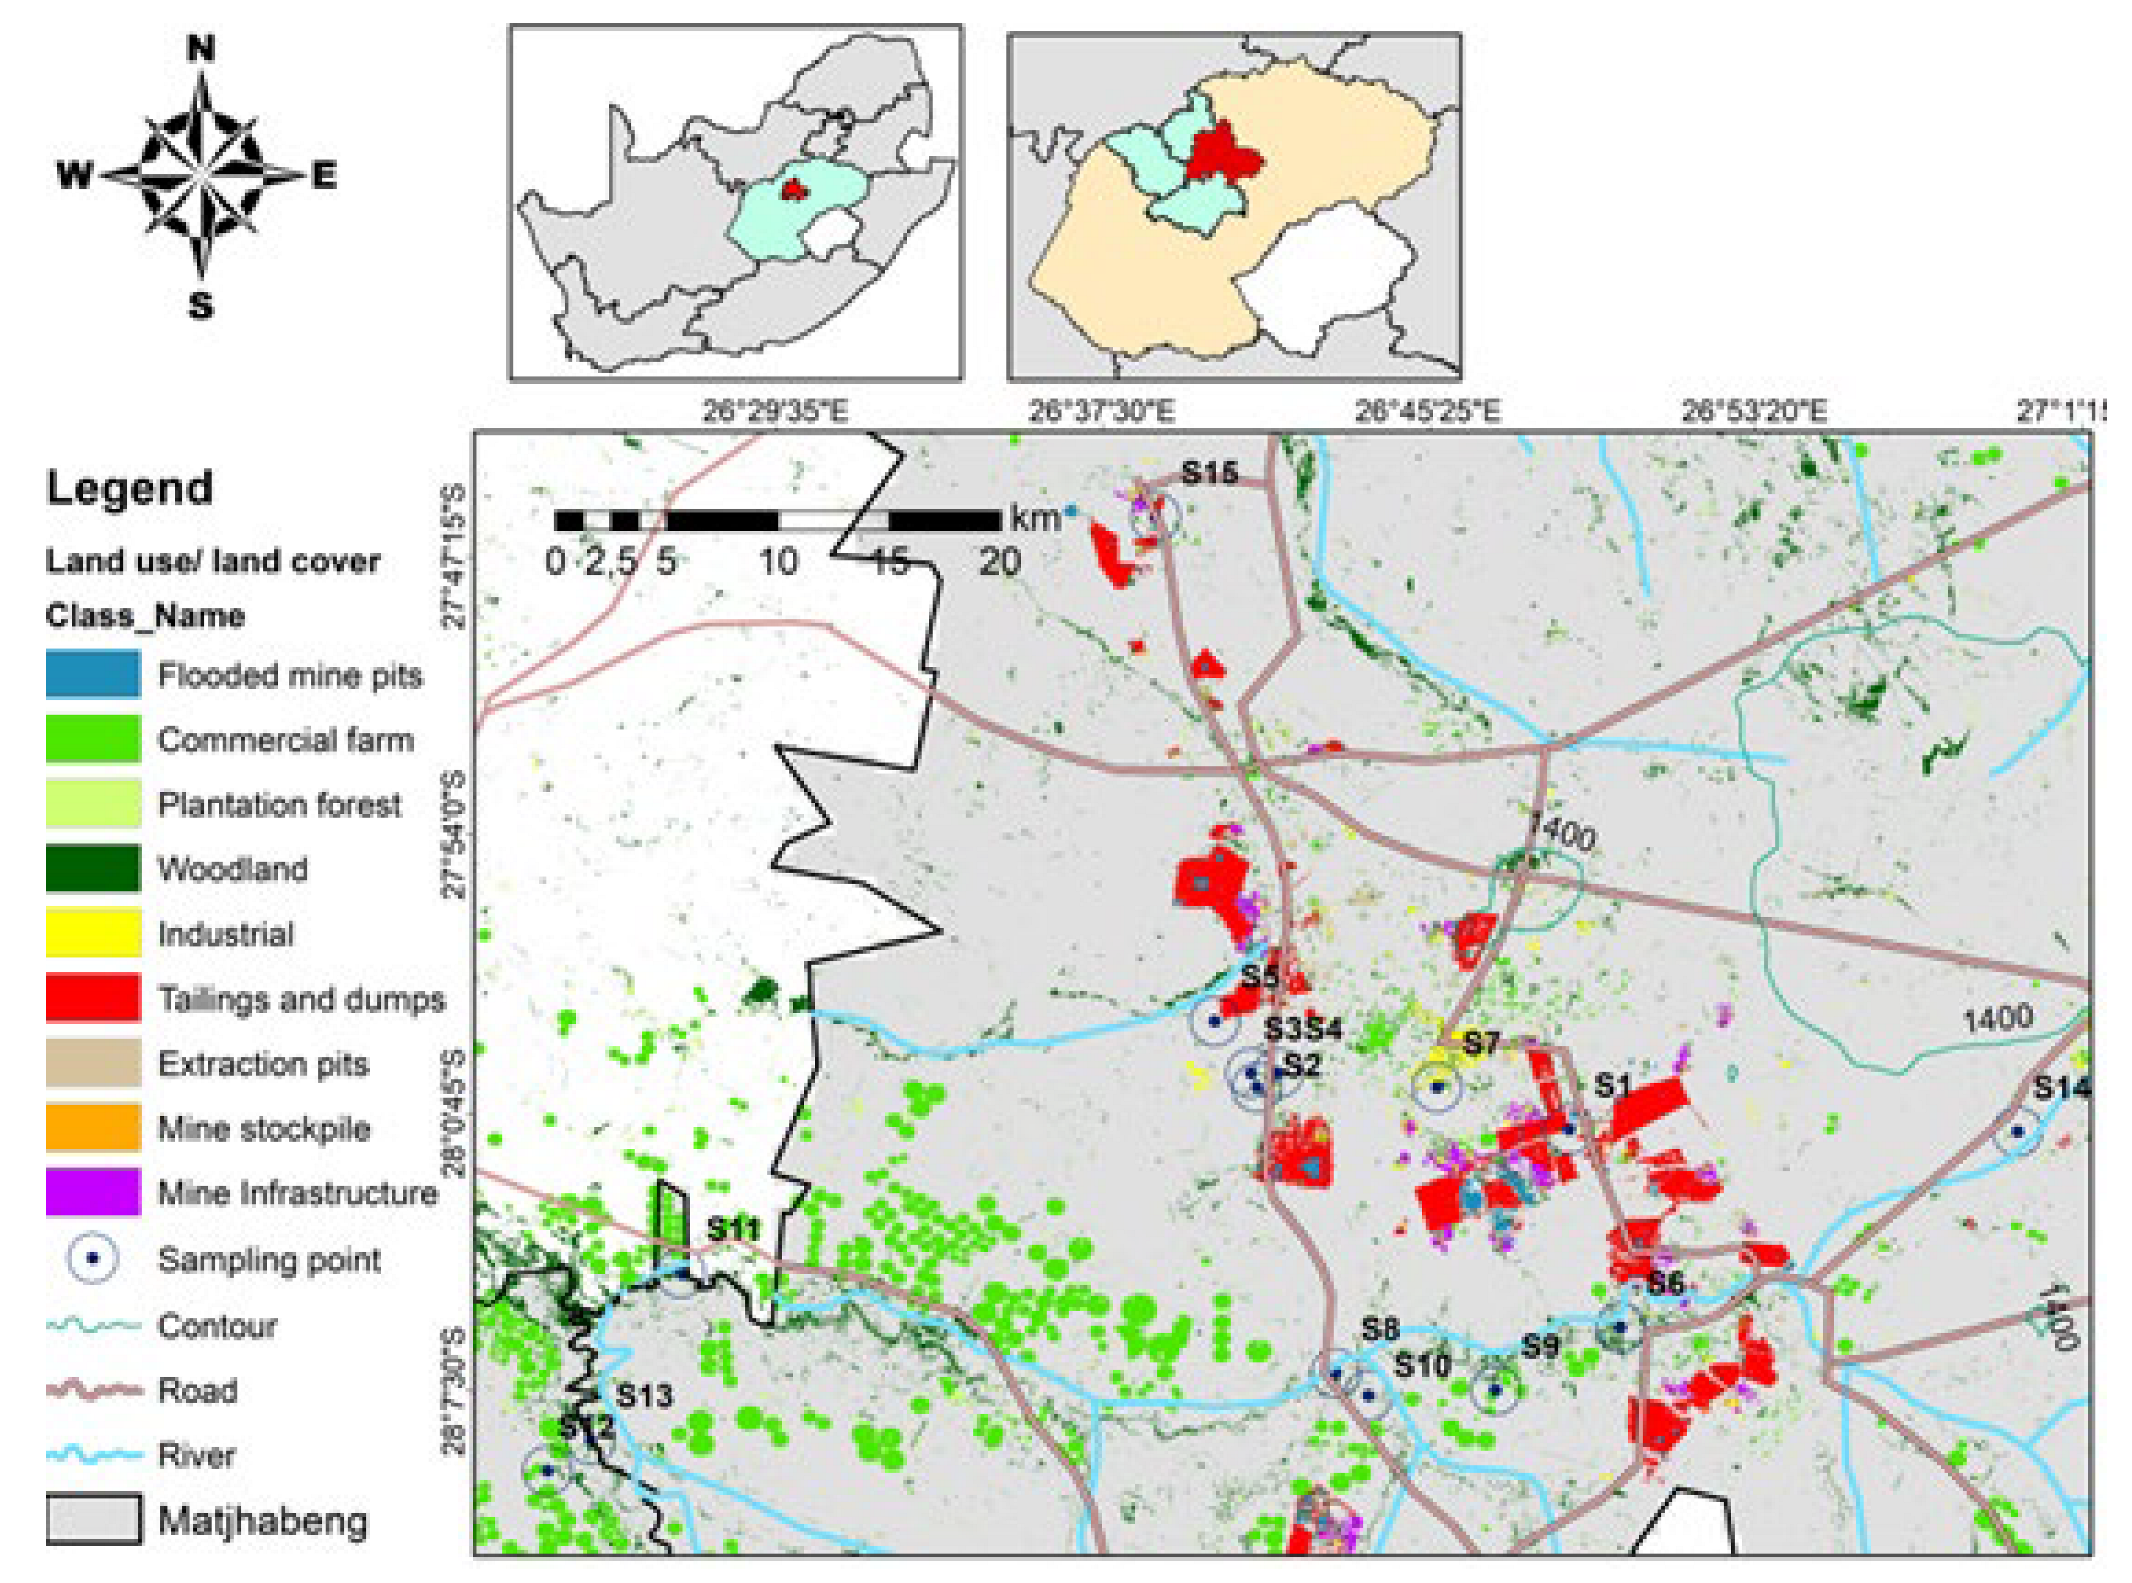
2.1. Study Area and Sample Collection

The case study area under consideration encompasses the MLM region, which is situated in the Lejweleputswa District Municipality. The area is characterized by a diverse range of land uses, including ongoing and historical gold mining activities, agricultural pursuits, as well as rural residential and light industrial development. It is geographically located in the northeastern region of the Free State province, South Africa. The MLM is approximately 250 km south of the city of Johannesburg in the Gauteng province and 140 km northeast of Bloemfontein, the provincial capital of the Free State province. The MLM region of South Africa is home to some of the country’s largest and most significant legacy gold fields. While several gold mines in the area have ceased operations, the majority of the active mines are owned and managed by Harmony Gold. Notable gold mines in the MLM area include St Helena, Phakisa, Masimong no. 5, and President Steyn no. 4. The extensive gold mining in these regions has resulted in significant areas of gold mine tailings, with many of these tailings situated in close proximity to both human settlements and surface water bodies in the region. Among the surface water bodies in the MLM case study area are the Sand River, the largest water catchment in the area, and the Vet River, which flows through the MLM area. Other surface water bodies in the region include Flamingo Pan, Flamingo Lake, Witpan, and Rietspruit Dam. These water bodies are all exposed to contaminants from gold mine tailings, which can be transported via runoff water during rainfall events and subsurface seepage into surface water bodies. However, certain dams in the area serve as mine water and seepage-containment facilities, acting as reservoir impoundments for both treated and untreated mine effluents from local mines. For this study, a total of fifteen sampling sites were selected across six towns within the MLM area, namely Allanridge, Bronville, Hennenman, Odendaalsrus, Virginia, and Welkom. Additionally, parts of the town of Bultfontein, situated outside the borders of the MLM area, were also included in the study. The selection of sampling sites was informed by various factors, including the presence or absence of legacy and active mines, mine tailing facilities, the distance from legacy and active mine tailings, anthropogenic activities such as industries and agriculture, and the direction of prevailing winds in the area. The prevailing wind direction, which signifies the most dominant surface wind with the highest speed in the MLM area, blows from north-north-east to the south-south-west direction. The prevailing wind direction in relation to the mine tailings (based on the weather statistics for Welkom Airport from 2018 [48]) was considered in this study since the wind is a transport partway for the transfer of PTEs from the mine tailings into surface water bodies.
Seven sampling sites, labeled S1 to S7, were situated in close proximity to legacy and active gold mines and tailing facilities within the town of Welkom in the MLM area. Three sampling sites, S8 to S10, were located approximately 5–7 km beyond the area, with several legacy and active gold mines and tailing facilities in the region of the Virginia town. An additional three sampling sites, S11 to S13, were situated approximately 30–37 km beyond the area with numerous legacy and active gold mines and tailing facilities, covering parts of Welkom and Bultfontein.
Sampling sites S1 to S7, as well as S8 to S10, were selected in the downstream direction of the prevailing wind, which blows from a north-northeast direction and inclines in a south-southwest direction. These sites have many legacy and active gold mines and tailing facilities in the MLM area. The prevailing wind direction and wind speeds were determined from statistics at Welkom Airport [48]. To determine if the Matjhabeng mining and tailing area was the main source of surface-water pollution in the MLM area, two control sites were selected in the upstream wind direction. Sampling site S14 was located in Hennenman town region, approximately 10–12 km east of the area with many legacy and active mines and tailing facilities in the MLM area. Similarly, sampling site S15 was located about 10–12 km north of the area with many legacy and active mines and mine tailing facilities in the MLM area. Figure 2 represents the case study area of the MLM, including the location of the control and sampling sites.

2.2. Applying the SPR Model to the Sampling Sites in the MLM Area as a Risk Assessment Framework to Assess the Potential Risk of Pollution on Aquatic Organisms and Human Health

Utilizing the SPR model, the sampling sites within the Matjhabeng mining area were analyzed, revealing the presence of both lentic and stagnant surface water bodies and lotic and flowing water systems. While lentic systems at S1, S2, and S5 were found to be polluted from point sources, the pollution footprint origin of the remaining sampling sites was primarily from diffuse point sources, including residential, industrial, agricultural, and mining activities. Contamination pathways for the natural environment involve the transfer of PTEs in surface and seepage water, rainfall runoff from different anthropogenic activities, as well as a possible aerial dispersion, which could be envisaged from the dominant wind direction in the area. Human activities that exposed the communities in the MLM area to PTE pollution involve recreational pursuits, spiritual practices, crop irrigation, and fishing for sustenance.
By applying the SPR model as a risk framework, Table 1 illustrates the movement of pollutants from a specific source to a potential receptor of environmental pollution through conducting pathways or transport modes. This information informed the pollution risk to aquatic ecosystems and human health.

2.3. Water Sampling and Water Property Management

Water samples were collected following the sampling procedure outlined by the Water Research Commission of South Africa [49]. Surface water from a dam, lake, river, stream, or pan at each sampling site was collected for the summer and winter seasons in 2018 for laboratory measurement of twelve PTEs, namely As, Ca, Cd, Co, Cr, Cu, Fe, Mg, Ni, Pb, Se, and Zn, which were chosen because of their association with gold mine tailing ores [50]. During the collection of the water samples, protective clothing, such as gloves and boots, were worn as a precaution against exposure to dangerous water pollutants that may cause diseases.
Surface-water samples were collected using one-liter plastic bottles that were rinsed with deionized water. In cases where access to surface water at a sampling site was challenging, a bucket was used, which was rinsed with distilled water and lowered into the water to collect the sample. The clearly labeled sampling bottles were then transported on ice in a cooler box to the water laboratory at the Central University of Technology and were refrigerated at 4 °C until analysis.
The physical and chemical properties of water were measured in order to assess the quality of surface water at each of the 15 sampling sites. Physical properties, such as pH, temperature, electrical conductivity (EC), dissolved oxygen (DO), and turbidity or total dissolved solids (TDS), were measured on site at each sampling site. The following calibrated instruments were used, namely a battery-operated Hach HQd (BEP-M Series) conductivity meter and a Hach 2100Q (EPA), 0-1000 NTU turbidity meter, following standard analytical procedures of the instruments.
The 12 PTEs were measured using inductively coupled plasma optical emission spectroscopy (ICP-OES). The water samples were digested with 70% nitric acid using open vessel digestion, following a modified method from Kisten et al. [51]. The digested samples were filtered and diluted to 25 mL with double-distilled water and then stored in the refrigerator for the PTE analysis. Triplicates of the digestion procedure were conducted to ensure the reliability of the results. The measurement of PTEs was carried out at the School of Chemistry and Physics at the Westville campus of the University of Kwa-Zulu Natal.

3. Data Analysis

3.1. Statistical Analysis of Water Quality Measurements

The measurements of surface-water quality were examined and processed using the statistical software SPSS Statistics Version 21.0 [52]. Descriptive statistics, including maximum, minimum, means, and standard deviations, were calculated for the physical water-quality measurements, and the percentage compliance to the water quality limits was also determined. Student’s t tests were run on the concentrations of the surface-water quality measurements at a 95% confidence interval to examine any seasonal differences between the measurements obtained for summer and winter.
Moreover, to determine whether these PTEs originated from the same environmental source, a principal component analysis (PCA) was done to compare the concentrations of the measured PTEs in surface water and their compositional relationship. This analytical approach reduces complex measurements and presents them in a simplified manner by extracting new variables, referred to as principal components, from previous variables such as metal concentrations and site [53].
To assess the degree of compliance, the physical water-quality measurements were compared with the water quality limits for the protection of aquatic organisms and human health as set by the Canadian Council of the Ministers of the Environment (CCME) [54]. However, since there are currently no surface-water quality guidelines in South Africa that encompass the majority of physical water-quality limits to safeguard aquatic organisms in streams, the limits set by the Aquatic Water Quality for Urban Streams (AWQUS) [55] were utilized for comparison purposes for the physical properties measured in this study.
Furthermore, the PTE measurements were compared with the water quality limits established by the CCME [54], as well as the South African Water Quality Guidelines developed by the Department of Water Affairs and Forestry (DWAF) for the protection of aquatic organisms and irrigation water use [56,57].

3.2. Pollution Indices

The PI and NIPI were used to assess the level of water pollution by PTEs in the study area. These indices provide an indication of whether surface-water contamination by PTEs is due to natural processes or anthropogenic activities [58]. The PI measures the pollution of individual PTEs in water at each sampling site, while the NIPI determines the total pollution of a given PTE across all sampling sites [59,60]. The PI for each PTE was determined using the following formula according to Zhao et al. [60]:
P i = C i S i
where Pi is the Single-Factor Pollution Index, Ci is the mean concentration of the PTEs in the water sample and Si is the background concentration of the PTEs in the earth’s crust. PI was classified as follows: non-pollution (Pi < 1), low level of pollution (1 > Pi < 2), moderate level of pollution (2 ≥ Pi < 3), strong level of pollution (3 ≥ Pi < 5), and very strong level of pollution (Pi ≤ 5) [61]. The NIPI, on the other hand, was expressed using Equation (2) [59]:
N I P I = P i M a x 2 + P i A v e 2 2
where NIPI is the Nemerow Integrated Pollution Index at location I, P i M a x 2 denotes the maximum PI value, and Pi Ave represents the average values of the PI of each PTE. NIPI can be classified according to five environmental quality categories, which include clean level (NIPI ≤ 0.7), precaution level (0.7 < NIPI ≤ 1.0), light pollution level (1.0 < NIPI ≤ 2.0), moderate level (2.0 < NIPI ≤ 3.0), and heavy pollution level (NIPI > 3.0) [61].

3.3. Determination of Quality Assurance and Quality Control

To ensure the reliability of the measured surface-water quality results, quality assurance procedures were implemented. Prior to taking on-site measurements of water quality properties, all instruments were calibrated, including the Hach 2100Q turbidity meter and Hach HQd handheld meter probes for dissolved oxygen (DO), pH, and electrical conductivity. Glassware was cleaned with double-distilled water throughout the study and analytical-grade reagents were used. Instrument readings were corrected using reagent blank determinations. To validate the analytical procedure, standard certified reference materials were used, specifically White Clover (BCR-402) from the Community Bureau of Reference of the Commission of the European Communities. All measurements were conducted in triplicate (n = 3).

4. Results

4.1. Physical Water-Quality Properties

The physical water-quality measurements were compared with the CCME [54] and AWQUS limits [55]. The pH results showed that sampling sites S3 and S5 were non-compliant for both the summer and winter seasons, whereas sites S4, S11, and S15 were non-compliant only for the winter season (Table 2). Regarding the EC measurements, 47% of the sampling sites were non-compliant with both CCME [54] and AWQUS limits [55]. Notably, the EC measurements at eleven sampling sites were substantially higher in the winter season than in the summer season, which may be explained by an increase in nutrient rich ions, such as phosphates, nitrates and chloride that were carried into surface water by flooding from excessive rain on the day of water sampling from mine tailings, agricultural fields, and from leaked sewage pipes, which in turn increased dissolved ions in the water.
Dissolved oxygen (DO) measurements were non-compliant with both limits at 53% of the sampling sites in summer and 33% of the sampling sites in winter. Furthermore, 27% of the sampling sites displayed temperature measurements that were non-compliant with the AWQUS limits [55]. In contrast, all measurements of turbidity were non-compliant with the AWQUS limits [55], except for site S5 in the winter season.
Furthermore, the physical water-quality properties for the surface-water samples were analyzed using Student’s t tests to determine the presence of any seasonal effects. The results revealed highly significant differences (p ≤ 0.05) between the two sampling seasons for pH, temperature, and EC variables. The p value, test statistics (t), and confidence limits for the five surface-water quality properties are also provided.

4.2. Potential Toxic Elements

Among the 12 measured PTEs, Cd, Cr, and Pb concentrations in the surface water were below the detection limits of the ICP-OES. Ni was detected in only one water sample collected at site S4. However, when compared with the water quality limits for the protection of aquatic organisms of CCME [54], As and Co showed high levels of non-compliance during the summer season, with a 73% non-compliance for As and a 93% non-compliance for Co (Table 3). For the winter season, Co was detected at site S5, which also exceeded the CCME [54] water quality limits. As showed 33% non-compliance during the summer season when compared with the aquatic water-quality limits of the DWAF [56]. For Cu, 33% of the water samples showed non-compliance during the summer season with both CCME [54] and DWAF [57] limits. In contrast, Cu measurements for the winter season revealed 100% non-compliance with DWAF [56] limits. All Se measurements were non-compliant with DWAF [56] limits during both seasons. For Fe, 20% of the water samples collected from various sites showed non-compliance with CCME [54] limits during the summer season, while 60% were non-compliant for the winter season. Zn was only detected at sampling site S5, which exceeded the CCME [54] aquatic water-quality limit during the summer season, while during the winter season, 53% of the Zn measurements exceeded the CCME [54] limits. However, when the PTE measurements above the ICP-OES limits were compared with the limits of the DWAF [57] water quality guidelines for irrigation, As, Co, Cu, and Se showed exceptionally high levels of non-compliance, with 100% non-compliance for both seasons. Similarly, measurements for Fe exceeded the DWAF [57] water quality limits at 20% of the sampling sites for the summer season and 40% of the sites for the winter season. For Zn, only one site (S5) exceeded the DWAF [57] limits during the summer season, while measurements at three sites (S5, S7, S14) exceeded the DWAF [57] limits during the winter season.
A statistical analysis was performed on the PTE measurements for the summer and winter seasons using Student’s t tests to determine if there were any significant differences between the two seasons. The results showed highly significant differences (p ≤ 0.05) between the two sampling seasons for As, Cd, Pb, Cr, Cu, Fe, Se, and Mg (Table 4).

4.3. Sources of Contamination of Potentially Toxic Elements in Surface Water

A multivariate PCA was performed on the measurable PTEs to investigate whether the detected PTEs in surface water originated from a common source. Only measurements taken during the summer season were included in the PCA because only a few measurements were detectable in the winter season using ICP-OES. The results of the multivariate PCA revealed four primary principal components (PCs) with eigenvalues greater than or equal to one, accounting for 91.47% of the total variance (Table 5). The loading had to be at least 0.6 to be included in a PC.
PC1 and PC2 were the most significant contributors to the total variance, accounting for almost 70% of the total variance. These PTEs could indicate the highest contamination level in the study area. PC1 showed high loadings for Co, Cu, Ni, and Zn, indicating they may have originated from the same source. Similarly, the high loadings of Pb, Cr, and Fe in PC2 may suggest that they share a common source of origin. PC3 had high loadings of Se, while As and Mg were found in PC4. The separation of As and Mg in PC4 suggests that they may have come from different sources in the environment.
Figure 3 shows the scatter plots exhibiting the principal component loadings for the 12 PTE measurements acquired from surface water. These scatter plots align with the outcomes of the multivariate PCA. The illustration unveils the presence of four principal components, the first and second of which are encompassed by a circular region. The outcome of the PCA revealed the existence of four primary principal components, which collectively suggest disparate origins for the PTEs detected within the environmental context. Notably, the clustering of PTEs within either PC1 or PC2 may infer a common provenance for these elements, potentially traceable to historical and ongoing gold mining activities, including legacy mines and associated tailings.

4.4. Pollution Indices

The results of the PI analysis revealed fluctuations in pollution levels for the four detectable PTEs across the various surface-water sampling sites, as shown in Figure 4. To compute the pollution risk indices, only measurements taken during the summer were used since only a few measurements were detectable in the winter. The PI outcomes for Co and Cu indicated that the concentrations of these PTEs were very low (Pi < 1) in 80% of the water samples, indicating a non-polluted state. However, in 20% of the water samples, a low level of pollution (1 > Pi < 2) was observed for Co, while less than 15% of the water samples demonstrated low to moderate pollution conditions by Cu (2 ≥ Pi < 3), with a single water sample revealing moderate pollution (2 ≥ Pi < 3).
Regarding As, the SFPI results exhibited that 40% of the water samples had no form of anthropogenic interference (Pi < 1). Nonetheless, four of the water samples showed moderate pollution levels (2 ≥ Pi < 3), while two surface-water samples had a strong pollution condition (3 ≥ Pi < 5). Remarkably, one water sampling site had a very high level of As pollution (Pi ≥ 5). In contrast, the SFPI outcomes for Se showed a very strong level of pollution (Pi ≥ 5) in 80% of the water samples, suggesting a significant amount of Se pollution in the surface water, attributable to anthropogenic activities.
The NIPI analysis revealed that the surface-water samples in the study area were subject to precautionary pollution levels by Co, with Cu displaying only light pollution levels and As exhibiting moderate pollution levels. However, Se demonstrated a heavy pollution level, indicating the highest degree of pollution in the surface-water samples within the MLM area.

5. Discussion

The findings of this study demonstrate that PTEs have severely contaminated the surface water in the MLM area. The As, Co, Cu, Fe, Se, and Zn concentrations in surface water bodies were significantly higher than both the CCME [54] and the DWAF [57] aquatic water-quality limits at most of the sampling sites. Moreover, As, Co, Cu, Fe, Ni, Se, and Zn concentrations exceeded the DWAF [62] guidelines for irrigation water use at most of the sampling sites. These results are similar to other results obtained in the literature, in which a high concentration of As, Pb, Cd, Mn, Cr, and Fe, above the limits, were measured in surface water as a result of mining activities within the vicinity of the abandoned mining areas [19,42,43]. The results of the pollution risk indices further confirmed that As, Co, Cu, and Se have highly contaminated the surface water in the MLM area. According to a previous study by Dey et al. [63], the PI results also confirmed that the water of the Halda River in the south-eastern region of Bangladesh was highly contaminated by Cd, As, Pb, and Cu, while the NIPI results indicated that the river has been highly polluted. Anthropogenic sources, such as legacy and active gold mines and mine tailings, agricultural activities, effluents from wastewater treatment plants, light industrial activities, and local residential areas, may have contributed to the presence of these PTEs in the environment, as confirmed by the SPR model proposed in this study.
The PCA outcomes revealed four prominent principal components, which imply distinct origins for the PTEs within the environment. However, the concentration of PTEs in either PC1 or PC2 could suggest a shared source for these elements, possibly stemming from legacy and current gold mining operations, including associated mines and tailings. However, most of the PTEs that exceeded the limits are typical contaminants associated with gold ores and gold mine tailings, as reported by previous studies [10,64,65]. Therefore, the legacy gold mine tailings and active mining activities in the area are likely the primary sources of pollution in the MLM area. The PCA results obtained in this study revealed closely similar results for PC1 and PC2 in a study conducted in KwaZulu-Natal, South Africa [66]. This contamination of surface water bodies by PTEs poses a severe risk to aquatic organisms and the local community in the MLM area. The exposure to polluted water through the consumption of contaminated food crops and vegetables irrigated with polluted water, or from recreational activities, puts the community at a high risk of adverse health effects.
The contamination of surface water by Se in the MLM area can potentially cause developmental deformities and mortality in the larval stages of certain aquatic organisms. Similarly, the high concentrations of As and Co detected in the surface water can cause severe toxicity to aquatic organisms due to their accumulation in the cells of these organisms, including liver and kidney cells [67,68]. Fish and other aquatic organisms that consume As may experience chronic and acute toxicity, including growth inhibition, immune system dysfunction, and death [67]. In addition to haem oxidation, blockage of inorganic Ca channels, cytotoxicity, and genotoxicity, chronic exposure to Co can also change enzyme activities in gills, the liver, and muscle tissues [69,70,71,72].
Fish and other aquatic organisms need the nutrients Fe, Cu, and Zn, which are essential nutrients for their growth, but high concentrations of Fe in the water, above the limits of the surface-water quality guidelines, can indirectly harm fish by creating conducive conditions for the growth of Fe bacteria on the gill surfaces of fish, which oxidizes ferrous Fe to ferric oxide. Increased ammonia in the blood plasma levels and damage to the kidney, liver, and spleen tissues can result from the presence of insoluble Fe on gill surfaces [72]. High levels of Cu that are absorbed by fish cells can impair metabolism and affect brain function as well as growth and reproduction [73]. Moreover, chronic exposure to Zn ions can be fatal for freshwater fish and aquatic organisms [68,74].
It is evident that the aquatic life in the MLM area is at serious risk from PTE contamination of surface water bodies. The accumulation of these pollutants in the cells of fish and other aquatic organisms can cause acute and chronic toxicity, immune system dysfunction, inhibition of growth and reproduction, and even death. Therefore, it is crucial to implement appropriate measures to mitigate PTE pollution in the MLM area to prevent further damage to aquatic life and protect the well-being of local communities, whose livelihoods depend on these water sources.
In addition to the harmful effects of polluted water on aquatic organisms in the MLM area, the local community is also at risk of severe health consequences from the ingestion of As, Co, Cu, Fe, Ni, Se, and Zn in contaminated food crops and vegetables irrigated with polluted water, as well as from incidental ingestion during recreational activities. Long-term exposure to inorganic As in contaminated food crops can result in negative health effects like developmental problems, diabetes, pulmonary disease, and cardiovascular disease. Acute As poisoning symptoms include vomiting, abdominal pain, and diarrhea [75]. Similarly, consuming Cu from contaminated food samples can result in metal fume fever, dermatitis, hair and skin discoloration, and respiratory tract illnesses [68]. Wilson’s and Menkes’ diseases, as well as Alzheimer’s and Parkinson’s diseases, could all develop as a result of high Cu levels in food samples [76,77]. Excess intake of Co with dietary samples may cause gastrointestinal and endocrine disorders [78]. Furthermore, excessive amounts of Fe in the human body can damage tissues and cause disorders of Fe metabolism, such as Fe overload [79]. It is crucial to address the potential health risks associated with contaminated food crops in the MLM area to protect the health and well-being of the local community.

6. Conclusions

This study proposed a risk assessment framework based on the SPR model to assess the potential threat of PTE pollution in surface water and its implications for aquatic organisms and human health. By applying the SPR model, it was found out that the sources of pollution in the MLM case study area included anthropogenic sources, such as legacy and active gold mines and mine tailings, agricultural activities, effluents from wastewater treatment plants, light industrial activities, and local residential areas. Pathways for contamination identified were surface and seepage water, rainfall runoff from different anthropogenic activities, as well as transport of PTE by wind-blown dust. Human activities that expose individuals to PTE pollution from water sources encompass recreational activities, spiritual practices, crop irrigation, and fishing for food.
The findings underscore the alarming degradation of surface water in the MLM region. The majority of sampled sites exhibited extensive contamination levels of elements such as As, Co, Cu, Fe, Se, and Zn, surpassing the aquatic guideline limits. Moreover, As, Co, Cu, Fe, Ni, Se, and Zn concentrations surpassed the recommended irrigation water-use thresholds. Pollution indices confirmed moderate pollution from As, with particularly elevated levels for Se. This situation poses a considerable threat to both aquatic organisms and the local communities who rely on these water sources for various activities.
To address this issue, local authorities must implement remediation measures. One potential approach involves employing cost-effective nature-based solutions, including floating treatment wetlands in dams, constructing wetlands, and restoring natural wetland systems in highly contaminated areas. These measures can aid in elevating the quality of surface water in the MLM region, thwarting further deterioration, and minimizing the potential risks posed by contaminated water to aquatic life and human health.
Implementing such remediation measures extends beyond environmental and public health considerations; it also contributes to the long-term sustainability of the region’s economy. Given the integral role of the mining sector in the MLM area and South Africa, a healthy environment remains crucial for the continuous growth of this industry. Consequently, collaboration among all stakeholders becomes imperative to ensure the prompt and effective execution of these remediation strategies.
Future research directions from this study should focus on a multifaceted approach to enhance our understanding of PTE pollution in surface water and its broader implications. Long-term monitoring efforts should be established to track pollution trends and assess the effectiveness of implemented remediation measures. Advanced techniques, such as isotopic fingerprinting and modeling, can be employed to accurately pinpoint pollution sources. Ecotoxicological studies must delve deeper into the impacts of PTE contamination on aquatic organisms across various trophic levels and life stages. Additionally, comprehensive human-health-risk assessments are needed to assess the potential health consequences of exposure to contaminated water sources, considering factors such as consumption patterns and the vulnerability of different demographic groups. Innovative and sustainable remediation methods should be explored, including hybrid engineered–natural solutions and the potential integration of phytoremediation.
Moreover, community engagement and participatory approaches are essential to promote pollution awareness, behavior changes, and collaborative efforts for prevention and management. Evaluating the effectiveness of existing policies and regulatory frameworks in addressing PTE pollution and fostering adaptive strategies to climate change impacts on pollution dynamics, are crucial aspects. Comparative studies across similar regions can provide valuable insights into context-specific pollution patterns and inform tailored interventions. Overall, this multidisciplinary research agenda aims at guiding comprehensive strategies for mitigating PTE pollution, safeguarding aquatic ecosystems, and ensuring the health and well-being of local communities in the MLM region and beyond.

Author Contributions

G.B. was the principal researcher who collected the samples from the field and analyzed them in the laboratory, as well as wrote the manuscript; P.O. and Y.S. reviewed and edited the manuscript. All authors have read and agreed to the published version of the manuscript.

Funding

This research was funded by the National Research Foundation (NRF) of South Africa (Grant 612, number UID: 107624) and partly by the Central University of Technology, Free State, South Africa.

Conflicts of Interest

The authors declare that there are no conflict of interest.

Abbreviations

AsArsenic
AWQUSAquatic Water-Quality for Urban Streams
CaCalcium
CCMECanadian Council of the Ministers of the Environment
CdCadmium
CoCobalt
CrChromium
Cu Copper
DODissolved oxygen
DWAFDepartment of Water Affairs and Forestry
ECElectrical conductivity
FeIron
HgMercury
ICP-OESInductively coupled plasma optical emission spectroscopy
MLMMatjhabeng Local Municipality
MgMagnesium
MnManganese
NIPINemerow Integrated Pollution Index
PbLead
PCPrincipal components
PCAPrincipal component analysis
PTEPotentially toxic elements
PISingle-Factor Pollution Index
SPRSource–pathway–receptor

References

  1. Akhtar, N.; Ishak, M.I.S.; Bhawani, S.A.; Umar, K. Various Natural and Anthropogenic Factors Responsible for Water Quality Degradation: A Review. Water 2021, 13, 2660. [Google Scholar] [CrossRef]
  2. Bessah, E.; Raji, A.O.; Taiwo, O.J.; Agodzo, S.K.; Ololade, O.O.; Strapasson, A.; Donkor, E. Assessment of Surface Waters and Pollution Impacts in Southern Ghana. Hydrol. Res. 2021, 52, 1423–1435. [Google Scholar] [CrossRef]
  3. Roșca, O.M.; Dippong, T.; Marian, M.; Mihali, C.; Mihalescu, L.; Hoaghia, M.; Jelea, M. Impact of Anthropogenic Activities on Water Quality Parameters of Glacial Lakes from Rodnei Mountains, Romania. Environ. Res. 2020, 182, 109136. [Google Scholar] [CrossRef] [PubMed]
  4. Dusengemungu, L.; Mubemba, B.; Gwanama, C. Evaluation of Heavy Metal Contamination in Copper Mine Tailing Soils of Kitwe and Mufulira, Zambia, for Reclamation Prospects. Sci. Rep. 2022, 12, 11283. [Google Scholar] [CrossRef]
  5. Hao, Q.; Jiang, C. Heavy Metal Concentrations in Soils and Plants in Rongxi Manganese Mine of Chongqing, Southwest of China. Acta Ecol. Sin. 2015, 35, 46–51. [Google Scholar] [CrossRef]
  6. Luo, G.; Han, Z.; Xiong, J.; He, Y.; Liao, J.; Wu, P. Heavy Metal Pollution and Ecological Risk Assessment of Tailings in the Qinglong Dachang Antimony Mine, China. Environ. Sci. Pollut. Res. 2020, 28, 33491–33504. [Google Scholar] [CrossRef]
  7. Bae, D.-Y.; Kumar, H.K.; Han, J.-H.; Kim, J.-Y.; Kim, K.-W.; Kwon, Y.-H.; An, K.-G. Integrative Ecological Health Assessments of an Acid Mine Stream and in situ Pilot Tests for Wastewater Treatments. Ecol. Eng. 2010, 36, 653–663. [Google Scholar] [CrossRef]
  8. Boularbah, A.; Schwartz, C.; Bitton, G.; Morel, J.L. Heavy Metal Contamination from Mining Sites in South Morocco: 1. Use of a Biotest to Assess Metal Toxicity of Tailings and Soils. Chemosphere 2006, 63, 802–810. [Google Scholar] [CrossRef]
  9. Djebbi, C.; Chaabani, F.; Font, O.; Queralt, I.; Querol, X. Atmospheric Dust Deposition on Soils Around an Abandoned Fluorite Mine (Hammam Zriba, NE Tunisia). Environ. Res. 2017, 158, 153–166. [Google Scholar] [CrossRef]
  10. Chen, Y.; Jiang, X.; Wang, Y.; Zhuang, D. Spatial Characteristics of Heavy Metal Pollution and the Potential Ecological Risk of a Typical Mining Area: A Case Study in China. Process Saf. Environ. Prot. 2018, 113, 204–219. [Google Scholar] [CrossRef]
  11. Wahl, J.J.; Maboeta, M.S.; Eijsackers, H.J.P.; Van Rensburg, L. Soil Ecological Risk Assessments of Selected South African Soils and Derivation of Soil Quality Standards. Suid-Afrik. Tydskr. Nat. Tegnol. S. Afr. J. Sci. Tech. 2013, 32, a830. [Google Scholar] [CrossRef]
  12. Bowker, L.N.; Chambers, D.M. In the dark shadows of the supercycle tailings failure risk & public liability reach all-time highs. Environments 2017, 4, 75. [Google Scholar] [CrossRef]
  13. Caldwell, J.A.; Oboni, F.; Oboni, C. Tailings Facility Failures in 2014 and an Update on Failure Statistics. In Proceedings of the Proceedings Tailings and Mine Waste 2015, Vancouver, BC, Canada, 26–28 October 2015; pp. 25–28. Available online: https://www.riskope.com/wp-content/uploads/2015/10/Tailings-Facility-Failures-in-2014-and-an-Update-on-Failure-Statistics.pdf (accessed on 26 August 2022).
  14. Chryss, A.; Fourie, A.B.; Monch, A.; Nairn, D.; Seddon, K.D. Towards an Integrated Approach to Tailings Management. J. S. Afr. Inst. Min. Metal. 2012, 112, 965–969. [Google Scholar] [CrossRef]
  15. Glotov, V.E.; Chlachula, J.; Glotova, L.P.; Little, E. Causes and Environmental Impact of the Gold-Tailings Dam Failure at Karamken, the Russian Far East. Eng. Geol. 2018, 245, 236–247. [Google Scholar] [CrossRef]
  16. Hudson-Edwards, K.A.; Macklin, M.G.; Miller, J.R.; Lechler, P.J. Sources, distribution and storage of heavy metals in the Rio Pilcomayo, Bolivia. J. Geochem. Explor. 2001, 72, 229–250. [Google Scholar] [CrossRef]
  17. Islam, K.; Vilaysouk, X.; Murakami, S. Integrating Remote Sensing and Life Cycle Assessment to Quantify the Environmental Impacts of Copper-Silver-Gold Mining: A Case Study from Laos. Resour. Conser. Recycl. 2020, 154, 104630. [Google Scholar] [CrossRef]
  18. Lin, S.-Q.; Wang, G.-J.; Liu, W.-L.; Zhao, B.; Shen, Y.-M.; Wang, M.-L.; Li, X.-S. Regional Distribution and Causes of Global Mine Tailings Dam Failures. Metals 2022, 12, 905. [Google Scholar] [CrossRef]
  19. Ngure, V.; Davies, T.; Kinuthia, G.; Sitati, N.; Shisia, S.; Oyoo-Okoth, E. Concentration Levels of Potentially Harmful Elements from Gold Mining in Lake Victoria Region, Kenya: Environmental and Health Implications. J. Geochem. Explor. 2014, 144, 511–516. [Google Scholar] [CrossRef]
  20. Xu, D.-M.; Zhan, C.-L.; Liu, H.-X.; Lin, H.-Z. A Critical Review on Environmental Implications, Recycling Strategies, and Ecological Remediation for Mine Tailings. Environ. Sci. Pollut. Res. 2019, 26, 35657–35669. [Google Scholar] [CrossRef]
  21. Mehta, N.; Cocerva, T.; Cipullo, S.; Padoan, E.; Dino, G.A.; Ajmone-Marsan, F.; Cox, S.F.; Coulon, F.; De Luca, D.A. Linking Oral Bioaccessibility and Solid Phase Distribution of Potentially Toxic Elements in Extractive Waste and Soil from an Abandoned Mine Site: Case Study in Campello Monti, NW Italy. Sci. Total Environ. 2019, 651, 2799–2810. [Google Scholar] [CrossRef]
  22. Boente, C.; Martin-Méndez, I.; Bel-Lán, A.; Gallego, J.R. A Novel and Synergistic Geostatistical Approach to Identify Sources and Cores of Potentially Toxic Elements in Soils: An Application in the Region of Cantabria (Northern Spain). J. Geochem. Explor. 2020, 208, 106397. [Google Scholar] [CrossRef]
  23. Damian, G.; András, P.; Damian, F.; Turisová, I.; Iepure, G. The Role of Organo-Zeolitic Material in Supporting Phytoremediation of a Copper Mining Waste Dump. Int. J. Phytoremediation 2018, 20, 1307–1316. [Google Scholar] [CrossRef]
  24. Darko, G.; Boakye, K.O.; Nkansah, M.A.; Gyamfi, O.; Ansah, E.; Yevugah, L.L.; Acheampong, A.; Dodd, M. Human Health Risk and Bioaccessibility of Toxic Metals in Topsoils from Gbani Mining Community in Ghana. J. Health Pollut. 2019, 9, 190602. [Google Scholar] [CrossRef] [PubMed]
  25. Delil, A.D.; Köleli, N. Investigation of a Combined Continuous Flow System for the Removal of Pb and Cd from Heavily Contaminated Soil. Chemosphere 2019, 229, 181–187. [Google Scholar] [CrossRef] [PubMed]
  26. de Souza, M.R.; da Silva, F.R.; de Souza, C.T.; Niekraszewicz, L.; Dias, J.F.; Premoli, S.; Corrêa, D.S.; do Couto Soares, M.; Marroni, N.P.; Morgam-Martins, M.I.; et al. Evaluation of the Genotoxic Potential of Soil Contaminated with Mineral Coal Tailings on Snail Helix aspersa. Chemosphere 2015, 139, 512–517. [Google Scholar] [CrossRef]
  27. Edokpayi, J.N.; Machaba, H.I.; Ogombe, H.S.; Odiyo, J.O. Evaluation of Contamination of Soil by Trace Metals from Dairy Wastewater in Limpopo Province, South Africa. Pharma Chem. 2016, 8, 16–24. [Google Scholar]
  28. Karlsson, T.; Räisänen, M.L.; Lehtonen, M.; Alakangas, L. Comparison of Static and Mineralogical ARD Prediction Methods in the Nordic Environment. Environ. Monit. Assess. 2018, 190, 719. [Google Scholar] [CrossRef]
  29. Kasemodel, M.C.; Papa, T.B.R.; Sígolo, J.B.; Rodrigues, V.G.S. Assessment of the Mobility, Bioaccessibility, and ecological risk of Pb and Zn on a Dirt Road Located in a Former Mining Area—Ribeira Valley—Brazil. Environ. Monit. Assess. 2019, 191, 101. [Google Scholar] [CrossRef]
  30. Kaupilla, P.M.; Tarvainen, T. Improving the Environmental Properties, Utilisation and Long-Term Prediction of Mining Wastes. Geol. Surv. Finl. Bull. 2018, 408, 1–111. [Google Scholar] [CrossRef]
  31. Khelifi, F.; Besser, H.; Ayadi, Y.; Liu, G.; Yousaf, B.; Harabi, S.; Bedoui, S.; Zighmi, K.; Hamed, Y. Evaluation of Potentially Toxic Elements (PTEs) Vertical Distribution in Sediments of Gafsa—Metlaoui Mining Basin (Southwestern Tunisia) Using Geochemical and Multivariate Statistical Analysis Approaches. Environ. Earth Sci. 2019, 78, 53. [Google Scholar] [CrossRef]
  32. Petrella, A.; Spasiano, D.; Cosma, P.; Rizzi, V.; Race, M. Evaluation of the Hydraulic and Hydrodynamic Parameters Influencing Photo-Catalytic Degradation of Bio-Persistent Pollutants in a Pilot Plant. Chem. Eng. Commun. 2019, 206, 1286–1296. [Google Scholar] [CrossRef]
  33. Petrella, A.; Spasiano, D.; Rizzi, V.; Cosma, P.; Race, M.; Vietro, N.D. Thermodynamic and Kinetic Investigation of Heavy Metals Sorption in Packed Bed Columns by Recycled Lignocellulosic Materials from Olive Oil Production. Chem. Eng. Commun. 2019, 206, 1715–1730. [Google Scholar] [CrossRef]
  34. Väänänen, K.; Kauppila, T.; Mäkinen, J.; Leppänen, M.T.; Lyytikäinen, M.; Akkanen, J. Ecological Risk Assessment of Boreal Sediments Affected by Metal Mining: Metal Geochemistry, Seasonality, and Comparison of Several Risk Assessment Methods. Integr. Environ. Assess. Manag. 2016, 12, 759–771. [Google Scholar] [CrossRef] [PubMed]
  35. Wang, Y.-L.; Tsou, M.-C.; Liao, H.-T.; Hseu, Z.-Y.; Dang, W.; Hsi, H.-C.; Chien, L.-C. Influence of Soil Properties on the Bioaccessibility of Cr and Ni in Geologic Serpentine and Anthropogenically Contaminated Non-Serpentine Soils in Taiwan. Sci. Total Environ. 2020, 714, 136761. [Google Scholar] [CrossRef]
  36. Yang, S.; Li, P.; Liu, J.; Bi, X.; Ning, Y.; Wang, S.; Wang, P. Profiles, Source Identification and Health Risks of Potentially Toxic Metals in Pyrotechnic-Related Road Dust During Chinese New Year. Ecotoxicol. Environ. Saf. 2019, 184, 109604. [Google Scholar] [CrossRef]
  37. Goretti, E.; Pallottini, M.; Ricciarini, M.I.; Selvaggi, R.; Cappelletti, D. Heavy Metals Bioaccumulation in Selected Tissues of Red Swamp Crayfish: An Easy Tool for Monitoring Environmental Contamination Levels. Sci. Total Environ. 2016, 559, 339–346. [Google Scholar] [CrossRef]
  38. Ali, H.; Khan, E.; Sajad, M.A. Phytoremediation of heavy metals—Concepts and applications. Chemosphere 2013, 91, 869–881. [Google Scholar] [CrossRef]
  39. Oberholster, P.J.; Myburgh, J.G.; Ashton, P.J.; Coetzee, J.J.; Botha, A.M. Bioaccumulation of Aluminium and Iron in the Food Chain of Lake Loskop, South Africa. Ecotoxicol. Environ. Saf. 2012, 75, 134–141. [Google Scholar] [CrossRef]
  40. Albert, S.; Kvennefors, C.; Jacob, K.; Kera, J.; Grinham, A. Environmental Change in a Modified Catchment Downstream of a Gold Mine, Solomon Islands. Environ. Pollut. 2017, 231, 942–953. [Google Scholar] [CrossRef]
  41. Gao, Z. Evaluation of Heavy Metal Pollution and its Ecological Risk in One River Reach of a Gold Mine in Inner Mongolia, Northern China. Int. Biodeterior. Biodegrad. 2018, 128, 94–99. [Google Scholar] [CrossRef]
  42. Bouzekri, S.; El Fadili, H.; El Hachimi, M.L.; El Mahi, M.; Lotfi, E.M. Assessment of Trace Metals Contamination in Sediment and Surface Water of Quarry Lakes from the Abandoned Pb Mine Zaida, High Moulouya-Morocco. Environ. Dev. Sustain. 2020, 22, 7013–7031. [Google Scholar] [CrossRef]
  43. Rakotondrabe, F.; Ngoupayou, J.R.N.; Mfonka, Z.; Rasolomanana, E.H.; Abolo, A.J.N.; Ako, A.A. Water Quality Assessment in the Bétaré-Oya Gold Mining Area (East-Cameroon): Multivariate Statistical Analysis Approach. Sci. Total Environ. 2018, 610–611, 831–844. [Google Scholar] [CrossRef]
  44. Fisheries and Oceans Canada. Practitioners Guide to the Risk Management Framework for DFO Habitat Management Staff, Version 1.0. Habitat Management Program, Fisheries and Oceans Canada. 2013. Available online: https://waves-vagues.dfo-mpo.gc.ca/library-bibliotheque/343443.pdf (accessed on 30 June 2023).
  45. Ballesteros, C.; Jiménez, J.A.; Viavattene, C. A Multi-Component Flood Risk Assessment in the Maresme Coast (NW Mediterranean). Nat. Hazards 2018, 90, 265–292. [Google Scholar] [CrossRef]
  46. Holdgate, M.W. A Perspective of Environmental Pollution; Cambridge University Press: Cambridge, UK, 1979. [Google Scholar]
  47. Waldschläger, K.; Lechthaler, S.; Stauch, G.; Schüttrumpf, H. The Way of Microplastics Through the Environment—Application of the Source-Pathway-Receptor Model (Review). Sci. Total Environ. 2020, 713, 136584. [Google Scholar] [CrossRef] [PubMed]
  48. Wind Finder. Wind and Weather Forecast. 2018. Available online: https://www.windfinder.com/forecast/welkom (accessed on 26 August 2022).
  49. Water Research Commission. Quality of Domestic Water Supplies; Volume 2: Sampling Guide; Water Research Commission: Pretoria, South Africa, 2003; Available online: http://www.wrc.org.za/wp-content/uploads/mdocs/TT-117-99.pdf (accessed on 30 June 2023).
  50. Etteieb, S.; Magdouli, S.; Zolfaghari, M.; Brar, S.K. Monitoring and Analysis of Selenium as an Emerging Contaminant in Mining Industry: A Critical Review. Sci. Total Environ. 2020, 698, 134339. [Google Scholar] [CrossRef] [PubMed]
  51. Kisten, K.; Gounden, D.; Moodley, R.; Jonnalagadda, S.B. Elemental distribution and uptake by watercress (Nasturtium aquaticum) as a function of water quality. J. Environ. Sci. Health Part B Pestic. Food Contam. Agric. Wastes 2015, 50, 439–447. [Google Scholar] [CrossRef]
  52. IBM SPSS Statistics for Windows; Version 21. IBM SPSS Statistics for Windows, Version 21.0; IBM Corp.: Armonk, NY, USA, 2012.
  53. Wu, J.; Teng, Y.; Lu, S.; Wang, Y.; Jiao, X. Evaluation of Soil Contamination Indices in a Mining Area of Jiangxi, China. PLoS ONE 2014, 9, e112917. [Google Scholar] [CrossRef] [PubMed]
  54. Canadian Council of Ministers of the Environment. Canadian Environmental Water Quality Guidelines: Water—Aquatic Life. Publication No. 1299. 2023. Available online: https://ccme.ca/en/resources/water-aquatic-life (accessed on 30 June 2023).
  55. Belle, G.; Fossey, A.; Esterhuizen, L. Use of Multiple Indicators to Assess the Pollution Condition of Urban Streams: A Case Study of Bloemspruit, Free State Province, South Africa. Water Environ. J. 2020, 34, 93–105. [Google Scholar] [CrossRef]
  56. Department of Water Affairs and Forestry. South African Water Quality Guidelines. Volume 5: Agricultural Use: Livestock Watering, 2nd ed.; Department of Water Affairs and Forestry: Pretoria, South Africa, 1996. Available online: https://www.dws.gov.za/iwqs/wq_guide/edited/Pol_saWQguideFRESH_vol5_Livestockwatering.pdf (accessed on 28 June 2023).
  57. Department of Water Affairs and Forestry. South African Water Quality Guidelines. Volume 7: Aquatic Ecosystems, 2nd ed.; Department of Water Affairs and Forestry: Pretoria, South Africa, 1996. Available online: https://www.dws.gov.za/iwqs/wq_guide/edited/Pol_saWQguideFRESH_vol7_Aquaticecosystems.pdf (accessed on 28 June 2023).
  58. Sutherland, R.A. Bed sediment-associated trace metals in an urban stream, Oahu, Hawaii. Environ. Geol. 2000, 39, 611–627. [Google Scholar] [CrossRef]
  59. Wang, Z.; Liu, X.; Qin, H. Bioconcentration and Translocation of Heavy Metals in the Soil-Plants System in Machangqing Copper Mine, Yunnan Province, China. J. Geochemic. Explor. 2019, 200, 159–166. [Google Scholar] [CrossRef]
  60. Zhao, K.; Fu, W.; Ye, Z.; Zhang, C. Contamination and Spatial Variation of Heavy Metals in the Soil-Rice System in Nanxun County, Southeastern China. Int. J. Environ. Res. Public Health 2015, 12, 1577–1594. [Google Scholar] [CrossRef] [PubMed]
  61. Yang, P.; Yang, M.; Mao, R.; Shao, H. Multivariate-Statistical Assessment of Heavy Metals for Agricultural Soils in Northern China. Sci. World J. 2014, 2014, 517020. [Google Scholar] [CrossRef] [PubMed]
  62. Department of Water Affairs and Forestry. South African Water Quality Guidelines. Volume 4: Agricultural Use: Irrigation, 2nd ed.; Department of Water Affairs and Forestry: Pretoria, South Africa, 1996. Available online: https://www.dws.gov.za/iwqs/wq_guide/Pol_saWQguideFRESHIrrigationvol4.pdf (accessed on 28 June 2023).
  63. Dey, M.; Akter, A.; Islam, S.; Dey, S.C.; Choudhury, T.R.; Fatema, K.J.; Begum, B.A. Assessment of contamination level, pollution risk and source apportionment of heavy metals in the Halda River water, Bangladesh. Heliyon 2021, 7, e08625. [Google Scholar] [CrossRef] [PubMed]
  64. He, L.; Gao, B.; Luo, X.; Jiao, J.; Qin, H.; Zhang, C.; Dong, Y. Health Risk Assessment of Heavy Metals in Surface Water Near a Uranium Tailing Pond in Jiangxi Province, South China. Sustainability 2018, 10, 1113. [Google Scholar] [CrossRef]
  65. Liang, Y.; Yi, X.; Dang, Z.; Wang, Q.; Luo, H.; Tang, J. Heavy Metal Contamination and Health Risk Assessment in the Vicinity of a Tailing Pond in Guangdong, China. Int. J. Environ. Res. Public Health 2017, 14, 1557. [Google Scholar] [CrossRef]
  66. Mahlangeni, N.T.; Moodley, R.; Jonnalagadda, S.B. Heavy metal distribution in Laportea peduncularis and growth soil from the eastern parts of KwaZulu-Natal, South Africa. Environ. Monit. Assess. 2016, 188, 76. [Google Scholar] [CrossRef]
  67. Kumari, B.; Kumar, V.; Sinha, A.K.; Ahsan, J.; Ghosh, A.K.; Wang, H.; DeBoeck, G. Toxicology of Arsenic in Fish and Aquatic Systems. Environ. Chem. Lett. 2017, 15, 43–64. [Google Scholar] [CrossRef]
  68. Shah, A.I. Heavy Metal Impact on Aquatic Life and Human Health—An Over View. In Proceedings of the IAIA17 Conference Proceedings, 37th Annual Conference of the International Association for Impact Assessment, Montréal, QC, Canada, 4–7 April 2017; Available online: https://conferences.iaia.org/2017/final-papers/Shah,20Alkesh%20-%20Heavy20Metal20Impacto20on20Aquatic20Life20and20Human20Health.pdf (accessed on 28 June 2023).
  69. Karthikeyan, P.; Marigoudar, S.R.; Nagarjuna, A.; Sharma, K.V. Toxicity Assessment of Cobalt and Selenium on Marine Diatoms and Copepods. Environ. Chem. Ecotoxicol. 2019, 1, 36–42. [Google Scholar] [CrossRef]
  70. Kosiorek, M.; Wyszkowski, M. Effect of Cobalt on the Environment and Living Organisms—A Review. Appl. Ecol. Environ. Res. 2019, 17, 11419–11449. [Google Scholar] [CrossRef]
  71. Sun, Z.; Gong, C.; Ren, J.; Zhang, X.; Wang, G.; Liu, Y.; Ren, J.; Zhao, X.; Yu, Q.; Wang, Y.; et al. Toxicity of Nickel and Cobalt in Japanese Flounder. Environ. Pollut. 2020, 263 Pt B, 114516. [Google Scholar] [CrossRef]
  72. Slaninova, A.; Machova, J.; Svobodova, Z. Fish Kill Caused by Aluminium and Iron Contamination in a Natural Pond used for Fish Rearing: A Case Report. Vet. Med. 2014, 59, 573–581. [Google Scholar] [CrossRef]
  73. United States Environmental Protection Agency. Aquatic Life Criteria—Copper. 2017. US EPA. Available online: https://www.epa.gov/wqc/aquatic-life-criteria-copper (accessed on 30 June 2023).
  74. Hogstrand, C.; Wood, C.M. The Physiology and Toxicology of Zinc in Fish. In Toxicology of Aquatic Pollution: Physiological, Molecular and Cellular Approaches; Cambridge University Press: Cambridge, UK, 2010; pp. 61–84. [Google Scholar] [CrossRef]
  75. World Health Organization. A Global Overview of National Regulations and Standards for Drinking-Water Quality. Geneva. 2018. Available online: https://apps.who.int/iris/handle/10665/272345 (accessed on 28 June 2023).
  76. Huat, T.J.; Camats-Perna, J.; Newcombe, E.A.; Valmas, N.; Kitazawa, M.; Medeiros, R. Metal Toxicity Links to Alzheimer’s Disease and Neuroinflammation. J. Mol. Biol. 2019, 431, 1843–1868. [Google Scholar] [CrossRef] [PubMed]
  77. Pohanka, M. Copper and Copper Nanoparticles Toxicity and Their Impact on Basic Functions in the Body. Bratisl. Med. J. 2019, 120, 397–409. [Google Scholar] [CrossRef] [PubMed]
  78. Chen, R.J.; Lee, V.R. Cobalt Toxicity; StatPearls Publishing: St. Petersburg, FL, USA, 2023. Available online: https://pubmed.ncbi.nlm.nih.gov/36508548/ (accessed on 1 August 2022).
  79. Abbaspour, N.; Hurrell, R.; Kelishadi, R. Review on Iron and its Importance for Human Health. J. Res. Med. Sci. 2014, 19, 164–174. [Google Scholar]
Figure 1. Risk assessment framework developed by applying the source–pathway–receptor model.
Water 15 03100 g001
Figure 2. Study area of Matjhabeng Local Municipal area, showing the 15 surface-water sampling sites.
Water 15 03100 g002
Figure 3. Principal component scatter plot in rotated space of the twelve potential harmful elements measured in surface water during the summer season, with the PTEs in PC1 and PC2 showing clusters.
Water 15 03100 g003
Figure 4. Single-Factor Pollution Index and Numerow Integrated Pollution Index of the level of pollution by the different PTEs for the different surface-water sampling sites for the summer season.
Water 15 03100 g004
Table 1. Applying the source–pathway–receptor model as a risk assessment framework to the sampling sites of the Matjhabeng mining area.
Sampling Point IdentificationLentic or
Lotic System
Source (Water) Origin and
Characteristics
Source of Potential
Contamination
Pathway of Potential
Contamination
Receptor of Potential Contamination through Source Use
S1 Toe seepage trench (28.01895 °S, 026.81354 °E)LoticToe seepage from gold tailing
facility.
Tailing facility, Harmony mine,
water treatment plant, and
landfill site.
Groundwater, surface water,
i.e., Sand River.
A possible aerial dispersion.
Irrigation of crops, borehole use, communities, and terrestrial and aquatic ecosystems.
S2 Dam
(28.00199 °S, 026.68741°E)
LenticWastewater effluent discharge point from the Theronia Wastewater treatment plant.
Saline dam.
Wastewater effluent.Into Flamingo Pan, surface
water, and groundwater.
A possible aerial dispersion.
Borehole use, communities
(recreational use at Flamingo Pan), and terrestrial and aquatic ecosystems.
S3 Flamingo Pan (27.99623 °S, 026.68496 °E)LenticSaline natural dam.
Wastewater effluent from the Theronia Wastewater treatment plant. Important bird biodiversity and conservation area.
Wastewater effluent.From S2.
Surface water, groundwater.
A possible aerial dispersion.
Boreholes for domestic use,
communities using the pan for
recreational use, and terrestrial and aquatic ecosystems.
S4 Flamingo Lake (27.99614 °S, 026.69608 °E)LenticSaline natural. Dam used for recreation. Important bird area. Stormwater inflow from nearby residential areas. Inflow from nearby legacy gold tailing facility. Inflow and seepage from wastewater treatment facility.Stormwater and legacy gold
mining tailing seepage.
Ground and surface water.
A possible aerial dispersion.
Community-consuming fish caught in the dam.
Aquatic and terrestrial ecosystems.
S5 Toe seepage dam
(27.97519 °S, 026.67041 °E)
LenticToe-seepage-containment dam from gold tailing facility.Legacy gold tailing facility.Surface and groundwater.
Migrating into Ganspan and
the Sand River.
A possible aerial dispersion.
Boreholes, irrigation of crops, schools, and general spiritual and recreational activities of the inflow water sources.
S6 VoëlpanLenticNatural pan.
Inflow from stormwater.
Nearby mining discard facilities and mining activities.Surface and groundwater.
A possible aerial dispersion.
Domestic water source, boreholes, and aquatic and terrestrial ecosystems
S7 Witpan (28.00191 °S, 026.76025 °E)LenticNatural pan.
Inflow from stormwater, rainfed.
Nearby legacy and active mining
activities, industrial activities, and stormwater inflow from surrounding areas.
Surface and groundwater.
A possible aerial dispersion.
Domestic water source, borehole use, and aquatic and terrestrial
ecosystems.
S8 Sand River (28.11.755 °S, 026.71919 °E)LoticNatural river system.Legacy and active mining activities and tailings facilities; residential, agricultural, industrial, and wastewater effluent, including storm water.Surface and groundwater.
A possible aerial dispersion.
Domestic water source, boreholes, irrigation of crops, and agricultural water use. Terrestrial and aquatic ecosystems. Recreational and
spiritual community use.
S9 Dam (28.12449 °S, 026.78390 °E)LenticIrrigation dam from the water treatment facility.Contaminated river water.Ground and surface water.
A possible aerial dispersion.
Irrigation of crops.
Borehole water use.
S10 Vet River (28.12659 °S, 026.73249 °E)LoticNatural river system.Legacy and active mining activities and tailing facilities; residential, agricultural, industrial, and wastewater effluent, including stormwater.Surface and groundwater.
A possible aerial dispersion.
Domestic water source, boreholes, irrigation of crops, and agricultural water use. Terrestrial and aquatic ecosystems. Recreational and
spiritual and community use.
S11 Sand River (28.07710 °S, 026.45457 °E)LoticNatural river system.Legacy and active mining activities and tailing facilities; residential, agricultural, industrial, and wastewater effluent, including stormwater.Surface and groundwater.
A possible aerial dispersion.
Domestic water source, boreholes, irrigation of crops, and agricultural water use. Terrestrial and aquatic ecosystems. Recreational and
spiritual and community use.
S12 Irrigation Canal (28.15707 °S, 026.40068 °E)LoticArtificially created
irrigation canal.
Legacy and activity mining; residential, industrial, and agricultural footprint.Surface and groundwater.
A possible aerial dispersion.
Agricultural irrigation of crops. Aquatic and terrestrial ecosystems.
S13 Vet River (28.14454 °S, 026.41808 °E)LoticNatural river system.Legacy and activity mining;
residential, industrial, and
agricultural footprint.
Surface and groundwater.
A possible aerial dispersion.
Agricultural irrigation, borehole water use. Spiritual and
recreational activities.
Fish consumption by communities.
S14 Rietspruit Dam (28.01989 °S, 026.99482 °E)LenticInflow from Rietspruit.Legacy and activity mining;
residential, industrial, and
agricultural footprint.
Surface and groundwater.
A possible aerial dispersion.
Agricultural irrigation, borehole water use. Spiritual and
recreational activities.
Fish consumption by communities.
S15 Sand River (27.77143 °S, 026.64635 °E)LoticNatural river system.Legacy and activity mining;
residential, industrial, and
agricultural footprint.
Surface and groundwater.
A possible aerial dispersion.
Agricultural irrigation, borehole water use. Spiritual and recreational activities.
Fish consumption by communities.
Table 2. Results of the physical water-quality properties of surface water for summer and winter.
PropertiespHTemperature (°C)EC (µs/cm)Turbidity (NTU)DO (mg/L)
Limit 16.5–9.0≤10006.5–9.5
Limit 25.5–9.0≥5 ≤ 25≤1000≤5.66.5–9.5
Site/
Season
SummerWinterSummerWinterSummerWinterSummerWinterSummerWinter
S16.608.7123.0014.0012.301036.00 *18.50 *9.51 *6.807.53
S27.698.8523.7014.507.601060.00 *45.50 *30.00 *4.00 *7.46
S39.25 *10.11 *25.50 *14.00146.70171.2032.70 *23.90 *12.29 *8.88
S48.669.58 *24.3014.4032.1028.3016.40 *14.80 *7.329.11
S54.00 *4.32 *23.7014.60100.6078.807.701.087.688.53
S68.188.6424.6014.20200.00241.00168.00 *57.60 *18.92 *10.40 *
S77.957.9026.40 *13.4016.401407.00 *24.70 *14.90 *6.784.07 *
S87.638.8024.6012.6011.70650.005.77 *24.60 *6.07 *7.67
S98.038.6324.0012.601.501557.00 *175.00 *150.00 *7.379.32
S107.757.4222.4010.804.00342.00295.00 *90.80 *0.13 *7.33
S117.749.08 *24.6012.8313.101074.00 *9.06 *8.36 *6.28 *12.77 *
S128.218.2423.9011.404.50467.00107.00 *52.10 *6.808.23
S137.718.0324.5013.0014.301197.00 *5.59 *70.50 *0.74 *0.16 *
S147.438.4325.20 *12.603.70167.4078.40 *179.00 *0.16 *7.66
S158.439.12 *25.50 *10.4025.201354.00 *22.80 *11.20 *14.24 *12.77 *
Maximum9.2510.1126.4014.60200.001557.00295.00179.0018.9212.77
Minimum4.004.3222.4010.801.5028.305.771.080.130.16
Mean7.688.3924.3913.0239.58722.0467.4749.227.048.13
Standard
deviation
1.181.311.021.3360.27539.8484.6353.625.123.08
Percentage
compliance
8767731001005300.064067
Student’s t tests
of seasonal variation
Mean
difference
0.7111.19−682.4618.25−1.09
95% Confidence
intervals
Lower−1.0210.45−999.12−20.31−3.43
Upper−0.3612.29366.9056.811.25
t −4.3926.52−4.621.01−0.99
p value 0.0010.00010.00010.3270.337
Notes: Measurements with an asterisk represent measurements outside the water quality guideline limits; t = test statistic; p = probability at p ≤ 0.05. Limit 1 = Canadian Council of Ministers of the Environment water quality limits [54]. Limit 2 = Aquatic Water Quality for Urban Streams limits [55].
Table 3. Results of the mean concentrations (mg kg−1) of potentially harmful elements for the surface-water samples for the 15 sampling sites for summer and winter.
Metals AsCoCuFeNiSeZnCaMg
limit 10.051.86.40.31500.3
limit 2≤10≤0.3≤0.2
limit 30.10.050.25.00.20.021.0
SitesNamesSeasons
S1Toe Seepage TrenchSummer2.5 (0.12) *2.5 (0.12) *NDNDND35.0 (3.69) *ND39,000 (16)13,520 (10)
WinterNDND1.5 (0.04) *NDND11.3 (1.25) *0.07 (0.01)1603 (14)188 (5)
S2DamSummer20.0 (0.69) *2.5 (0.36) *NDNDND42.5 (4.66) *ND38,025 (18)11,485 (5)
WinterNDND1.5 (0.03) *NDND28.5 (3.10) *0.3 (0.03)1896 (7)104 (3)
S3Flamingo PanSummerND2.5 (0.54) *NDNDND20.0 (2.30) *ND36,650 (15)66,875 (8)
WinterNDND1.5 (0.04) *NDNDNDND1937 (6)4378 (11)
S4Flamingo LakeSummer17.5 (1.35) *2.5 (0.63) *NDND4.6 (1.03) *30.0 (3.50) *ND26,200 (13)23,017.5 (5)
WinterNDND1.5 (0.03) *2.7 (0.10) *NDNDND1078 (1)829 (8)
S5Toe Seepage DamSummer0 (0)22.5 (1.99) *60.0 (9.82) *NDND32.5 (4.02) *5.4 (1.50) *250,000 (23)125,600 (14)
WinterND2.5 (0.10) *2.9 (0.15) *NDND12.0 (1.07) *12.6 (0.73) *10,643 (29)3326 (11)
S6VoëlpanSummer15.0 (1.59) *30.0 (1.58) *5.0 (1.53) *NDNDNDND277,500 (23)92,875 (14)
WinterNDND1.5 (0.02) *0.04 (0.01) *NDNDND16,567 (9)6296 (7)
S7Witpan Summer5.0 (1.02) *2.5 (0.36) *2.5 (1.08) *NDND15.0 (1.23) *ND34,675 (13)11,797 (10)
WinterNDND1.5 (0.07) *NDND14.5 (0.52) *2.6 (0.53) *3311 (7)209 (3)
S8Sand River Summer0 (0)2.5 (0.78) *25.0 (2.06) *NDNDNDND32,000 (16)12,985 (10)
WinterNDND1.5 (0.02) *7.1 (0.05) *NDND0.03 (0.01)959 (6)119 (8)
S9DamSummer2.5 (0.58) *25 (1.72) *30.0 (3.98) *2780.0 (6) *ND47.5 (3.21) *ND14,030 (11)4915 (6)
WinterNDND1.4 (0.02) *20.2 (3.97) *ND11.0 (0.96) *0.7 (0.08) *189 (2)ND
S10Vet RiverSummer5.0 (1.58) *2.5 (0.25) *ND82.5 (3.00) *ND42.5 (5.88) *ND9890 (13)3985 (5)
WinterNDND1.45 (0.02) *15.4 (0.32) *ND25.1 (0.50) *0.4 (0.02) *747 (4)ND
S11Sand RiverSummerNDND30.0 (4.00) *NDNDNDND33,050 (13)10,780 (6)
WinterNDND1.46 (0.01) *3.2 (0.22) *NDND0.5 (0.01) *1572 (7)311 (3)
S12Irrigation CanalSummer12.5 (1.02) *5.0 (1.00) *NDNDND25.0 (2.7) *ND10,467.5 (13)3595 (8)
WinterNDND1.44 (0.01) *3.4 (0.53) *ND15.6 (0.18) *0.6 (0.02) *1004 (3)ND
S13Vet RiverSummer7.5 (0.54) *2.5 (1.04) *NDNDNDNDND44,000 (14)16,030 (7)
WinterNDND1.48 (0.03) *9.1 (0.01) *ND12.9 (2.15) *0.2 (0.04)1508 (3)166 (3)
S14Rietspruit DamSummer5.0 (0.23) *2.5 (0.06) *ND1277.5 (5) *ND27.5 (2.82) *ND10,270 (12)4020 (3)
WinterNDND1.47 (0.04) *20.8 (3.28) *ND24.7 (1.41) *2.5 (0.29) *1051 (5)ND
S15Sand River Summer25.0 (1.07) *2.5 (0.09) *NDNDND20.1 (3.62) *ND49,875 (14)32,100 (10)
WinterNDND1.49 (0.02) *5.6 (0.52) *NDND0.4 (0.03) *1921 (8)616 (3)
Notes: 1 CCME = Canadian Council of Ministers of the Environment water quality limits [54]. 2 DWAF = South African Water Quality Guidelines—Aquatic Ecosystems [56]. 3 DWAF = South African Water Quality Guidelines—Irrigation Water Use [57]. Numbers with an asterisk = represent measurements that exceeded the guideline limits. ND = Below instrument detection limit. Measurements in brackets ( ) represent standard deviation.
Table 4. Results of the Student’s t tests for seasonal variation in the potentially harmful elements of the surface-water samples.
Potentially Harmful
Elements
MeanMean Difference95% Confidence Interval
of the Difference
tp Value
SummerWinterLowerUpper
As0.360.000.360.190.544.170.0001
Cd−27.840.00−27.84−51.71−3.98−2.350.023
Pb−0.530.00−0.53−0.77−0.29−4.460.0001
Co7.230.167.06−3.4117.541.350.181
Cr−0.400.00−0.40−0.59−0.22−4.380.0001
Cu0.121.60−1.48−1.62−1.33−20.040.0001
Fe−19.515.85−25.36−45.08−5.65−2.590.01
Ni7.760.007.76−12.1327.650.7860.43
Se0.5010.41−9.91−12.95−6.86−6.560.001
Zn9.211.437.78−18.1233.690.600.54
Ca2837.643203.56−365.92−1 654.67922.83−0.570.57
Mg1734.691107.27627.42−17.201 272.041.960.05
Notes: t = test statistic; p = probability, indicating significance at p ≤ 0.05.
Table 5. Results of the principal component loading for the measurements of potentially toxic elements in surface water.
Potentially Harmful
Elements
Component
PC1PC2PC3PC4
As−0.219−0.5870.0750.663
Pb−0.0770.765−0.5050.082
Co0.977−0.1530.122−0.032
Cr−0.1020.952−0.2400.020
Cu0.988−0.0750.115−0.043
Fe−0.1370.7900.3740.009
Ni0.992−0.0570.059−0.038
Se0.192−0.0560.945−0.017
Zn0.994−0.0270.070−0.034
Ca0.611−0.619−0.1750.084
Mg0.0320.145−0.0600.940
Eigenvalues4.8532.6071.4071.196
Percentage of total variance44.11623.70112.78710.868
Percentage of cumulative variance44.11667.81680.60391.471
Disclaimer/Publisher’s Note: The statements, opinions and data contained in all publications are solely those of the individual author(s) and contributor(s) and not of MDPI and/or the editor(s). MDPI and/or the editor(s) disclaim responsibility for any injury to people or property resulting from any ideas, methods, instructions or products referred to in the content.

