Interprovincial Virtual Water-Energy Flow and Its Network Structure Resilience in Yangtze River Economic Belt
Abstract
:1. Introduction
2. Materials and Methods
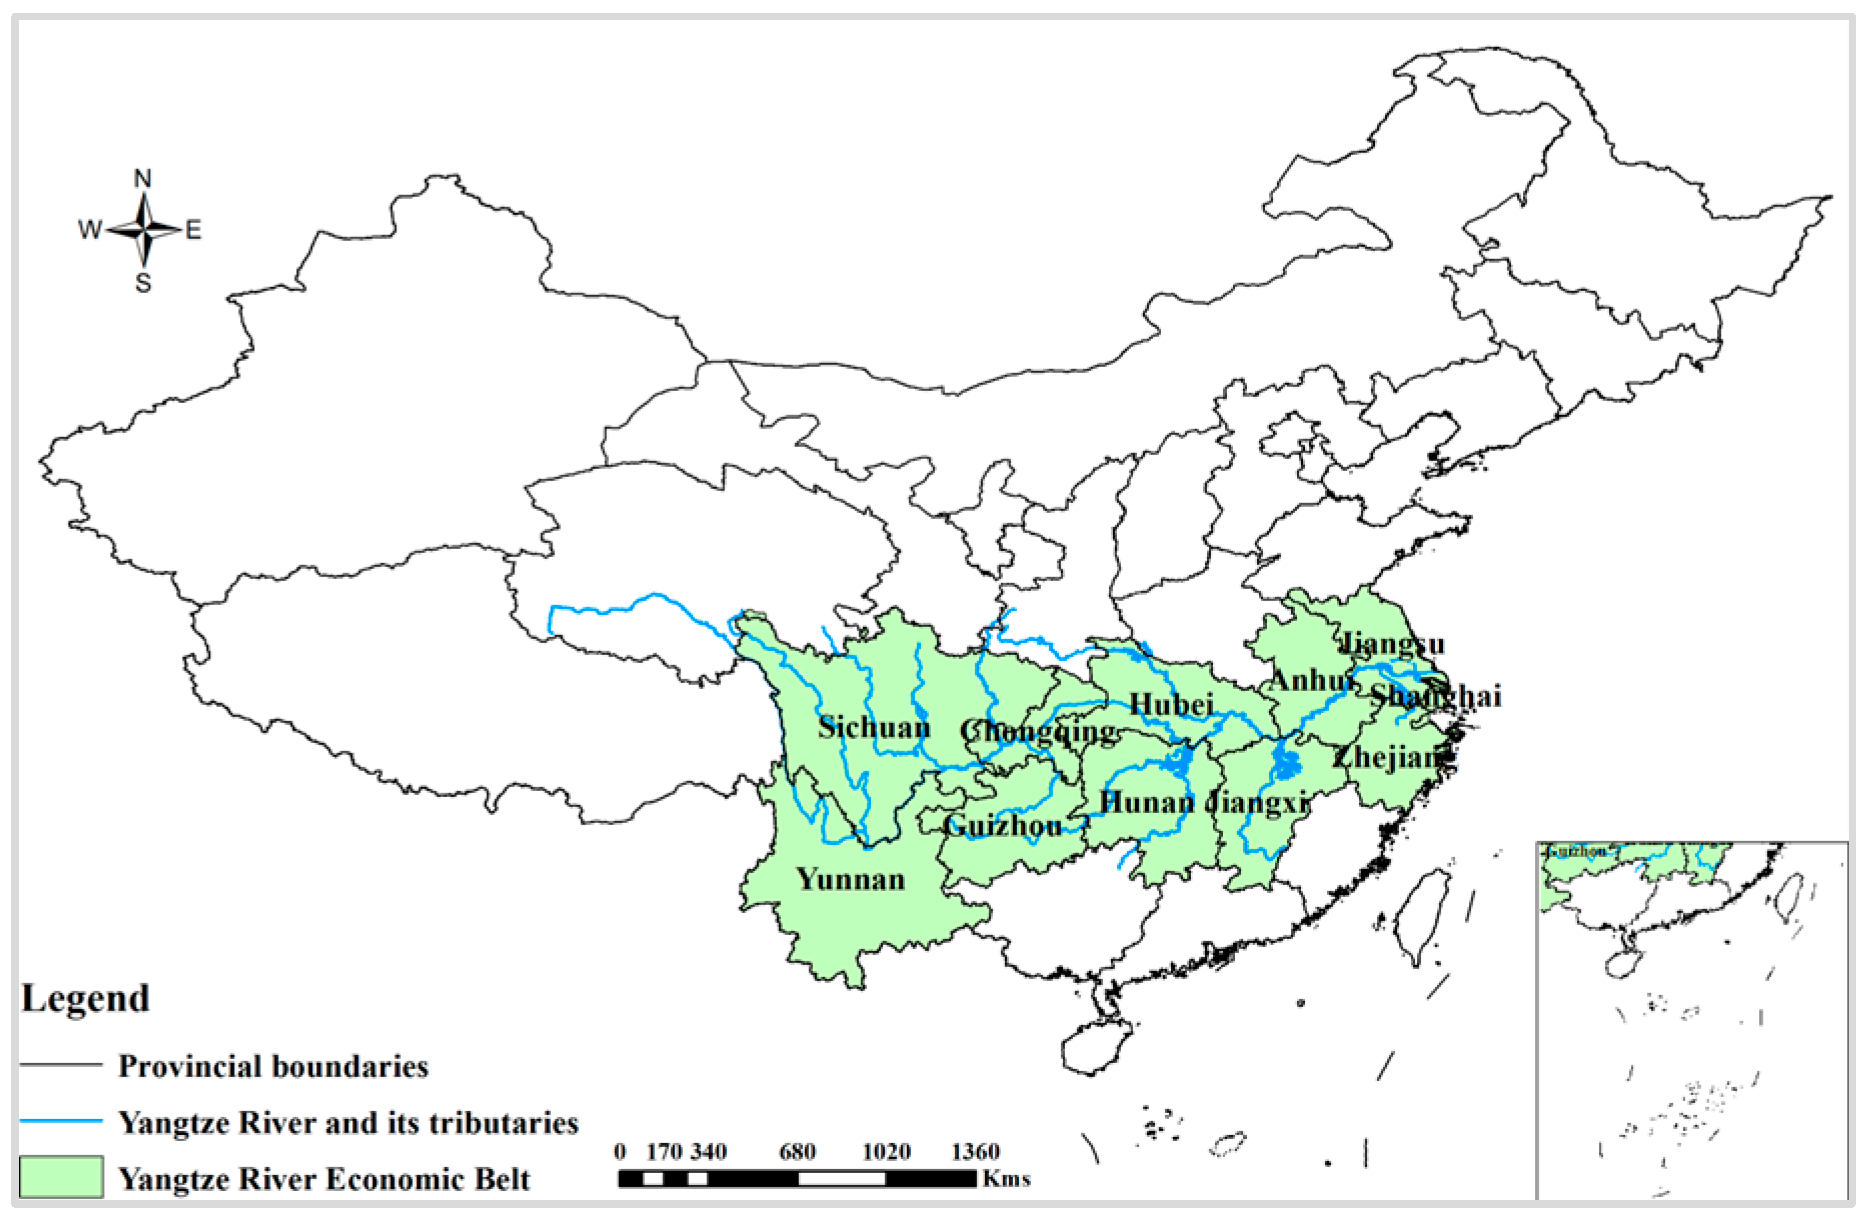
2.1. Study Area and Data Sources
2.2. Total Resource Consumption Coefficient (TRCC)
2.3. Network Structure Resilience Evaluation Indicators
- (1)
- Network hierarchy degree and degree distribution
- (2)
- Network transmissibility-average path length
- (3)
- Network connectivity-network density
- (4)
- Network aggregation-local clustering coefficient and average clustering coefficient
3. Results
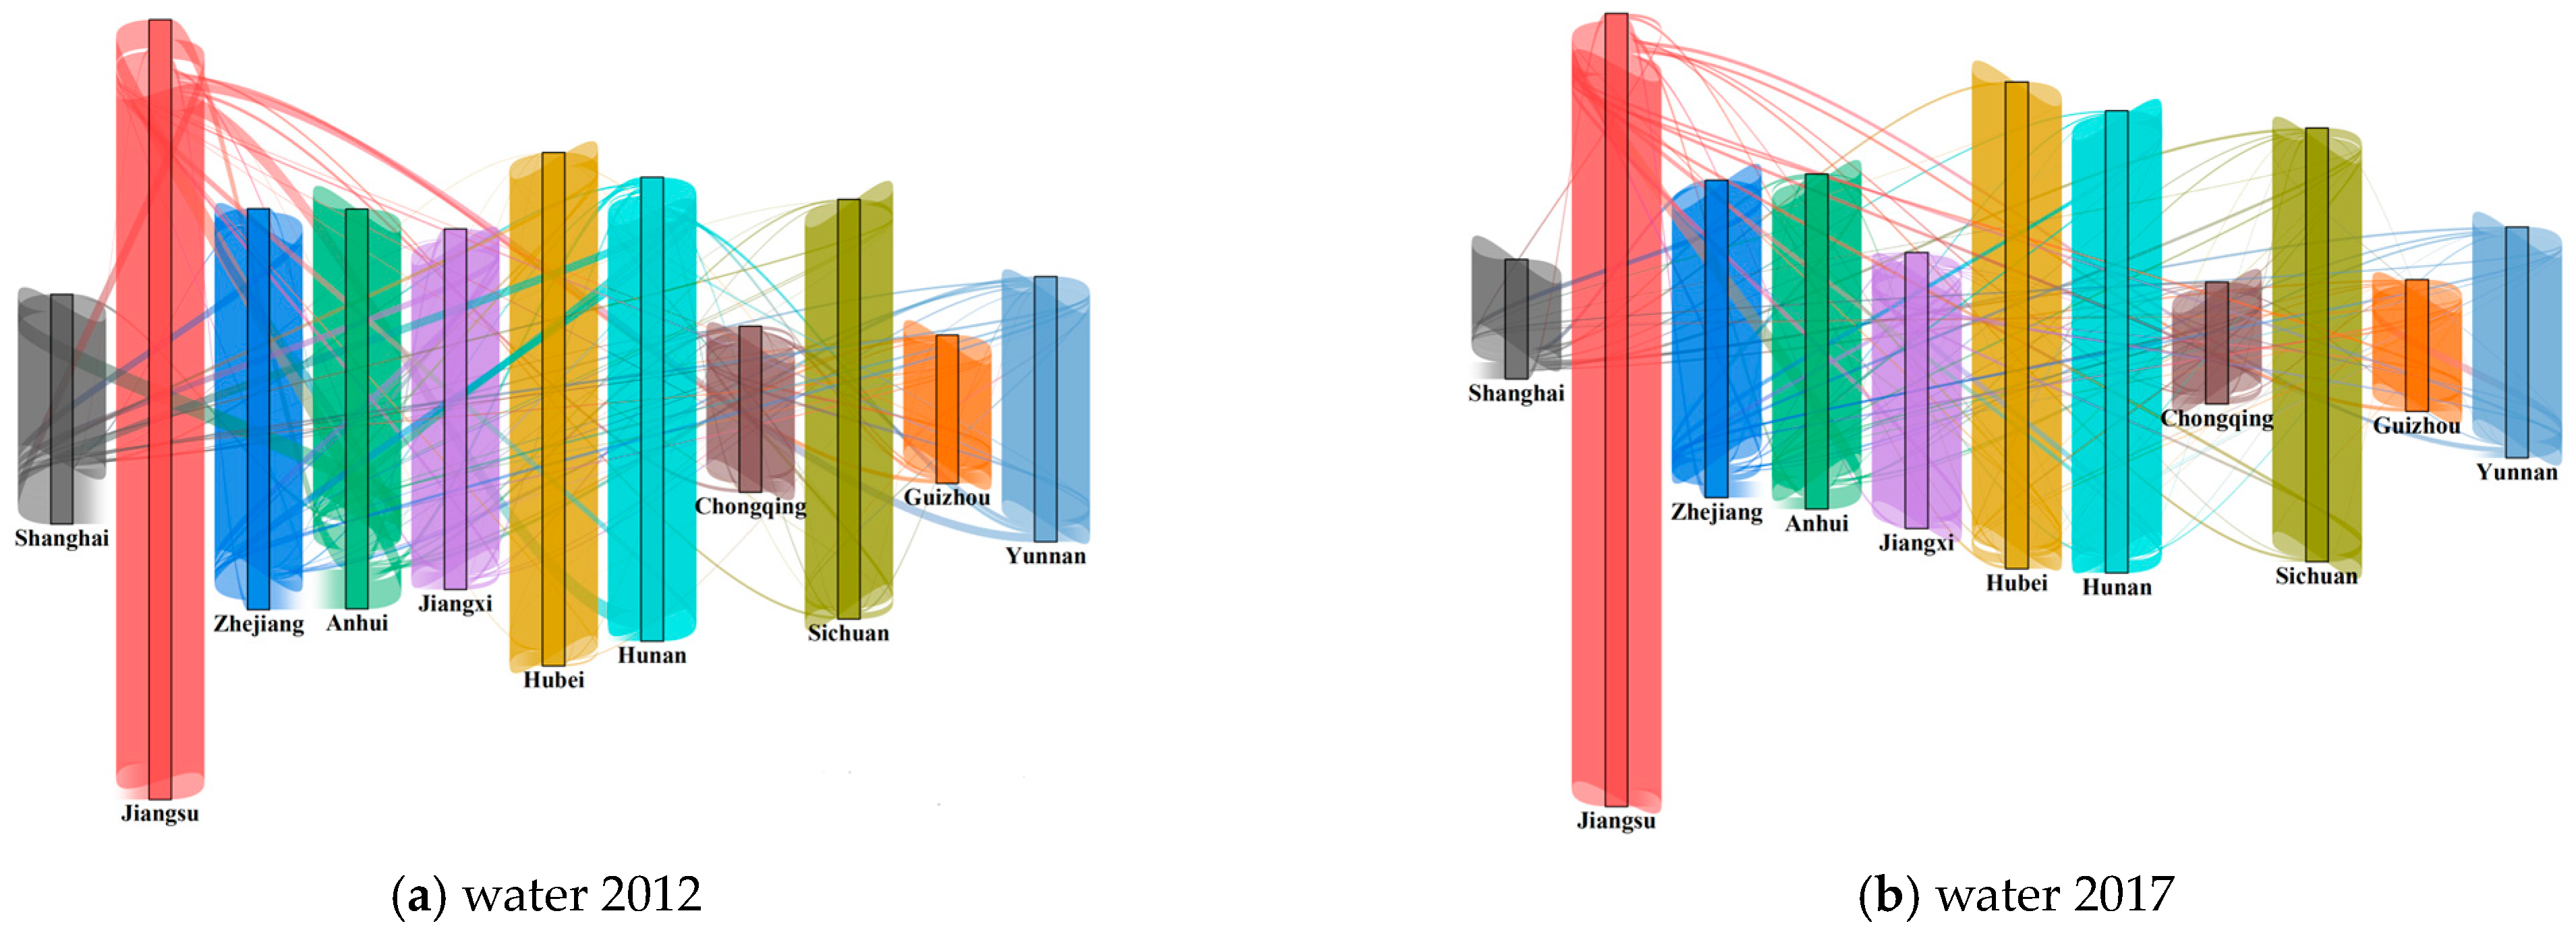
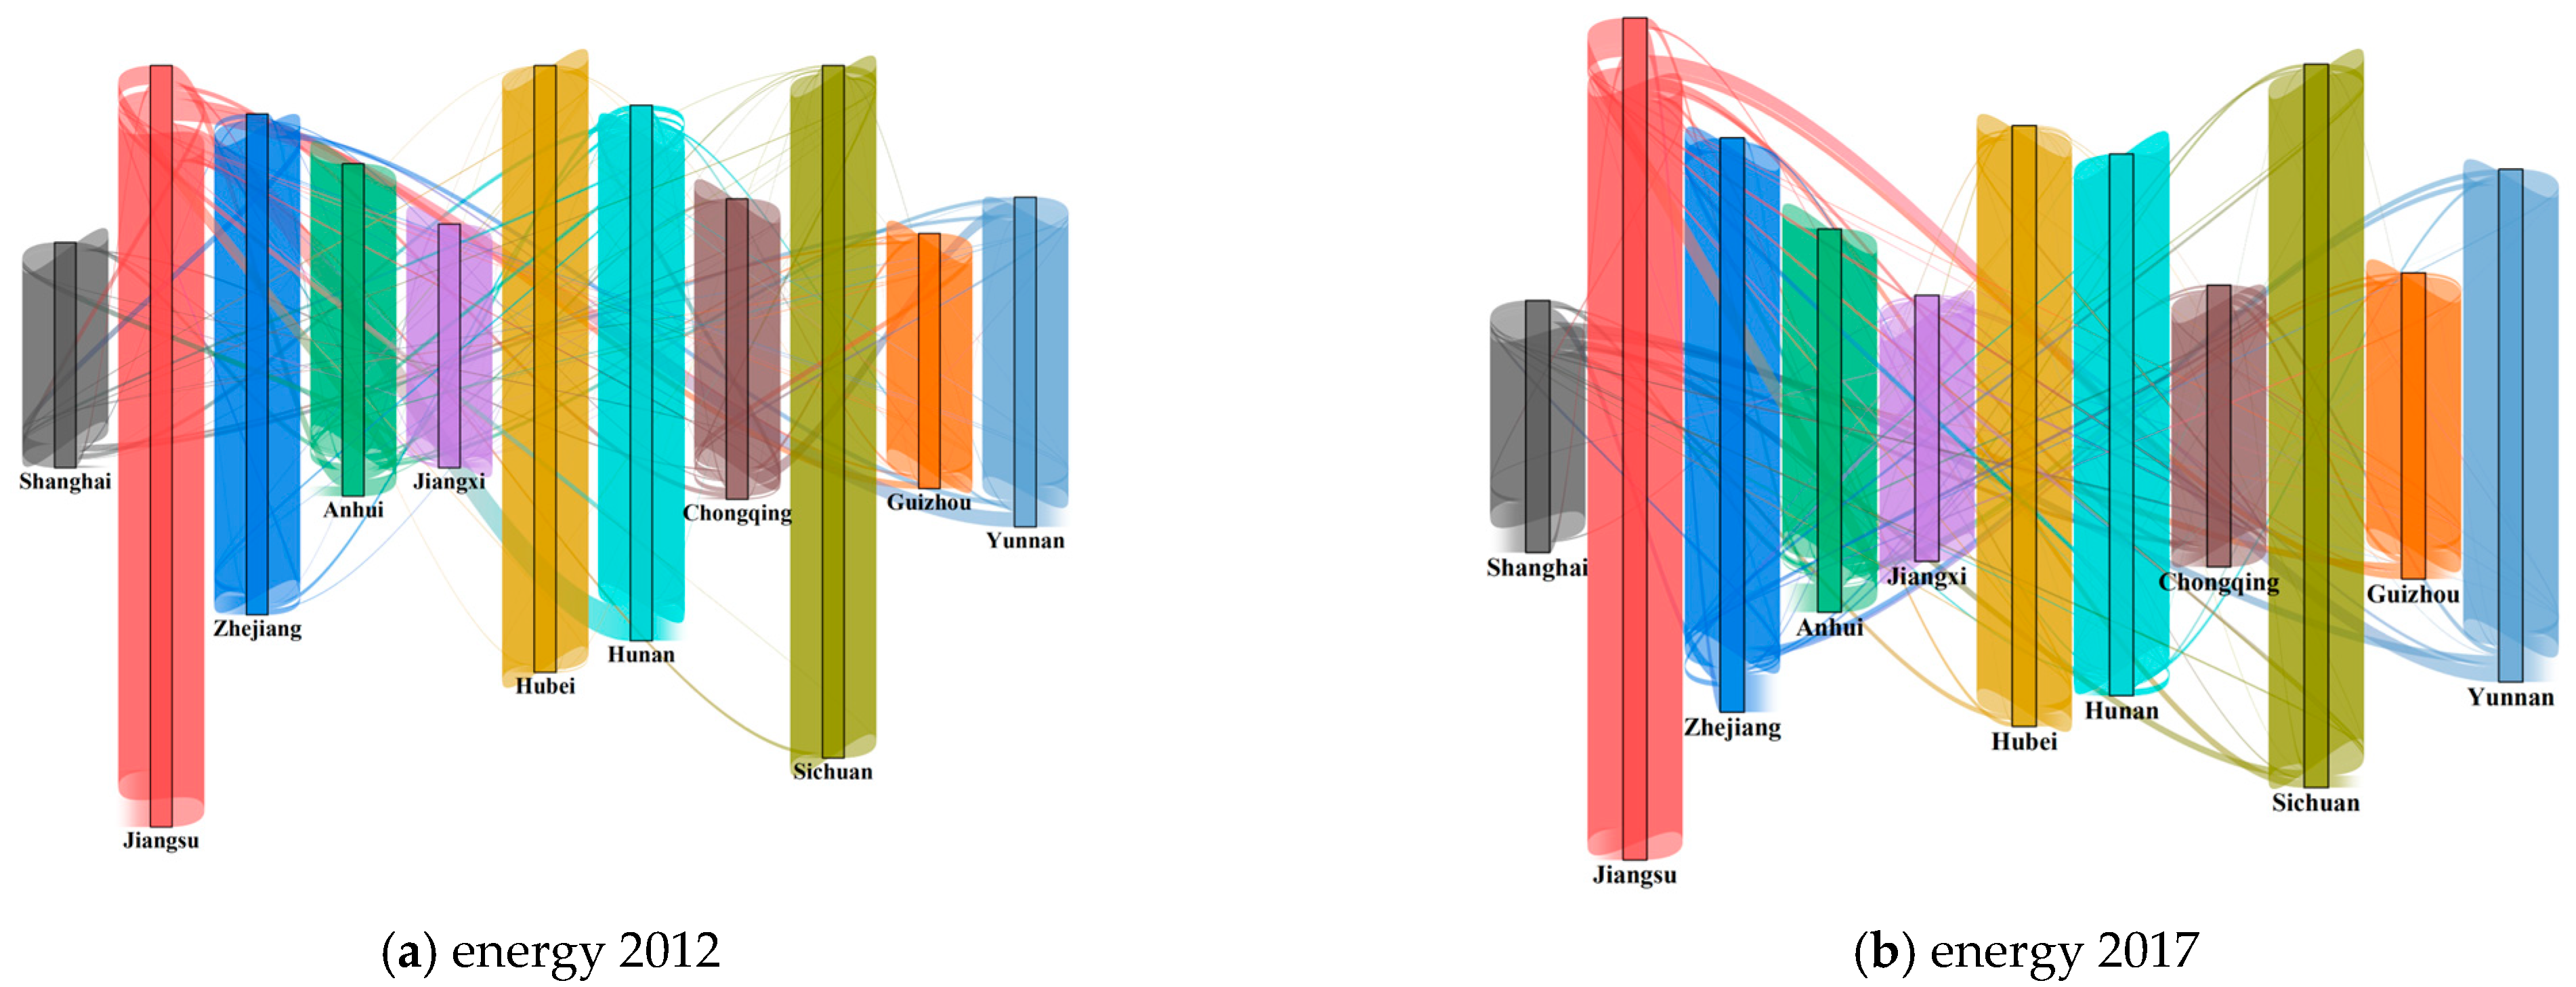
3.1. Virtual Water Resources-Energy Flow inside YEB
3.2. Network Structure Resilience Indicators
4. Discussion
4.1. Virtual Resource Flow Characteristics
4.1.1. Virtual Water Flow Characteristics
4.1.2. Virtual Energy Flow Characteristics
4.2. Network Structure Resilience Analysis
4.2.1. Network Hierarchy
4.2.2. Network Transmissibility
4.2.3. Network Connectivity
4.2.4. Network Aggregation
4.2.5. Comprehensive Analysis
5. Conclusions
Author Contributions
Funding
Data Availability Statement
Conflicts of Interest
References
- Shen, Q.; Niu, J.; Liu, Q.; Liao, D.; Du, T. A resilience-based approach for water resources management over a typical agricultural region in Northwest China under water-energy-food nexus. Ecol. Indic. 2022, 144, 109562. [Google Scholar] [CrossRef]
- Ke, J.; Khanna, N.; Zhou, N. Analysis of water–energy nexus and trends in support of the sustainable development goals: A study using longitudinal water–energy use data. J. Clean. Prod. 2022, 371, 133448. [Google Scholar] [CrossRef]
- Nakhaei, M.; Akrami, M.; Gheibi, M.; Daniel Urbina Coronado, P.; Hajiaghaei-Keshteli, M.; Mahlknecht, J. A novel framework for technical performance evaluation of water distribution networks based on the water-energy nexus concept. Energy Convers. Manag. 2022, 273, 116422. [Google Scholar] [CrossRef]
- Yuan, L.; Ding, L.; He, W.; Kong, Y.; Ramsey, T.S.; Degefu, D.M.; Wu, X. Compilation of Water Resource Balance Sheets under Unified Accounting of Water Quantity and Quality, a Case Study of Hubei Province. Water 2023, 15, 1383. [Google Scholar] [CrossRef]
- Yuan, L.; Wu, X.; He, W.; Degefu, D.M.; Kong, Y.; Yang, Y.; Xu, S.; Ramsey, T.S. Utilizing the strategic concession behavior in a bargaining game for optimal allocation of water in a transboundary river basin during water bankruptcy. Environ. Impact Assess. Rev. 2023, 102, 107162. [Google Scholar] [CrossRef]
- Hong, S.; Cheng, T.; Wang, H. Characteristics of the water-energy network in the Yangtze River Economic Belt. Resour. Sci. 2021, 43, 1794–1807. [Google Scholar] [CrossRef]
- Kong, Y.; He, W.; Zhang, Z.; Shen, J.; Yuan, L.; Gao, X.; An, M.; Ramsey, T.S. Spatial-temporal variation and driving factors decomposition of agricultural grey water footprint in China. J. Environ. Manag. 2022, 318, 115601. [Google Scholar] [CrossRef]
- Dabo, G.; Klaus, H. Assessment of regional trade and virtual water flows in China. Ecol. Econ. 2006, 61, 159–170. [Google Scholar]
- Zhu, L.; Yong, G.; Soeren, L.; Hongyan, Z.; Tsuyoshi, F.; Dabo, G. Embodied energy use in China’s industrial sectors. Energy Policy 2012, 49, 751–758. [Google Scholar]
- Wang, Z.; Huang, K.; Yang, S.; Yu, Y. An input–output approach to evaluate the water footprint and virtual water trade of Beijing, China. J. Clean. Prod. 2013, 42, 172–179. [Google Scholar] [CrossRef]
- Zhang, C.; Anadon, L.D. A multi-regional input–output analysis of domestic virtual water trade and provincial water footprint in China. Ecol. Econ. 2014, 100, 159–172. [Google Scholar] [CrossRef]
- Zhang, B.; Qiao, H.; Chen, Z.M.; Chen, B. Growth in embodied energy transfers via China’s domestic trade: Evidence from multi-regional input–output analysis. Appl. Energy 2016, 184, 1093–1105. [Google Scholar] [CrossRef]
- Yang, Y.; Xiao, C.; Wang, X.; Liu, S. Review on water resources based on input-output theory and prospect of water resources management. J. Glaciol. Geocryol. 2021, 43, 214–224. [Google Scholar]
- Wang, X.; Zhang, Y.; Zhou, L.; Cao, J. Research on virtual energy industry distribution and interprovincial trade in Gansu Province. China Environ. Sci. 2020, 40, 1847–1856. [Google Scholar]
- Yang, Y.; Qiu, Y.; Wang, X.; Liu, H.; Zhang, J.; Li, H.; Zhu, H. Analysis of Water Resources and Energy Consumption Path in Heilongjiang Province. Water Power 2021, 47, 18–23. [Google Scholar]
- Sun, C.; Zheng, J. Structural path analysis of water resources consumption in China based on input-output table. Prog. Geogr. 2021, 40, 370–381. [Google Scholar] [CrossRef]
- Zhang, B.; Chen, Z.M.; Xia, X.H.; Xu, X.Y.; Chen, Y.B. The impact of domestic trade on China’s regional energy uses: A multi-regional input–output modeling. Energy Policy 2013, 63, 1169–1181. [Google Scholar] [CrossRef]
- Cao, T.; Wang, S.; Chen, B. Virtual water analysis for the Jing-Jin-Ji region based on multiregional input-output model. Acta Ecol. Sin. 2018, 38, 788–799. [Google Scholar]
- Yan, X.; Sun, C. Study on the Characteristics of Inter-Regional Water Footprint Spatial Transfer Network in China. Resour. Environ. Yangtze Basin 2021, 30, 602–613. [Google Scholar]
- Peng, C.; Lin, Y.Z.; Gu, C.L. Evaluation and optimization strategy of city network structural resilience in the middle reaches of Yangtze River. Geogr. Res. 2018, 37, 1193–1207. [Google Scholar]
- Xie, Y.S.; Wang, C.J.; Han, Z.L.; Liu, S.Z. Structural resilience evolution of multiple urban networks in the Harbin-Dalian urban belt. Prog. Geogr. 2020, 39, 1619–1631. [Google Scholar] [CrossRef]
- Fang, Y.L.; Su, X.Q.; Huang, Z.F.; Guo, B.B. Structural Characteristics and Resilience Evaluation of Tourism Flow Networks in Five Major Urban Agglomerations in Coastal China: From the Perspective of Evolutionary Resilience. Econ. Geogr. 2022, 42, 203–211. [Google Scholar]
- Crespo, J.; Suire, R.; Vicente, J. Lock-in or lock-out? How structural properties of knowledge networks affect regional resilience. J. Econ. Geogr. 2014, 14, 199–219. [Google Scholar] [CrossRef]
- Guimera, R.; Mossa, S.; Turtschi, A.; Amaral, L.A.N. The worldwide air transportation network: Anomalous centrality. community structure, and cities’ global roles. Proc. Natl. Acad. Sci. USA 2005, 102, 7794. [Google Scholar] [CrossRef]
- Bombelli, A.; Santos, B.F.; Tavasszy, L. Analysis of the air cargo transport network using a complex network theory perspective, Transportation research. Part E Logist. Transp. Rev. 2020, 138, 101959. [Google Scholar] [CrossRef]
- Dixit, V.; Verma, P.; Tiwari, M.K. Assessment of pre and post-disaster supply chain resilience based on network structural parameters with CVaR as a risk measure. Int. J. Prod. Econ. 2020, 227, 107655. [Google Scholar] [CrossRef]
- Hou, L.; Sun, J. Evaluation of network structure resilience of Chengdu-Chongqing urban agglomeration from the perspective of complex networks. World Reg. Stud. 2022, 31, 561–571. [Google Scholar]
- Niță, M.R.; Mitincu, C.G.; Nita, A. A river runs through it? Exploring the contestation of Environmental Impact Assessment procedures for small hydropower projects. Energy Res. Soc. Sci. 2023, 96, 102943. [Google Scholar] [CrossRef]
- Xu, J. Econometrics; Higher Education Press: Beijing, China, 2014. [Google Scholar]
- Jin, G. Measurement and Analysis of Embodied Energy in China’s International Trade Based on Multinational I-O Model; Zhejiang University: Hangzhou, China, 2015. [Google Scholar]
- Ren, Y. Inter-Regional Virtual Water Flow in China Based on Resource and Environment-Oriented Multi-Regional Input-Output Approach; Beijing Forestry University: Beijing, China, 2020. [Google Scholar]
- Xu, J.; Chen, X.; Yang, C. Calculation method of direct water consumption coefficient and complete water consumption coefficient. Water Resour. Plan. Des. 2002, 4, 28–30+36. [Google Scholar]
- Tian, G.; Li, J.; Li, L. Pattern of virtual water flow in the Yangtze River Economic Belt based on multi-regional input-output model, China Population. Resour. Environ. 2019, 29, 81–88. [Google Scholar]
- Wei, Y.; Xiu, C. Study on the concept and analytical framework of city network resilience. Prog. Geogr. 2020, 39, 488–502. [Google Scholar] [CrossRef]


| Intermediate Consumption | Final Consumption | Export | Total Output | |||||||||||
|---|---|---|---|---|---|---|---|---|---|---|---|---|---|---|
| Shanghai | … | Yunnan | Shanghai | … | Yunnan | |||||||||
| S1 | … | Sn | … | S1 | … | Sn | ||||||||
| Intermediate input | Shanghai | S1 | … | … | … | … | ||||||||
| … | … | … | … | … | … | … | … | … | … | … | … | … | ||
| Sn | … | … | … | … | ||||||||||
| … | … | … | … | … | … | … | … | … | … | … | … | … | … | |
| Yunnan | S1 | … | … | … | … | |||||||||
| … | … | … | … | … | … | … | … | … | … | … | … | … | ||
| Sn | … | … | … | … | ||||||||||
| Import input | … | … | … | |||||||||||
| Added value | … | … | … | |||||||||||
| Total investment | … | … | … | |||||||||||
| Water consumption | … | … | … | |||||||||||
| Energy consumption | … | … | … | |||||||||||
| Indicator | Specific Variable | Spatial Meaning | Function |
|---|---|---|---|
| Hierarchy | Degree distribution | Distribution characteristics of node degree values | − |
| Transmissibility | Average path length | Transmission efficiency of network | − |
| Connectivity | network density | The connectivity of the network | + |
| Aggregation | Clustering coefficient | The aggregation degree of the network | − |
| Province (City) | Output | Input | ||
|---|---|---|---|---|
| 2012 | 2017 | 2012 | 2017 | |
| Shanghai | 8.95 | 16.45 | 38.24 | 7.77 |
| Jiangsu | 47.87 | 22.64 | 28.13 | 32.05 |
| Zhejiang | 13.23 | 14.87 | 28.82 | 23.65 |
| Anhui | 47.91 | 21.79 | 27.03 | 15.46 |
| Jiangxi | 20.02 | 12.24 | 10.58 | 14.77 |
| Hubei | 10.21 | 5.83 | 2.36 | 11.84 |
| Hunan | 28.25 | 15.56 | 21.39 | 7.54 |
| Chongqing | 9.02 | 11.68 | 15.33 | 7.70 |
| Sichuan | 8.43 | 9.90 | 8.36 | 9.10 |
| Guizhou | 6.13 | 6.83 | 11.77 | 10.86 |
| Yunnan | 10.21 | 12.17 | 18.23 | 9.24 |
| Total | 210.23 | 149.98 | 210.23 | 149.98 |
| Province (City) | Output | Input | ||
|---|---|---|---|---|
| 2012 | 2017 | 2012 | 2017 | |
| Shanghai | 85.52 | 176.19 | 91.72 | 45.16 |
| Jiangsu | 277.90 | 220.44 | 114.10 | 134.68 |
| Zhejiang | 101.54 | 88.43 | 46.93 | 189.36 |
| Anhui | 139.89 | 148.98 | 111.09 | 73.43 |
| Jiangxi | 28.34 | 58.68 | 44.15 | 60.88 |
| Hubei | 27.94 | 36.65 | 9.25 | 69.94 |
| Hunan | 90.84 | 73.89 | 189.68 | 38.64 |
| Chongqing | 97.99 | 99.68 | 91.19 | 62.98 |
| Sichuan | 39.31 | 56.31 | 34.63 | 88.83 |
| Guizhou | 36.45 | 23.37 | 77.69 | 97.30 |
| Yunnan | 29.35 | 19.06 | 144.63 | 140.47 |
| Total | 955.07 | 1001.68 | 955.07 | 1001.68 |
| Type | Year | Network Density (D) | Average Path Length (L) | Core-Edge Structure Fitting Degree | Degree Distribution Curve Slope (a) | Average Clustering Coefficient (C) |
|---|---|---|---|---|---|---|
| Virtual water | 2012 | 0.300 | 1.618 | 0.59 | −0.60185 | 0.573 |
| 2017 | 0.3909 | 1.620 | 0.711 | −0.53252 | 0.578 | |
| Virtual energy | 2012 | 0.3273 | 1.422 | 0.756 | — | 0.622 |
| 2017 | 0.3455 | 1.400 | 0.472 | −0.38603 | 0.358 |
| Province (City) | Virtual Water | Virtual Energy | ||
|---|---|---|---|---|
| 2012 | 2017 | 2012 | 2017 | |
| Shanghai | 0.567 | 0.5 | 0.7 | 0.393 |
| Jiangsu | 0.339 | 0.278 | 0.333 | 0.393 |
| Zhejiang | 0.75 | 0.393 | 0.8 | 0.292 |
| Anhui | 0.321 | 0.567 | 0.452 | 0.433 |
| Jiangxi | 0.7 | 0.65 | 1 | 0.25 |
| Hubei | 0.5 | 0.45 | — | 0.3 |
| Hunan | 0.357 | 0.75 | 0.5 | 0.333 |
| Chongqing | 0.405 | 0.5 | 0.4 | 0.381 |
| Sichuan | — | 0.6 | 0.5 | 0.433 |
| Guizhou | 1 | 1 | 0.833 | 0.4 |
| Yunnan | 0.75 | 0.667 | 0.7 | 0.333 |
Disclaimer/Publisher’s Note: The statements, opinions and data contained in all publications are solely those of the individual author(s) and contributor(s) and not of MDPI and/or the editor(s). MDPI and/or the editor(s) disclaim responsibility for any injury to people or property resulting from any ideas, methods, instructions or products referred to in the content. |
© 2023 by the authors. Licensee MDPI, Basel, Switzerland. This article is an open access article distributed under the terms and conditions of the Creative Commons Attribution (CC BY) license (https://creativecommons.org/licenses/by/4.0/).
Share and Cite
Yang, Y.; Zhou, X.; Zhang, R.; Xu, J.; Wang, H. Interprovincial Virtual Water-Energy Flow and Its Network Structure Resilience in Yangtze River Economic Belt. Water 2023, 15, 3069. https://doi.org/10.3390/w15173069
Yang Y, Zhou X, Zhang R, Xu J, Wang H. Interprovincial Virtual Water-Energy Flow and Its Network Structure Resilience in Yangtze River Economic Belt. Water. 2023; 15(17):3069. https://doi.org/10.3390/w15173069
Chicago/Turabian StyleYang, Yafeng, Xiaoxiao Zhou, Ru Zhang, Jijun Xu, and Hongrui Wang. 2023. "Interprovincial Virtual Water-Energy Flow and Its Network Structure Resilience in Yangtze River Economic Belt" Water 15, no. 17: 3069. https://doi.org/10.3390/w15173069
APA StyleYang, Y., Zhou, X., Zhang, R., Xu, J., & Wang, H. (2023). Interprovincial Virtual Water-Energy Flow and Its Network Structure Resilience in Yangtze River Economic Belt. Water, 15(17), 3069. https://doi.org/10.3390/w15173069


