Article

The Utilization of Satellite Data and Machine Learning for Predicting the Inundation Height in the Majalaya Watershed

by
Nabila Siti Burnama
1,
Faizal Immaddudin Wira Rohmat
2,3,*,
Mohammad Farid
3,
Arno Adi Kuntoro
3,
Hadi Kardhana
3,
Fauzan Ikhlas Wira Rohmat
2 and
Winda Wijayasari
4
1
Graduate School of Water Resources Engineering, Faculty of Civil Engineering, Bandung Institute of Technology, Jalan Ganesa No.10, Bandung 40132, Indonesia
2
Water Resources Development Center, Bandung Institute of Technology, Jalan Ganesa No.10, Bandung 40132, Indonesia
3
Water Resources Research Group, Faculty of Civil Engineering, Bandung Institute of Technology, Jalan Ganesa No.10, Bandung 40132, Indonesia
4
Department of Computational Science, Faculty of Mathematics and Natural Science, Bandung Institute of Technology, Jalan Ganesa No.10, Bandung 40132, Indonesia
*
Author to whom correspondence should be addressed.
Water 2023, 15(17), 3026; https://doi.org/10.3390/w15173026
Submission received: 20 June 2023 / Revised: 15 August 2023 / Accepted: 18 August 2023 / Published: 23 August 2023
(This article belongs to the Special Issue A Safer Future—Prediction of Water-Related Disasters)

Abstract

:
The Majalaya area is one of the most valuable economic districts in the south of Greater Bandung, West Java, Indonesia, and experiences at least six floods per year. The floods are characterized by a sudden rise in the water level approximately one to two hours after the rain occurs. With the aim of reducing flood risk, this study models a data-driven method for predicting the inundation height across the Majalaya Watershed. The flood inundation maps of selected events were modeled using the HEC-RAS 2D numerical model. Extracted data from the HEC-RAS model, GSMaP satellite rainfall data, elevation, and other spatial data were combined to build an artificial neural network (ANN) model. The trained model targets inundation height, while the spatiotemporal data serve as the explanatory variables. The results from the trained ANN model provided very good R2 (0.9537), NSE (0.9292), and RMSE (0.3701) validation performances. The ANN model was tested with a new dataset to demonstrate the capability of predicting flood inundation height with unseen data. Such a data-driven approach is a promising tool to be developed to reduce flood risks in the Majalaya Watershed and other flood-prone locations.

1. Introduction

Floods are highly destructive natural disasters that can lead to significant property damage, halted business operations, and tragic life losses. Recent decades have seen an alarming increase in the annual amount of USD 60 billion in direct economic losses due to natural disasters around the world [1,2,3,4]. Floods have been estimated to be responsible for 84% of those economic losses [3,5]. Understanding river flooding’s nature and effects is essential for reducing flood risks and improving overall disaster management [1,6,7], including in developing countries, e.g., Indonesia. Floods events in Indonesia are frequent. According to the national board for disaster management, in 2021, Indonesia experienced massive losses due to natural disasters. Of the 3058 disasters reported, 1288 were flood events [8]. In West Java Province, one of the provinces with the highest number of disaster events reported, 251 flood events were reported throughout 2021 [8]. The Majalaya area, located at 107°34′ E–107°50′ E and 07°02′ S–07°16′ S, was one of the hotspot locations of the West Java Flood [9]. The local community recorded at least six flood events yearly [10], with the inundation height reaching ankle height in the main urban area and around one meter near the riverbanks.
Majalaya’s flood events are characterized by a sudden warning. Typically, the local community reports a rise in the water level approximately one to two hours after the rains occur [10]. This results in the community not having time to evacuate from the flood. Although typical recurring floods usually result in inundation that is observed as an annoyance to Majalaya’s activity, in 2018, this area experienced the most extensive flash flood recorded. The event caused massive losses by damaging dozens of houses, private and government offices, schools, markets, and other public facilities. The flood also blocked the transportation route, injured people, and claimed one life. The community reported that the Citarum River and Cisunggalah River overflow started at 09:00 PM (UTC+7) and persisted until the following day. JAXA’s GSMaP satellite recorded rainfall over a 12-h period with 180 mm total rainfall, with a maximum discharge of 155.81 m3/s. As a comparison, the typical maximum daily rainfall recorded was in the 70–90 mm/day range. From crowdsourced information, this flood created 5.35 km2 of inundation [9].
The event prompted the local community and the government to act to reduce the flood risk. One approach was river training, where more than 20 km of the river was normalized from the flood area downstream. The river normalization was completed in 2021, resulting in no flood event recorded in that year. However, the local community reported reoccurring floods in 2022, although not as often as the pre-normalization frequency. Part of the reason a flood reoccurs is the unmanaged sedimentation caused by uncontrolled agricultural erosion upstream of the flood area [9]. In reducing the flood risk, aside from the structural measures, e.g., improved river training, flood retention basins, and sedimentation control [9], an improved flood early warning system (FEWS) is advised. The current form of FEWS in the community is community-wide information spread through messaging applications. Citizens will be warned when the water level is considered dangerous, which is observed by a voluntary effort by a handful of flood watchers with the aid of a crowdfunded CCTV network [10].
Given the short window of information related to flood events and inundation, this study aims to lower the risk of flooding using machine learning to predict the flood inundation height [11]. In this study, the prediction of the flood inundation height from several extreme rainfall events was carried out using four predictor variables using supervised machine learning with the artificial neural network (ANN) method. The rainfall data were GSMaP (Global Satellite Measurement Precipitation) satellite-based rainfall with a 0.1° × 0.1° spatial resolution and a 1-h temporal resolution. The water level data were sourced from an automatic water level recorder (AWLR) owned by the Citarum River Basin Authority (henceforth, BBWS Citarum) with a temporal resolution of 10 min. Both the rainfall and streamflow data were combined with terrain data to model select flood events using the HEC-RAS numerical model. The output data created by HEC-RAS was the inundation height data that were used as the target variable for the ANN model. This paper explains the data sources, the detailed methodology of the HEC-RAS and ANN modeling, a test case, and possible future improvement.

2. Study Area

2.1. Area Orientation

The Majalaya area is in the watershed of the Citarum River, the longest river in West Java Province, Indonesia. Citarum River itself is one of Indonesia’s nationally strategic rivers. The Citarum Majalaya Watershed, or simply the Majalaya Watershed, is the most upstream part of the Citarum Watershed, marked with a stream gauge (Figure 1). Administratively, the Majalaya area is a flood-prone area that coincides with four subdistricts (two administrative levels below provinces), i.e., Paseh, Majalaya, Ibun, and Solokanjeruk. The subdistricts are all parts of Bandung Regency of West Java Province. The area is known for the textile and agriculture industries that support West Java’s economy [9,12,13]. Although the Majalaya area has an important economic function, it has experienced flooding nearly every year since the 1970s. According to records of events since 2008, on average, this area experiences flooding about six times per year. The most incidents were in 2008, with twenty flood events [10]. Rapid land use change in the upper Majalaya catchment area is one of the causes of the increasing flood frequency. The land cover changes usually from forests to dryland and dairy farms, which causes high sedimentation and water quality issues. The uncontrolled sedimentation results in the shallowing of the riverbed and a higher risk of overflow during high precipitation events [9,14]. Local communities and mass media report recurring flood depths ranging from ankle height to one meter within one to two hours since the start of an intense rainfall event [10,15].

2.2. River System

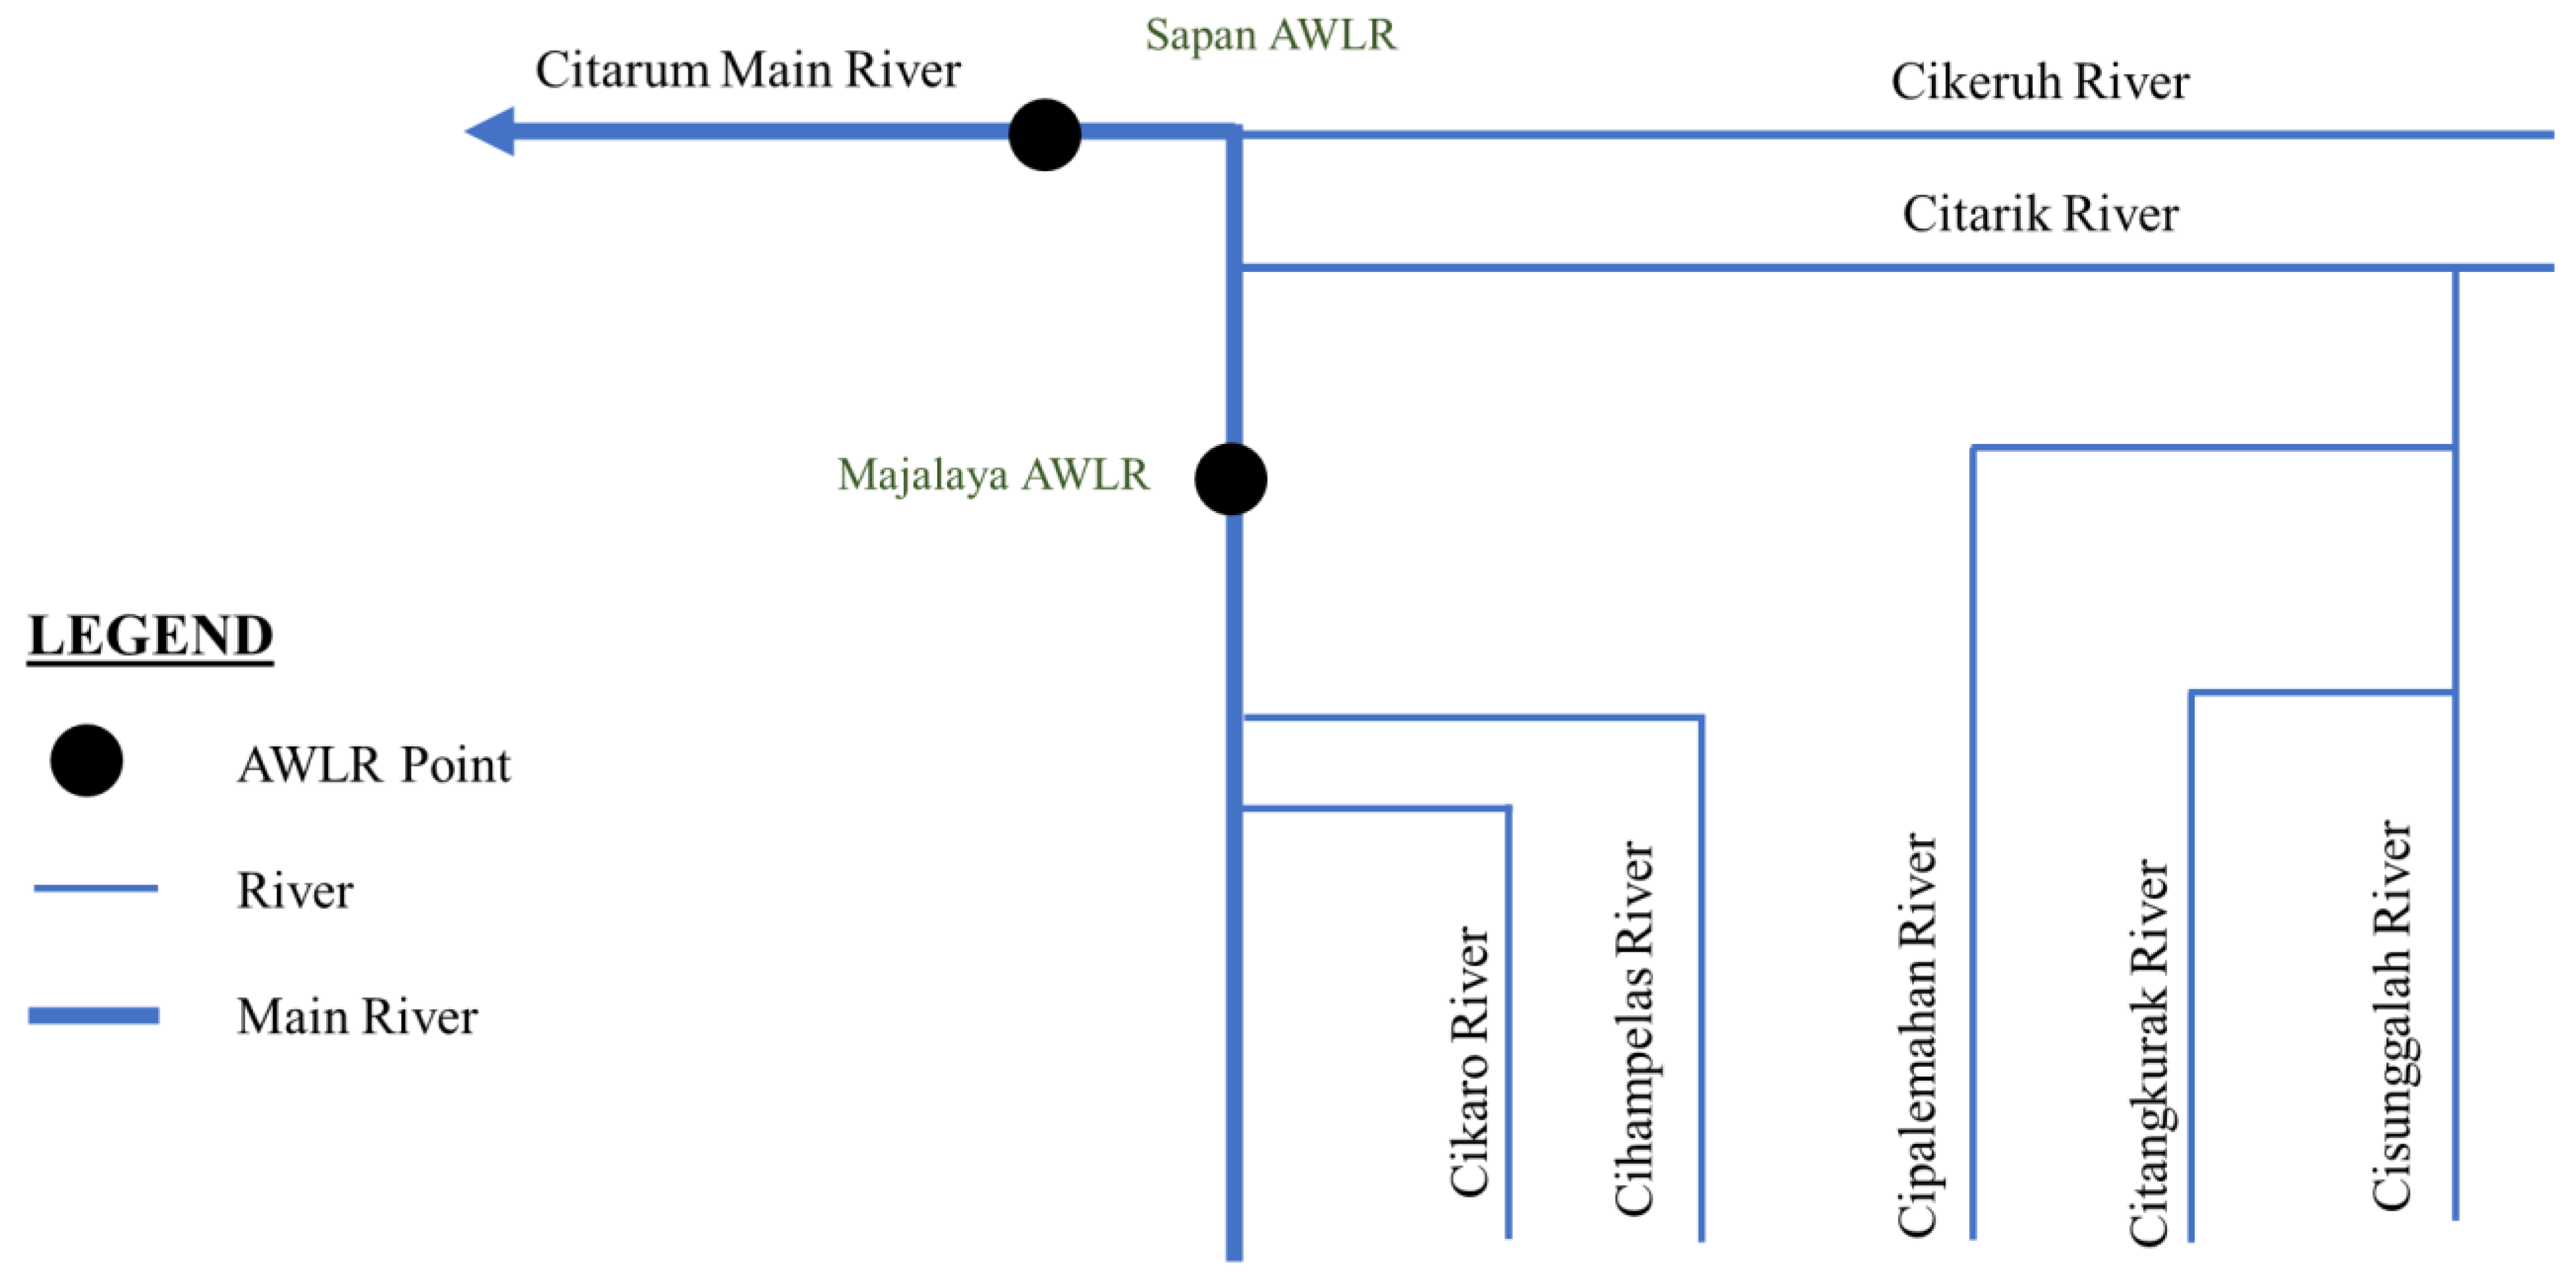
Based on crowdsourced data, the Citarum and Cisunggalah Rivers are the sources of flooding in the Majalaya area [9]. These two rivers and their tributaries are included in the simulation. There are four river tributaries. Two rivers merge with the Citarum River: Cikaro and Cihampelas. The Cipalemahan and Citangkurak Rivers merge with the Cisunggalah River, which downstream merges with the Citarik River and Citarum River near the Sapan area. Figure 2 shows the schematic flow of the rivers in the studied area that flow toward the AWLR location. The stream gauge available in the area is Majalaya’s only automatic water level recorder (AWLR). Therefore, the river flow values are calculated proportionally by comparing watershed areas (Table 1) for modeling purposes.

3. Materials and Methods

3.1. General Procedure

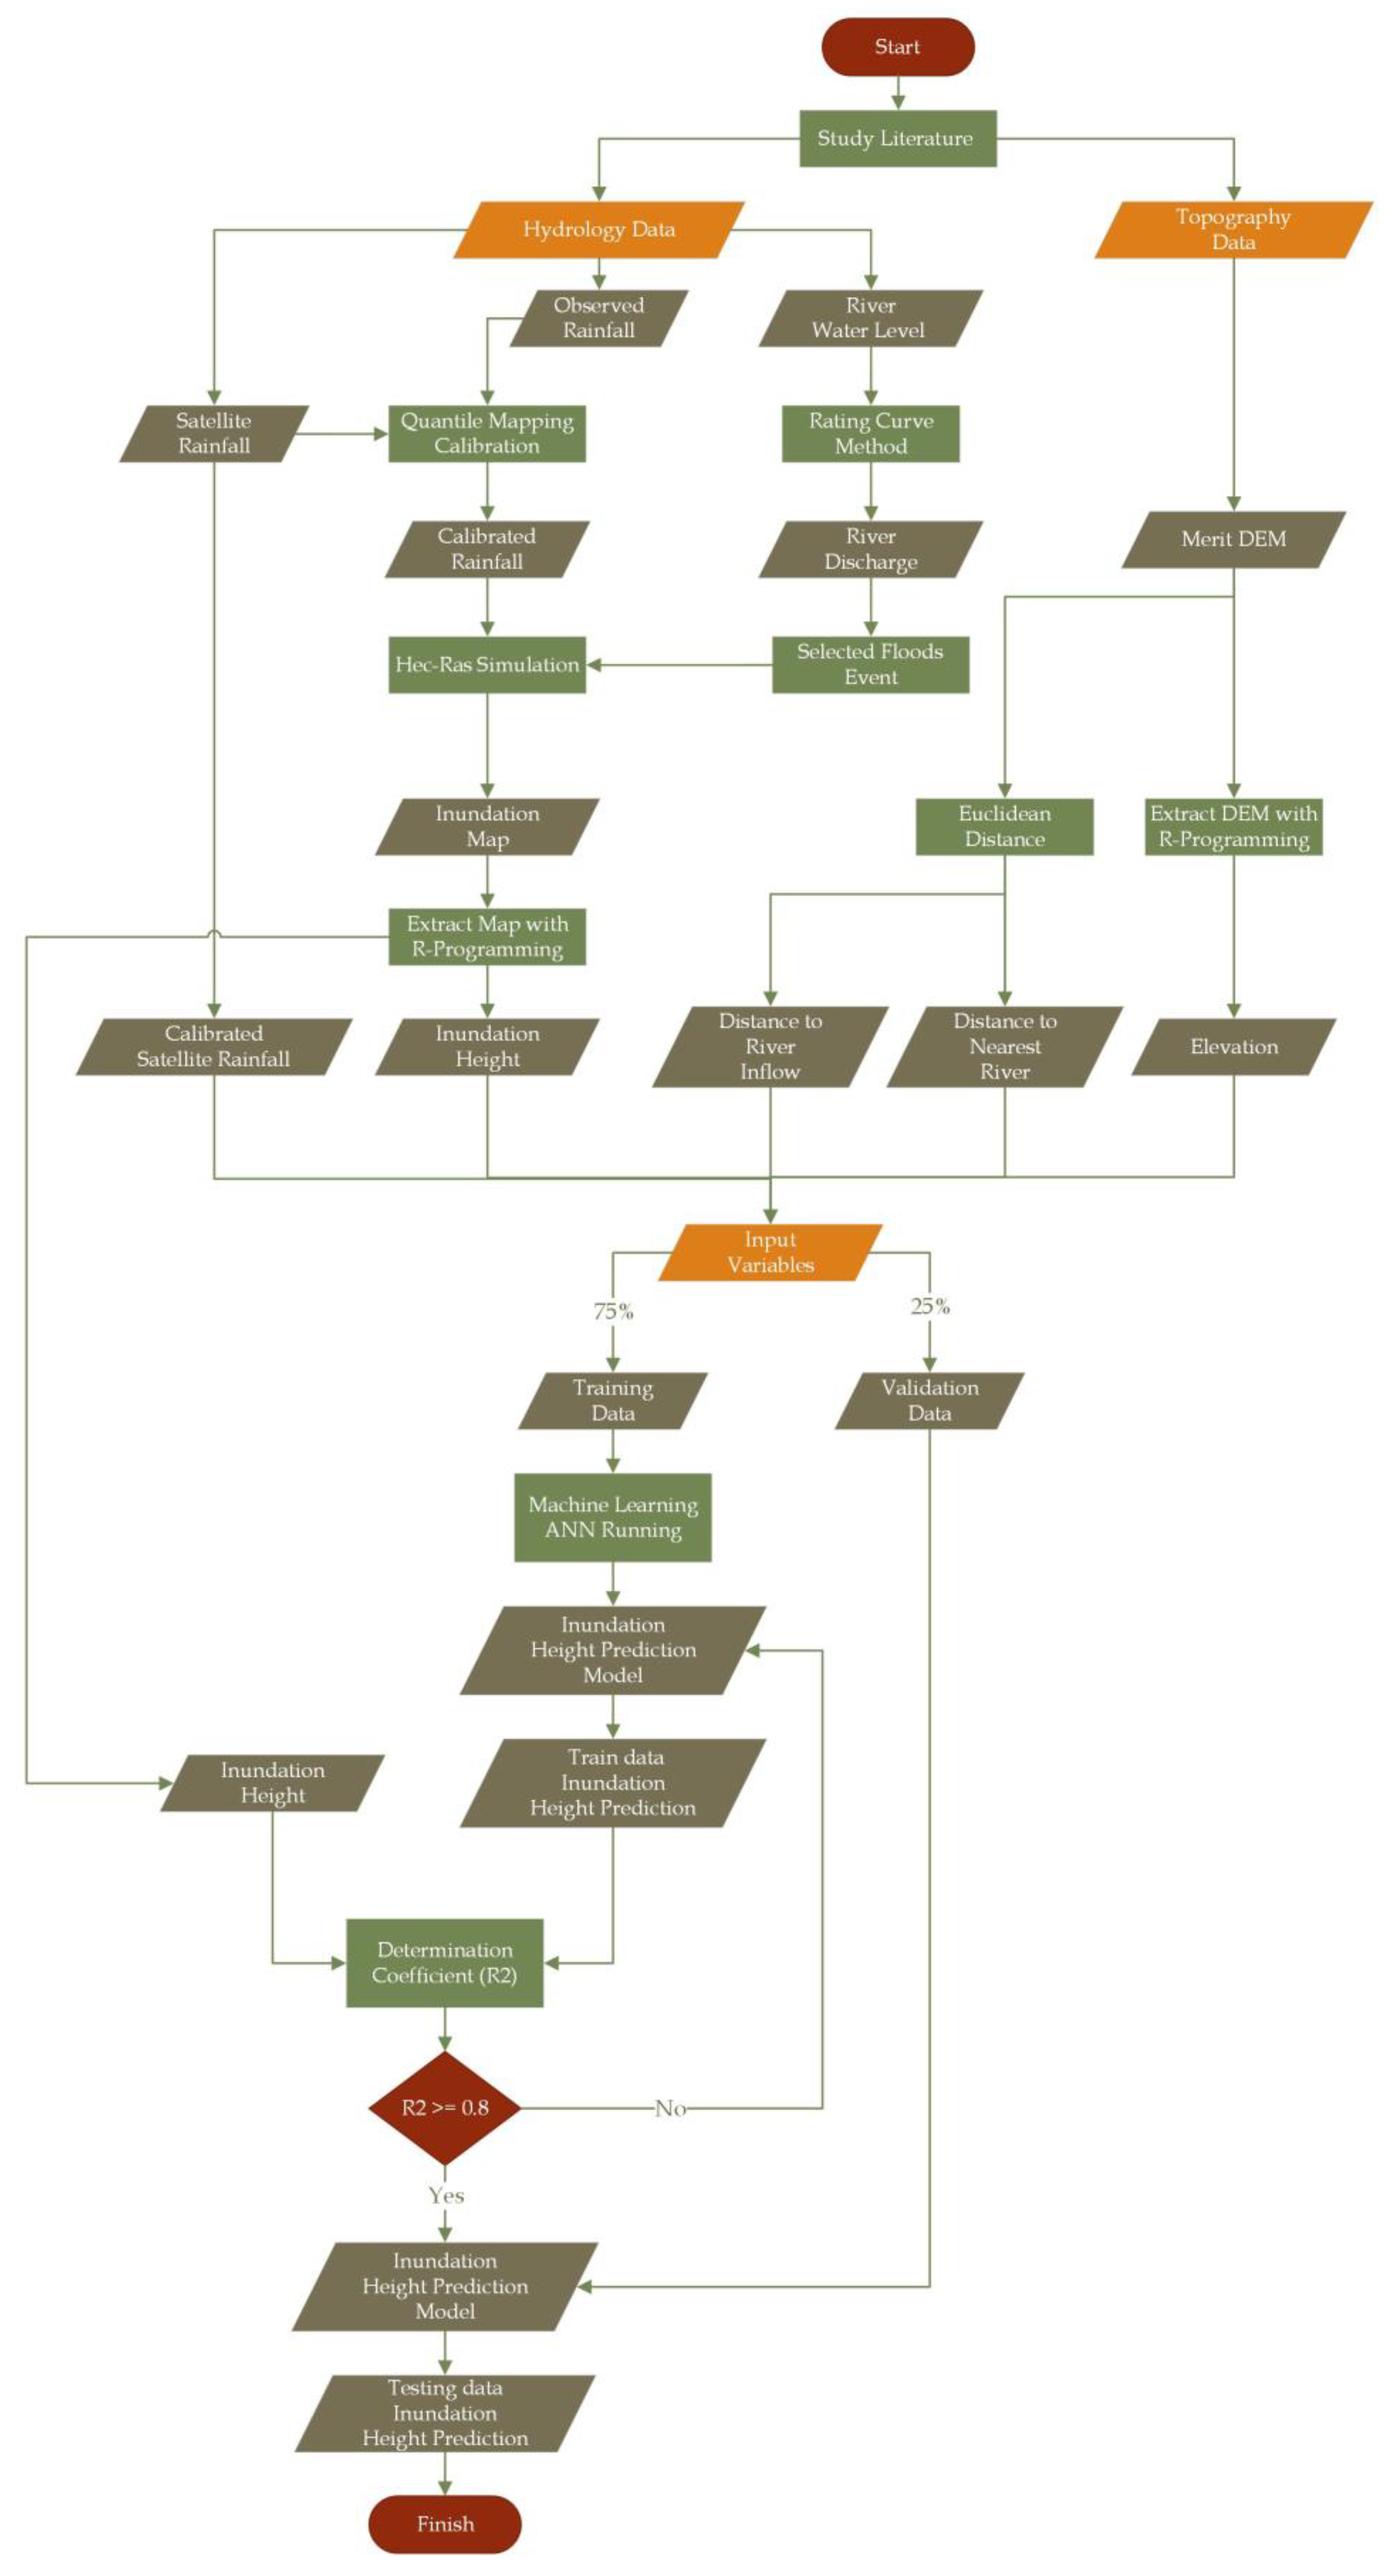
The study process is drawn in Figure 3, which consists of the following steps: data collection and calibration, numerical flood simulation with Hydrology Engineering Center’s River Analysis Software (HEC-RAS) version 6.3.1, Euclidean distance generation, ANN training and validation for machine learning, and inundation height prediction with ANN.

3.2. Materials

Table 2 presents a summary of the data collected and used in this study. There are two kinds of data: hydrological and geographical data. The hydrological data are satellite rainfall and discharge data. The geographical data include the digital elevation model (DEM), river bathymetry data, land cover map, and flood event boundary. Although some land cover characteristics have changed in the area, the 2006 RBI (Rupa Bumi Indonesia) land cover map from BIG (Indonesian Geospatial Information Agency) is used due to the public availability of the data.
Figure 3. Methodology from data input preparation until running the ANN model for predicting the inundation height. The input variables used were satellite rainfall, inundation height, distance to the river, distance to river inflow, and elevation.
Water 15 03026 g003

3.2.1. Rainfall Data

Hydrologic models typically rely on conventional precipitation measurements, e.g., rain gauges, which may be the best and most accurate source. However, the limited rain gauge in a study area results in spatial uncertainties [16,17]. Satellite rainfall data can be used as a substitute or complement due to a lack of hydrologic gauges in a study area. For extensive coverage and public availability, satellite rainfall data can be used to understand the hydrologic characteristics in a region, albeit the data have some errors [16,18,19]. This research used satellite Global Satellite Mapping of Precipitation (GSMaP) from JAXA (Japan Aerospace Exploration Agency), available to the public (https://sharaku.eorc.jaxa.jp/GSMaP/ accessed on 14 August 2023). GSMaP combines satellite data such as GPM (Global Precipitation Measurement), AQUA, and NOAA (National Oceanic and Atmospheric Administration). GSMaP satellite rainfall is one of the recent rainfall maps with the highest precision and resolution. Past studies have intensively utilized GSMaP for different tasks [20,21,22,23,24].
This study used version 7 of GSMaP hourly rainfall data from 2014 to 2022. The GSMaP data were calibrated with the local rainfall gauge in the Majalaya catchment area, with details presented in [25]. The calibration used the quantile mapping method, which estimated the cumulative distribution function (CDF) of the local gauge rainfall data and then compared it with the CDF of satellite rainfall data. Both rainfall data types were converted to quantile-based data to check the bias correction, and the outcomes were downscaled satellite rainfall data [26,27]. These two data were compared at the same quantile/percentile, which resulted in the correction factor. Corrected satellite-based precipitation values were obtained by multiplying the satellite’s rainfall value with the correction factor obtained from the comparison at its associated quantile/percentile.

3.2.2. Water Level Data

The Citarum River’s water level in the Majalaya gauge was obtained from the AWLR managed by the BBWS Citarum, which is publicly available online (http://103.184.53.146/ accessed on 14 August 2023). The data are available from 2017, with a temporal resolution of ten minutes. The local flood mitigation community claimed that Majalaya AWLR’s recorded water level differs from water level observation. The water level data were corrected using the local observation water level data, which is explained in detail in [28].

3.2.3. Topography Data

Topography is an important aspect of correct hydraulic simulation. In this study, the topography data used MERIT DEM with 5° × 5° tiles. The MERIT DEM was chosen because it was developed by removing errors from past DEM data [29]. A river bathymetric survey was also used to fix the inaccuracies of MERIT DEM in the river area [12]. The HEC-RAS and ANN modeling covered the extent of the February 2018 Majalaya flood area [9,13].

3.3. Modeling and Simulation

3.3.1. HEC-RAS Simulation and Flood Event Selection

With both hydrological and topographic data collected, the process then continued with flood inundation simulation using HEC-RAS 6.3.1. HEC-RAS is hydraulic model software that is widely used for hydraulic modeling. The use cases include but are not limited to river discharge, inundation maps, dam breaches, and drainage network design. Some of the required datasets are topographic data, river geometry, land cover data, river flow, and hydraulics, as well as the structural aspect such as bridges and dams [30,31].
This study used a two-dimensional hydraulic simulation model using a combination of primarily surveyed river bathymetry and Merit-DEM of the Majalaya area, layered with land cover for the infiltration coefficient and hydraulic roughness. In the geometric data settings, the 2D flow area used a computational mesh with a 50 m × 50 m grid and curvilinear adjusted mesh along the riverbank. The hydrological data used in the unsteady flow initial condition input were river discharge for the main river and its tributaries and normal depth as the boundary downstream of the river. The simulation timestep used was 10 s. Inundation map simulation used a shallow water equation with the Eulerian method (SWE-EM) solver included in the HEC-RAS. The results of the flood inundation maps were extracted to obtain the water level along with the coordinates of the inundation points. This inundation height was then used as the training target variable for the ANN model.
The stream gauge data are available from 2017 until 2022 (water level data from Majalaya’s AWLR). From the record, flood/flow events were larger than 100 m3/s as the full riverbank capacity outlined by the previous research [9]. The total number of events from 2017 until 2022 that discharged more than 100 m3/s was sixteen events, with the largest discharge being 224.64 m3/s in March 2020. The period for one event started from the discharge rise until it returned to the normal level, forming a hydrograph. The hydrographs were used to calculate each tributary hydrograph and then used as inputs to the HEC-RAS model. The HEC-RAS model was run on a computer server PC with a 16-core 32-thread Ryzen 9 5950X CPU with 96 GB of DDR4 memory and an NVME SSD.

3.3.2. Artificial Neural Network (ANN)

The connection between the input and output data was that the model relied on the hydrologic processes of the field-based parameter [32]. Some methods usually use physical-based, conceptual-based, and black box models, as explained in [30,33,34]. This study developed the prediction model by utilizing real-time and ground-based data as the learning subjects for the ANN model [22,35]. The conventional approach usually has a full-numerical model predicting the flood inundation; the machine learning method proposes to make the computation faster, even when a large quantity of data is involved, which, at the same time, is more appropriate than using a classical statistical method like linear and logistic regression [36]. Related to this study, some studies show that the ANN method is a universal approximator, which approximates continuous mapping with high accuracy [37,38,39]. Even though this study has large-scale data, it is not too complicated with four approximate variables (hydrology and topography data), a short-term simulation (2017–2023), and a limited study area; therefore, using the ANN model is sufficient for inundation height prediction. The ANN model and HEC-RAS suffice for predicting flood inundation mapping [35]; the ANN is sufficient for predicting storm surge and onshore flooding [40], and studies show that the integration of ANN and HEC-RAS can be used to generate stream flow and water depth can be used for risk management systems [41].
In this study, the ANN used four input variables, two hidden layers, and one output variable. The input variables were rainfall, elevation, distance to the river, and distance to inflow. The output (target) variable was the inundation height. The selection of the variables was classified as an ad-hoc approach, which follows the ANN architecture selection protocol as advised by [42]. Normalization was conducted to reduce errors in the model, i.e., rescaling the dataset from a varying range to a normalized range with a −1 to 1 scale. This normalization aimed to reduce the training time while not destroying the variabilities of the dataset [43].
The ANN model in this study used the “neuralnet” library with the aid of the “tidyverse” library since it has many functions to help with data management, including the “dplyr”, “tidyr”, and “tibble” packages. Chart plotting used the “ggplot” package, which is also a part of the “tidyverse” package. The coding and running of the ANN model used the RStudio integrated development environment. The base R package version used was R-4.2.2. The ANN model was run on the same PC that ran the HEC-RAS model.
For the distance variables, the Euclidean distance calculation method was used. The data needed were processed using the inundation map simulation produced by HEC-RAS. Some information from DEM that we can get is the distance from the coordinate point to the nearest river, the distance from the coordinate to the river inflow, and elevation. These three data sources were used for proximity variables for flood inundation prediction. The inundation maps from the HEC-RAS simulation were saved in raster format and formed in a 50 m × 50 m grid. Distance to inflow, as shown in Figure 4C, is the length between a grid to the river inflow or the upstream of the Citarum and Cisunggalah Rivers. This study’s inflow point was the boundary at the upstream of the Citarum River, Cisunggalah River, and their tributaries. The inflow point was considered one of the predictor variables. Distance to the nearest rivers, as shown in Figure 4A, is the length between a grid to the nearest main river, i.e., the Citarum River and Cisunggalah River, which was one of the predictor variables. This study hypothesized that the proximity to the flood sources (rivers) is a contributing factor to the location’s susceptibility to floods [44,45].

4. Results

4.1. Flood Inundation Height

Figure 4B is one of the HEC-RAS simulation results for the map with the Majalaya area as the boundary of the simulation area, limiting the model scope to focus on flood-prone areas. From the sixteen events that were run, the resulting inundation height ranged between 0 and 7.5 m near the Citarum River and between 0 and 1.8 m near the Cisunggalah River. Floods from the Citarum River mostly inundated the housing, settlements, and critical economic area. Meanwhile, floods from the Cisunggalah River mostly inundated the rice field and smaller settlement areas. As mentioned, the HEC-RAS grid size was 50 m × 50 m with a timestep of 10 s. Figure 4D shows the example rainfall raster used in the study and the Majalaya Watershed. The source satellite rainfall map has a grid of 1.1 km × 1.1 km where each grid has a rainfall value recorded every hour. HEC-RAS automatically interpolated the input data to match the simulation grid size. The resulting raster data were extracted into a data table consisting of raster cell coordinates (X and Y), the timestamp, and the inundation height. The inundation data table was then combined with the rainfall data, Euclidean distance maps, and the elevation maps. The resulting ANN training dataset was a large matrix with more than 20,000 rows of data.
Figure 4. (A) The Euclidean distance for the Citarum and Cisunggalah Rivers; (B) Flood inundation map from the HEC-RAS simulation used for input data in the machine learning model; (C) the Euclidean distance for the inflow of the Citarum and Cisunggalah Rivers; (D) Satellite rainfall map for the Majalaya Watershed.
Water 15 03026 g004

4.2. Variable Correlation

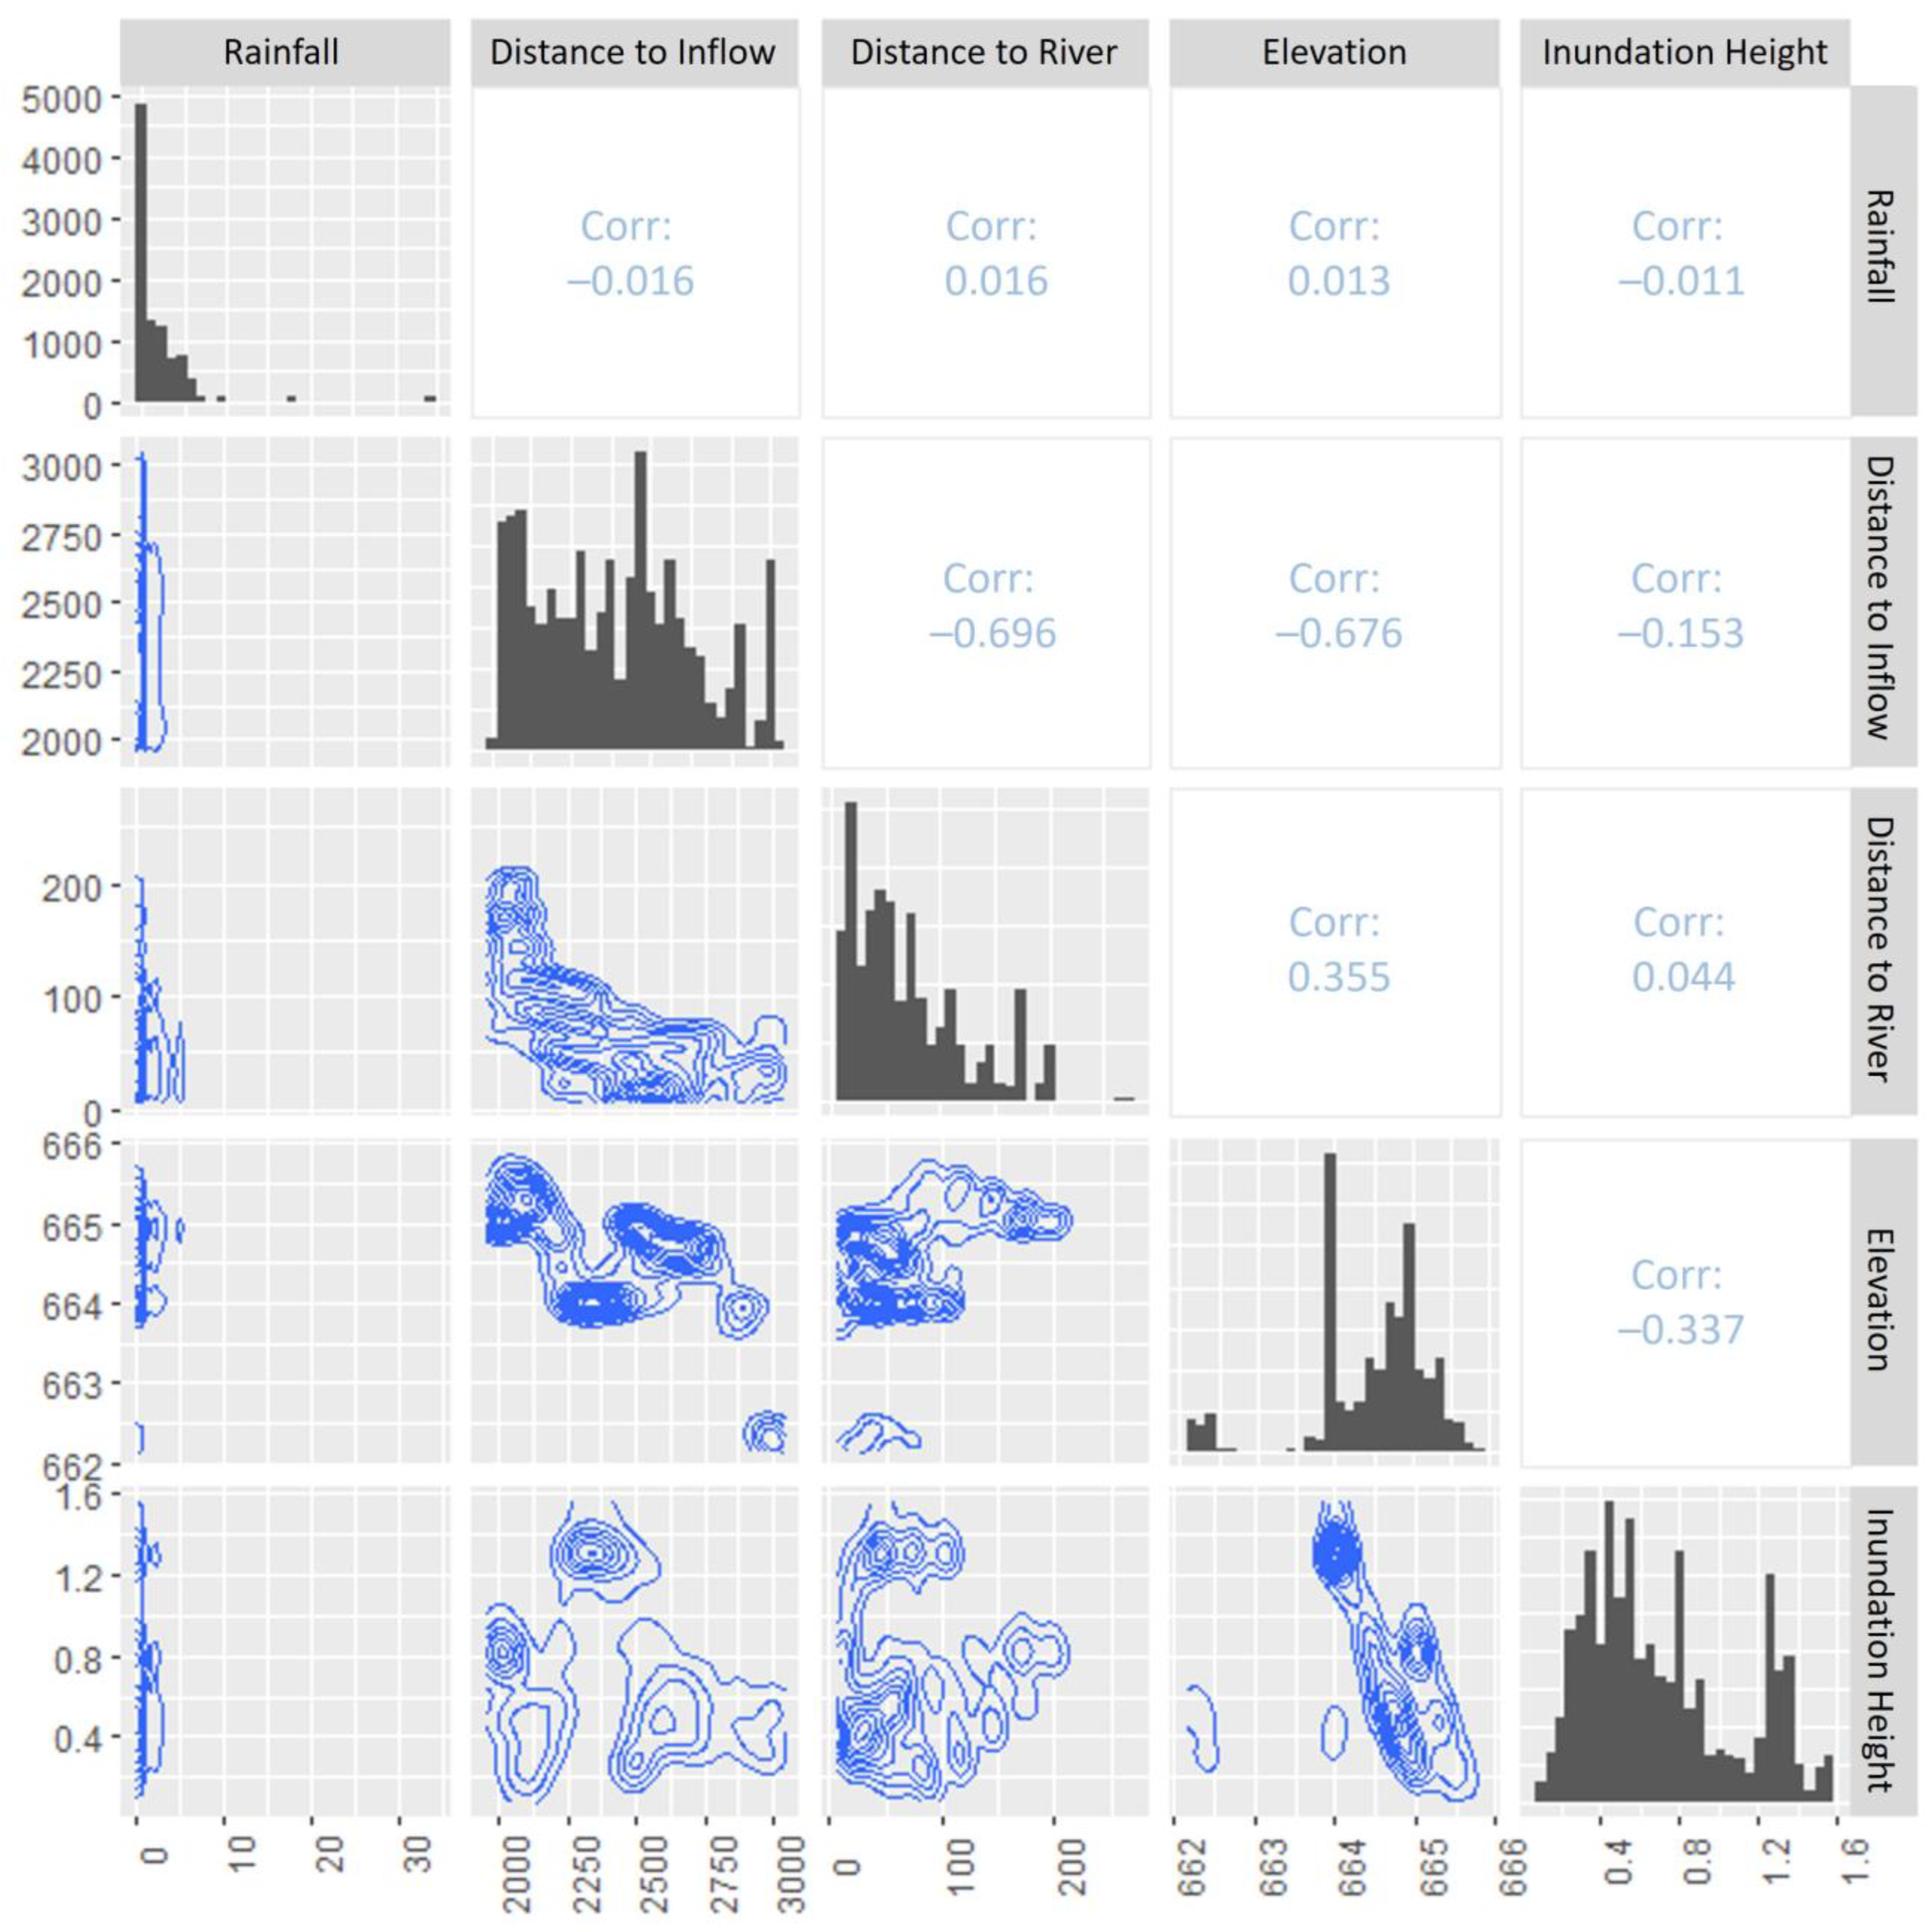
The relationship between the selected variables and the desired output was evaluated by calculating the coefficient of correlation (r) and the coefficient of determination (R2). The coefficients are widely used for regression analysis evaluation, identifying how much the independent variable determines the dependent variable [46]. The coefficients of correlation of the four input or explanatory variables and one output variable were processed using R language, with the “cor” command in the “tidyverse” library. Knowing the correlation between the explanatory and the output variables is important for understanding the character of the variables and ensuring that no variables are biased. The correlations between all variables in the ANN model are shown in Figure 5. The correlation between “distance to inflow variable” and “distance to the nearest river” had the highest coefficient of determination, −0.696. The negative value indicates that the independent variable (distance to inflow) was not determined by the dependent variable (distance to the nearest river).
Relating to the inundation height, the correlation of it to the distance of the nearest river was 0.044. The close-to-zero value means that the distance to the nearest river does not directly or linearly determine the inundation height. Relating to the inundation variable, the rainfall variable had a −0.011 correlation, distance to inflow had a −0.153 correlation, and elevation had a −0.337 correlation. As the correlations between the inundation height variable with the explanatory variables were generally low, two things can be implied. First, the explanatory variables were not linearly correlated with each other. Second, the inundation height cannot be linearly predicted using these variables. Therefore, these variables were suitable as explanatory variables, and the nonlinear prediction method (ANN) could be used.

4.3. Neural Network Model

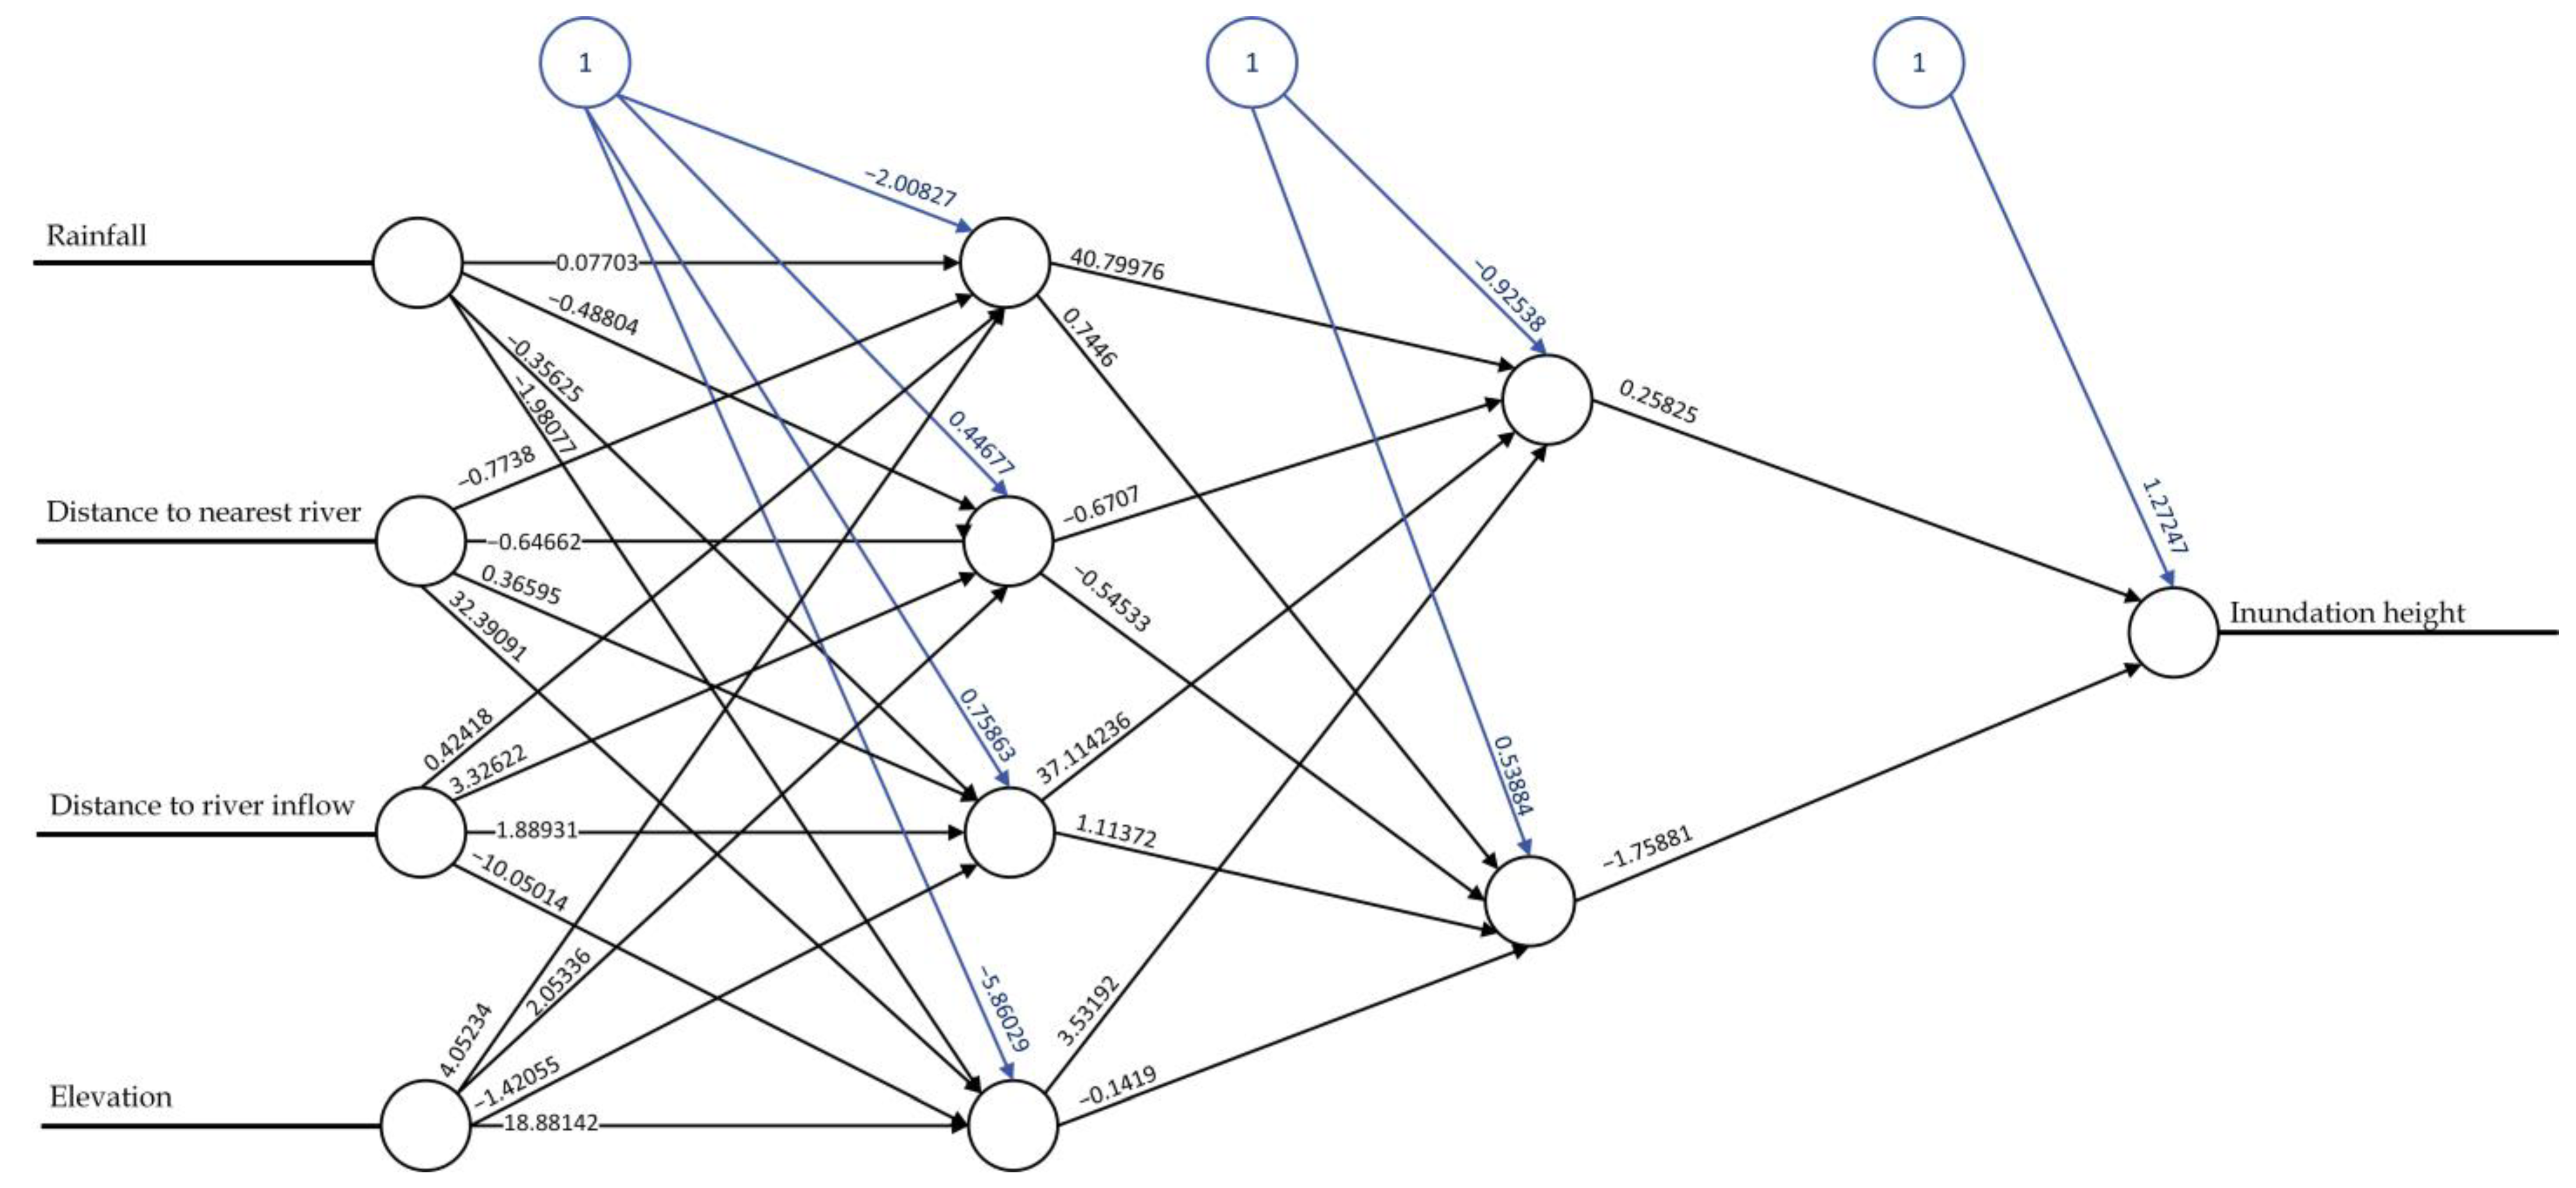
The results from the data preparation that recorded the total data indicated 136.278 rows and eight columns. The data consisted of rainfall, the x coordinate, the y coordinate, distance to the inflow, distance to the nearest river, elevation, and the inundation height. The geometric data as distance and elevation data were extracted from the flood inundation map. Also, the inundation height was extracted from sixteen events simulated with HEC-RAS. The rainfall data were filtered to match the time of the sixteen events. These data were used as input and targeted outputs. The general scheme and the weight results are shown in Figure 6.
These data were set randomly and divided into training and validation data. The data ratios were 75% for training data and 25% for validation data. The ANN model and the inundation height model prediction used training data as learning media so the model could learn the characteristic of the inundation height. As shown in Figure 6, the model shows what variable combination influences the inundation height the most by the link weights. The validation data were used as input for the inundation height prediction model.
The trained ANN model architecture (Figure 6) consisted of three layers: the input, hidden, and output layers. The input layer contained input nodes, which in this study were the rainfall node, distance to the nearest node, distance to the inflow node, and elevation node. This model was built of interconnected nodes or neurons [47]. In the hidden layer, these neurons multiply the input value with the weight of the input. The results were inputted into the hidden layer that contains the activation function, which in this study used one of the most popular activations, the tanh function. Before passing to the next layer, the bias node was added. Both the weight of each node and the bias node were initially randomly arranged, and by learning, the ANN model was adjusted to correct output during training, as shown in Figure 6.
The information in Figure 6 explains the process of the ANN model algorithm learning. The text or number in the line between nodes is the weight of the link between the variables influencing the next node. The ANN model minimizes errors by optimizing the weights between the nodes. In the optimization process, the neural network learns from input and output values in cycles and outright adjusts the weights, which in this study needed more than 20,000 epochs to obtain the optimized weights. The use of the weights is essential for the ANN model’s ability to minimize the difference between the predicted and observed value; in this study, the difference was 0.947785 [48]. This study used two hidden layers with (4,3) nodes, as shown in Figure 6. Studies showed that using two hidden layers with activation of the tanh function is suitable for approximating an analytic function. The results showed an improvement over other results [39]. An architecture with one hidden layer was also evaluated; however, the results were not sufficient.
Figure 7 compares the inundation height from the ANN with the HEC-RAS inundation height. Figure 7A compares the training data subset, while Figure 7B compares the validation data subset. As visually shown, the model prediction results performed well since the dots tended to converge to the red 1:1 line. This means these two data types have close values because they tend to be near the 45° line. Furthermore, the R2 values were calculated to measure the relationship between the two data. The R2 for the training subset was 0.9529. This shows that the predicted inundation height was influenced by 95% by the explanatory variables for the training subset. The inundation height prediction Nash–Sutcliffe Efficiency (NSE) score was 0.9292, and the root-mean-square error (RMSE) was 0.3701.
After the prediction model was obtained, the model was introduced with the validation data subset. This data subset was a part of the large dataset that was not used for the ANN training. The validation result can be seen in Figure 7B. As shown, the predicted inundation height results were close to the actual (HEC-RAS) inundation height. Visually, the data points tended to gather on the 45° line. The R2 value for the validation subset was 0.9537, meaning the predicted inundation height of the validation subset was also 95% influenced by the explanatory variables. As the two data types had a high correlation value greater than 0.8, the neural network model can be deemed successful in predicting the inundation height.
When spatially mapped, Figure 7C,D compare the HEC-RAS and ANN inundation results for a selected event, i.e., the 8 March 2017, event. As shown, there were no visually noticeable differences between the two flood inundation height maps. The locations where the flood inundation was high or low were the same for the HEC-RAS and the ANN. Figure 7E further strengthens the claim, with the map of the inundation difference between the HEC-RAS and the ANN being primarily low.

4.4. Testing

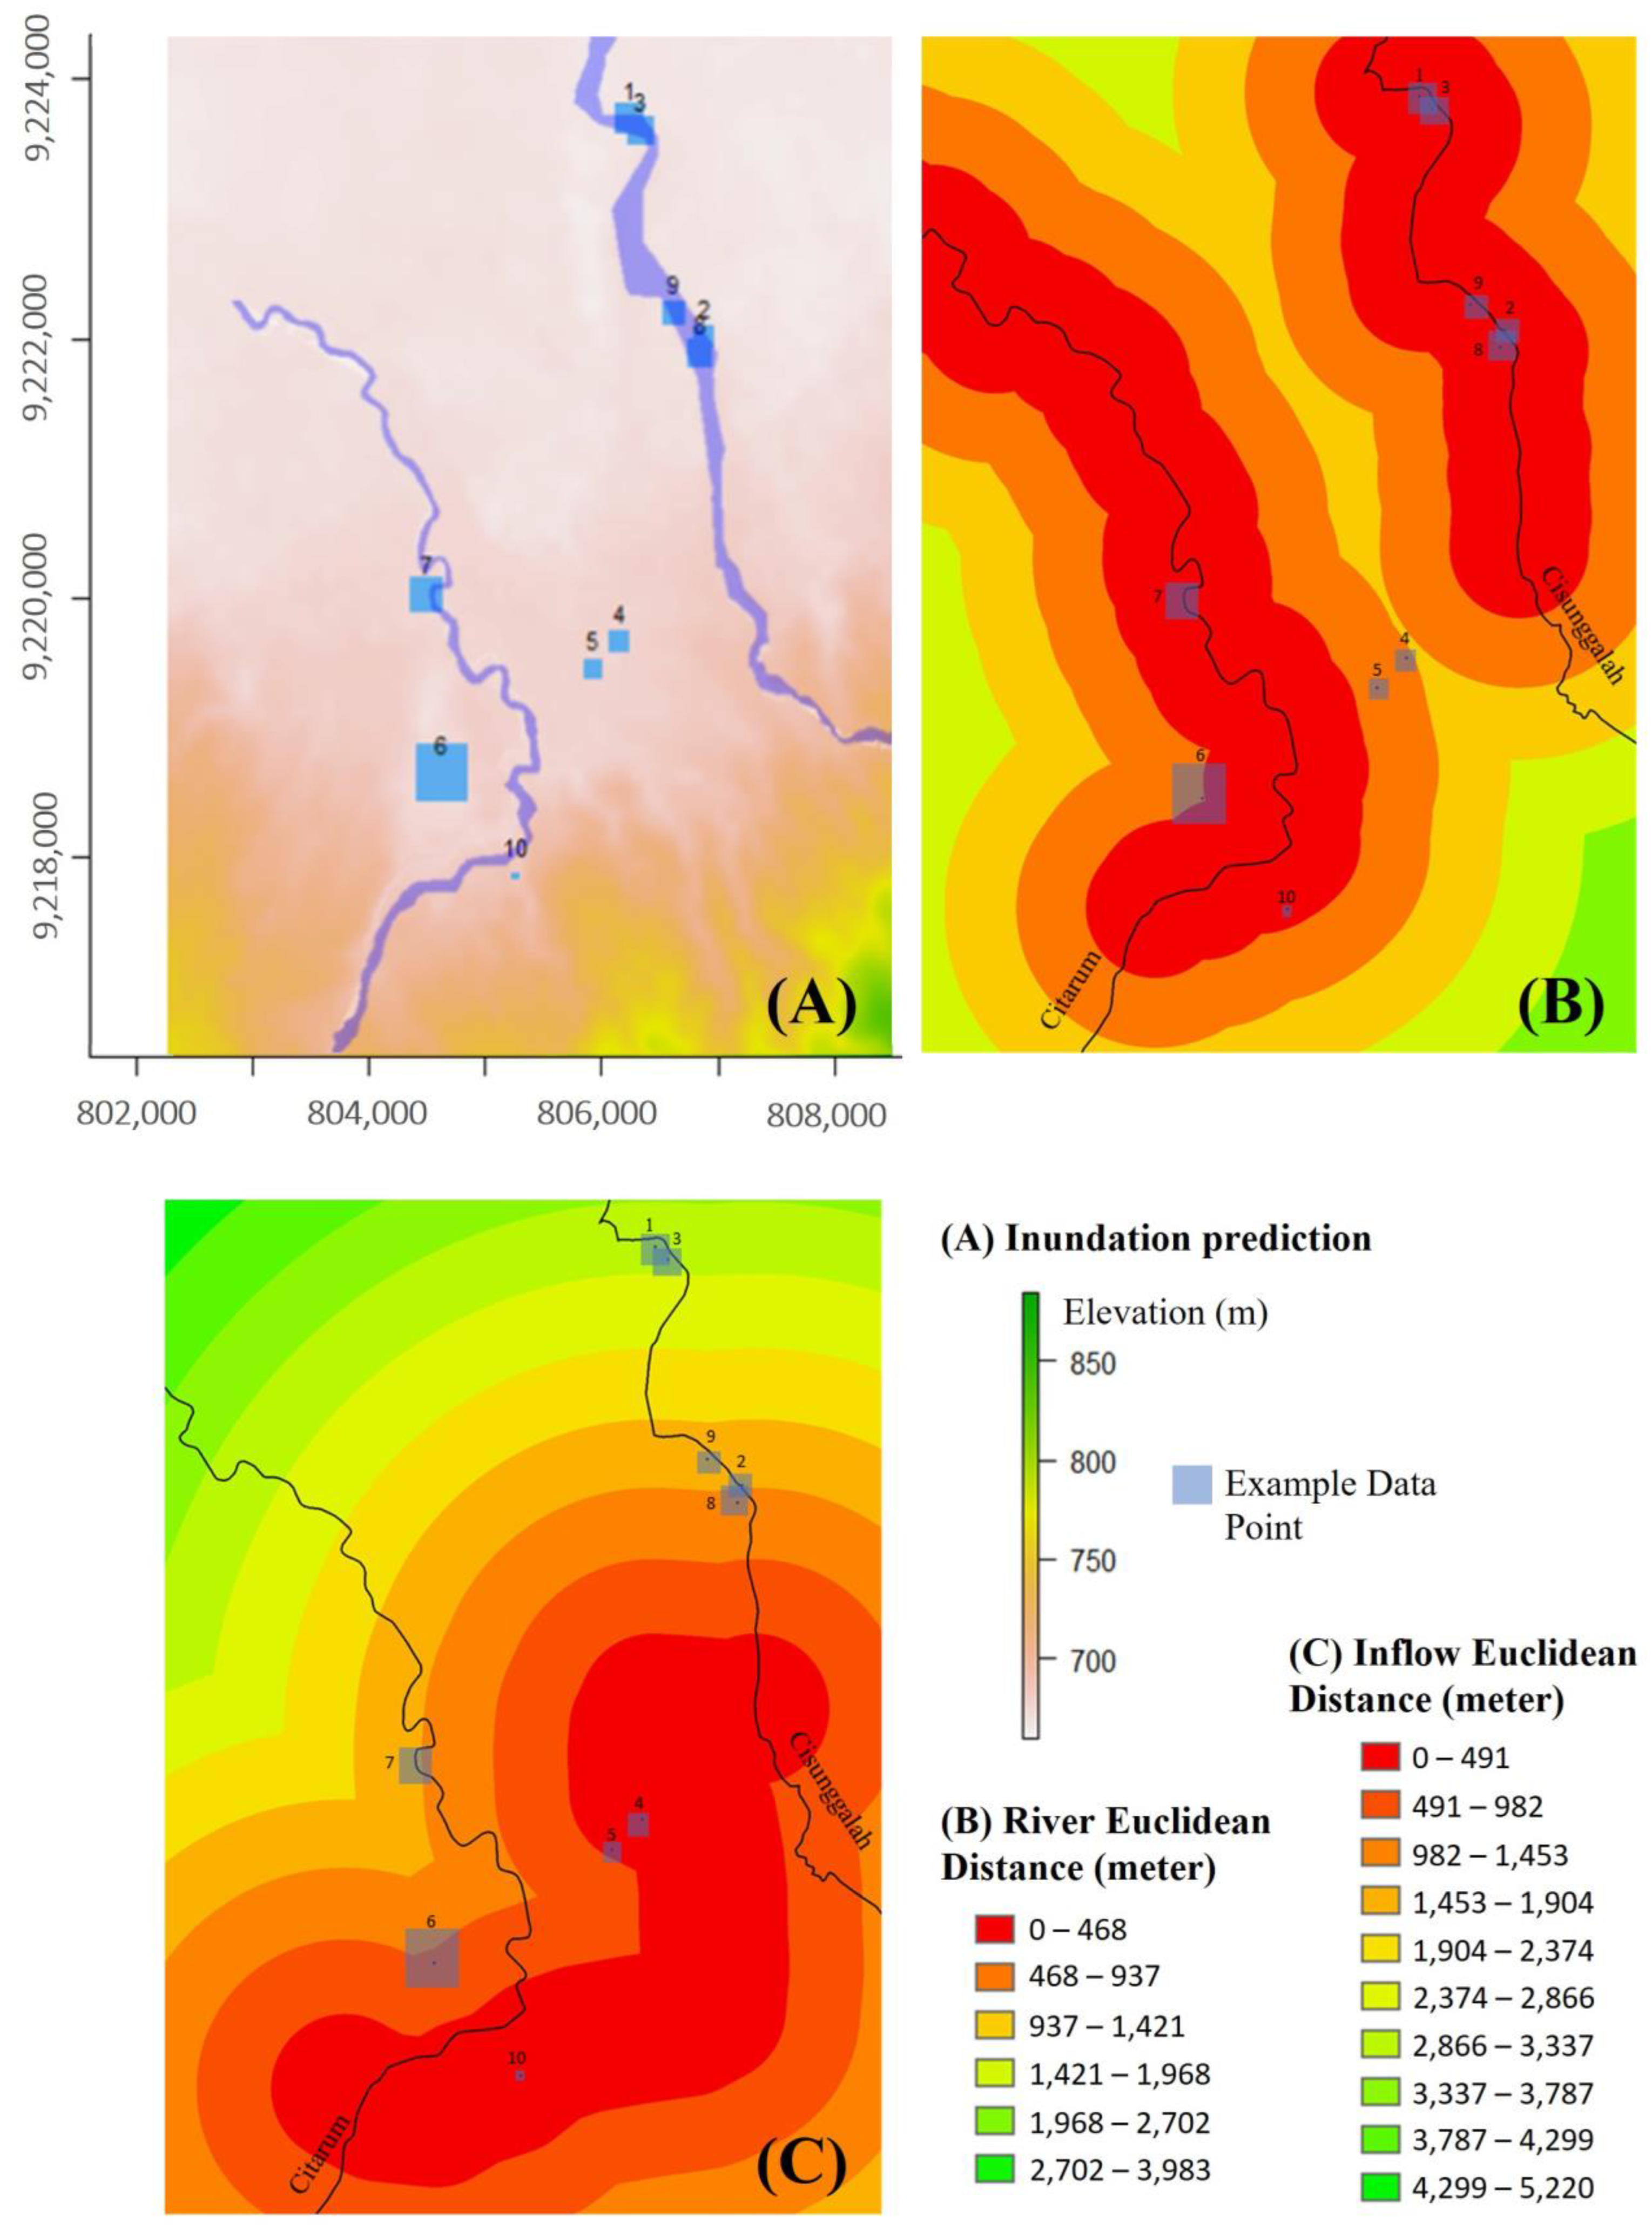
The process then continued with the application of the model to see if it could predict the water level with new input data. The geometric data used were still the same as the training (Majalaya area); however, the model used ten unseen rainfall events. These testing data were used as the input to the trained ANN model, resulting in inundation heights. The resulting inundation height is shown in Figure 8A. The inundation heights in ten example cases were symbolized with different square sizes to show the different depths of the inundation. Figure 8A shows the coordinate points with the predicted inundation heights. The size of the inundation point describes the predicted inundation height. The larger the point size, the higher the inundation height, as in Table 3. The highest inundation height was the test event number 6, with an inundation height of 2.66 m, and event number 7, with an inundation height of 1.85 m. Regarding the testing data, event number 6 was close to the inflow, and the nearest river, the Citarum River, caused the inundation to be higher than that in the other area [33,49]. Interestingly, rainfall was low, but as explained in [49], the ANN indicated that the elevation had a higher weight than rainfall. As for event number 7, it had a testing data rainfall of 47 mm, the distance from the river was close, and the elevation was high, but the distance from the inflow was quite far. In event number 3, the rainfall was 31 mm, higher than that in event number 6. However, what caused the inundation height not to be higher than that in number 6 was the distance from the inflow, which was far [44], even though the distance from the river was close and the elevation was lower.

5. Discussion

A FEWS is one way to reduce or prevent losses due to flooding. Given the short windows of the flood travel time in some areas, including in this case study area, a reliable FEWS is essential, even in the form of conventional communication tools. In this Majalaya study case, the area experienced floods relatively quickly, while the floods sometimes occurred during nighttime. Although Majalaya citizens formed a mitigation and flood observer volunteer group, which they have been working on for years, humans naturally have limited time and capability to observe the water level, and especially during the nighttime, human observers need to rest. Because of this, the flood observers could be caught off-guard by the unobserved floods. This situation could lead the government and citizens to have a short time to evacuate themselves [10,47]. Developments in predicting floods are important to inform the citizens of the probability of incoming flooding to implement mitigation and to have plenty of time to evacuate [50]. This study involved the use of ANN model for an inundation map based on extreme rainfall events. The model predicted the inundation data quite well, even with the example rainfall records. Once trained, the ANN model could run in a matter of seconds.
At present, the mitigation in the Majalaya area is a community approach by Garda Caah, a flood observer volunteer community by Majalaya citizens, experts, and the government. Their activity is to monitor the atmospheric signs and the water level of the Citarum River and announce to Majalaya citizens if a flood is probable. As a result, this community approach is successful but has limited time to monitor the water level [10]. Solving the problem of limited human capability for monitoring rainfall and the upstream water level can be solved with a better system by a computer. In recent years, artificial intelligence (AI) has been widely used by researchers. One of the AI forms, machine learning, can surrogate human work without any limited time, make the process faster, and allow flood forecasting [51]. Therefore, this machine learning can be used to predict floods faster and more accurately. Another study utilized machine learning using the ANN method and HEC-RAS to improve the accuracy of predicting flood inundation in a region [35].
Based on the earth’s current condition, climate change has increased drastically, and rainfall characteristics are changing, causing extreme rainfall to occur more often. Therefore, in this modeling, from several approach variables, rainfall data are a variable factor that changes. Based on sources, the Majalaya community currently uses a mitigation system as a community approach [10,52]. This study utilized easy and fast data that we can obtain, like satellite rainfall data, and developed a prediction model with machine learning. However, this prevents civilians from injuries caused by natural hazards, but does not prevent flooding. Preventing and reducing the loss caused by flooding need an improvement between two sides, the physical form, such as river engineering, drainage, dams, and weirs, and the system, such as mitigation plans, FEWS, and an increase in citizens’ awareness to maintain rivers and drainage clear of solid waste [1].
The damage may get worse as the climate changes over time. Climate change will continue to increase as the human population and the impending magnitude of global climate change [6,53]. Also, floods can threaten the security of society and the normal development of the economy in cities caused by extreme rainfall and the vulnerability and resiliency of the affected area. Human losses from flooding are projected to rise by 70–83% and direct flood damage by 160–240%, depending on the socio-economic scenario. The development of flood mitigation can face the urgent challenge of climate change in the coming decades. Rapid urbanization, overpopulation, climate change, extreme precipitation events, aging infrastructure, and low standards of stormwater drainage networks can threaten people’s lives, properties, and the environment [54]. Several studies have studied some of Majalaya’s problems, such as microplastic problems in drainage [55], the distributions of unconfined aquifers [56], the changes in rainfall characteristics in the Majalaya Basin that cause climate change [14], and the modeling of the 2018 Majalaya, and the floods caused the most extensive losses [12].

6. Conclusions

This study presented an ANN model for an inundation height prediction model utilizing satellite rainfall data for the Majalaya Watershed. Based on available data on flood events, the ANN model started from the 2017–2022 period for training, and validation was evaluated, resulting in very good R2, NSE, and RMSE values. The ANN used four explanatory variables: rainfall, distance to river inflow, distance to the nearest river, and elevation. The ANN model successfully predicted the inundation height with R2 values of 0.9529 for training and 0.9537 for validation. The ANN model was applied to predict the inundation height with new input data, and the model predicted the inundation height and the inundated location. Finally, it was concluded that the ANN model is a promising tool for early warning systems. Further research avenues are advised, e.g., utilizing various real-time data such as climate data, land or soil data, and demographic data for early warning systems. Since this study is limited to the flood-prone area in Majalaya and short-range historical data (rainfall data and selected events), the results presented in this study are expected to be reproducible in other locations and generalizable to other cases.

Author Contributions

Conceptualization, F.I.W.R. (Faizal Immaddudin Wira Rohmat) and M.F.; methodology, N.S.B.; software, N.S.B. and F.I.W.R. (Faizal Immaddudin Wira Rohmat); validation, H.K., A.A.K., M.F. and F.I.W.R. (Faizal Immaddudin Wira Rohmat); formal analysis, N.S.B.; investigation, F.I.W.R. (Faizal Immaddudin Wira Rohmat); resources, F.I.W.R. (Faizal Immaddudin Wira Rohmat); data curation, N.S.B.; writing—original draft preparation, N.S.B.; writing—review and editing, H.K., A.A.K., M.F., F.I.W.R. (Faizal Immaddudin Wira Rohmat), F.I.W.R. (Fauzan Ikhlas Wira Rohmat) and W.W.; visualization, N.S.B. and F.I.W.R. (Fauzan Ikhlas Wira Rohmat); supervision, F.I.W.R. (Faizal Immaddudin Wira Rohmat) and M.F.; project administration, F.I.W.R. (Faizal Immaddudin Wira Rohmat) and M.F.; funding acquisition, F.I.W.R. (Faizal Immaddudin Wira Rohmat). All authors have read and agreed to the published version of the manuscript.

Funding

This research was supported by the Bandung Institute of Technology (ITB) DTTP research grant for contract number 1354/ITI.B05/KP/2021, ITB Research Excellence Grant (RUI) with contract number LPPM.PN-6-08-2023, and the ITB International Research Grant with contract number LPPM.PN-10-56-2022.

Data Availability Statement

Data will be made available upon request.

Conflicts of Interest

The authors declare no conflict of interest.

References

  1. Botzen, W.J.W.; Deschenes, O.; Sanders, M. The Economic Impacts of Natural Disasters: A Review of Models and Empirical Studies. Rev. Environ. Econ. Policy 2019, 13, 167–188. [Google Scholar] [CrossRef]
  2. Convertino, M.; Annis, A.; Nardi, F. Information-theoretic portfolio decision model for optimal flood management. Environ. Model. Softw. 2019, 119, 258–274. [Google Scholar] [CrossRef]
  3. Panahi, M.; Jaafari, A.; Shirzadi, A.; Shahabi, H.; Rahmati, O.; Omidvar, E.; Lee, S.; Bui, D.T. Deep learning neural networks for spatially explicit prediction of flash flood probability. Geosci. Front. 2021, 12, 101076. [Google Scholar] [CrossRef]
  4. Davenport, F.V.; Burke, M.; Diffenbaugh, N.S. Contribution of historical precipitation change to US flood damages. Proc. Natl. Acad. Sci. USA 2021, 118, e2017524118. [Google Scholar] [CrossRef] [PubMed]
  5. Jamali, B.; Bach, P.M.; Deletic, A. Rainwater harvesting for urban flood management—An integrated modelling framework. Water Res. 2020, 171, 115372. [Google Scholar] [CrossRef] [PubMed]
  6. Munoz, S.E.; Giosan, L.; Therrell, M.D.; Remo, J.W.F.; Shen, Z.; Sullivan, R.M.; Wiman, C.; O’donnell, M.; Donnelly, J.P. Climatic control of Mississippi River flood hazard amplified by river engineering. Nature 2018, 556, 95–98. [Google Scholar] [CrossRef]
  7. Chen, Y.; Syvitski, J.P.M.; Gao, S.; Overeem, I.; Kettner, A.J. Socio-economic Impacts on Flooding: A 4000-Year History of the Yellow River, China. AMBIO 2012, 41, 682–698. [Google Scholar] [CrossRef]
  8. Indonesian National Board for Disaster Management (BNPB). BNPB Verifikasi 5.402 Kejadian Bencana Sepanjang Tahun 2021-BNPB 2022. Available online: https://bnpb.go.id/Berita/Bnpb-Verifikasi-5-402-Kejadian-Bencana-Sepanjang-Tahun-20212022 (accessed on 14 August 2023).
  9. Rohmat, F.I.W.; Sa’Adi, Z.; Stamataki, I.; Kuntoro, A.A.; Farid, M.; Suwarman, R. Flood modeling and baseline study in urban and high population environment: A case study of Majalaya, Indonesia. Urban Clim. 2022, 46, 101332. [Google Scholar] [CrossRef]
  10. Junnaedhi, I.D.G.A.; Riawan, E.; Suwarman, R.; Hadi, T.W.; Lubis, A.; Trilaksono, N.J.; Rahayu, R.; Kombara, P.; Waskito, R.; Oktora, H.E.; et al. Majalaya Flood Early Warning System: A Community Based Approach. IOP Conf. Series Earth Environ. Sci. 2017, 71, 012013. [Google Scholar] [CrossRef]
  11. Schwertner, K.; Zlateva, P.; Velev, D. Digital technologies of industry 4.0 in management of natural disasters. In ACM International Conference Proceeding Series, Proceedings of the 2nd International Conference on E-Commerce, E-Business and E-Government, Hong Kong, China, 13–15 June 2018; Association for Computing Machinery: New York, NY, USA, 2018. [Google Scholar] [CrossRef]
  12. Sa’adi, Z.; Stamataki, I.; Shahid, S.; Zaher, M.; Yaseen, M.; Yusop, Z. Spatiotemporal Rainfall Projection in Majalaya basin, West Java, Indonesia under CMIP6 Scenarios. Res. Sq. 2022. [Google Scholar] [CrossRef]
  13. Rohmat, F.I.W.; Stamataki, I.; Sa’adi, Z.; Fitriani, D. Flood analysis using HEC-RAS: The case study of Majalaya, Indonesia under the CMIP6 projection. EGU22 2022. [Google Scholar] [CrossRef]
  14. Irawan, M.F.; Hidayat, Y.; Tjahjono, B. Penilaian Bahaya dan Arahan Mitigasi Banjir di Cekungan Bandung. J. Ilmu Tanah dan Lingkung. 2018, 20, 1–6. [Google Scholar] [CrossRef]
  15. Jones, P. Formalizing the Informal: Understanding the Position of Informal Settlements and Slums in Sustainable Urbanization Policies and Strategies in Bandung, Indonesia. Sustainability 2017, 9, 1436. [Google Scholar] [CrossRef]
  16. Wen, Y.; Schuur, T.; Vergara, H.; Kuster, C. Effect of Precipitation Sampling Error on Flash Flood Monitoring and Prediction: Anticipating Operational Rapid-Update Polarimetric Weather Radars. J. Hydrometeorol. 2021, 22, 1913–1929. [Google Scholar] [CrossRef]
  17. Kidd, C.; Becker, A.; Huffman, G.J.; Muller, C.L.; Joe, P.; Skofronick-Jackson, G.; Kirschbaum, D.B. So, How Much of the Earth’s Surface Is Covered by Rain Gauges? Bull. Am. Meteorol. Soc. 2017, 98, 69–78. [Google Scholar] [CrossRef]
  18. Chao, L.; Zhang, K.; Li, Z.; Zhu, Y.; Wang, J.; Yu, Z. Geographically weighted regression based methods for merging satellite and gauge precipitation. J. Hydrol. 2018, 558, 275–289. [Google Scholar] [CrossRef]
  19. Zhang, L.; Li, X.; Zheng, D.; Zhang, K.; Ma, Q.; Zhao, Y.; Ge, Y. Merging multiple satellite-based precipitation products and gauge observations using a novel double machine learning approach. J. Hydrol. 2021, 594, 125969. [Google Scholar] [CrossRef]
  20. Tian, Y.; Peters-Lidard, C.D.; Adler, R.F.; Kubota, T.; Ushio, T. Evaluation of GSMaP Precipitation Estimates over the Contiguous United States. J. Hydrometeorol. 2010, 11, 566–574. [Google Scholar] [CrossRef]
  21. Aonashi, K.; Awaka, J.; Hirose, M.; Kozu, T.; Kubota, T.; Liu, G.; Shige, S.; Kida, S.; Seto, S.; Takahashi, N.; et al. GSMaP Passive Microwave Precipitation Retrieval Algorithm: Algorithm Description and Validation. J. Meteorol. Soc. Jpn. 2009, 87A, 119–136. [Google Scholar] [CrossRef]
  22. Priyambodoho, B.A.; Kure, S.; Yagi, R.; Januriyadi, N.F. Flood inundation simulations based on GSMaP satellite rainfall data in Jakarta, Indonesia. Prog. Earth Planet. Sci. 2021, 8, 34. [Google Scholar] [CrossRef]
  23. Chua, Z.-W.; Kuleshov, Y.; Watkins, A.B.; Choy, S.; Sun, C. A Two-Step Approach to Blending GSMaP Satellite Rainfall Estimates with Gauge Observations over Australia. Remote Sens. 2022, 14, 1903. [Google Scholar] [CrossRef]
  24. Kubota, T.; Shige, S.; Hashizume, H.; Aonashi, K.; Takahashi, N.; Seto, S.; Hirose, M.; Takayabu, Y.N.; Ushio, T.; Nakagawa, K.; et al. Global Precipitation Map Using Satellite-Borne Microwave Radiometers by the GSMaP Project: Production and Validation. IEEE Trans. Geosci. Remote Sens. 2007, 45, 2259–2275. [Google Scholar] [CrossRef]
  25. Burnama, N.S.; Rohmat, F.I.W.; Farid, M.; Wijayasari, W. Utilization of quantile mapping method using cumulative distribution function (CDF) to calibrated satellite rainfall GSMaP in Majalaya watershed. IOP. Conf. Ser. Earth Environ. Sci. 2023, 1165, 012006. [Google Scholar] [CrossRef]
  26. Cannon, A.J.; Sobie, S.R.; Murdock, T.Q. Bias Correction of GCM Precipitation by Quantile Mapping: How Well Do Methods Preserve Changes in Quantiles and Extremes? J. Clim. 2015, 28, 6938–6959. [Google Scholar] [CrossRef]
  27. Paz, S.M.; Willems, P. Uncovering the strengths and weaknesses of an ensemble of quantile mapping methods for downscaling precipitation change in Southern Africa. J. Hydrol. Reg. Stud. 2022, 41, 101104. [Google Scholar] [CrossRef]
  28. Farid, M.; Pratama, M.I.; Kuntoro, A.A.; Adityawan, M.B.; Rohmat, F.I.W.; Moe, I.R. Flood Prediction due to Land Cover Change in the Ciliwung River Basin. Int. J. Technol. 2022, 13, 356. [Google Scholar] [CrossRef]
  29. Garrote, J. Free Global DEMs and Flood Modelling—A Comparison Analysis for the January 2015 Flooding Event in Mocuba City (Mozambique). Water 2022, 14, 176. [Google Scholar] [CrossRef]
  30. Namara, W.G.; Damisse, T.A.; Tufa, F.G. Application of HEC-RAS and HEC-GeoRAS model for Flood Inundation Mapping, the case of Awash Bello Flood Plain, Upper Awash River Basin, Oromiya Regional State, Ethiopia. Model. Earth Syst. Environ. 2022, 8, 1449–1460. [Google Scholar] [CrossRef]
  31. Farid, M.; Mano, A.; Udo, K. Distributed flood model for urbanization assessment in a limited-gauged river basin. WIT Trans. Ecol. Environ. 2011, 146, 83–94. [Google Scholar] [CrossRef]
  32. Devia, G.K.; Ganasri, B.; Dwarakish, G. A Review on Hydrological Models. Aquat. Procedia 2015, 4, 1001–1007. [Google Scholar] [CrossRef]
  33. Jamshed, A.; Birkmann, J.; Rana, I.A.; Feldmeyer, D. The effect of spatial proximity to cities on rural vulnerability against flooding: An indicator based approach. Ecol. Indic. 2020, 118, 106704. [Google Scholar] [CrossRef]
  34. Hagen, J.S.; Cutler, A.; Trambauer, P.; Weerts, A.; Suarez, P.; Solomatine, D. Development and evaluation of flood forecasting models for forecast-based financing using a novel model suitability matrix. Prog. Disaster Sci. 2020, 6, 100076. [Google Scholar] [CrossRef]
  35. Tamiru, H.; Dinka, M.O. Application of ANN and HEC-RAS model for flood inundation mapping in lower Baro Akobo River Basin, Ethiopia. J. Hydrol. Reg. Stud. 2021, 36, 100855. [Google Scholar] [CrossRef]
  36. Nusinovici, S.; Tham, Y.C.; Yan, M.Y.C.; Ting, D.S.W.; Li, J.; Sabanayagam, C.; Wong, T.Y.; Cheng, C.-Y. Logistic regression was as good as machine learning for predicting major chronic diseases. J. Clin. Epidemiol. 2020, 122, 56–69. [Google Scholar] [CrossRef] [PubMed]
  37. Barron, A. Universal approximation bounds for superpositions of a sigmoidal function. IEEE Trans. Inf. Theory 1993, 39, 930–945. [Google Scholar] [CrossRef]
  38. Cybenko, G.; Cybenkot, G. Approximation by superpositions of a sigmoidal function Approximation by Superpositions of a Sigmoidal Function*. Math. Control. Signals Syst. 1989, 2, 303–314. [Google Scholar] [CrossRef]
  39. De Ryck, T.; Lanthaler, S.; Mishra, S. On the approximation of functions by tanh neural networks. Neural Netw. 2021, 143, 732–750. [Google Scholar] [CrossRef]
  40. Sahoo, B.; Bhaskaran, P.K. Prediction of storm surge and coastal inundation using Artificial Neural Network—A case study for 1999 Odisha Super Cyclone. Weather. Clim. Extremes 2019, 23, 100196. [Google Scholar] [CrossRef]
  41. Karim, F.; Armin, M.A.; Ahmedt-Aristizabal, D.; Tychsen-Smith, L.; Petersson, L. A Review of Hydrodynamic and Machine Learning Approaches for Flood Inundation Modeling. Water 2023, 15, 566. [Google Scholar] [CrossRef]
  42. Wu, W.; Dandy, G.C.; Maier, H.R. Protocol for developing ANN models and its application to the assessment of the quality of the ANN model development process in drinking water quality modelling. Environ. Model. Softw. 2014, 54, 108–127. [Google Scholar] [CrossRef]
  43. Nwanganga, F.; Chapple, M. Practical Machine Learning in R.; Wiley: Hoboken, NJ, USA, 2020. [Google Scholar] [CrossRef]
  44. O’Neill, E.; Brereton, F.; Shahumyan, H.; Clinch, J.P. The Impact of Perceived Flood Exposure on Flood-Risk Perception: The Role of Distance. Risk Anal. 2016, 36, 2158–2186. [Google Scholar] [CrossRef] [PubMed]
  45. Ali, A.; Rana, I.A.; Ali, A.; Najam, F.A. Flood risk perception and communication: The role of hazard proximity. J. Environ. Manag. 2022, 316, 115309. [Google Scholar] [CrossRef] [PubMed]
  46. Chicco, D.; Warrens, M.J.; Jurman, G. The coefficient of determination R-squared is more informative than SMAPE, MAE, MAPE, MSE and RMSE in regression analysis evaluation. PeerJ Comput. Sci. 2021, 7, e623. [Google Scholar] [CrossRef] [PubMed]
  47. Priscillia, S.; Schillaci, C.; Lipani, A. Flood susceptibility assessment using artificial neural networks in Indonesia. Artif. Intell. Geosci. 2021, 2, 215–222. [Google Scholar] [CrossRef]
  48. Agatonovic-Kustrin, S.; Beresford, R. Basic concepts of artificial neural network (ANN) modeling and its application in pharmaceutical research. J. Pharm. Biomed. Anal. 2000, 22, 717–727. [Google Scholar] [CrossRef]
  49. Desalegn, H.; Mulu, A. Flood vulnerability assessment using GIS at Fetam watershed, upper Abbay basin, Ethiopia. Heliyon 2021, 7, e05865. [Google Scholar] [CrossRef]
  50. Syariman, P.; Ginting, S. Peringatan Dini Banjir Berbasis Data Hidrologi Telemetri di DAS Citarum Hulu. J. Tek. Hidraul. 2011, 2, 254. [Google Scholar]
  51. Kardhana, H.; Valerian, J.R.; Rohmat, F.I.W.; Kusuma, M.S.B. Improving Jakarta’s Katulampa Barrage Extreme Water Level Prediction Using Satellite-Based Long Short-Term Memory (LSTM) Neural Networks. Water 2022, 14, 1469. [Google Scholar] [CrossRef]
  52. Kyselý, J.; Beranová, R. Climate-change effects on extreme precipitation in central Europe: Uncertainties of scenarios based on regional climate models. Theor. Appl. Clim. 2008, 95, 361–374. [Google Scholar] [CrossRef]
  53. Rosenzweig, B.R.; Cantis, P.H.; Kim, Y.; Cohn, A.; Grove, K.; Brock, J.; Yesuf, J.; Mistry, P.; Welty, C.; McPhearson, T.; et al. The Value of Urban Flood Modeling. Earth’s Futur. 2021, 9, e2020EF001739. [Google Scholar] [CrossRef]
  54. Kourtis, I.M.; Tsihrintzis, V.A.; Baltas, E. A robust approach for comparing conventional and sustainable flood mitigation measures in urban basins. J. Environ. Manag. 2020, 269, 110822. [Google Scholar] [CrossRef] [PubMed]
  55. Alam, F.C.; Sembiring, E.; Muntalif, B.S.; Suendo, V. Microplastic distribution in surface water and sediment river around slum and industrial area (case study: Ciwalengke River, Majalaya district, Indonesia). Chemosphere 2019, 224, 637–645. [Google Scholar] [CrossRef] [PubMed]
  56. Arifin, A.; Ramdhan, A.M.; Suwarman, R.; Irawan, D.E.; Hutasoit, L.M.; Puradimaja, D.J. Estimation of 3D hydraulic conductivity distribution of unconfined aquifer using the geostatistical method and its relation to water quality and flooding in Upper Citarum River. IOP Conf. Series: Mater. Sci. Eng. 2021, 1098, 052013. [Google Scholar] [CrossRef]
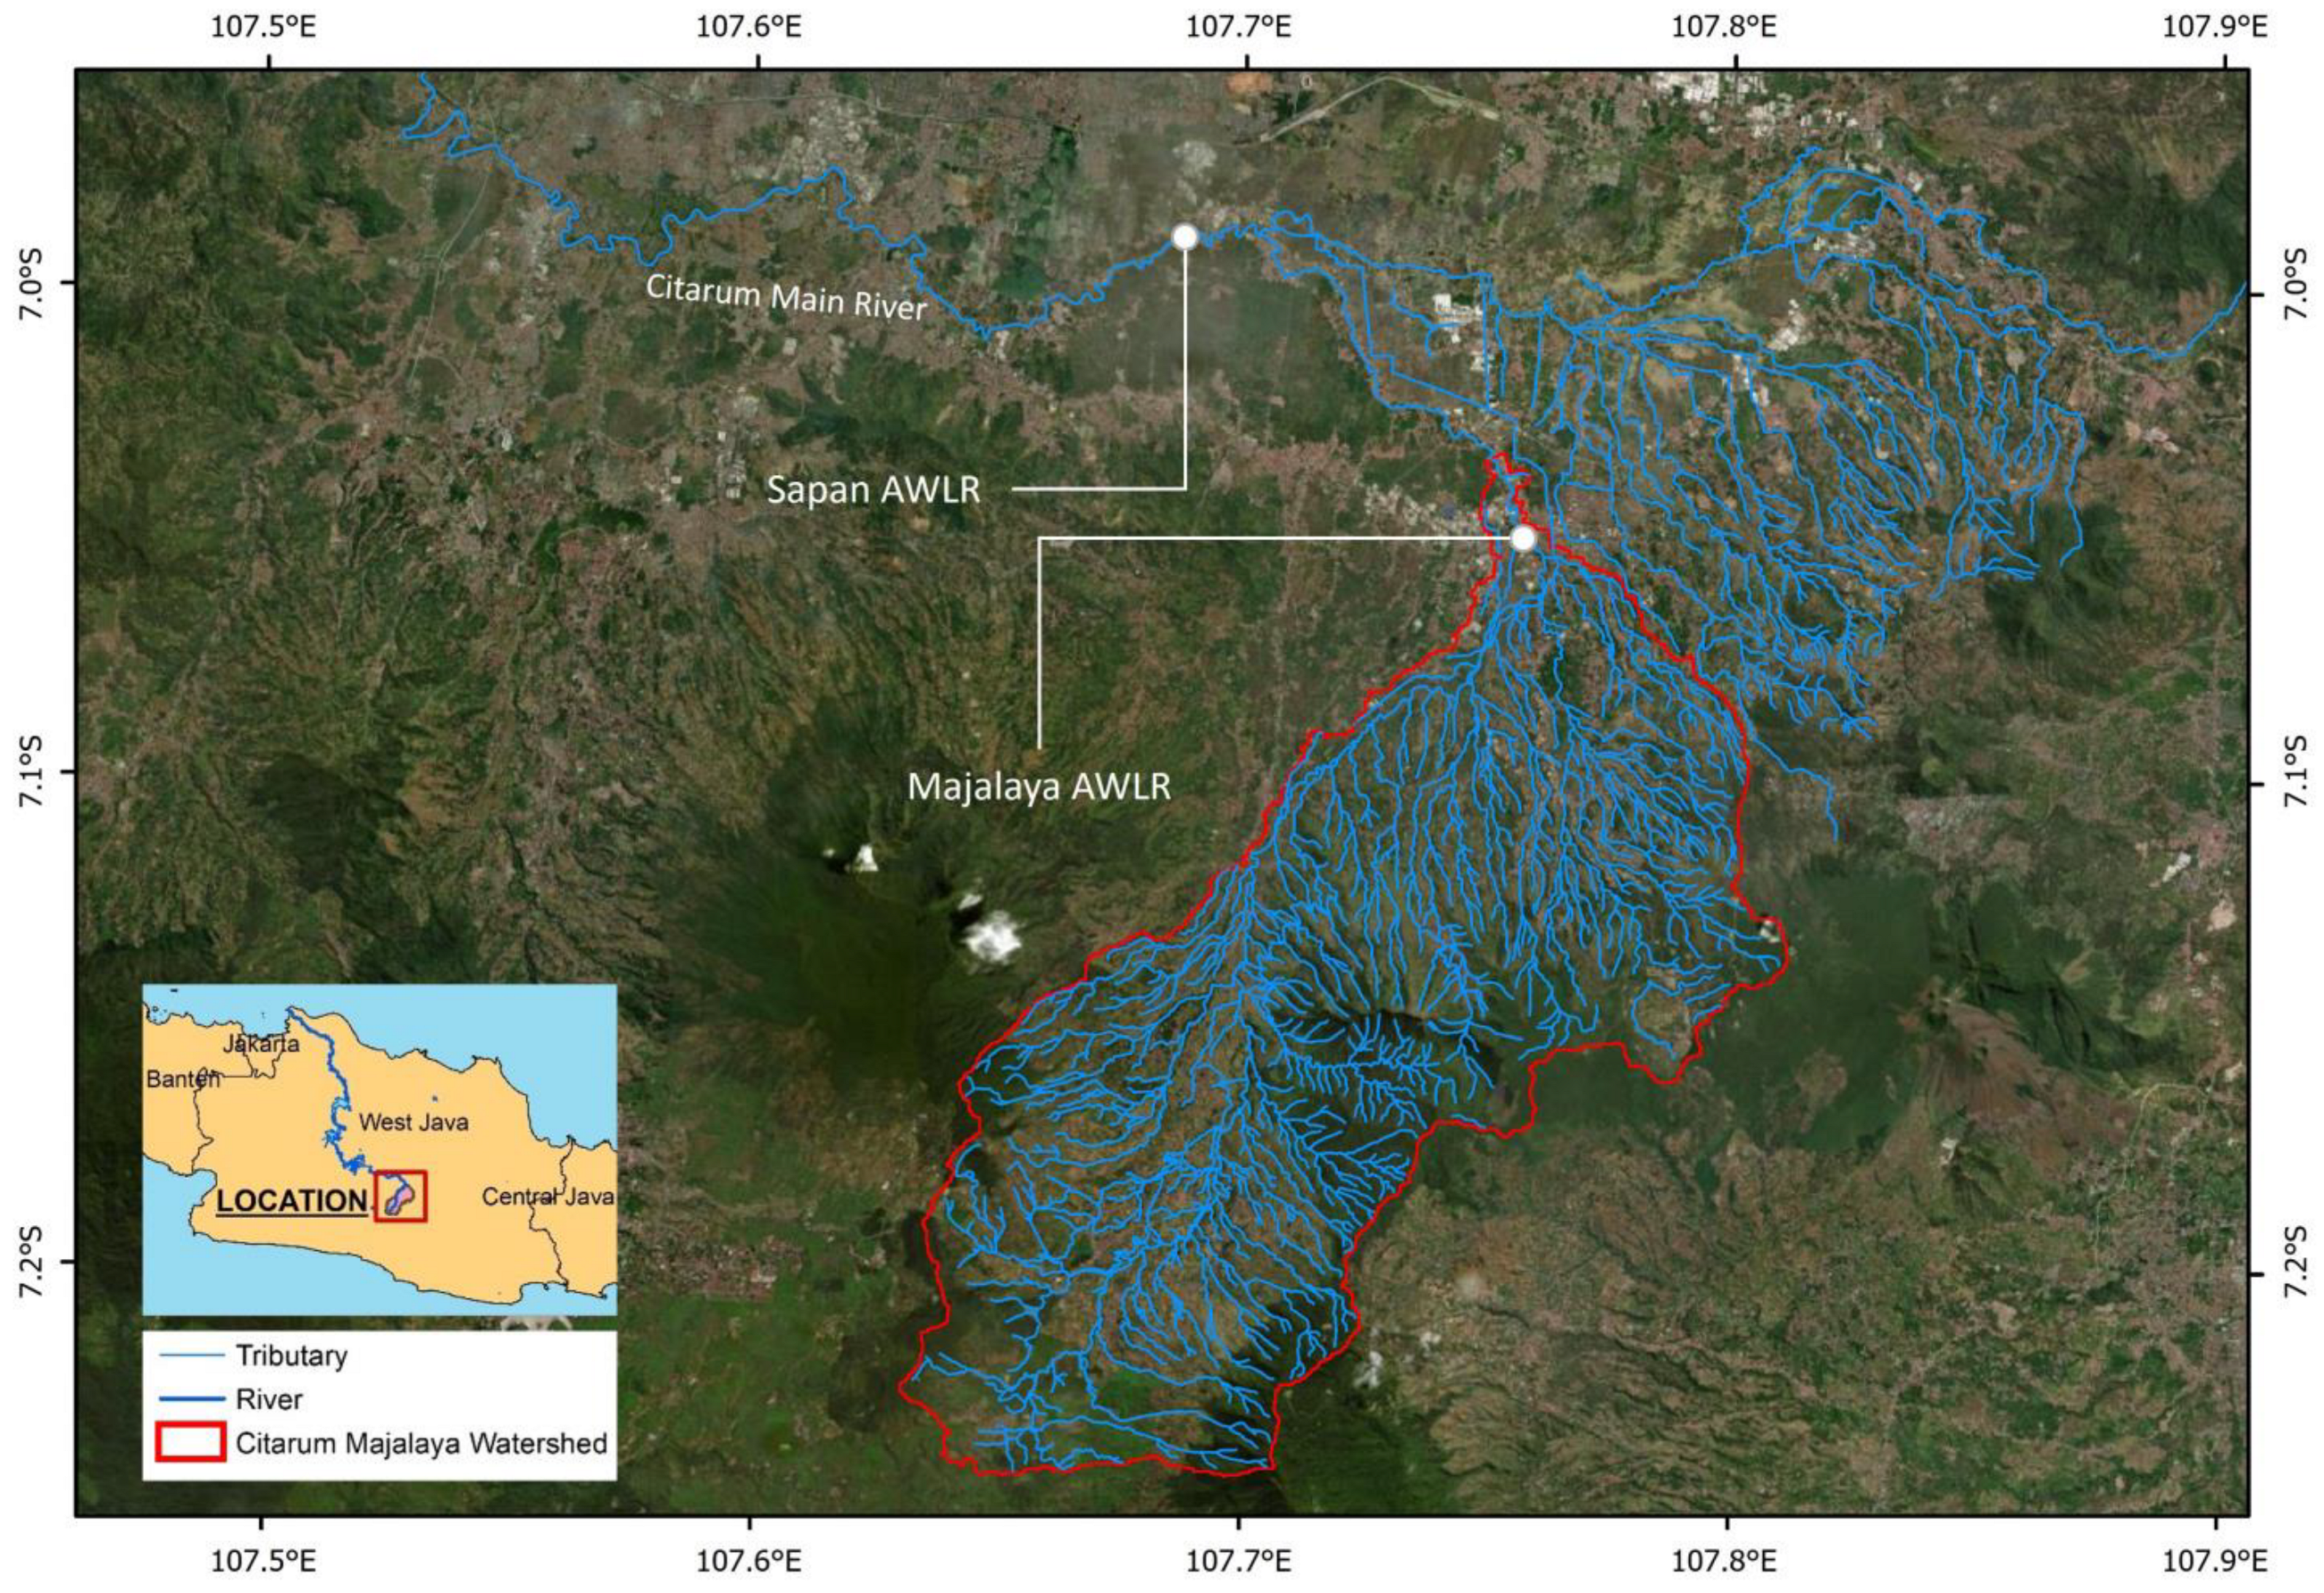
Figure 1. Majalaya Watershed area and Citarum River in West Java; the green point is where Majalaya’s Automatic Water Level Recorder (AWLR) is located.
Water 15 03026 g001
Figure 2. The river system in the analysis and modeling of the floods in the Majalaya Area.
Water 15 03026 g002
Figure 5. Coefficient of determination between each input and output variable of the ANN model.
Water 15 03026 g005
Figure 6. The trained ANN architecture scheme, showing the involved explanatory variables, the target variable (inundation height), and the link weights. The circles with the number “1” inside represent bias nodes.
Water 15 03026 g006
Figure 7. The inundation height of the modeling training data (A) and validation data (B) using an artificial neural network compared with observed inundation height from HEC-RAS. Parts (C) and (D) show a comparison between the HEC-RAS and ANN inundation results for a selected event, with part (E) presenting the difference between the two results.
Water 15 03026 g007
Figure 8. (A) Inundation height prediction map, the numbers indicate the testing event number; (B) Inundation height point overlay with the nearest river Euclidean distance; (C) Inundation height point overlay with the inflow river Euclidean distance.
Water 15 03026 g008
Table 1. Watershed area and rivers in Majalaya Area.
RiverArea (km2)
Citangkurak1.29
Cipalemahan7.69
Cihampelas3.47
Cikaro30.95
Cisunggalah45.83
Citarum165.09
Total207
Table 2. Summary of data collection.
Data NameData YearSource
Majalaya area DEM2018DEMNAS (Indonesian National DEM data) from BIG
River bathymetry2018Primary survey data
Flood event boundaries2018Crowdsourced data
RBI land cover map2006BIG
Satellite rainfall2014–2022JAXA (Japan Aerospace Exploration Agency)
Rain gauge precipitation2014–2022BMKG (Indonesian Meteorology, Climatology, and Geophysics Agency)
Citarum River discharge2017–2022BBWS Citarum (Citarum River Authority)
Table 3. Testing Data.
No.X
(m)
Y
(m)
Rainfall
(Hourly)
Distance to Inflow
(m)
Distance to River
(m)
Elevation
(m)
Inundation Height Prediction (m)
1805,914.909,223,578.285.643044.1614.66662.150.83
2806,487.389,222,003.976.871472.416.90666.470.69
3806,000.789,223,492.4131.232959.8337.49662.440.80
4805,829.039,219,799.954.50169.87883.42675.690.75
5805,628.679,219,599.589.33438.76621.37676.030.30
6804,455.099,218,855.364.73891.40480.27672.052.66
7804,340.609,220,143.4347.841487.547.29670.081.85
8806,458.759,221,889.488.081360.2691.94666.000.96
9806,258.399,222,175.727.831660.2453.87666.000.72
10805,027.579,218,111.142.8027.39345.42683.871.13
Disclaimer/Publisher’s Note: The statements, opinions and data contained in all publications are solely those of the individual author(s) and contributor(s) and not of MDPI and/or the editor(s). MDPI and/or the editor(s) disclaim responsibility for any injury to people or property resulting from any ideas, methods, instructions or products referred to in the content.