Analysis of Spatial Distribution Characteristics of Non-Point Source Pollution in Liaoning Province
Abstract
:1. Introduction
2. Research Methods
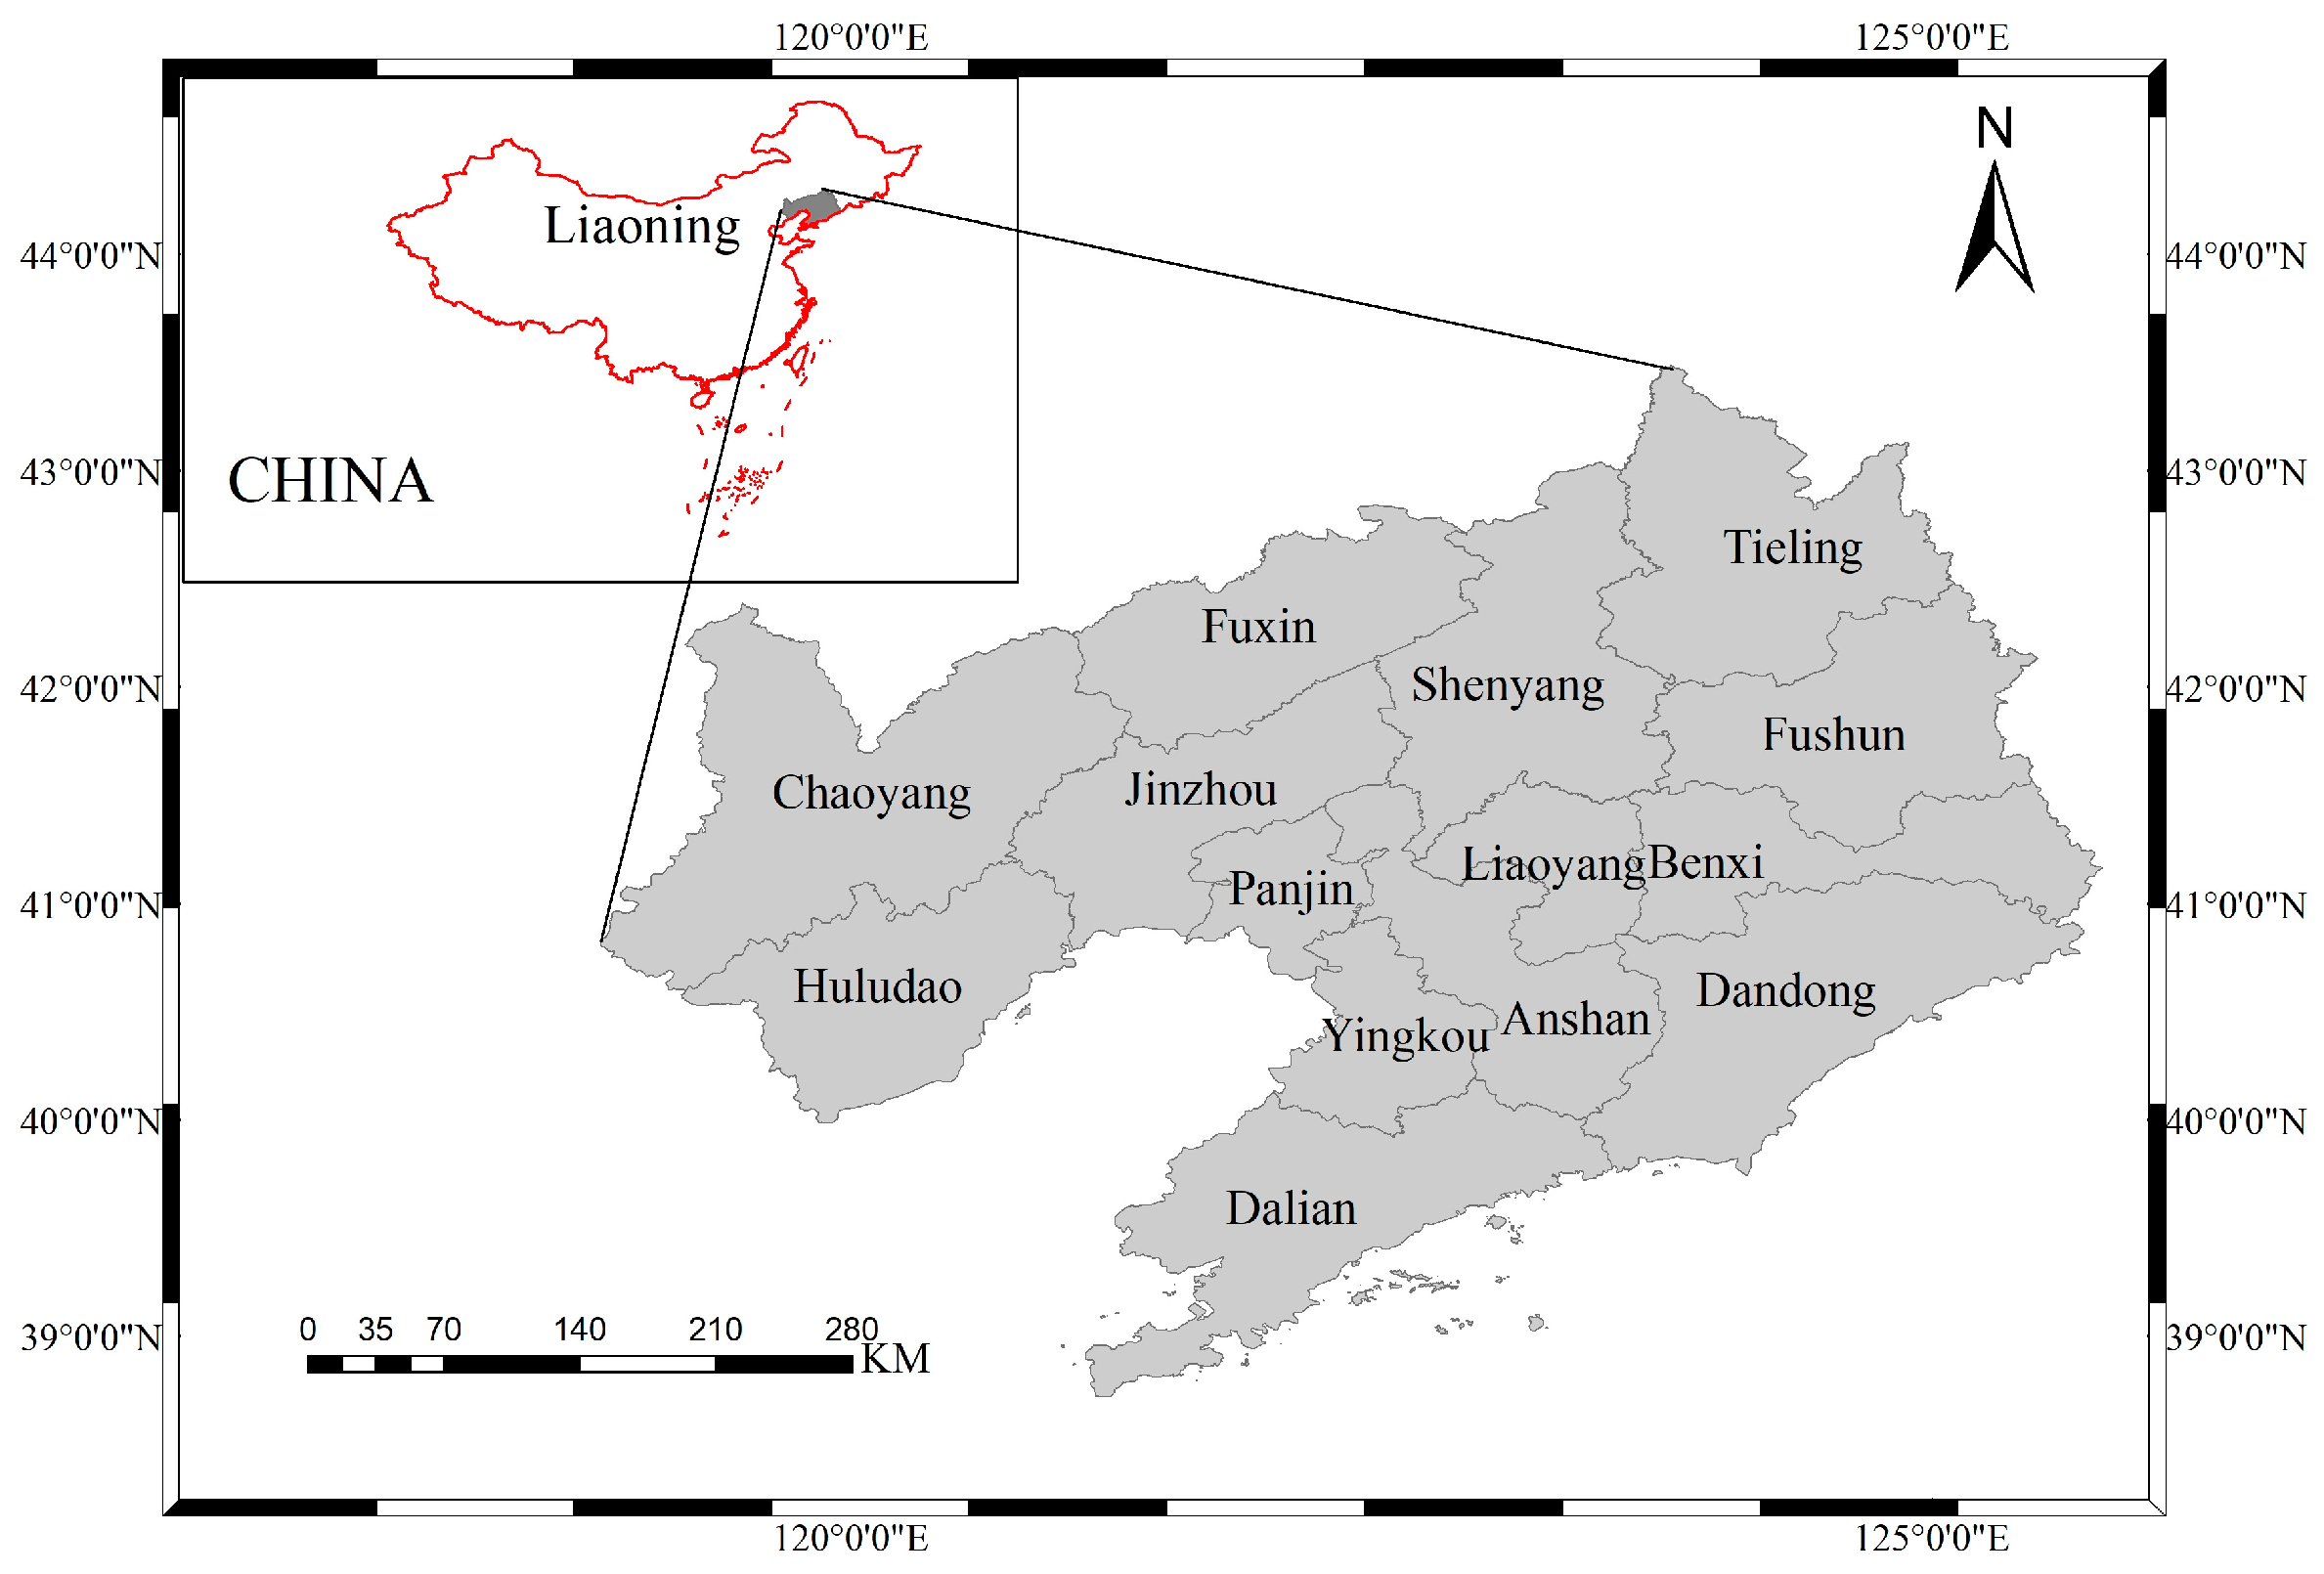
2.1. Overview of the Research Area
2.2. Method for Estimating Pollution Load
- (1)
- Agricultural land
- (2)
- Livestock and poultry farming
- (3)
- Aquaculture
- (4)
- Rural life
2.3. Pollution Level Evaluation Method
2.3.1. Unit Area Pollution Load Coefficient Method
2.3.2. Equal Standard Pollution Load Index Method
2.4. Data Sources
3. Results and Discussion
3.1. Characteristics of Non-Point Source Pollution in Each City of Liaoning Province
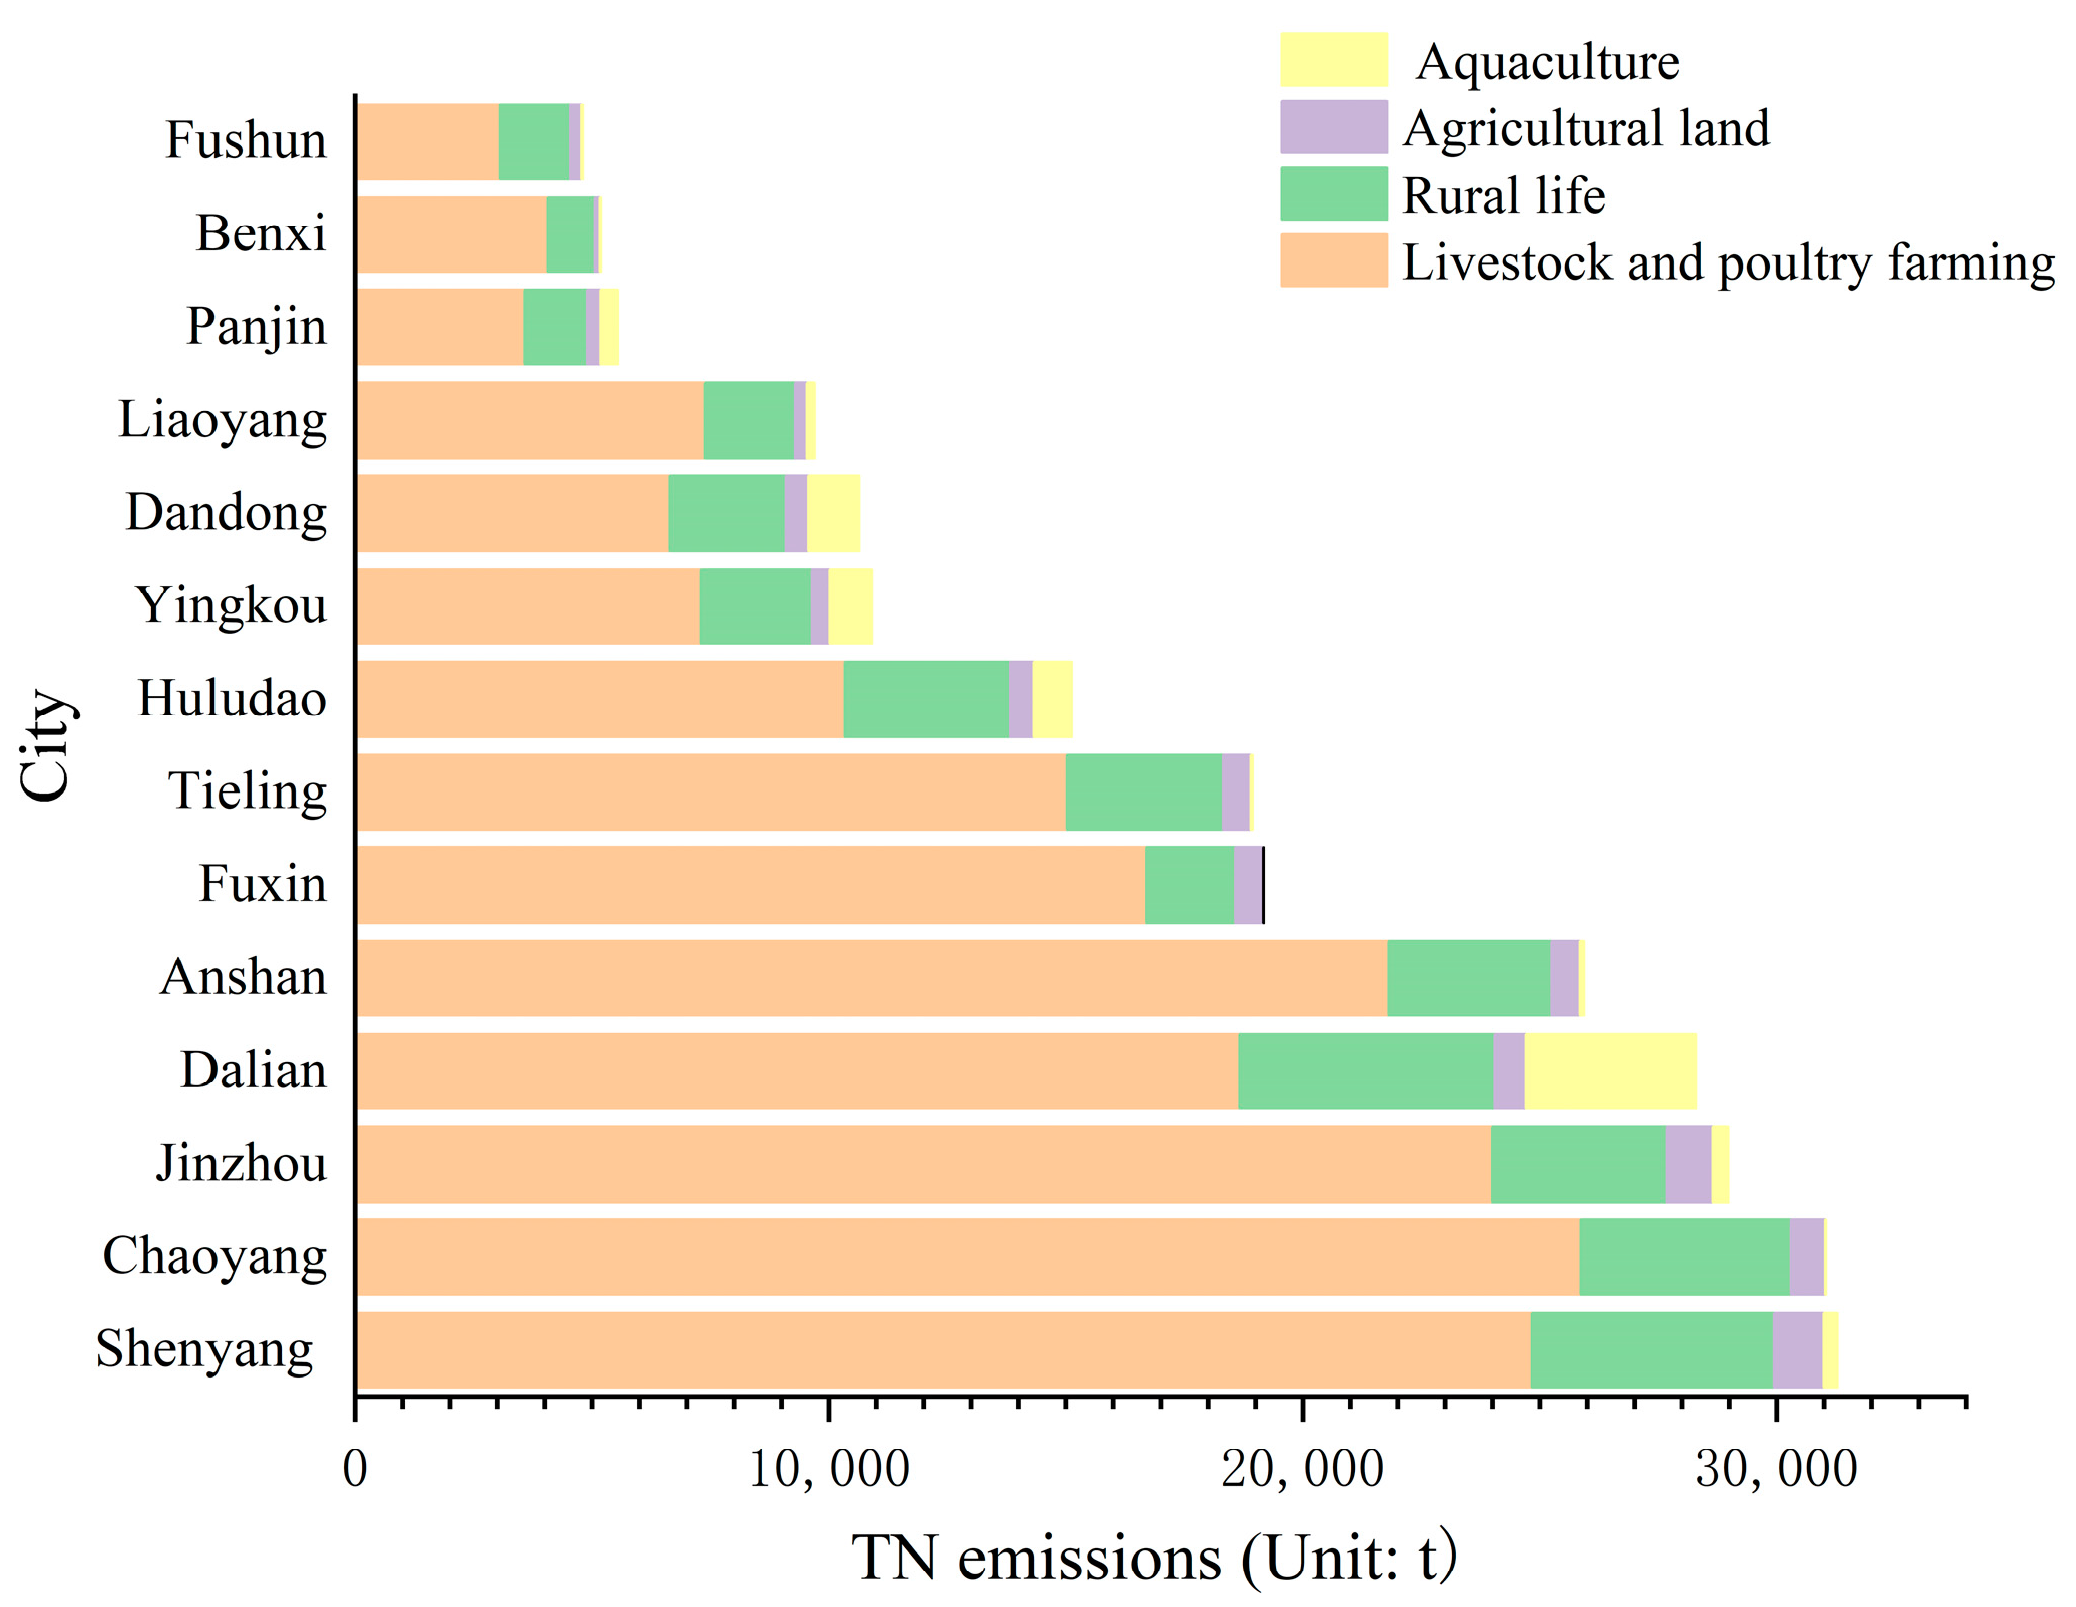
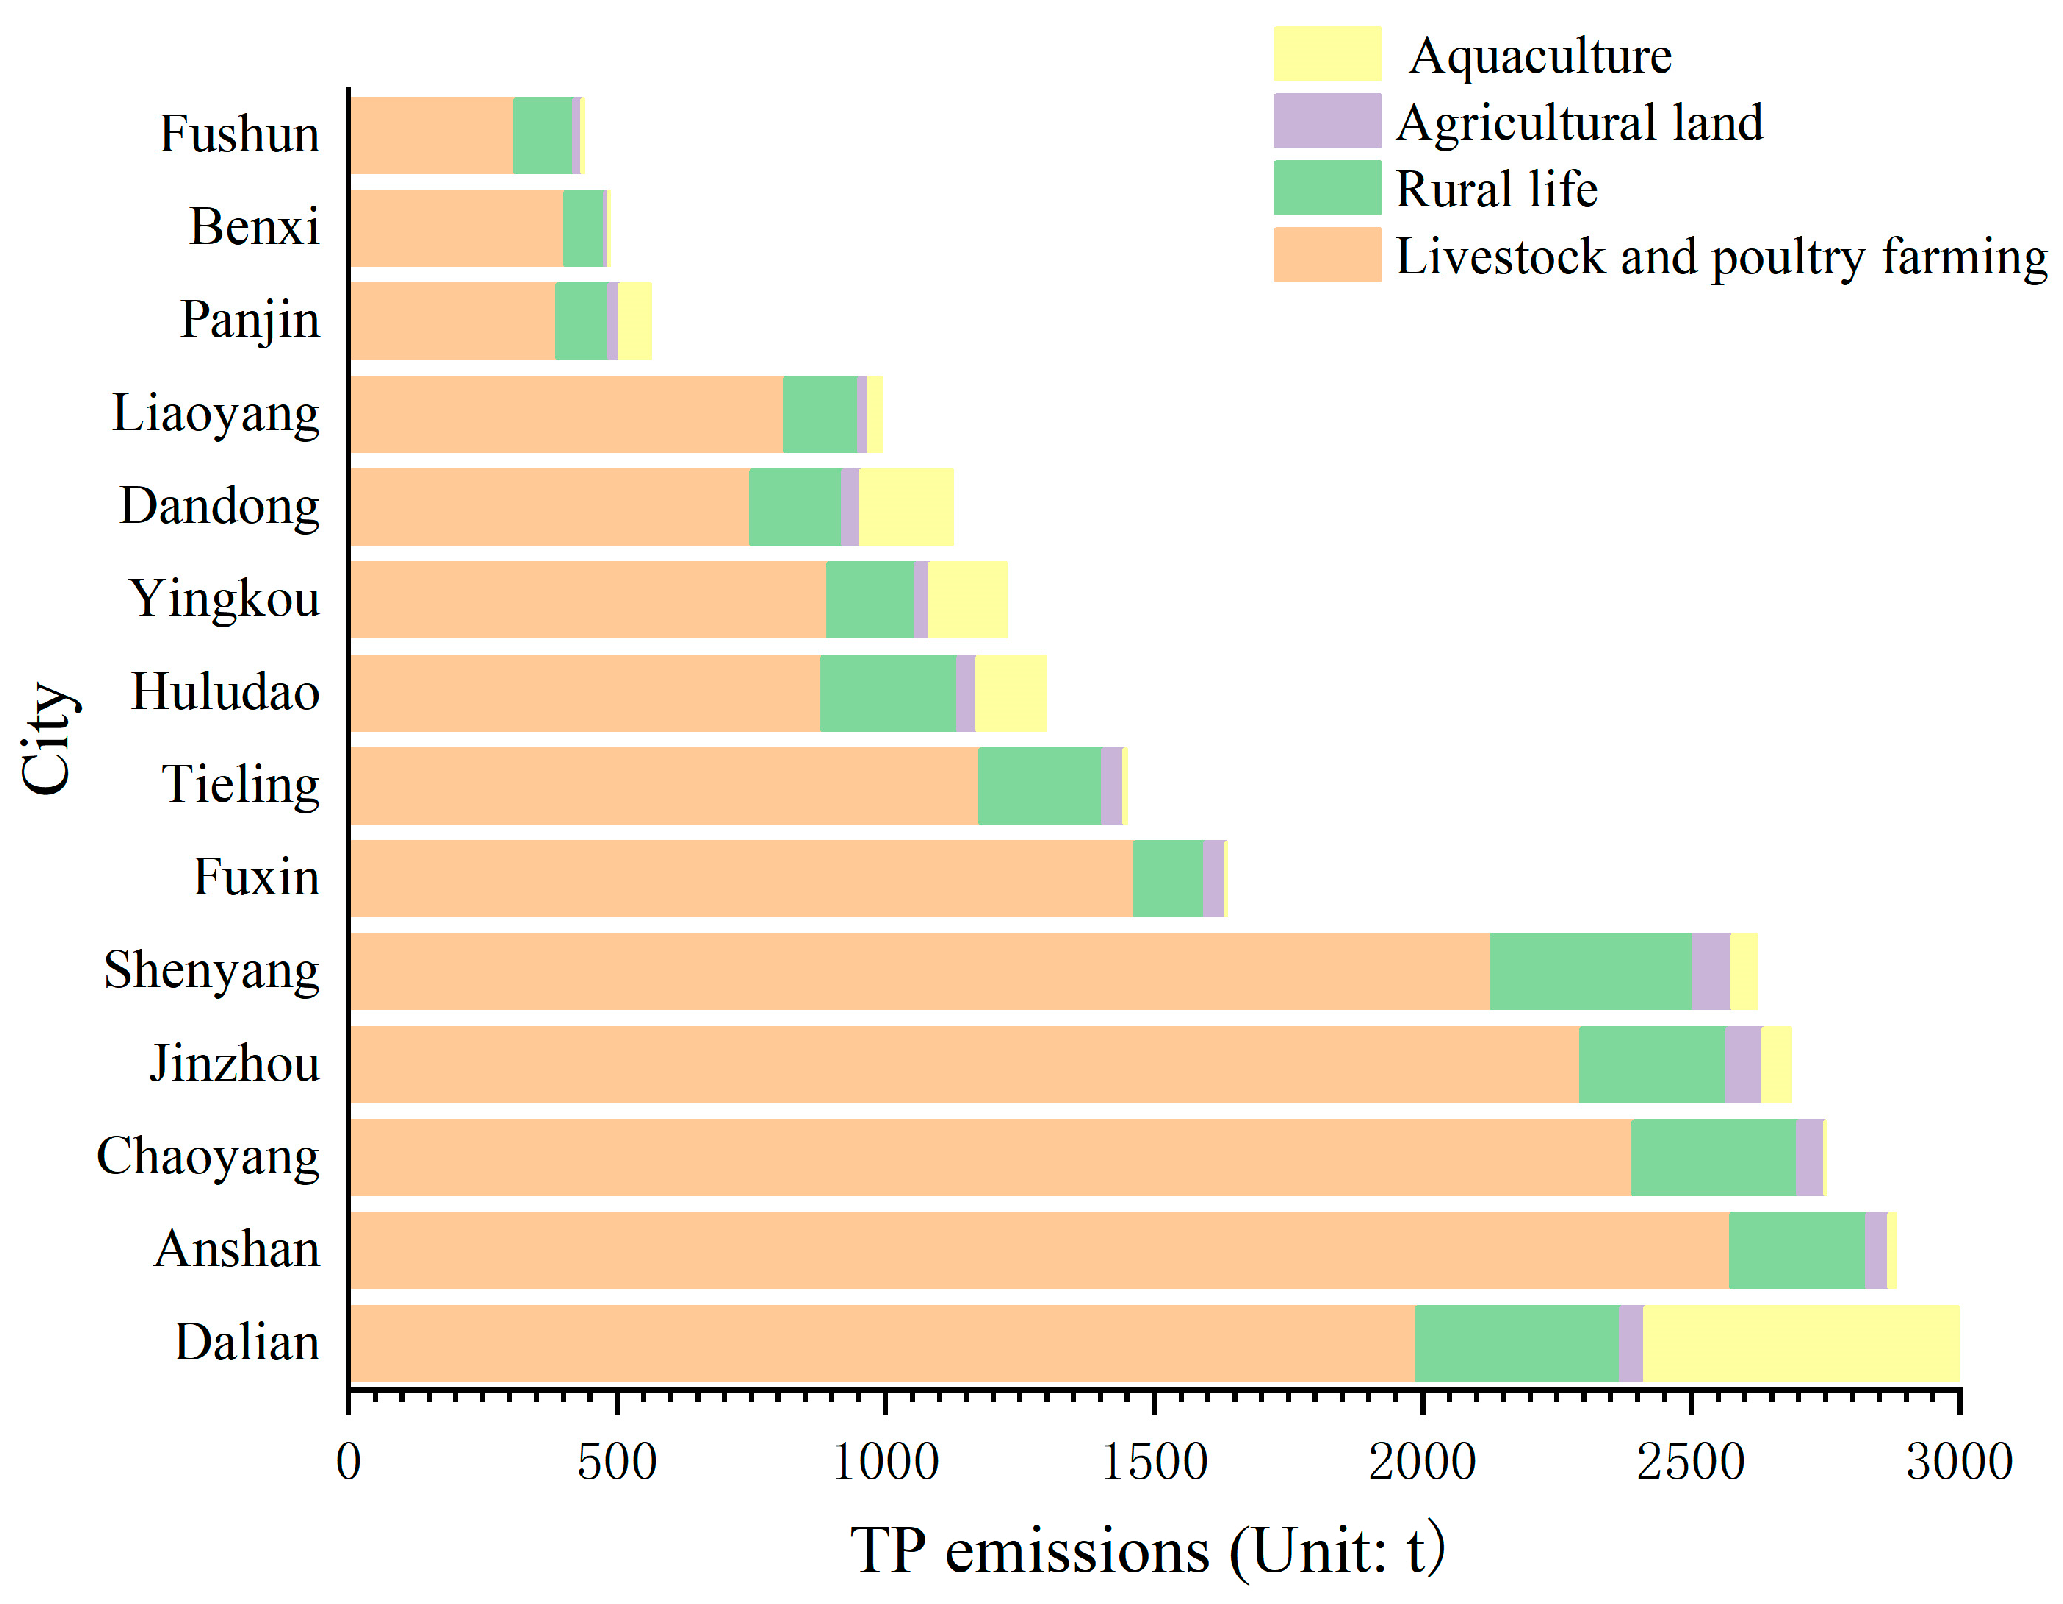
3.1.1. TN and TP Emissions in Each City
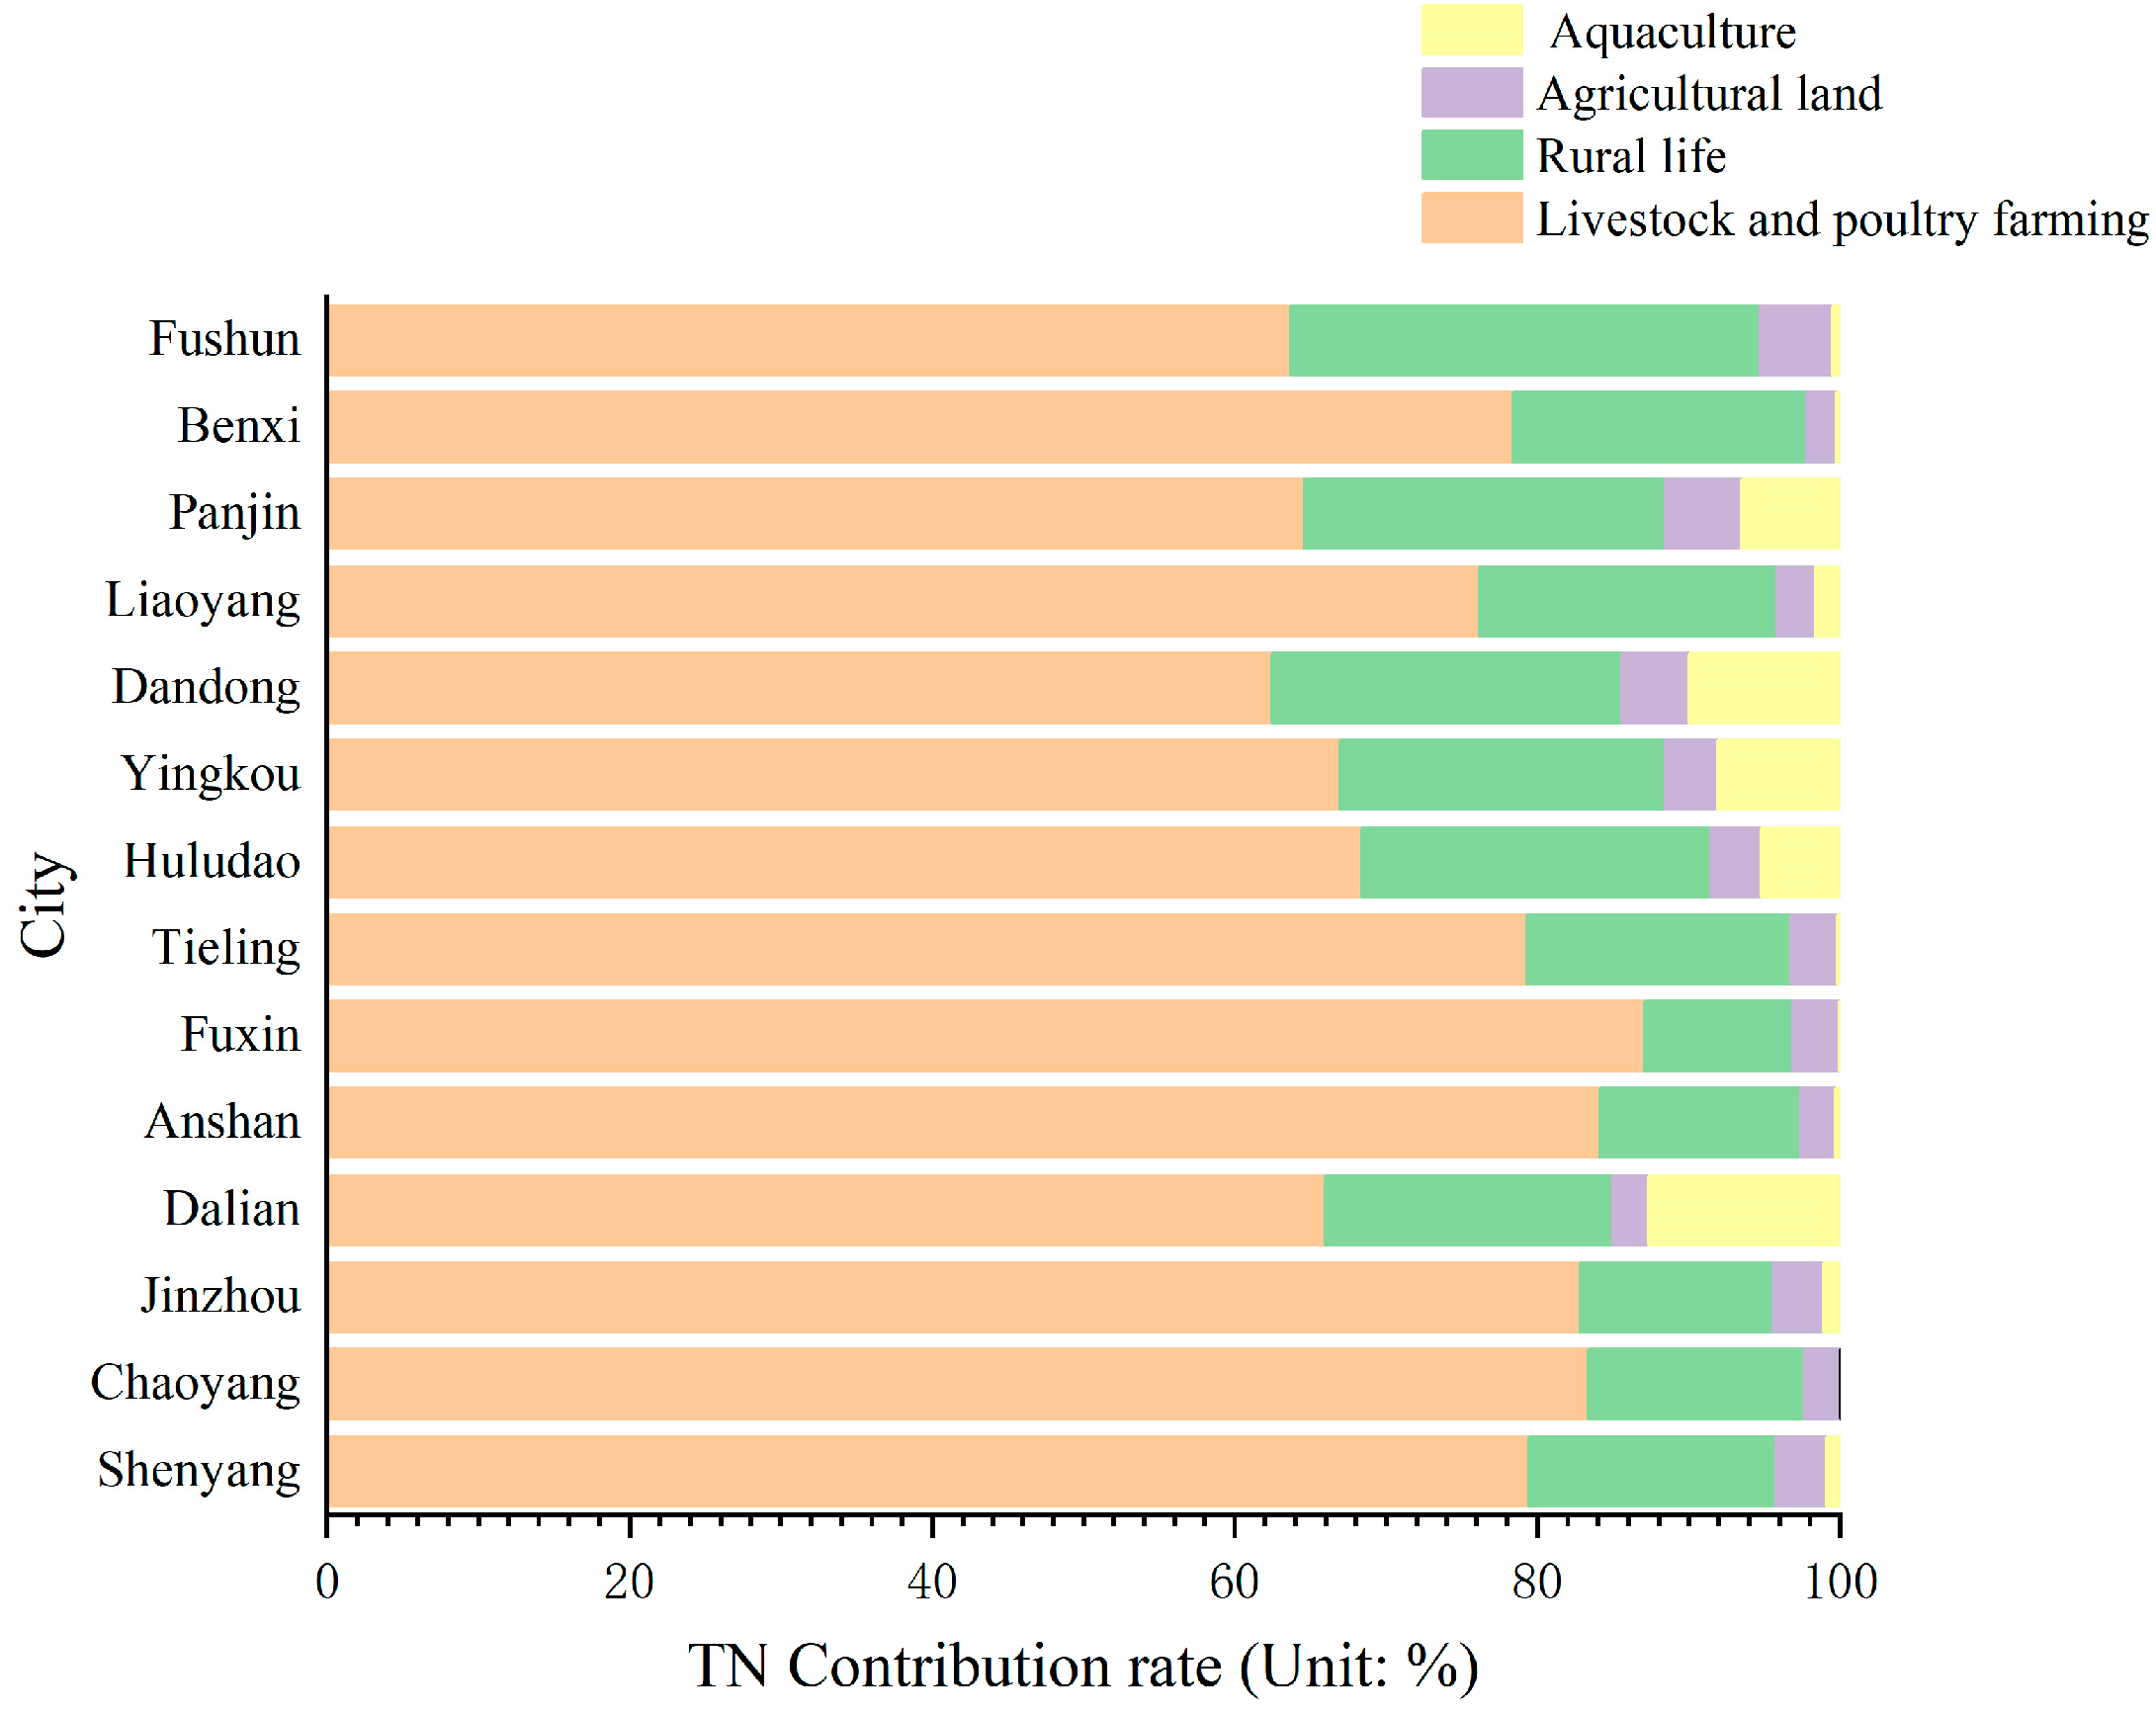
3.1.2. Contribution of Different Pollution Source Types to TN and TP Emissions
3.2. Pollution Level Analysis
3.2.1. Analysis of Pollution Load Coefficient per Unit Area
3.2.2. Analysis of Equal Standard Pollution Load Index
4. Conclusions
- (1)
- The TN and TP emissions in Liaoning Province in 2019 were 245.6 thousand t and 23.2 thousand t, respectively. The corresponding equivalent pollution loads were 245.515 billion m3 and 115.754 billion m3, respectively. TN is the main source of non-point source pollution in Liaoning Province. The five cities with the highest contribution rate of pollutant load are Shenyang, Chaoyang, Jinzhou, Dalian and Anshan. The emissions of TN and TP from non-point sources are directly related to the level of local agricultural development level.
- (2)
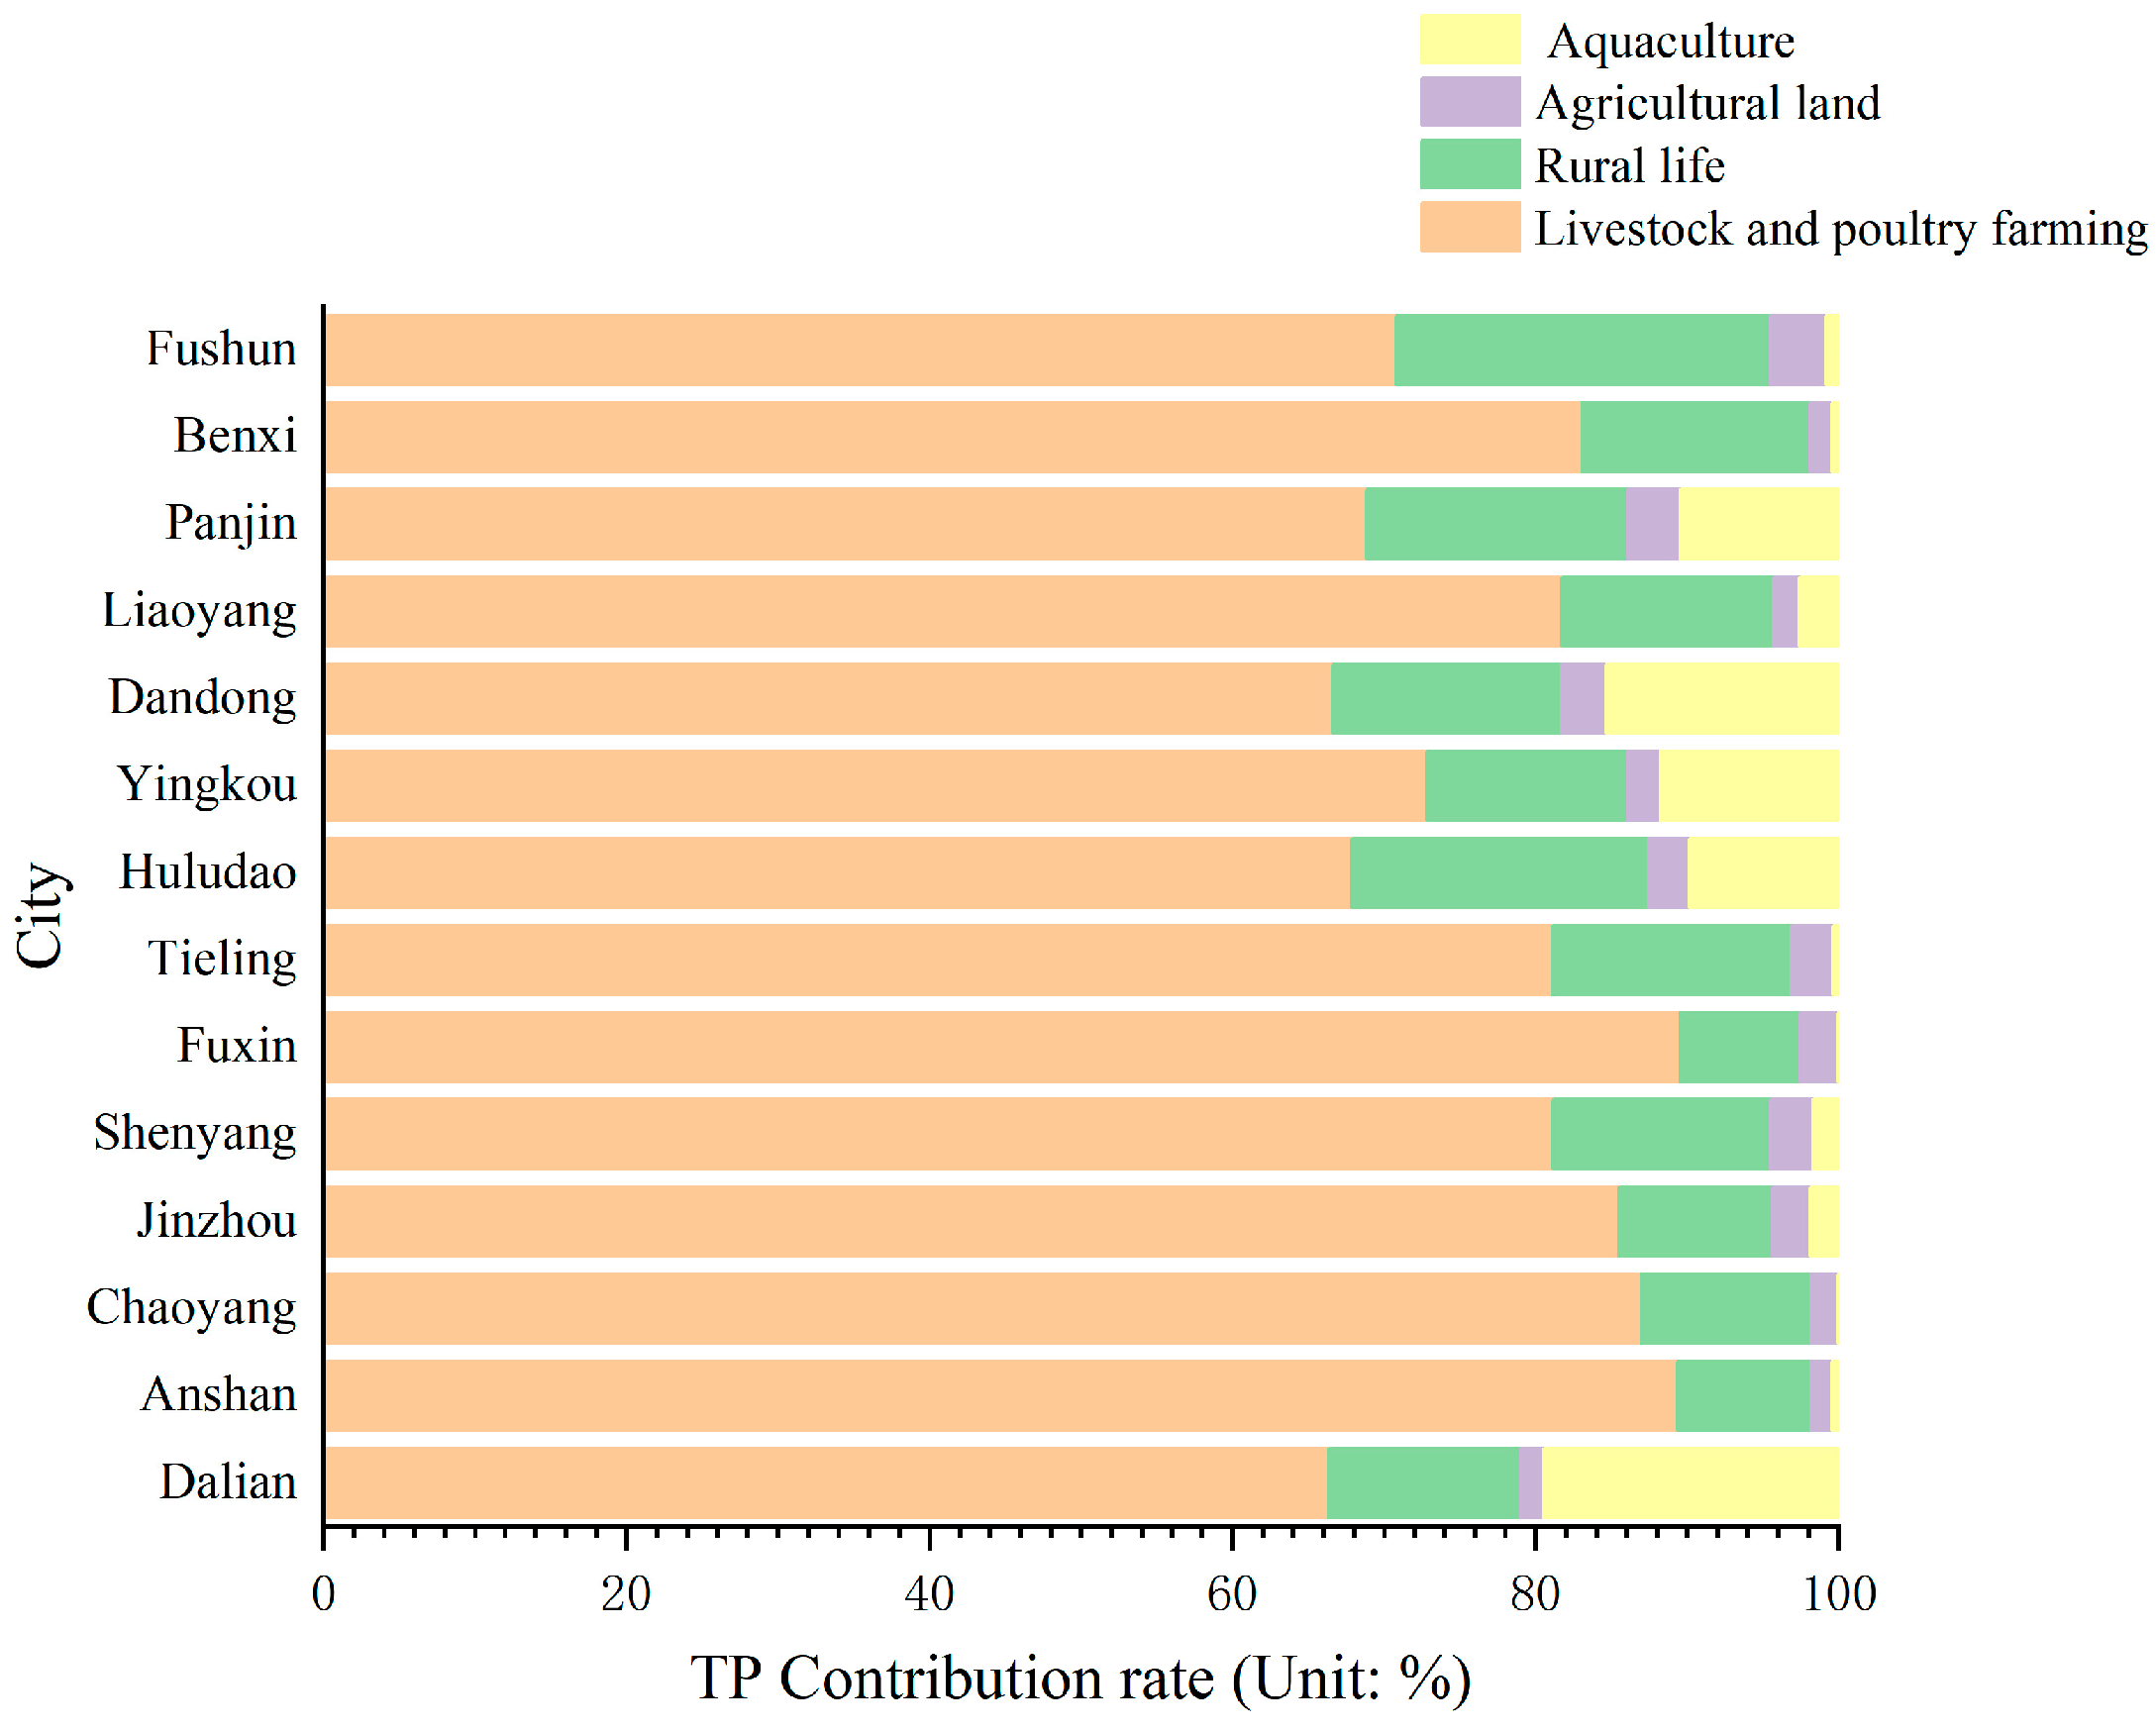
- The order of contribution rates of the four types of pollution sources to TN in Liaoning Province is livestock and poultry farming (77.11%) > rural life (16.81%) > aquaculture (3.08%) > agricultural land (3.00%). The order of contribution rates to TP is also livestock and poultry farming (79.71%) > rural life (12.74%) > aquaculture (5.34%) > agricultural land (2.21%). It can be seen that the contribution rate of livestock and poultry breeding to surface source pollution is much higher than the other three types of pollution sources.
- (3)
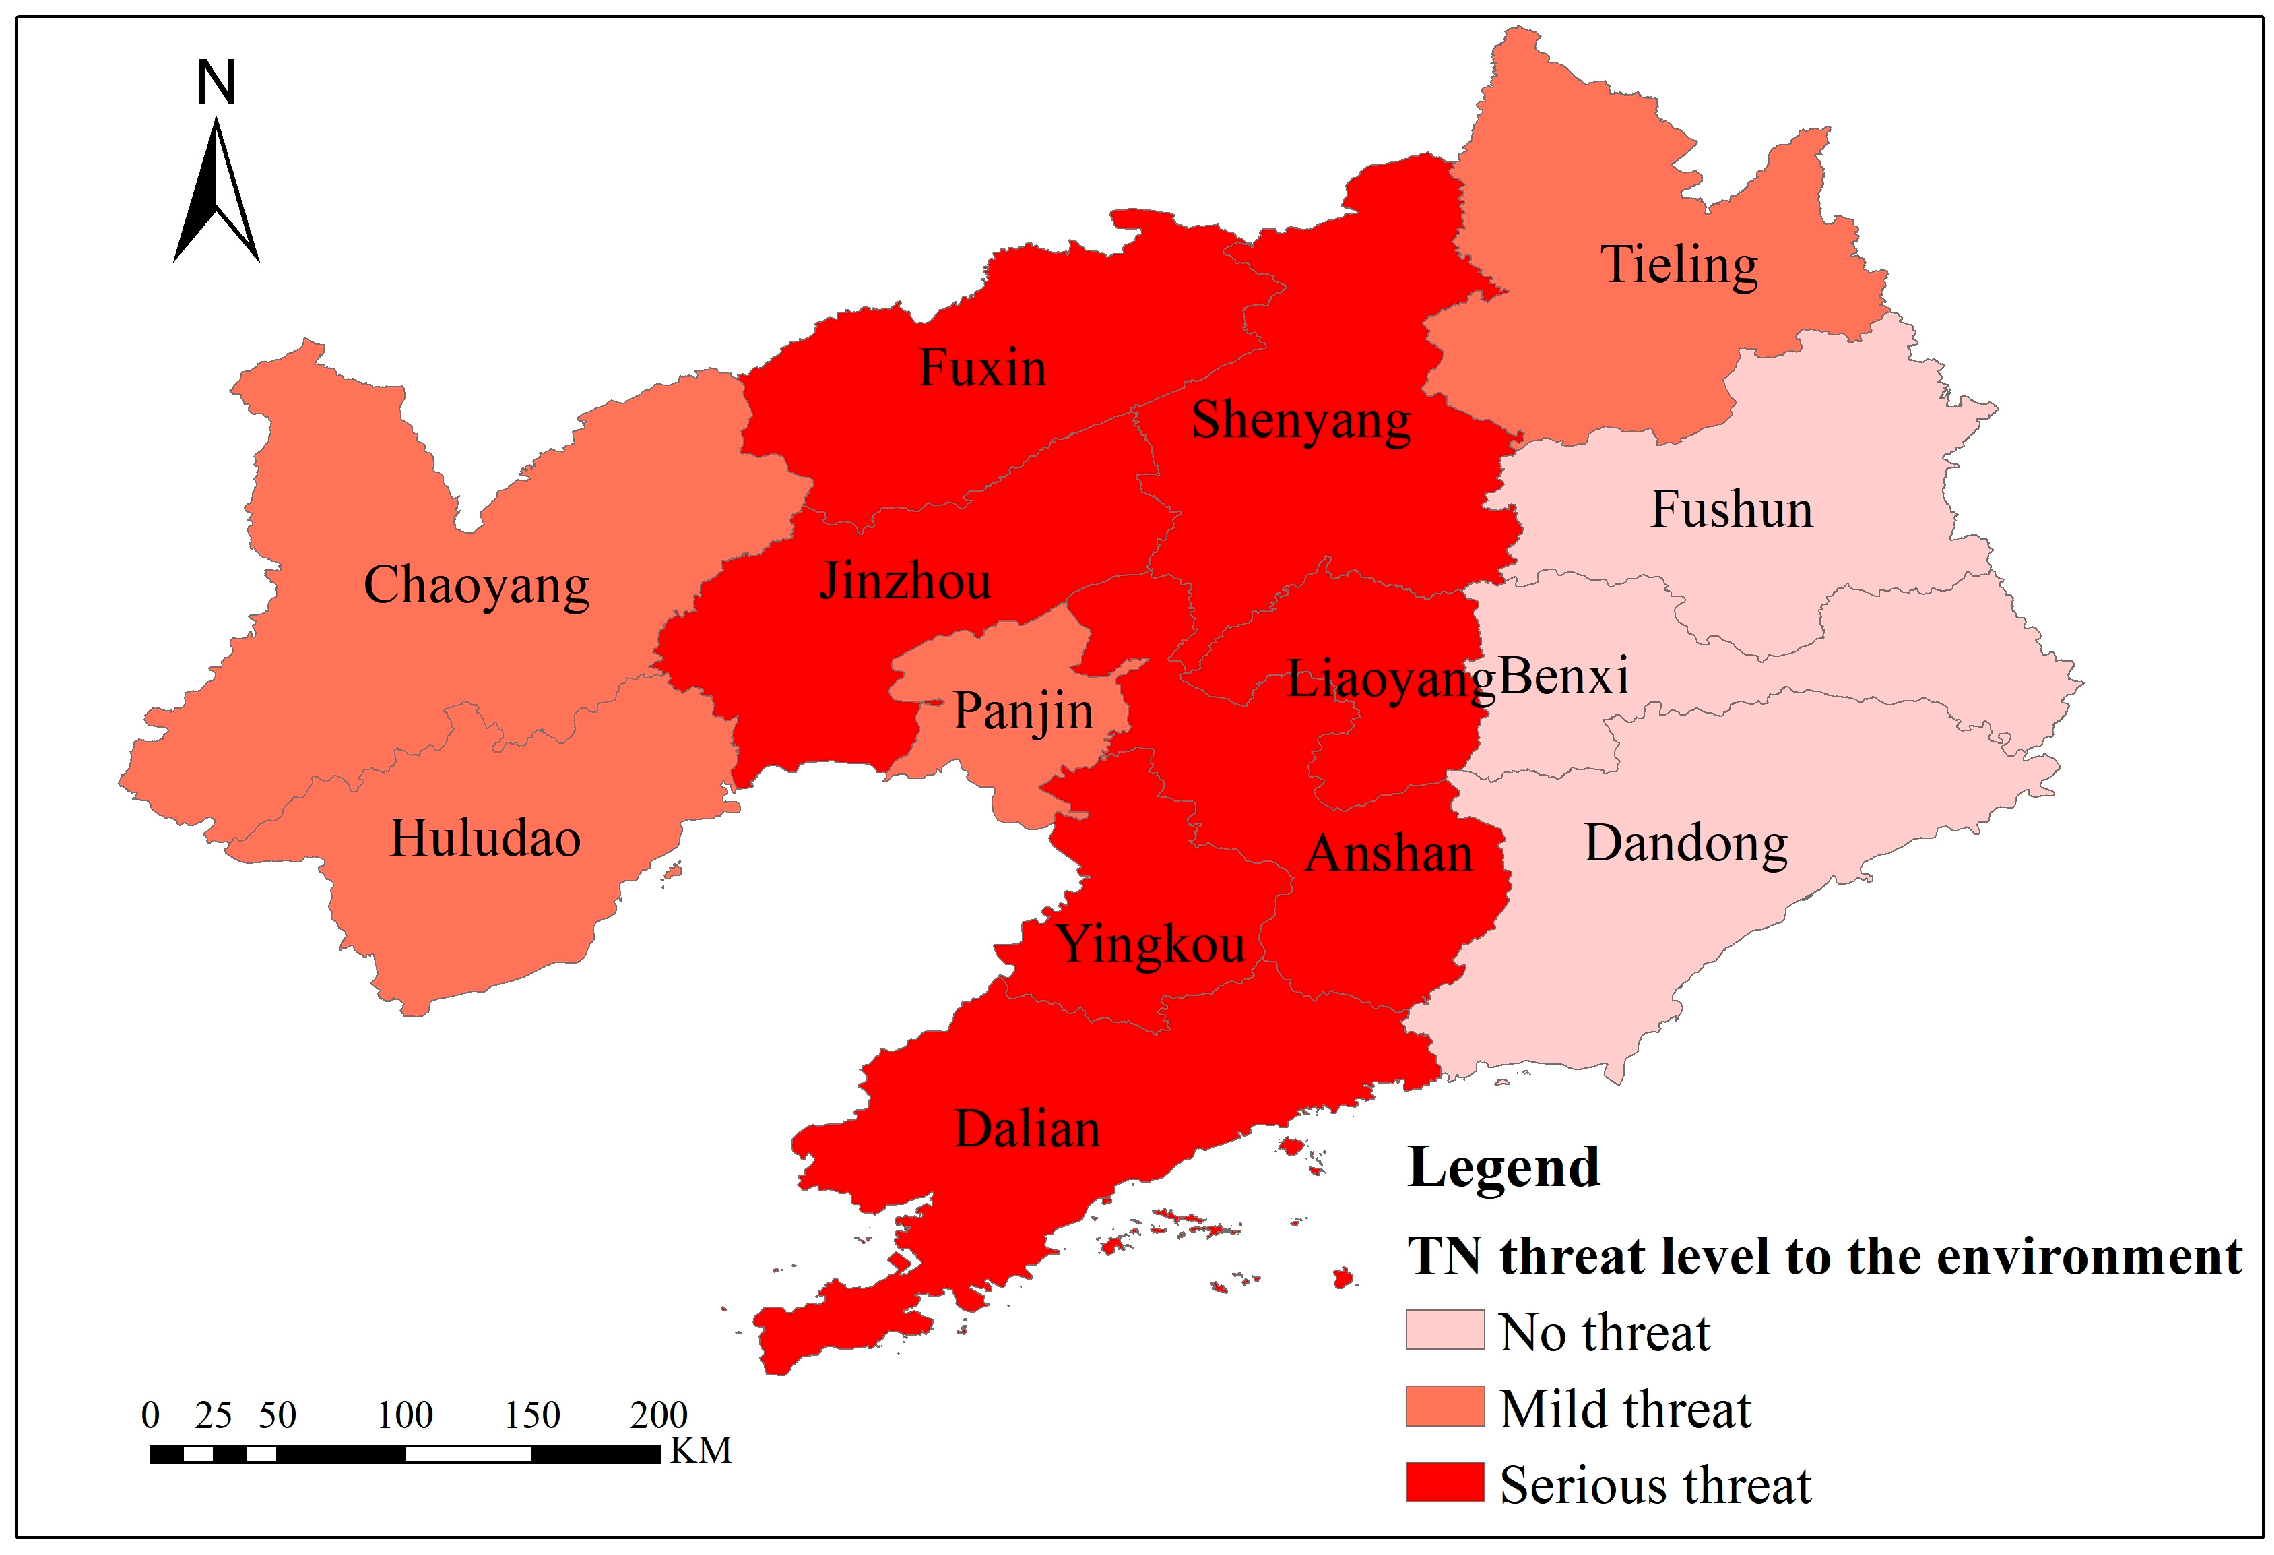
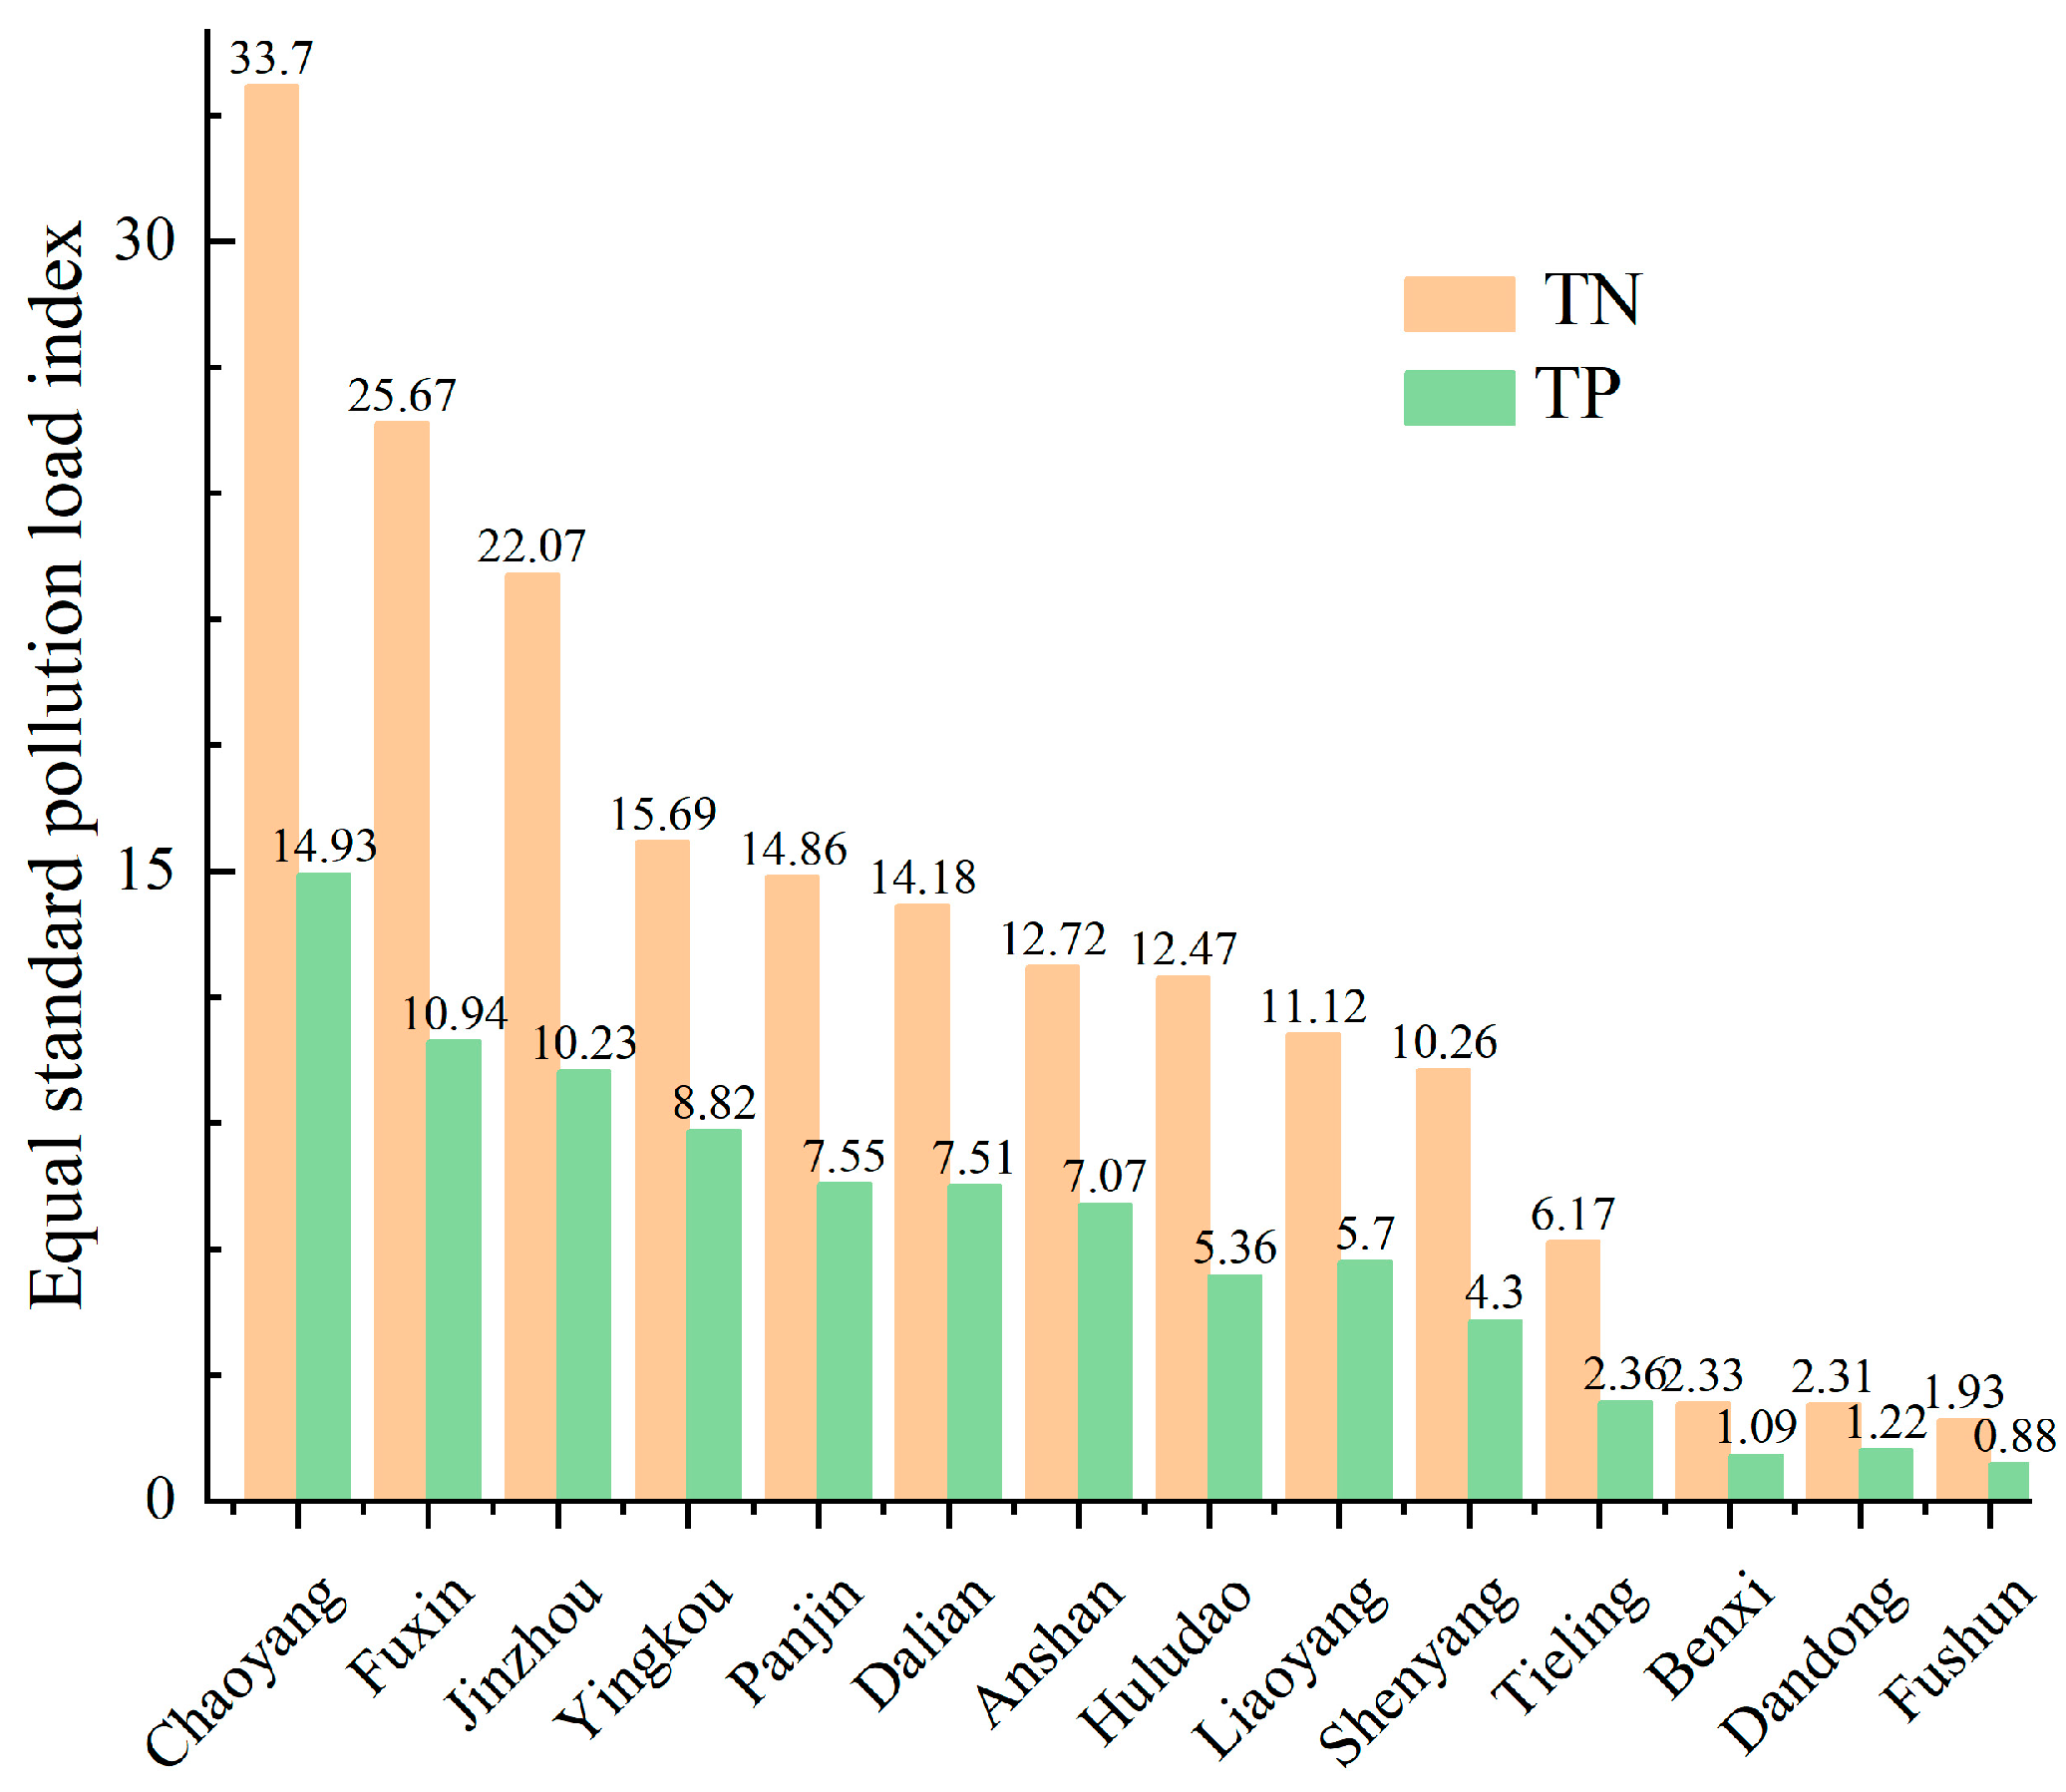
- Except for Fuxin, the spatial distribution of TN and TP threat levels to the environment in other cities is basically consistent. Overall, pollution in the central and western regions is more serious than that in the eastern regions, while pollution in the plain areas is worse than that in the mountainous and hilly areas. Comparing the relative pollution levels of each city, Chaoyang City should be a key focus for the prevention and control of non-point source pollution in Liaoning Province, and the abundant total water resources play a crucial role in reducing pollution levels.
- (4)
- Due to the large study area, we used estimation methods to calculate the non-point source pollution load. In the estimation process, we inevitably ignore some factors. This study overlooked factors that affect the concentration of pollutants in drainage, such as soil type, the amount of leached water, and the fate of pollutants during their migration in the soil. These may have a small impact on the non-point source pollution load, but it is difficult to affect the spatial distribution results of non-point source pollutants in Liaoning Province. In subsequent studies, more accurate methods may be explored for estimation. In addition, due to our lack of long-term monitoring data, we are unable to verify our results through traditional monitoring methods. However, due to the widespread application of this method, we believe that the results are reliable. In future studies, we will add traditional monitoring methods to a small part of the study area to achieve the support of long-term data series.
- (5)
- The results of this study provide a scientific decision-making basis for the prevention and control of non-point source pollution in Liaoning Province. The impact of the terrain and total water resources of each city on surface water pollution is difficult to amend via human intervention, but the impact can be reduced by optimizing the treatment of livestock and poultry manure. Therefore, improving the management level of the livestock and poultry breeding industry is the key to the current control of non-point source pollution in Liaoning Province.
Author Contributions
Funding
Data Availability Statement
Acknowledgments
Conflicts of Interest
References
- Xiang, C.; Wang, Y.; Liu, H.A. Scientometrics review on nonpoint source pollution research. Ecol. Eng. 2017, 99, 400–408. [Google Scholar] [CrossRef]
- Bulletin of the Second National Pollution Source Census Environmental Protection. Available online: https://www.mee.gov.cn/home/ztbd/rdzl/wrypc/zlxz/202006/t20200616_784745.html (accessed on 18 May 2021).
- Li, X.; Shang, J. Spatial interaction effects on the relationship between agricultural economic and planting non-point source pollution in China. Environ. Sci. Pollut. Res. 2023, 30, 51607–51623. [Google Scholar] [CrossRef] [PubMed]
- Hou, L.; Zhou, Z.Y.; Wang, R.Y.; Li, J.X.; Dong, F.; Liu, J.Q. Research on the Non-Point Source Pollution Characteristics of Important Drinking Water Sources. Water 2022, 14, 211. [Google Scholar] [CrossRef]
- World Publishing Corporation. Environmental Pollution and Control; World Publishing Corporation: Cleveland, OH, USA, 2003; ISBN 9787519224592. [Google Scholar]
- Lam, Q.D.; Schmalz, B.; Fohrer, N. Assessing the spatial and temporal variations of water quality in lowland areas, Northern Germany. J. Hydrol. 2012, 438–439, 137–147. [Google Scholar] [CrossRef]
- Tu, H.Z.; Hou, Y.; Chen, W.P. Simulation of non-point source pollution in Weizigou watershed with AnnAGNPS model. J. Agro-Environ. Sci. 2017, 36, 1345–1352. [Google Scholar]
- Yang, Y.F. Simulation of Non-Point Source Pollution in Yixing Plain River Network Based on HSPF Model. Master’s Thesis, Xi’an University of Architecture and Technology, Xi’an, China, 2015. [Google Scholar]
- Zhao, L. Analysis of Estimation of Water Environmental Non point Source Pollution Load. Environ. Devel. 2018, 30, 57+59. [Google Scholar]
- Li, S.; Li, J.k.; Hao, G.R. Estimation and Assessment of Non Point source pollution Load in Danhan River Basin, Shaanxi Province. Environ. Sci. Technol. 2020, 43, 243–249. [Google Scholar]
- Zhang, C.L.; Liu, Z.S.; Zhang, G.C. Research on Agricultural Non point Source Ammonia Nitrogen Load in Henan Province Based on Output Coefficient Method. China Rural. Water Resour. Hydropower 2017, 420, 35–39. [Google Scholar]
- Liu, L.X.; Ao, T.Q.; Hu, Z.; Hu, F.C.; Li, M.R. Comprehensive evaluation of water quality and non-point source pollution in the Qiongjiang River Basin (Anju section). Int. Soil Water Conserv. 2019, 26, 372–376. [Google Scholar]
- Li, X.L.; Ao, T.Q. Research and comprehensive assessment of agricultural non-point source pollution load in river basins lacking data. Renmin Changjiang River 2016, 47, 6–11. [Google Scholar]
- Dai, W. Measurement and characteristic analysis of agricultural non-point source pollution in Beidaihe and adjacent coastal waters. J. Henan Agric. Sci. 2013, 42, 58–61. [Google Scholar]
- Chen, W.Q.; Yang, Q.B.; Yang, B. Calculation of total phosphorus emissions in Poyang lakeside area based on the production and discharge coefficient method. Environl. Poll. Control 2022, 44, 960–965. [Google Scholar]
- Xie, J.Z.; Zhao, X.L.; He, B.H.; Li, Z.A. Analysis on the characteristics of nitrogen and phosphorus emissions from agricultural non-point source pollution in the Hanfeng Lake Basin. Chin. J. Environ. Sci. 2019, 40, 1760–1769. [Google Scholar]
- Shi, X.C.; Ao, T.Q.; Li, X.D.; Wang, W.Z.; Yang, W. Comprehensive evalution on the non-point source pollution of Fujiang Basin (Shehong Territory). Res. Soil Water Conserv. 2018, 25, 375–379. [Google Scholar]
- Ma, G.W.; Wang, S.R.; Wang, Y.Y.; Zuo, D.P.; Yu, Y.; Xiang, B. Temporal and spatial distribution characteristics of nitrogen and phosphorus and diffuse source pollution load simulation of Poyang Lake Basin. Acta Sci. Circumst. 2015, 35, 1285–1291. [Google Scholar]
- Li, J.K.; Li, H.E.; Dong, W.; Qin, Y.M.; Huang, C.J.; Du, G.F. Monitoring and load estimation of non-point source pollution on typical tributaries in the Guanzhong reach of the Weihe River. Acta Sci. Circumst. 2011, 31, 1470–1478. [Google Scholar]
- Wang, L.; Xiang, B.; Su, B.Y.; Wang, Y.; Fang, G.L.; Hu, Y.; Pan, L.B.; Dai, X. Spatial-temporal variation of agricultural non-point source pollution risk in Beijing-Tianjin Hebei Region, China. J. Agro-Environ. Sci. 2017, 36, 1254–1265. [Google Scholar]
- Hu, J.F. Measurement and spatial feature analysis of agricultural non-point source pollution in Chongqing. Chin. J. Agric. Resour. Reg. Plan. 2017, 38, 135–144. [Google Scholar]
- Yang, Y.J. Research on Pressure Assessment and Treatment Approaches of Agricultural Non point Source Pollution in Liaoning Province. Master’s Thesis, Dalian Maritime University, Dalian, China, 2014. [Google Scholar]
- Zhao, J.R.; Zhao, W.; Zhan, X.H.; Chen, X.M.; Wei, D.Y.; Ma, N.; Sun, M.; Liu, J.H.; Xu, Y. Analysis of the Characteristics of Nitrogen and Phosphorus Emissions from Agricultural Non-Point Sources Pollution and Pollution Risk in Tianjin City, China. IOP Conf. Ser. Earth Environ. Sci. 2020, 440, 042057. [Google Scholar] [CrossRef]
- Zhao, L.H. Analysis on Spatio-Temporal Characteristics and Economic Driving Factors of Agricultural Non-Point Source Pollution in Zhejiang Province. Master’s Thesis, Zhejiang Gongshang University, Hangzhou, China, 2015. [Google Scholar]
- Lin, Y.; Ma, J.; Qin, F. Distribution and Development Prospects of Livestock and Poultry Manure Resources in China. Chin. Agric. Sci. Bull. 2012, 28, 1–5. [Google Scholar]
- Qin, T. Environmental Decentralization, Environmental Regulation and Agricultural Non-Point Source Pollution. Master’s Thesis, Southwest University, Chongqing, China, 2020. [Google Scholar]
- Yang, Q.; Wang, H.R.; Qin, F. Regional differences and distribution dynamics of agricultural non-point source pollution in China: 2001–2015. J. Shandong Financ. Econ. Univ. 2017, 29, 1–13. [Google Scholar]
- Zhang, J.Z. Analysis of Regional Differences and Influencing Factors of Agricultural Non-Point Source Pollution in China. Master’s Thesis, Yunnan University of Finance and Economics, Kunming, China, 2019. [Google Scholar]
- Gong, S.F.; Ding, W.H.; Ju, X.H.; Xiao, N.W.; Ye, Q.S.; Huang, J.; Li, H. Analysis and control strategy of non-point source pollution sources in typical agricultural small watershed-Taking Danjiangkou water conservation area as an example. Sci. Agric. Sin. 2021, 54, 3919–3931. [Google Scholar]
- GB3838-2002; National Standards of the People’s Republic of China, Environmental Quality Standards for Surface Water. State Environmental Protection Administration: Beijing, China, 2002.
- Wang, S.R.; Yang, D.W.; Sun, J.H.; Tang, L.H.; Wang, P.J.; Lu, S.Y. Analysis of the Current Situation and Characteristics of Agricultural Non point Source Pollution in China. Water Resour. Prot. 2021, 37, 140–147+172. [Google Scholar]

| Coefficient | Pig Manure | Pig Urine | Cow Manure | Cow Urine | Sheep Manure | Poultry Manure |
|---|---|---|---|---|---|---|
| Daily discharge coefficient (kg/day) | 2.00 | 3.30 | 20.0 | 10.00 | 2.60 | 0.125 |
| Average content of TN in feces and urine (kg/t) | 52.00 | 9.00 | 31.00 | 6.00 | 4.63 | 45.650 |
| Average content of TP in feces and urine (kg/t) | 3.41 | 0.52 | 1.18 | 0.40 | 2.60 | 5.790 |
| Loss coefficient of feces and urine (%) | 2 | 25 | 2 | 25 | 2 | 9 |
| City Category | Municipal Level Units Included | TN | TP |
|---|---|---|---|
| Class I | Dalian | 5.75 | 0.405 |
| Class II | Shenyang, Anshan, Jinzhou, Panjin | 5.30 | 0.390 |
| Class III | Fushun, Benxi, Liaoyang, Huludao | 4.95 | 0.360 |
| Class IV | Dandong, Yingkou, Fuxin, Tieling, Chaoyang | 4.70 | 0.325 |
Disclaimer/Publisher’s Note: The statements, opinions and data contained in all publications are solely those of the individual author(s) and contributor(s) and not of MDPI and/or the editor(s). MDPI and/or the editor(s) disclaim responsibility for any injury to people or property resulting from any ideas, methods, instructions or products referred to in the content. |
© 2023 by the authors. Licensee MDPI, Basel, Switzerland. This article is an open access article distributed under the terms and conditions of the Creative Commons Attribution (CC BY) license (https://creativecommons.org/licenses/by/4.0/).
Share and Cite
Yan, B.; Cao, Q.; Yan, S.; Gao, Z.; Liu, D.; Li, Y. Analysis of Spatial Distribution Characteristics of Non-Point Source Pollution in Liaoning Province. Water 2023, 15, 3014. https://doi.org/10.3390/w15163014
Yan B, Cao Q, Yan S, Gao Z, Liu D, Li Y. Analysis of Spatial Distribution Characteristics of Non-Point Source Pollution in Liaoning Province. Water. 2023; 15(16):3014. https://doi.org/10.3390/w15163014
Chicago/Turabian StyleYan, Bin, Qi Cao, Shengli Yan, Zhenwei Gao, Dehui Liu, and Yuyuan Li. 2023. "Analysis of Spatial Distribution Characteristics of Non-Point Source Pollution in Liaoning Province" Water 15, no. 16: 3014. https://doi.org/10.3390/w15163014


