Article

Risk Assessment of Sudden Water Pollution Accidents Associated with Dangerous Goods Transportation on the Cross-Tributary Bridges of Baiyangdian Lake

1
Key Laboratory for Water and Sediment Sciences of Ministry of Education, School of Environment, Beijing Normal University, Beijing 100875, China
2
State Key Laboratory of Water Environment Simulation, School of Environment, Beijing Normal University, Beijing 100875, China
*
Author to whom correspondence should be addressed.
These authors contributed equally to this work.
Water 2023, 15(16), 2993; https://doi.org/10.3390/w15162993
Submission received: 19 July 2023 / Revised: 10 August 2023 / Accepted: 17 August 2023 / Published: 19 August 2023
(This article belongs to the Section Water Quality and Contamination)

Abstract

:
The issue of sudden water pollution resulting from accidents is a challenging environmental problem to address. The frequency of transport accidents involving hazardous materials over tributary bridges is steadily rising due to rapid industrialization and urbanization processes. This trend poses a significant threat to both the water’s ecological environment and human well-being. To effectively mitigate the risks associated with water pollution caused by accidents during the transportation of dangerous goods, this research focused on Baiyangdian Lake, the largest freshwater lake in North China. Thid study employed the expert judgment fuzzy language method and Bayesian network model as analytical tools to assess and analyze the potential risks associated with sudden water pollution accidents caused by the transportation of hazardous materials on bridges spanning tributaries. Through an examination of the various risk factors involved, the research identified four primary indicators and ten secondary indicators. Additionally, an oil leakage accident scenario was simulated, and recommendations for risk prevention and control measures were provided. The findings of the study indicated that: (1) The likelihood of risk associated with driver factors, vehicle emergency factors, fuel tank emergency factors, road factors, and lighting factors is elevated. (2) The probability of a dangerous goods transportation accident occurring on the Baiyangdian cross-tributary bridge is substantial, thereby presenting a potential hazard to both the water environment and human health. (3) Vehicle emergency factors, vehicle wear factors, and weather factors exert a significant influence on the incidence of accidents. (4) The highest likelihood of accidents is associated with a combination of factors, including driver fatigue, vehicle and fuel tank deterioration, and adverse weather conditions. (5) In instances where the vehicle and fuel tank are well-maintained, the probability of accidents is greatest on the cross tributary bridge, particularly when the driver is fatigued, weather conditions are unfavorable, and there is a lack of street lighting during nighttime. Implementing emergency prevention and control measures proved to be an effective approach in mitigating the risk of sudden water pollution accidents. This study offers valuable insights into risk mitigation and management strategies for emergent water pollution incidents, and the framework presented herein can be readily applied to other rivers worldwide confronting comparable risk challenges.

1. Introduction

Sudden environmental risk refers to the leakage of environmental risk materials caused by accidents in industrial production and transportation processes [1]. A sudden water pollution incident is defined as an occurrence wherein a substantial quantity of pollutants is rapidly released into a water body as a result of human activities, natural calamities, or other unforeseen emergencies [2,3,4]. The pollutants involved in such incidents primarily encompass hazardous substances such as petroleum, heavy metals, and toxic organic compounds [5,6]. The emergence of sudden water pollution incidents presents an escalating and pressing menace to water ecology, environmental quality, and overall water security [7,8]. The unpredictability and uncertainty of sudden water pollution accidents are attributed to the challenges in determining the characteristics, quantity, leakage mode, and environmental impact capacity of pollutants during the incident, particularly in light of changes in hydrometeorological conditions [9,10]. It is noteworthy that the construction of bridges across tributaries in river network areas has experienced a substantial increase due to the rapid development of industrialization and the expansion of cities. Consequently, the proportion of cargo transport has consistently risen over the years. However, road transport remains a prevalent method for transporting dangerous goods [11], leading to a higher frequency of accidents involving the transportation of hazardous materials [12,13,14]. Consequently, these accidents contribute to the occurrence of frequent instances of sudden water pollution [14,15,16]. Therefore, vehicles utilized for the transportation of dangerous goods can be regarded as mobile hazard sources [17]. The occurrence of water pollution incidents resulting from traffic accidents and unforeseen circumstances presents a significant hazard to societal and economic progress, as well as human well-being [4,18]. Consequently, conducting a risk assessment of hazardous material transportation accidents leading to sudden water pollution is imperative in order to establish a foundation for appropriate emergency prevention and mitigation measures [19,20].
Research on the risk assessment of dangerous goods transportation started early and achieved many research advancements [21,22,23]. The American Chemical Company proposed an evaluation index method for fire explosions in 1964 [24]. Previous scholars initially focused on qualitative descriptions of the damage caused by sudden water pollution, but now, research emphasis has shifted to establishing an index system and assessment model to quantify the degree of risk [18]. Hou et al. [2] employed the Monte Carlo method to quantify the likelihood of water pollution. Additionally, they incorporated expert experience judgment and the risk matrix method to ascertain the level of risk associated with water pollution. Tang et al. [25] utilized a Bayesian network model to assess the probability of water pollution risks. Furthermore, they proposed a comprehensive risk prediction model based on the integration of the Bayesian network and water quality models. Stojanovic et al. [17] examined the underlying factors contributing to traffic accidents during the transportation of hazardous materials. Additionally, the authors conducted an analysis on the resultant environmental impact of such accidents and proposed measures to prevent them and mitigate their consequences. Ren et al. [26] assessed the risk associated with managing environmental pollution accidents in water quality emergency monitoring through the development of a fuzzy Bayesian network risk assessment model. Liu et al. [27] conducted a case study on the Weihe River, where they developed a water pollution risk assessment model using fuzzy theory. They subsequently assessed the risk of water pollution in the Weihe River. Li et al. [28] focused on the Yixing river network area and proposed a comprehensive method for analyzing sudden water pollution risk. This method incorporated fuzzy logic, expert participation, and random simulation, thereby offering a valuable approach for integrating the numerous uncertainties present in complex river network systems. Zhang et al. [29] utilized the Yongding River as a case study to partition the area into distinct units for the purpose of assessing sudden water pollution risks. They subsequently established a prioritization framework for managing water environment risks and employed the analytic hierarchy process and fuzzy comprehensive evaluation methods to evaluate the levels of risk. Guan et al. [30] developed a cumulative risk assessment system specifically for the upstream rivers of Baiyangdian Lake; they then employed the grid environmental risk analysis method to evaluate the risk of sudden water pollution in these upstream rivers. In summary, there is a need for further enhancement in the precision and feasibility of identifying and assessing water pollution risks during the transportation of hazardous materials.
Presently, research on water pollution emergencies primarily concentrates on stationary sources of risk, with limited attention given to mobile sources, such as vehicles involved in the transportation of dangerous chemicals [31]. Additionally, scholars have shown relatively less interest in investigating the risk assessment of abrupt water pollution incidents in non-marine regions [18]. Bayesian networks, also known as belief networks, are the product of the combination of artificial intelligence, probability theory, graph theory, and decision-making analysis. They have been widely applied to describe uncertainty and probability, which can intuitively express the interaction between various factors and obtain an inference from incomplete or uncertain information [32]. Bayesian networks have significant advantages for small sample events by using prior knowledge of probability calculations [33]. The utilization of Bayesian network models for the identification and analysis of sudden water pollution risks remains infrequent within the realm of research methods. Moreover, the assessment of risk grades pertaining to sudden water pollution serves as a manifestation of the potential risks associated with such events [29]. Despite improvements in risk assessment for sudden water pollution accidents, there is a lack of comprehensive consideration for the various types of risk sources in different regions. The evaluation method that disregards the holistic assessment of risk sources and instead isolates them may compromise the accuracy of the results. Consequently, it is imperative to thoroughly consider the different types and sources of risk within a specific region prior to the occurrence of sudden water pollution. Hence, this study employed the expert evaluation fuzzy language method to discern and categorize the risk sources associated with sudden water pollution events in Baiyangdian, considering various perspectives. Subsequently, a Bayesian network model was employed to assess the likelihood of occurrence for different types of risk factors; then, a one-dimensional water quality model was used to simulate the results of oil leakage in the Nanliuzhuang section.
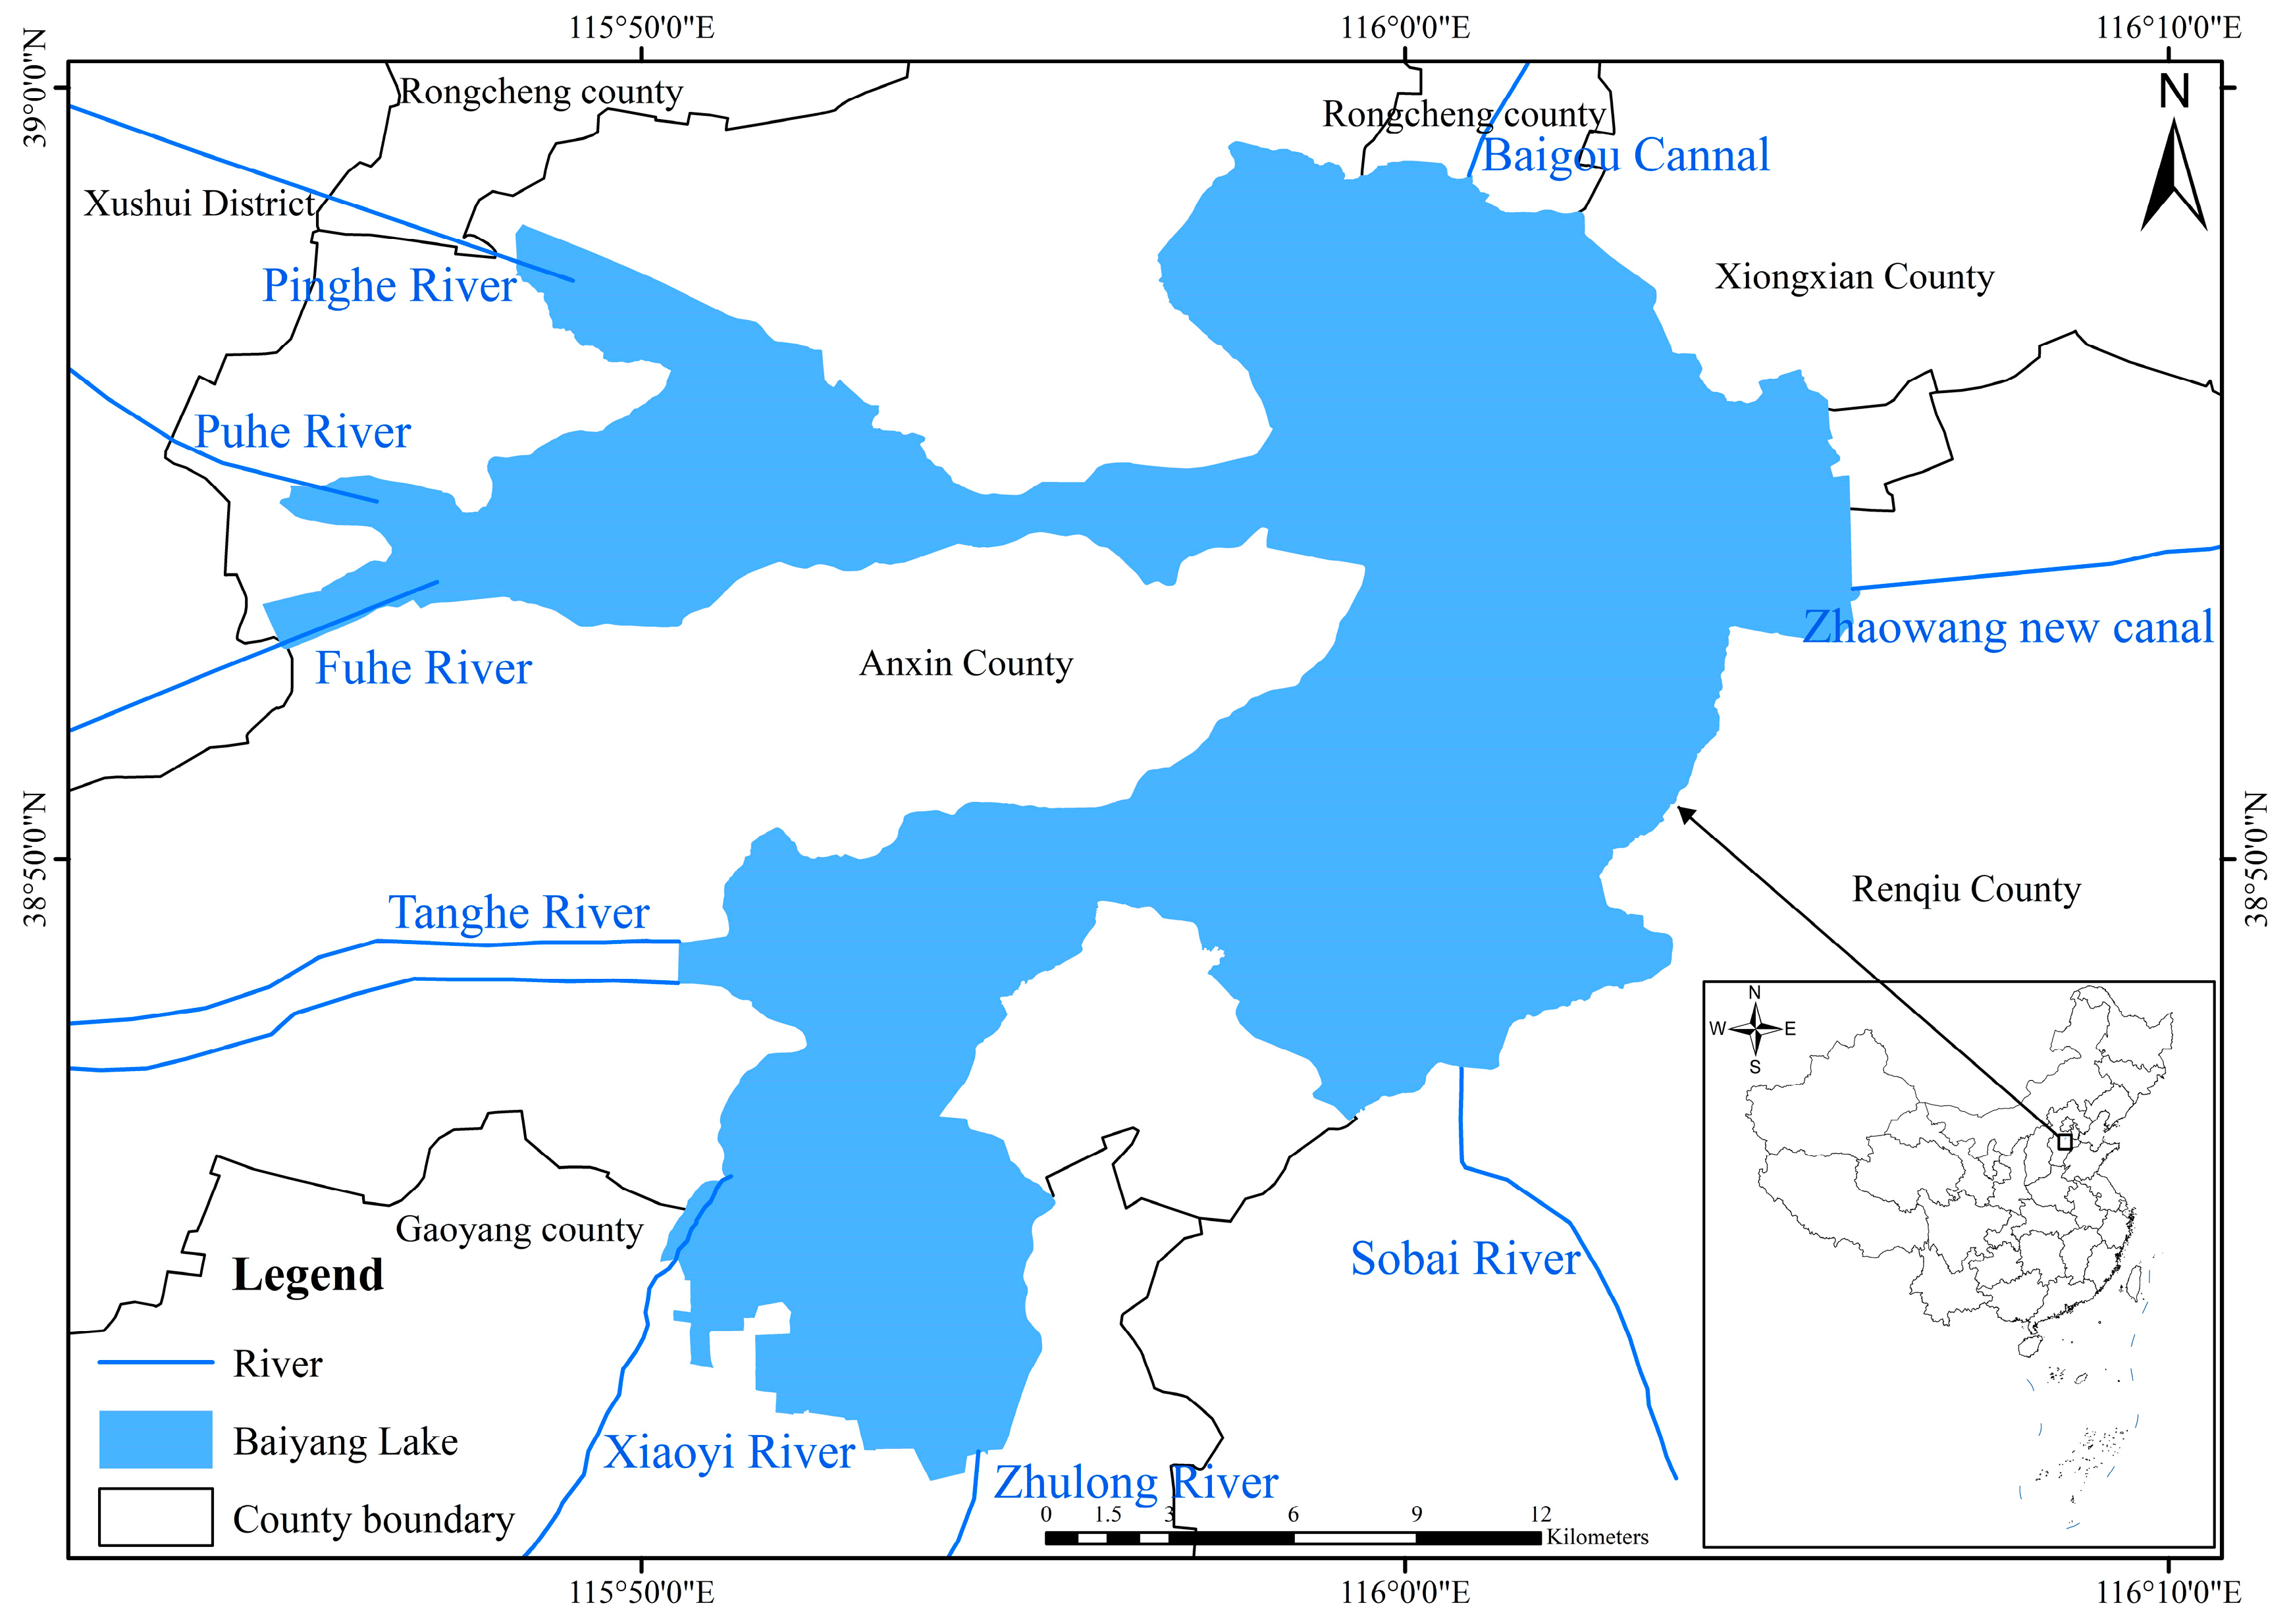
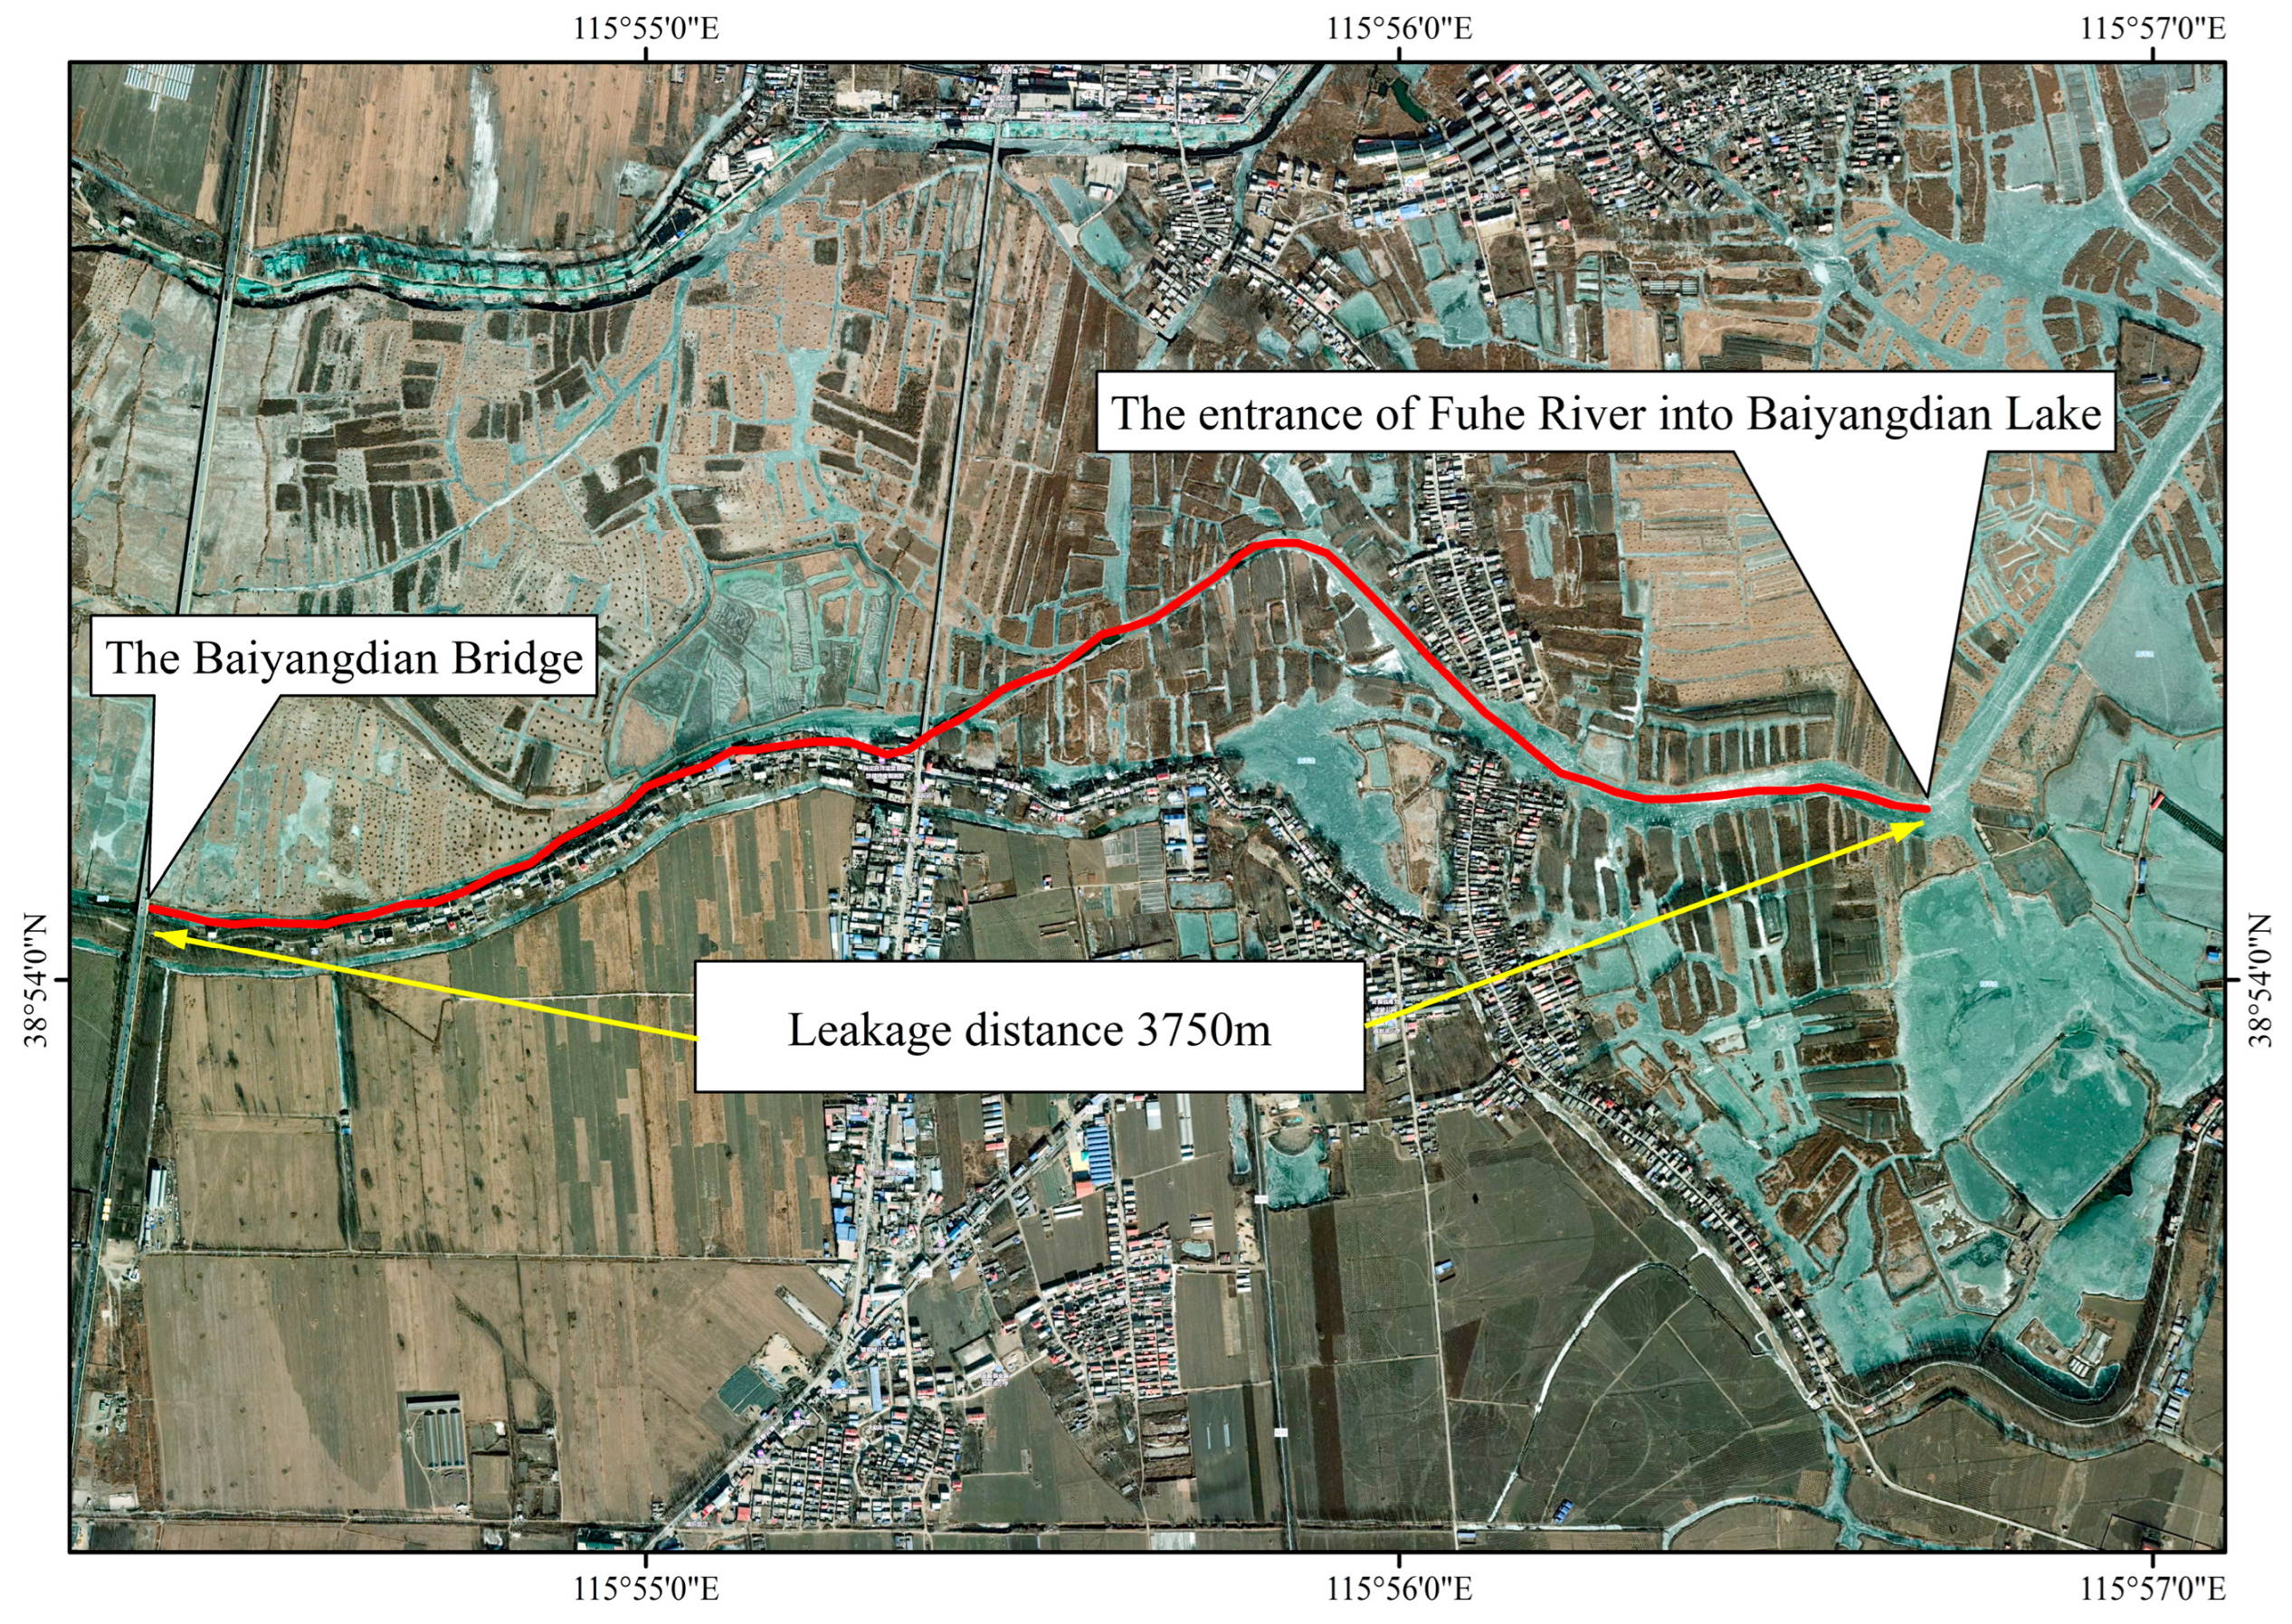
Baiyangdian Lake is an important part of Xiongan New Area in China and plays a significant role in ecological and environmental protection [34].With the improvement of urbanization and industrialization, the polluting enterprises are densely distributed around the lake and the surrounding tributaries, and many sewage treatment stations with dense drainage pipes are distributed in the area [35]. Furthermore, there are many cross-tributary bridges between the nine rivers entering the lake and the roads, and the ships are transported frequently. Thus, the risk of sudden water pollution in Baiyangdian Lake is high due to rollover, leakage, and ship accidents. The frequent occurrence of water pollution accidents in the Baiyangdian Lake area poses serious threats to the safety and reliability of water supply [30].Hence, it is imperative to conduct appropriate risk identification and assessment, simulate potential water pollution incidents in the future, and implement tailored emergency prevention and control measures to mitigate the adverse effects of such incidents. However, as of now, no risk assessment for the Baiyangdian Lake sudden water pollution accident has been reported. Therefore, this study chose Baiyangdian Lake as the focal point to investigate and assess the risk factors associated with abrupt water pollution incidents during the transportation of hazardous materials. It has simulated such incidents occurring at tributary bridges and subsequently proposed pertinent recommendations for the management of sudden water pollution risks in Baiyangdian Lake. These recommendations encompass preventive measures and emergency response strategies.
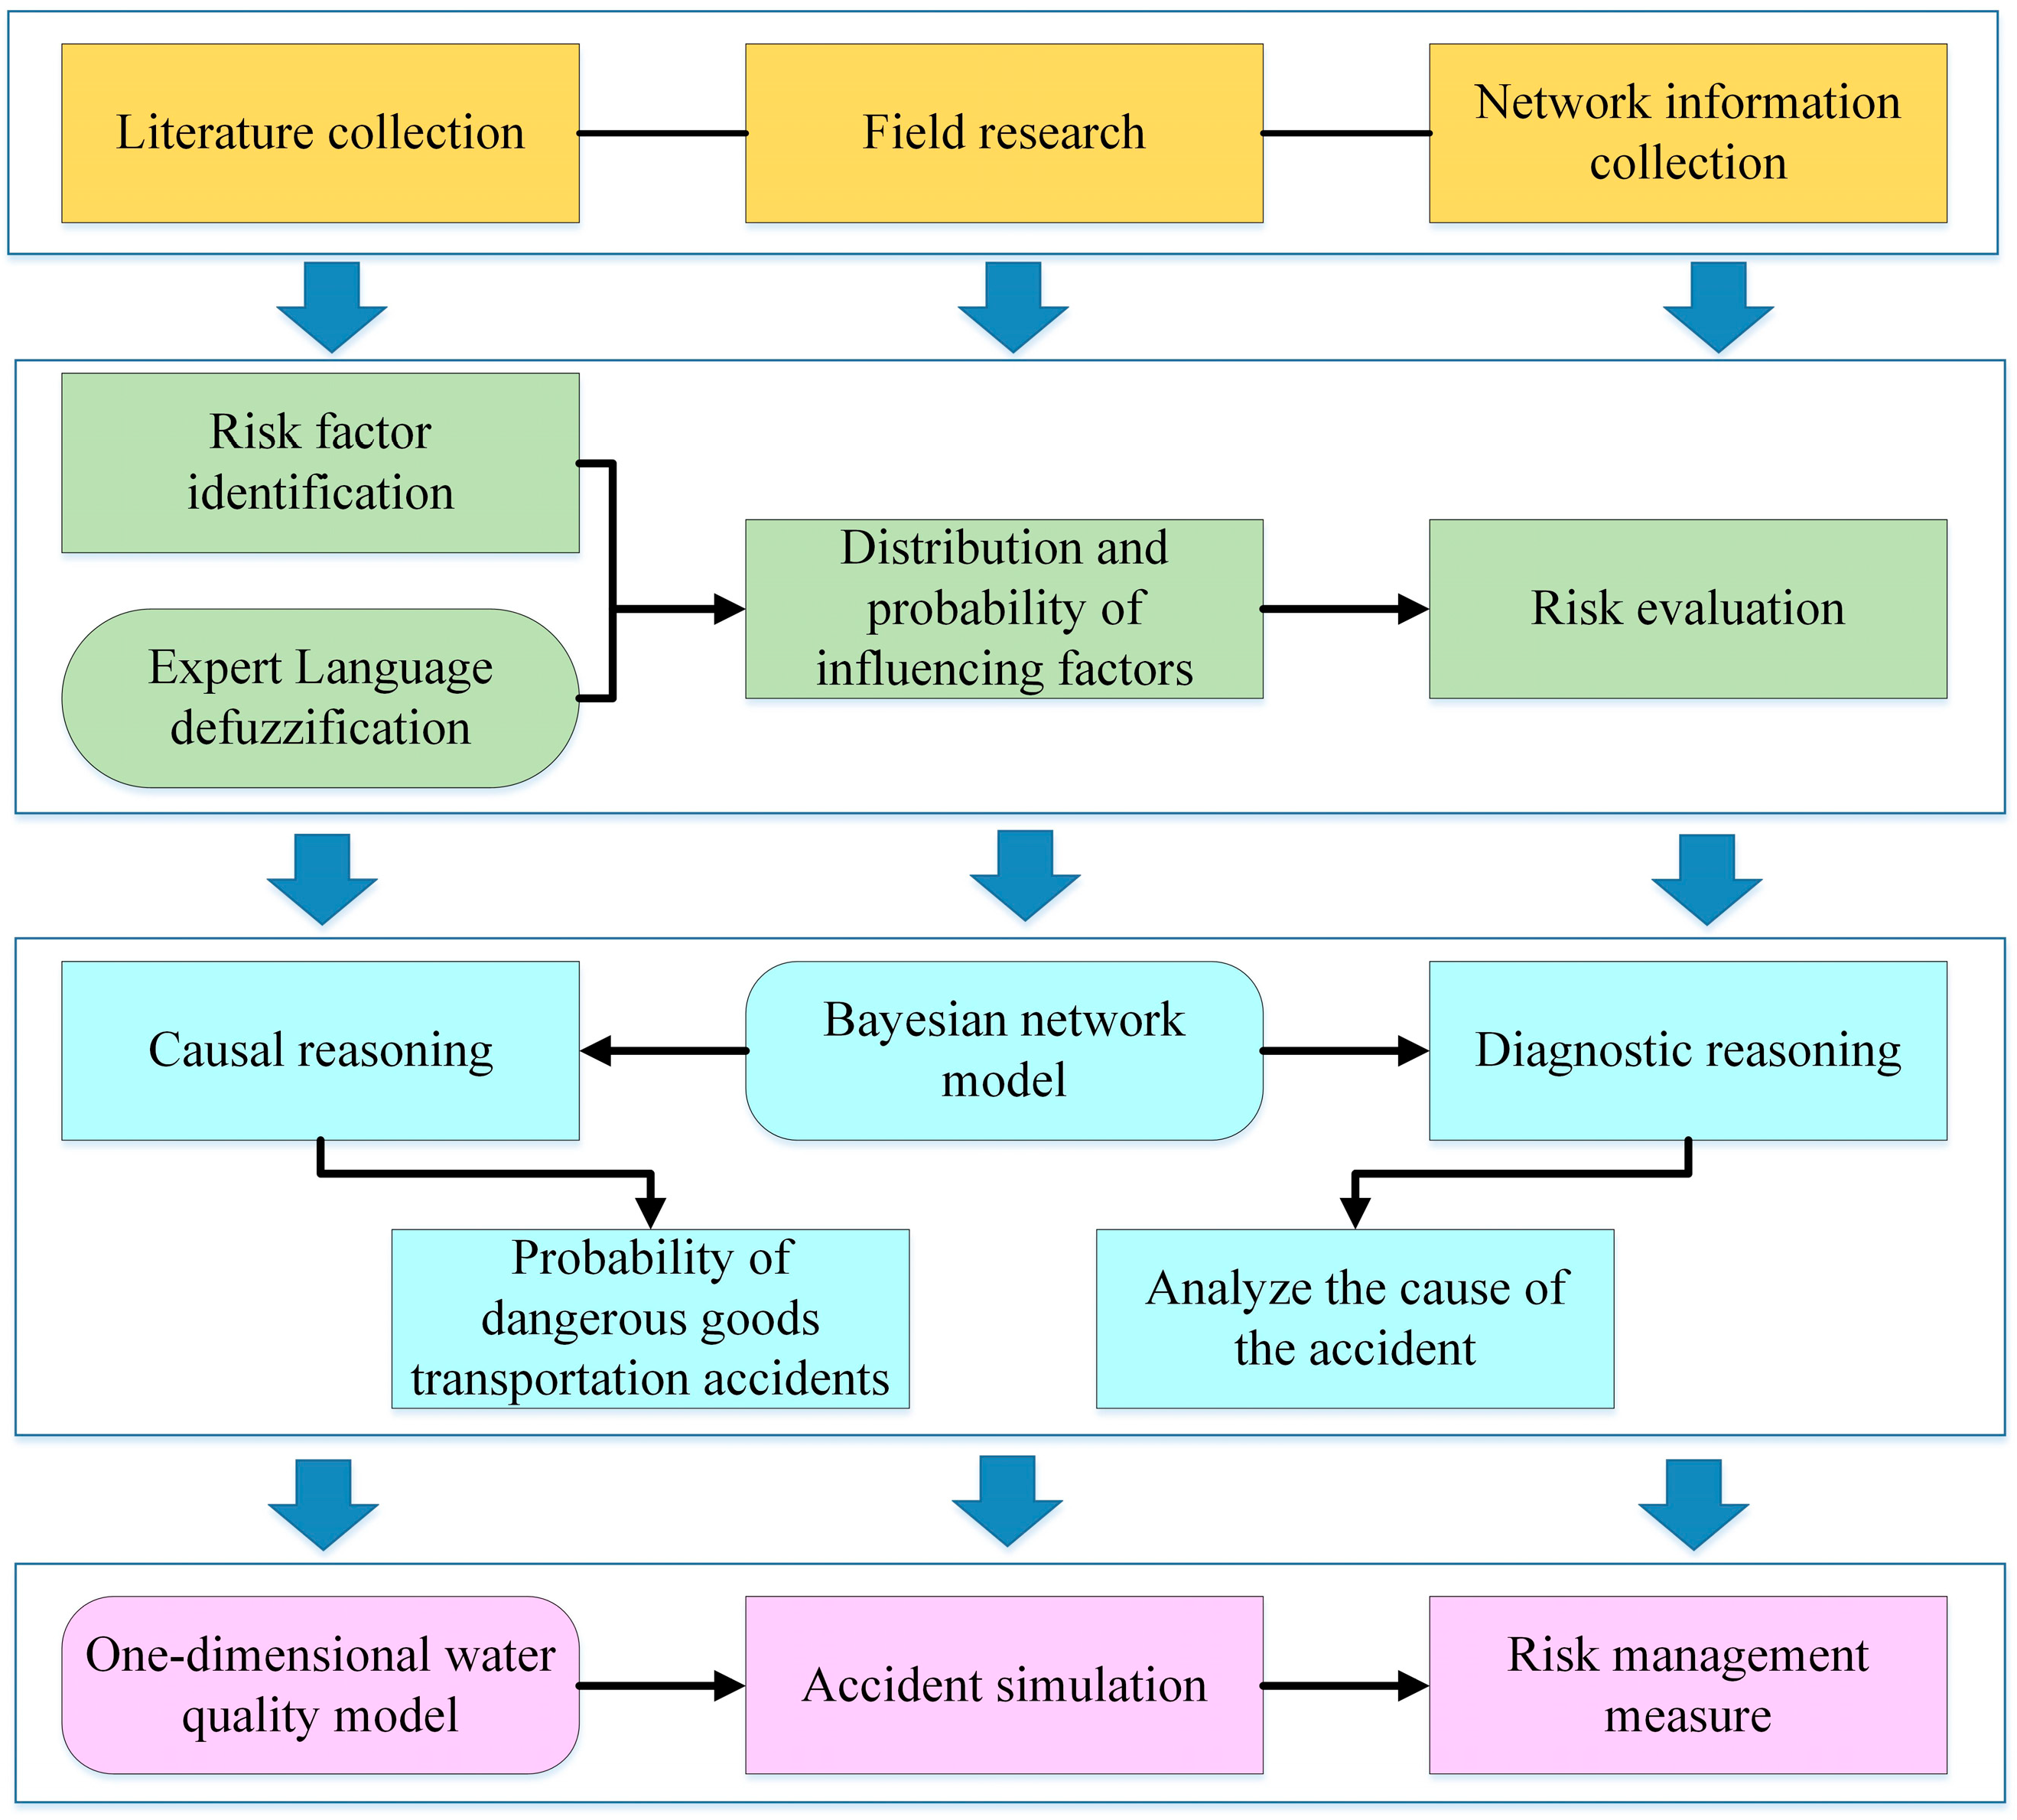
The study encompasses the following components: (1) introduction of the overall situation of Baiyangdian; (2) presentation of the structure and parameters of the Bayes network model, along with the specific details of causal reasoning and diagnostic reasoning; (3) explanation of the process involved in calculating the conditional probability of each node of the Bayes network using the expert evaluation fuzzy language method; (4) utilization of a one-dimensional water quality model to simulate the oil leakage in the Nanliuzhuang section; (5) proposal of emergency prevention and control countermeasures of the inter-regional water pollution accident in Baiyangdian.
Overall, the aim of this study was to: (i) identify and determine the risk factors of dangerous goods transportation accidents on cross-tributary bridges around Baiyangdian Lake by field investigation and the expert evaluation fuzzy language method; (ii) establish the Bayesian network, that is, the probability of a dangerous goods transportation accident is calculated by causal reasoning, and the cause of the accident is analyzed by diagnostic reasoning; (iii) simulate the sudden water pollution accidents on Baiyangdian Lake by using the one-dimensional water quality model, and the corresponding emergency prevention and control measures are put forward Figure 1 to show the schematic diagram of this paper.

2. Study Area

Baiyangdian Lake is the largest freshwater shallow lake in North China (113°400′~116°480′ E, 38°100~40°30′ N), as shown in Figure 2. It plays an important role in flood mitigation, drought prevention, regional microclimate improvement, and biodiversity protection [34]. In addition, it supports water resources for hundreds of thousands of people and enjoys the reputation of “Pearl of North China” and “the End of Nine Rivers” in China. The climate belongs to continental monsoon, with means annual precipitation of 554 mm and temperature of 7~12 °C. Additionally, over 60% of the rainfall is concentrated during shorter periods between June and August. Wetlands, arable cropland (e.g., paddy fields and dry lands), forestland, grassland, and residential and industrial land are the main land-use types in this basin. Baiyangdian Lake receives water from nine rivers, including Baigouyin River, Bao River, Cao River, Fu River, Zhulong River, Ping River, Qingshui River, Tang River, and Xiaoyi River. Moreover, the water body of the Baiyangdian Basin is partly maintained by the water diversion from the Yellow River and the South-to-North Water Diversion Project [30], thereby increasing the water resources and improving the water quality. Baiyangdian Lake Basin rapidly developed, as it has been included in the Xiongan New Area of China since 2017. As a result, there exists numerous cross-tributary bridges due to dense river networks, abundant water compensation projects, and high-intensity human activities. Therefore, there is a high occurrence frequency of sudden water pollution accidents associated with dangerous goods transportation on the cross-tributary bridges of Baiyangdian Lake [36,37,38].

3. Materials and Methods

3.1. Bayesian Network Model

Bayesian networks, alternatively referred to as causal probability networks or causal networks [39], are acyclic-directed graph models that depict the probabilistic interdependence among random variables. They serve as network structure diagrams commonly employed for reasoning and analysis purposes [40]. Once the probabilities of certain variables (typically input variables) are established, Bayesian network reasoning can be accomplished by employing basic probability operations and Bayesian theory to calculate the probabilities of all or specific nodes. In the absence of empirical evidence to establish the occurrence of event A, the utilization of a Bayesian network model enables the analysis and estimation of the probability of event A based on the interrelation between event B and event A [41].

3.1.1. Bayesian Network Composition

(1) The Bayesian network structure
The Bayesian network comprises three primary node categories (Figure 3): (i) the target node, which represents the risk level of sudden water pollution accidents and serves as the ultimate outcome of the Bayesian network in this study, offering guidance for subsequent decision-making; (ii) the evidence node, also known as the parent node, which plays a crucial role in providing supporting information for the Bayesian network analysis; (iii) the intermediate node, which plays a linking role between target nodes and evidence nodes. In this study, the fundamental unit of a Bayesian network consists of identified risk factors for sudden water pollution accidents. The connecting lines with directivity between each node indicate the relationships between them [42].
The structure and reasoning process of a Bayesian network exhibit characteristics that are suitable for risk assessment modeling and analysis [43]. The structure of a Bayesian network allows for the expression of uncertainty relationships and polymorphism characteristics among variables. The causal reasoning of the system can be utilized to compute the joint probability of system risk occurrence under different fault conditions for the purpose of risk assessment. Additionally, the diagnostic reasoning of the system involves calculating the conditional probability of each component state when the system risk occurs, facilitating system diagnosis and targeted risk management [34].
(2) The Bayesian network parameter
The Bayesian network parameter pertains to the conditional probability table, which encompasses the conditional probability of each node. The single conditional probability within this table signifies the impact of one node variable on another node variable [44]. Each node within the system possesses a distinct state, and the initial likelihood of evidence nodes is typically established based on empirical knowledge and monitoring data [25]. In this study, the notation P(A) was employed to denote the evidence node, signifying the probability of event A transpiring without accounting for the pertinent factors associated with event B. Conversely, intermediate and target nodes are typically expressed in terms of conditional probability, denoting the posterior probability that elucidates the relationship between two nodes interconnected by a directed edge [45]. In this study, the notation P(A|B) was utilized to represent this conditional probability, indicating the probability of event A transpiring given the occurrence of event B.
P ( A | B ) = P ( B | A ) P ( A ) P ( B )

3.1.2. Causal Reasoning

Causal reasoning involves the process of reasoning from the evidence node to the target node. In the analysis of inference using Bayesian networks, an initial subjective probability estimation is conducted for the prior probability of the evidence node. Subsequently, the estimated probability values are inserted into the formula to compute the posterior probability of the final target event. Scientific decisions are then made based on this output, which is theoretically derived from the well-known Bayesian formula [46]:
P A i B = P ( B | A i ) P ( A i ) i = 1 n P ( B | A i ) P ( A i )
The risk frequency interval division standards established by the International Tunnel Association (ITA) are presented in Table 1 [47]. The natural probability PN of the occurrence of a risk event obtained by Bayesian network inference is related to the log probability P as:
P = 5 + log P N

3.1.3. Diagnostic Reasoning

The diagnostic reasoning function of a Bayesian network is employed to analyze the primary factors and combinations of factors that contribute to accidents. Specifically, the probability of each risk factor is assessed assuming a 100% probability for node A being “1”, and the extent of change is compared to the impact of each risk factor on accidents [48].
The Bayesian network risk assessment model must address numerous instances of incomplete and inaccurate data and information during inference, necessitating the execution of inference processes in various states. In order to enhance the precision of logical deductions, it is imperative to employ Netica, a specialized tool for graphical decision theory [49], which facilitates the graphical representation of node states. This graphical depiction enhances the intuitiveness and accuracy of the reasoning process. Consequently, this study primarily utilized Netica to reason with risks associated with social security incidents.

3.2. Conditional Probability Calculation

3.2.1. The Evaluation Level Establishment

Describing risk factors pertaining to accidents in the transportation of hazardous materials is a significant challenge, prompting the introduction of language evaluation levels to effectively characterize variables [47,50]. Table 2 shows seven natural language variables expressed as risk levels, as well as their corresponding triangular fuzzy numbers and probability range. This paper divided the risk degree of dangerous goods transportation accidents into seven levels: very low (VL), low (L), flat low (FL), medium (M), high (FH), flat high (H), and very high (VH).

3.2.2. Fuzzy Language Acquisition

Due to the limited availability of data and clear guidelines for classifying and assessing various risk factors, the direct and accurate determination of conditional probability for each evidence node was also a challenge [51,52]. Consequently, this study employed the Delphi method as a means to compensate for the lack of data [53], thus establishing the probabilities of evidence nodes. Through an anonymous questionnaire survey, experts were invited to evaluate and predict the evidence nodes until a consensus was reached [54]. Given that expert judgment relied on personal knowledge and experience and the results were expressed in a vague language, it was imperative to employ defuzzification techniques to enhance the clarity of expert language.

3.2.3. Expert Language Defuzzification

The commonly used defuzzification methods are trapezoidal fuzzy numbers [55], triangular fuzzy numbers [56], and LR-type fuzzy numbers [57]. Considering the attributes and suitability of these methods, the triangular fuzzy number was chosen as the membership function for defuzzifying expert language, which was proposed by Vanlaarhoven and Pedrycz [58] for fuzzy judgment.
Fuzzy numbers typically encompass upper and lower limits, as well as intermediate potential values. Assuming that the risk assessment membership set is denoted as A, the triangular fuzzy number’s upper and lower limits are represented by a and b , respectively. When the membership degree of set A is 1 and the value is m, the triangular fuzzy number A is denoted as A ~ = ( a , m , b ) , with the membership function expressed as follows:
A ~ = x a m a                       a x m b x b m                       m x b   0                               x a ,   x b
where a and b signify the degree of fuzziness ( a     m     b ). The greater the difference between b and a , the higher the degree of fuzziness.

3.2.4. Calculation of the Conditional Probability

After obtaining expert opinions and transforming them into triangular fuzzy numbers, the quantized triangular fuzzy numbers underwent processing to compute the probability information for each evidence node. The processing procedure primarily involves averaging, defuzzification, and normalization [59]. The expert opinions were calculated and averaged based on the number of invited experts, thereby eliminating outliers and enhancing the rationality of the fuzzy probability value in the judgment. The formula is as follows:
P ~ = p 1 + p 2 + + p n n = a ~ ,   m ~ ,   b ~
The defuzzification of the average triangular fuzzy number was conducted by utilizing the mean area method, resulting in the conversion into the precise probability P′ of the node [60]. This formula is expressed as follows:
P = a ~ + 2 m ~ + b ~ 4
Ultimately, the probability information of each node was normalized, thereby achieving a sum of probability values equal to 1 across various risk levels. Consequently, the obtained probability value was used for subsequent inference calculations, as follows:
P i = P i = 1 2 P
The Bayesian network was established to assign values to each node, and the calculated probability value was then substituted into the Bayesian network. The Netica data analysis software was utilized for reasoning calculations [61]. On the node definition screen, State 0 represented non-occurrence, while State 1 signified occurrence.

3.3. Simulation of Sudden Water Pollution Accidents

The Fuhe River flows into Baiyangdian Lake, located in the north of Jianchang Village, Anxin County, passing through Baoding City and Qingyuan County. It has a total length of 30.83 km, a drainage area of 643.2 km2, and an average water depth ranging from 1.5 to 3 m. The distance between the Baiyangdian Lake Bridge and Shaochedian along the Fuhe River measures 3750 m. Situated within the Baiyangdian Lake Baojing Line, the region is susceptible to sudden water pollution incidents. The bridge spans a total length of 1203.88 m and possesses a width of 19.5 m, as depicted in Figure 4.
An oil vehicle overturning on the Fuhe River Bridge would cause direct oil leakage into the river. Therefore, a one-dimensional water quality model was employed to simulate the longitudinal dispersion of pollutants along the river [62]. It can be calculated as follows:
C ( x ) = C 0 e x p ( k · x )
where C(x) represents the measured pollutant concentration of the control section (kg/L), C0 represents the measured pollutant concentration of the initial section (kg/L), k is the comprehensive self-purification coefficient of pollutants (1/d), and x is the river section distance downstream of the sewage outlet (km). The k of pollutants can be assumed as 0.0213 [63]. The scenario settings and fundamental parameters for the simulation of oil transportation accidents on the cross-tributary bridges of Baiyangdian Lake are presented in Table 3.

3.4. The Proposed Emergency Indicator System

An emergency prevention index system for sudden water pollution accidents was proposed, including the following treatment stages: (1) reporting phase, (2) detection phase, (3) forecasting phase, and (4) processing phase. According to these four stages, targeted emergency prevention and control measures should be implemented to provide decision support for mitigating the hazards of accidents [64]. This recommendation is in accordance with the guidelines outlined in the National Emergency Plan for Public Emergencies (8 January 2006), the Dangerous Chemicals Safety Management Regulations, the General Technical Requirements for Transport and Packaging of Dangerous Goods (GB12463), and the Signs of Vehicles for Road Transport of Dangerous Goods (GB13392). The Ministry of Communications has developed risk prevention management measures and emergency plans for dangerous goods transportation accidents on bridges across tributaries in accordance with the Road Dangerous Goods Transportation Management Regulations, Automotive Dangerous Goods Transportation Regulations (JT3130), and other relevant regulations [65,66]. All of them were taken into consideration in this study.

4. Results and Discussion

4.1. Risk Factors Identification

The present study employed a comprehensive approach, including literature analysis, field investigation, and the Delphi method, to gather data on water pollution incidents caused by the transportation of hazardous materials on the cross-tributary bridges of Baiyangdian Lake between 2000 and 2020 [67,68,69,70,71]. Consequently, the factors influencing these accidents were identified and summarized in Figure 5.
It was found that driver risk and escort risk factors constituted the largest proportion of these accidents, accounting for a total of 65%. Additionally, tank risk factors accounted for 20% of the accidents on the cross-tributary bridges, surpassing the average level of road transportation accidents involving hazardous materials, which stands at 18% [72].
The weather risk, road risk, time risk, and lighting risk belonged to unpredictable force majeure factors; thereby, it was necessary to consider these accidental factors in transportation distance and time arrangement, so as to reduce the possibility of sudden water pollution accidents [73]. Unforeseeable force majeure elements encompassed the hazards of weather, road conditions, time, and lighting. Therefore, it was imperative to account for these incidental factors when planning transportation distance and time in order to minimize the likelihood of unexpected water pollution incidents. Additionally, after analyzing the factors that contribute to sudden water pollution accidents during the transportation of hazardous materials on the cross-tributary bridges of Baiyangdian Lake, four types of risk factors were identified: personnel, vehicle, tank risks, and environmental risk. Overall, four first-grade indices and 10 s-grade indices are shown in Table S1 (it can be found in the supplementary material).

4.2. Conditional Probability

Based on the risk factor system and assessment standards, a panel of seven experts was assembled to assess the occurrence probability of each evidence node in the Bayesian network. The evaluation outcomes are presented in Table 4.
By utilizing the relationship between the evaluation level and the triangular fuzzy number, the statistical analysis of the experts’ ratings of the triangular fuzzy number was conducted, as demonstrated in Table 5.
Subsequently, the expert opinion results were subjected to arithmetic averaging in order to eliminate any anomalous values, thereby rendering the fuzzy probability value of the judgment more rational. The defuzzification process involved applying the averaging calculation formula. For instance, in the case of the evidence node, the following calculation outcomes were obtained:
PX1 = (0.3 + 0.5 × 4 + 0.7 × 2, 0.5 + 0.7 × 4 + 0.9 × 2, 0.7 + 0.9 × 4 + 1.0 × 2)/7 = (0.53, 0.73, 0.90)
The occurrence probability of the evidence nodes was determined using the arithmetical average method, resulting in triangular fuzzy numbers. These average triangular fuzzy numbers were subsequently employed in the mean area method for defuzzification. The normalization of the conditional probability for each node was conducted, and the corresponding results are presented in Table 6.
For instance, the calculation of the conditional probability for node X1 was performed as follows:
PX1 = (0.53 + 2 × 0.73 + 0.90)/4 = 0.72
It can be found from the results of conditional probability calculation in Table 7 that the likelihood of the driver factor, vehicle emergency factor, tank emergency factor, road factor, and lighting situation occurring was high. Consequently, driver, vehicle, tank, road, and lighting were deemed essential components in the transportation of hazardous materials. Once these factors are present, adverse conditions can easily lead to accidents during the transportation process, resulting in incidents of water pollution.
Machado et al. [74] conducted a monitoring and counting study on the 050 highway in Brazil, revealing that 14 accidents occurred. The distribution of these accidents was as follows: 35.71% in the morning, 28.57% in the afternoon, 21.43% at night, and 14.29% in the early morning. Furthermore, the probability of accidents during the rainy season (64.29%) was higher compared to periods with little or no rain (35.71%), occurring five times. Notably, a significant proportion (28.57%) of the accidents took place on sections of the road with steep slopes, specifically between km 77 and km 83.
This study did not incorporate the temporal duration of the accident, specifically the seasonal and regional aspects. It was observed that adverse weather conditions during the rainy season contribute to an elevated risk of road-related factors, while the presence of steep slopes further exacerbates road conditions, thereby increasing the probability of risk during the transportation of hazardous materials. These findings align with the outcomes of the present study. Notably, the lighting factors examined in this research solely pertain to the nighttime period. No analysis of the accident in different periods was conducted due to the significantly lower transportation intensity of the bridge entering Baiyangdian compared to the 050 expressway in Brazil.

4.3. Risk Assessment Based on Bayesian Network Model

This study employed a Bayesian network model with a two-way reasoning function to establish the occurrence probability, main causes, and their combinations of dangerous goods transportation accidents on the cross-tributary bridges of Baiyangdian Lake. Specifically, the study employed causal reasoning and diagnostic reasoning [75].

4.3.1. Causal Reasoning Results

According to the Bayesian network structure and probability table, the probability of “Yes” at node A (PA) was determined to be 0.115, as depicted in Figure 6. Additionally, by considering the relationship between natural probability, logarithmic probability, and risk level from Table 1, the value of P was calculated to be 4.061. This value indicates a high risk level for the transportation of dangerous goods, suggesting a probable occurrence with a high probability.

4.3.2. Diagnostic Reasoning Results

According to the Bayesian diagnostic reasoning, the probability of each risk factor is illustrated in Figure S1a (it can be found in the supplementary material), assuming an occurrence probability of 1 for the target node A.
The variations of X3, X4, and X7 exhibited a significantly greater magnitude compared to other factors, suggesting that the vehicle emergent factor, vehicle wear factor, and weather factor exerted a more substantial influence on the occurrence of accidents. The combination of X1, X4, X6, and X7 was identified as the most probable state combination leading to accidents, with an occurrence probability of 0.142, as depicted in Figure S1b (it can be found in the supplementary material). This finding indicates that hazardous goods transportation accidents are most likely to transpire on cross-tributary bridges when the driver is in a compromised state, the vehicle and tank exhibit signs of wear, and the weather conditions are unfavorable.
Based on the assumption of the vehicles and tanks being in optimal condition, the accident is most likely to occur due to a combination of states X1, X7, X9, and X10. Specifically, the accident has the highest probability of occurrence on cross-tributary bridges, where drivers have poor status, weather conditions are unfavorable, and there are no street lights at night, with a value of 0.117 in Figure S1c (it can be found in the supplementary material). Consequently, implementing risk prevention measures prior to accidents can effectively decrease the likelihood of such incidents.
Hua et al. [16] conducted a systematic analysis of the causes of dangerous goods explosion accidents at Tianjin Port using the FTA method. This findings indicated that management factors and human factors held a prominent position within the overall causal framework of such accidents, while environmental factors, goods, and facilities also exerted a discernible influence on their occurrence. The study conducted by Khan et al. [76] utilized Bayesian networks to analyze 348 accident reports spanning from 1990 to 2018, revealing the intricate nature of causes contributing to dangerous goods explosion accidents in ports. The findings indicated that, in typical conditions, there is a 59.8% likelihood of major accidents occurring, with human factors and management factors being the primary contributors to such incidents. Moreover, in the context of environmental and pollution accidents, the probability of management factors exacerbating the occurrence of accidents increases by 7.06%.
Within the scope of this investigation, driver factors, vehicle factors, tank factors, and lighting factors are classified as human factors and management factors, respectively, and they significantly contribute to water pollution accidents during the transportation of hazardous materials on the Baiyangdian bridge, aligning with the aforementioned conclusions.

4.4. Accident Simulation Results, Emergency Prevention and Control Measures

4.4.1. Accident Simulation

The selection of the Nanliuzhuang section as a simulation case was based on its significant role in the entry of the Fuhe River into Baiyangdian Lake. The average concentration of pollutants in this section was determined through various setting scenarios, as presented in Table 7. To exemplify the transportation of dangerous goods across the tributary bridges of Baiyangdian Lake, an oil leakage accident was chosen as a case study.
The results indicated that, without proper prevention and control measures, the oil concentration in the Nanliuzhuang section reached extremely high levels. The absence of additional treatment would result in a direct discharge into Baiyangdian Lake, thereby significantly compromising its water quality. Consequently, efforts were made to specifically address the issue of oil leakage into the river. In order to simulate potential accident scenarios and mitigate associated risks, appropriate preventive management measures must be implemented.

4.4.2. Risk Emergency Prevention and Control

The risk management approach for transportation accidents involving hazardous materials on the cross-tributary bridges of Baiyangdian Lake should prioritize prevention. To facilitate emergency preparedness for sudden water pollution incidents, a comprehensive index system was developed and is presented in Table 8. More details can be seen in our previous study [77].
As can be seen from the classification of the index system in Table 8, the first level index was divided into warning source index and early warning index. The second level index of the warning source index was divided into accident type, pollutant type, and occurrence region. The second level index of the early warning index was divided into affected population, affected area, influence duration, region sort, and the maximum exceeding multiple of water quality. Risk emergency prevention and control measures were proposed on this basis.
The primary risk mitigation measures for emergency prevention and control encompass the following seven aspects [78,79,80]: (1) it is recommended to enforce an inspection system for vehicles involved in the transportation of hazardous materials; (2) the velocity of hazardous materials transportation by vehicles should be restricted on cross-tributary bridges; (3) engineering protective measures, such as reinforcing and elevating guardrails, can be implemented on both sides of the bridges; (4) the installation of pollutant discharge collection devices in the vicinity of the bridges is advisable; (5) it is suggested to implement real-time monitoring systems for transportation vehicles, hazardous materials, and transportation routes; (6) an auxiliary decision-making system should be developed to facilitate emergency response procedures; (7) legislation pertaining to water environment risk management should be enhanced and refined. It is crucial to promptly report the occurrence time and location, pollutant type and source, potential consequences, and other preliminary information regarding sudden water pollution incidents in order to devise targeted measures for risk prevention and control [81].
Based on the categorization of abrupt water pollution incidents, as well as the geographical, topographical, and meteorological factors, the extent and velocity of pollutant migration and dispersion are established. Subsequently, the identification and assessment of pollution sources and their consequential impacts are continuously monitored [82]. During the forecasting stage, the utilization of a water quality early warning model becomes imperative in predicting the likelihood of accidents, the concentration, dynamics, and extent of pollutants, as well as potential hazards. During the processing phase, it is imperative for all pertinent departments to adhere strictly to the emergency division of labor, to promptly investigate the extent of impact and level of harm, to evaluate the resulting losses, to report to higher authorities, and to disclose the findings [83].
This study had certain limitations that should be acknowledged. Firstly, the categorization of the role of each node in accident causality did not include various states such as negligible, low, medium, high, and severe. Incorporating these states could enhance the comprehension of accident causality aspects and factor levels. Additionally, the lack of data and knowledge hinders the further subdivision of environmental pollution risks based on type and severity. Nevertheless, the findings of this study hold significant implications for enhancing the comprehension of risk assessment pertaining to sudden water pollution incidents, as well as the corresponding measures for prevention and control.

5. Conclusions

This study explored the potential risk of sudden water pollution accidents associated with dangerous goods transportation on the cross-tributary bridges of Baiyangdian Lake. The conclusions are as follows:
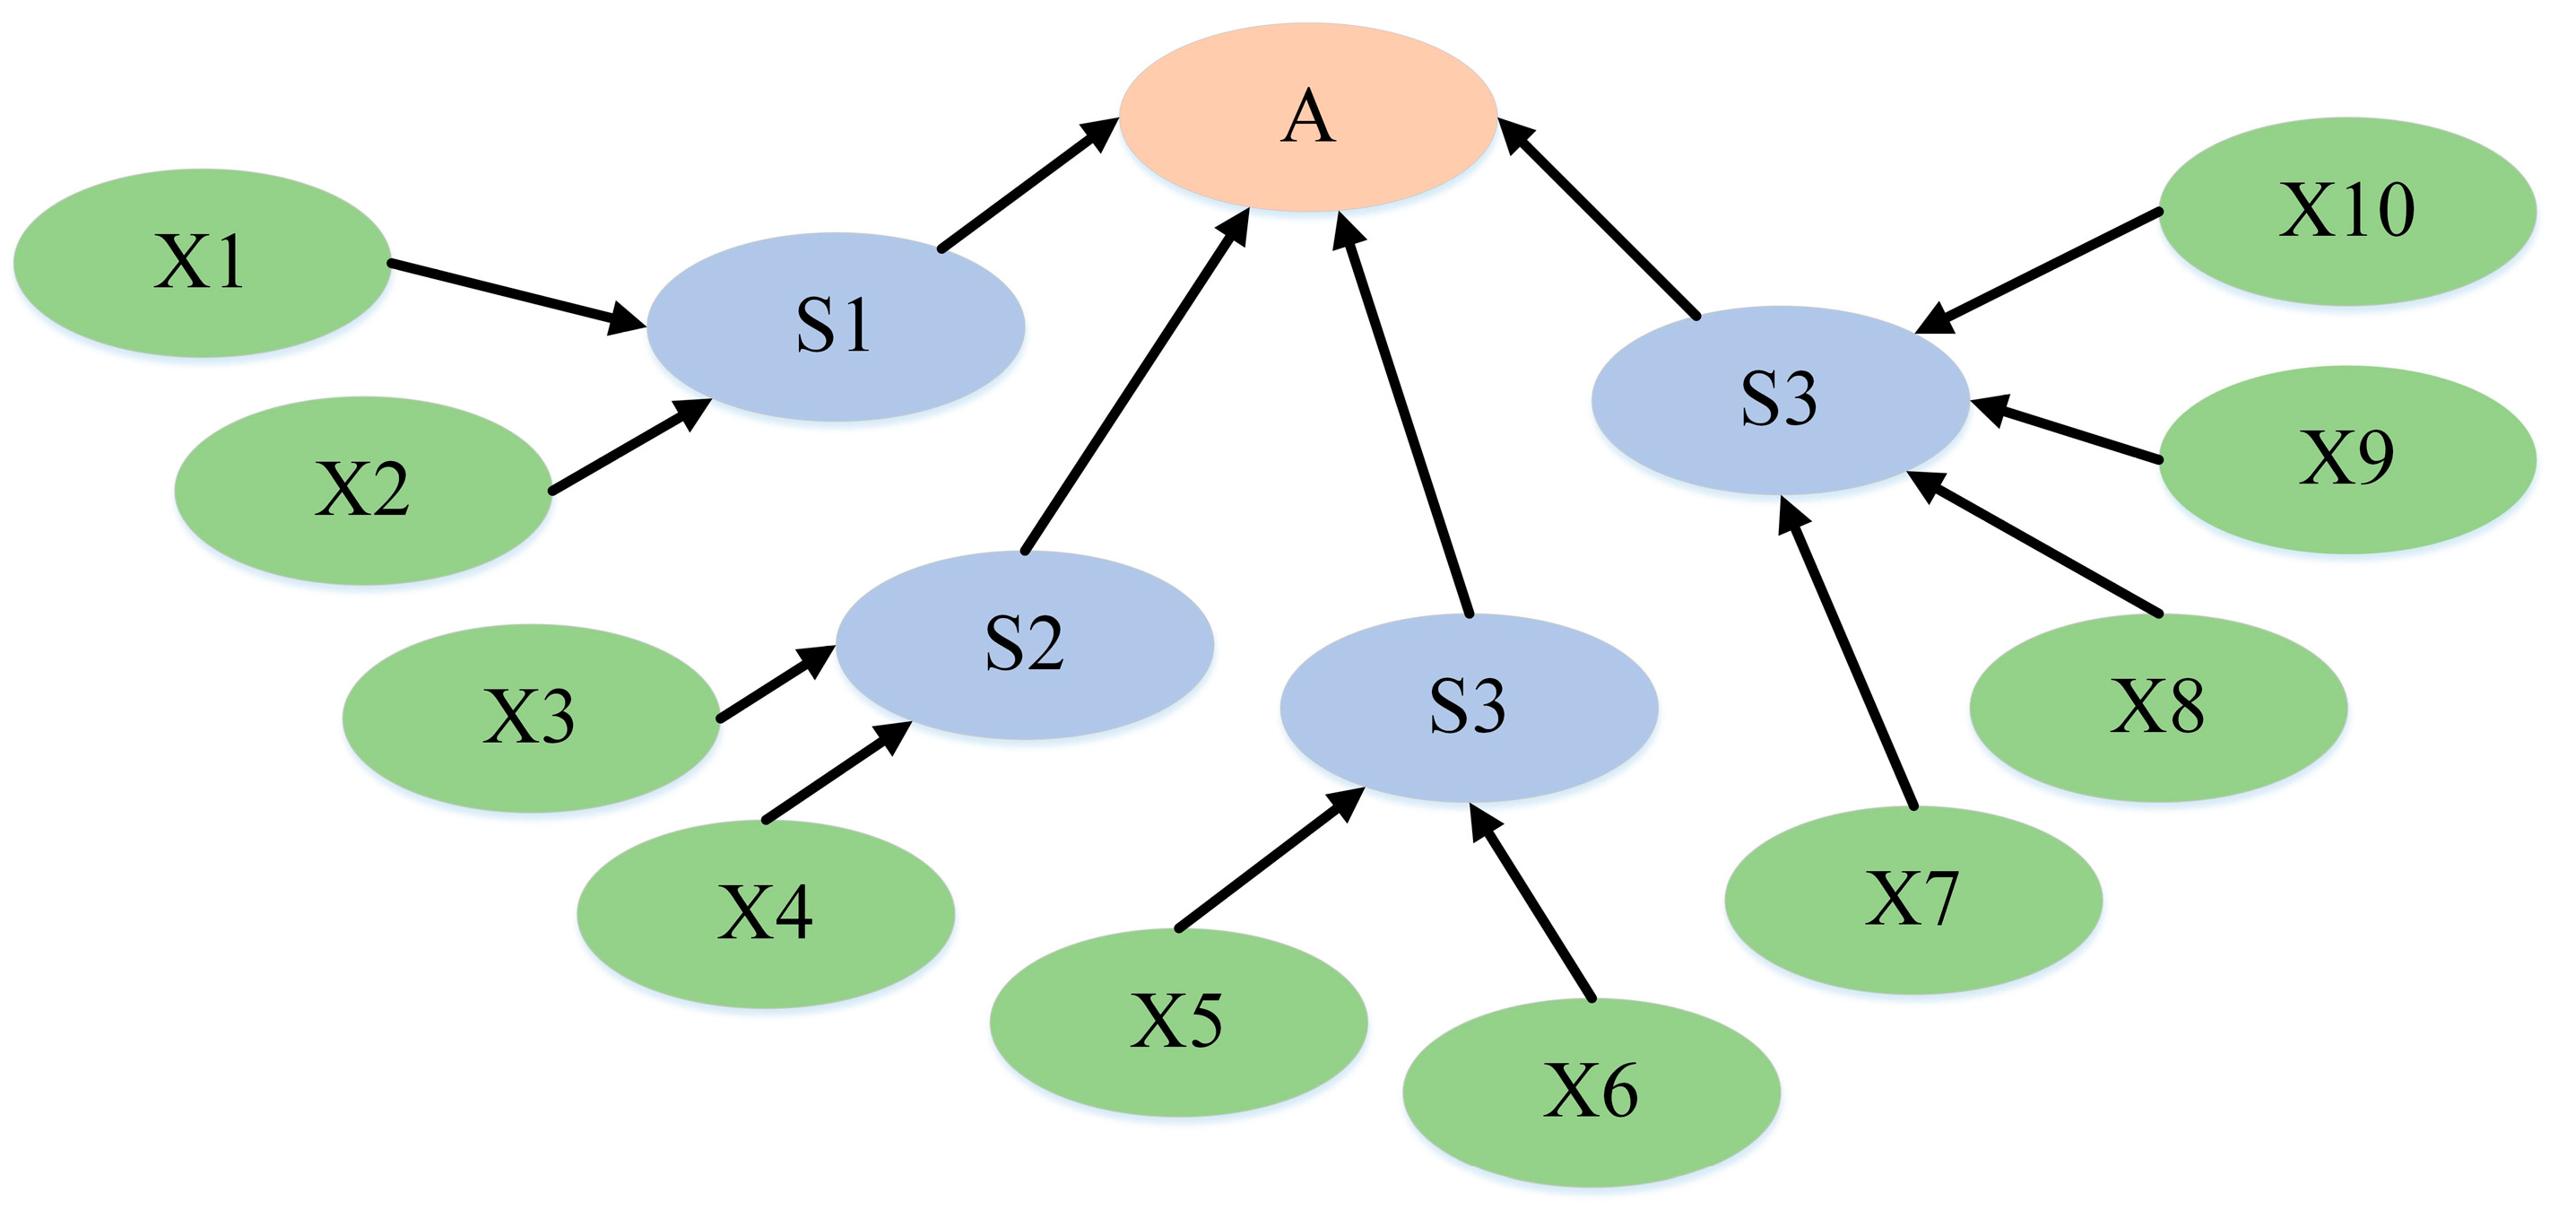
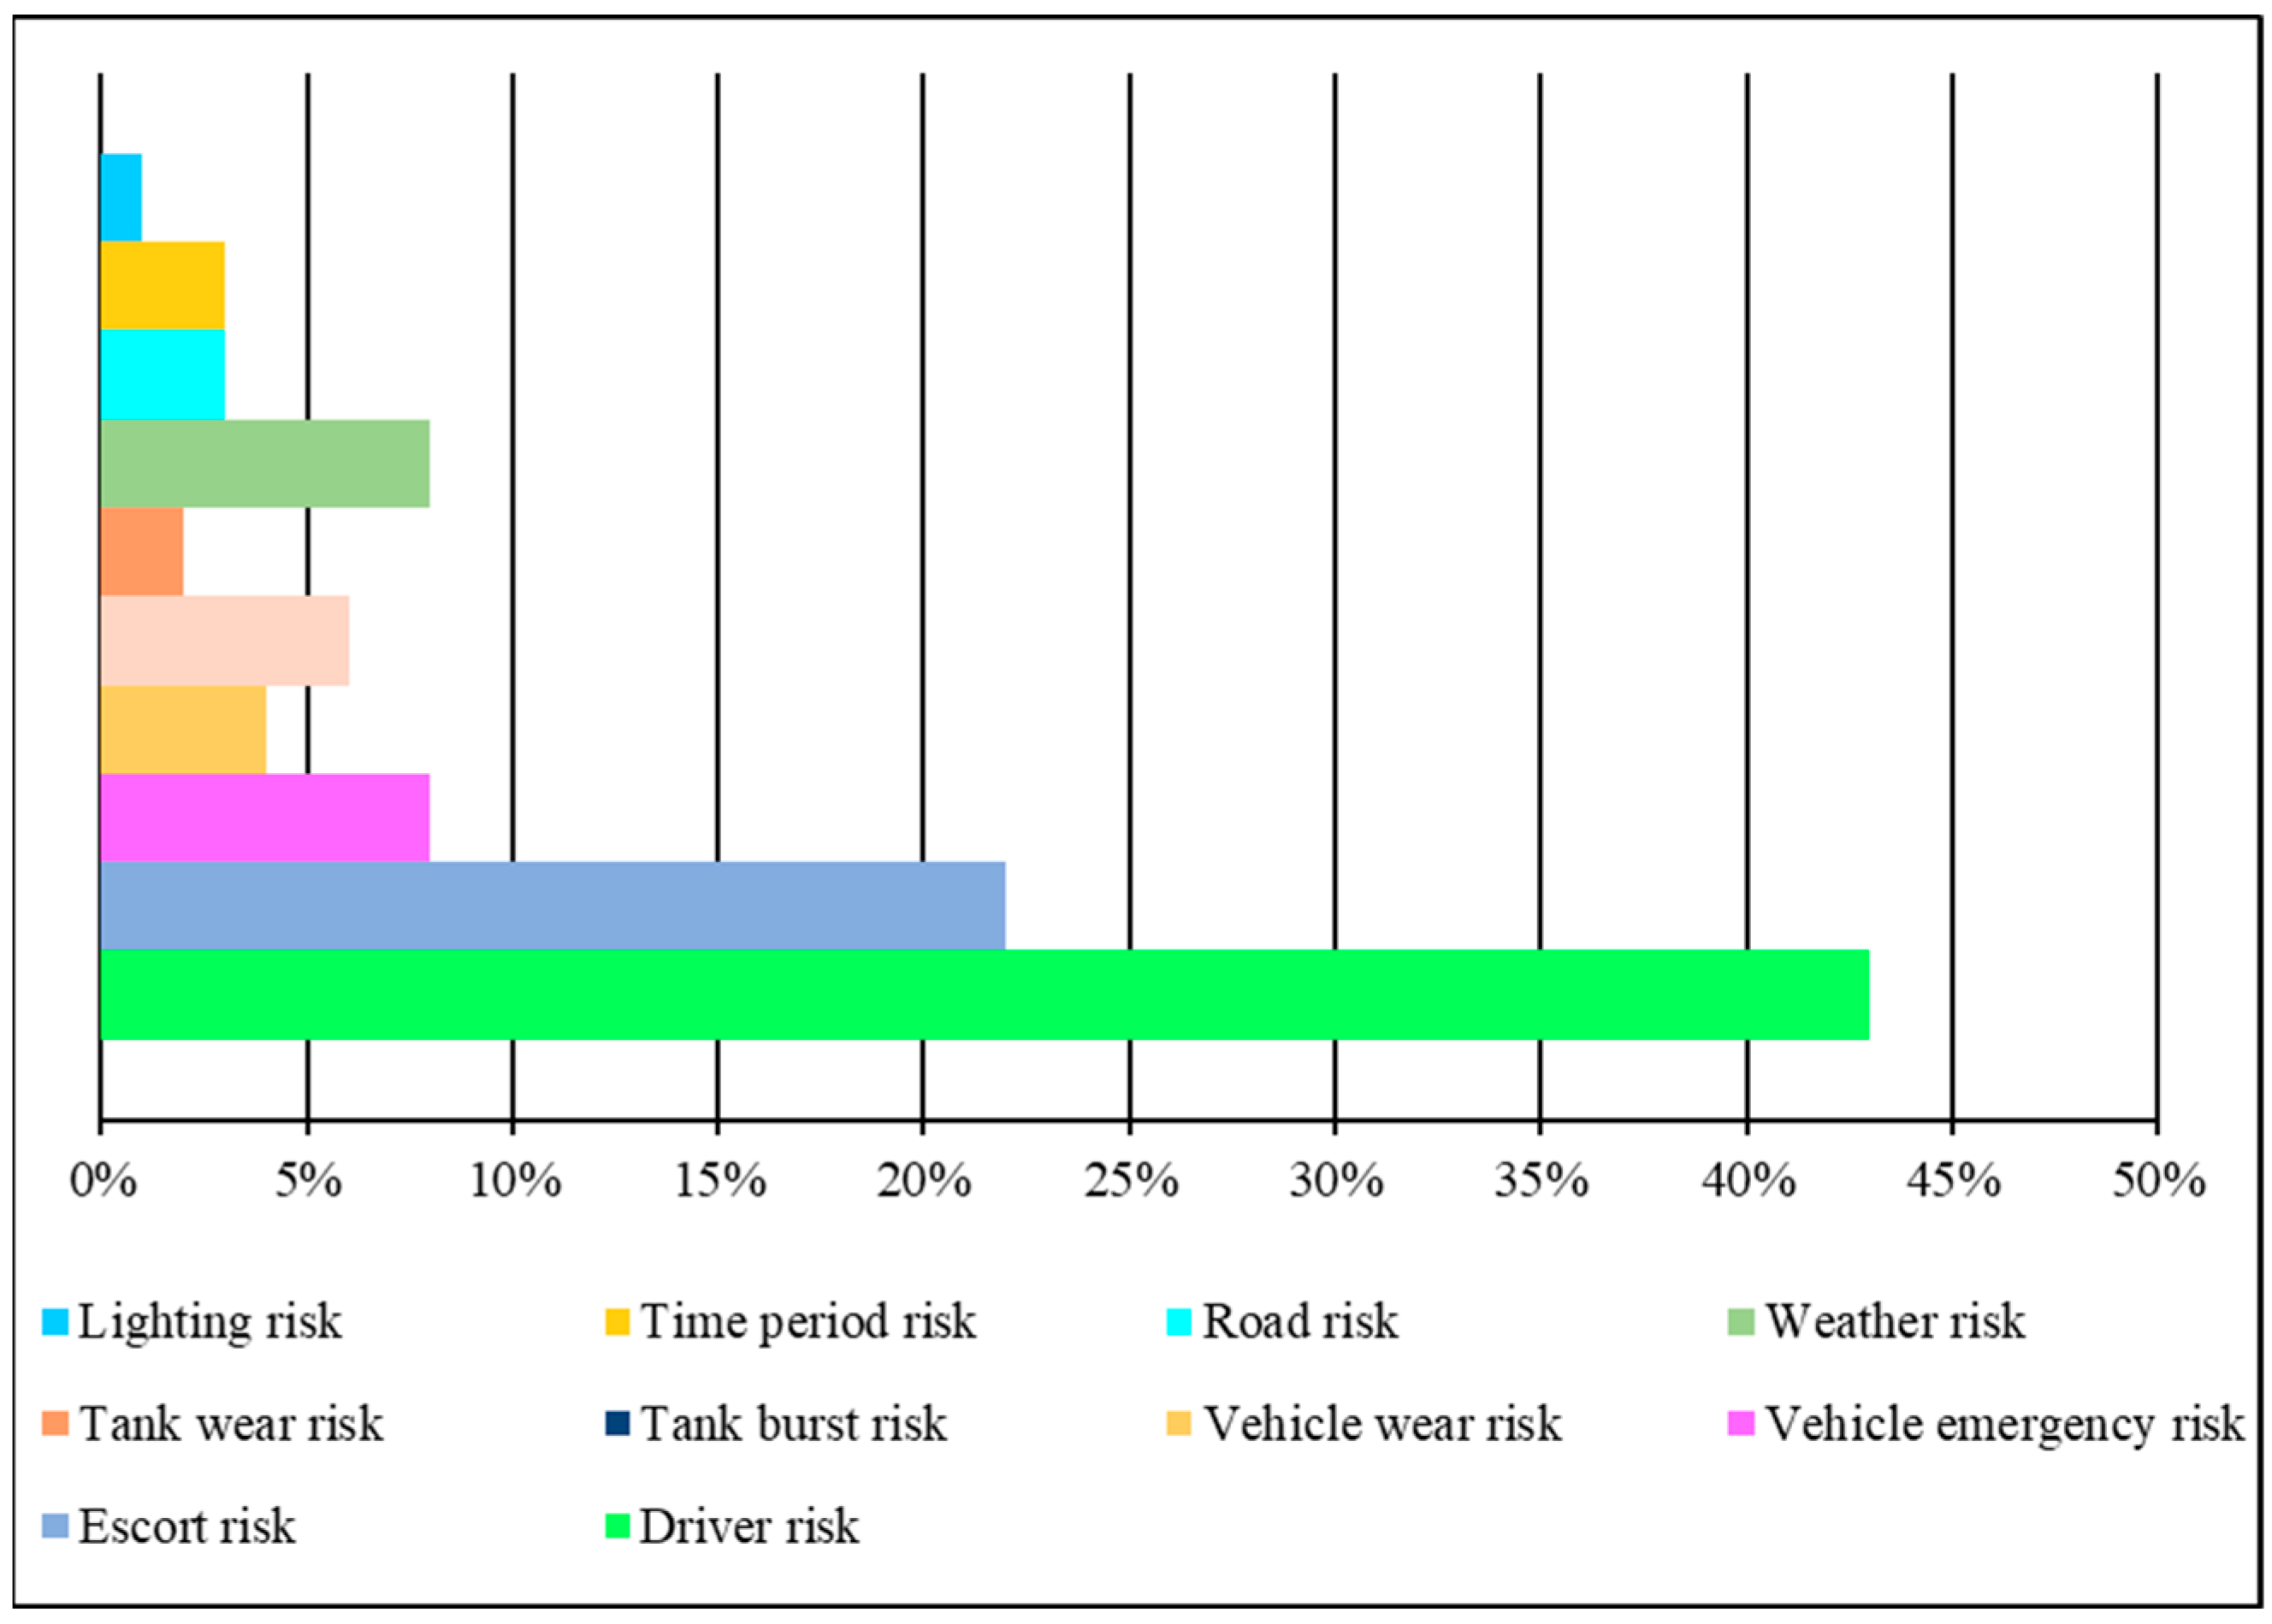
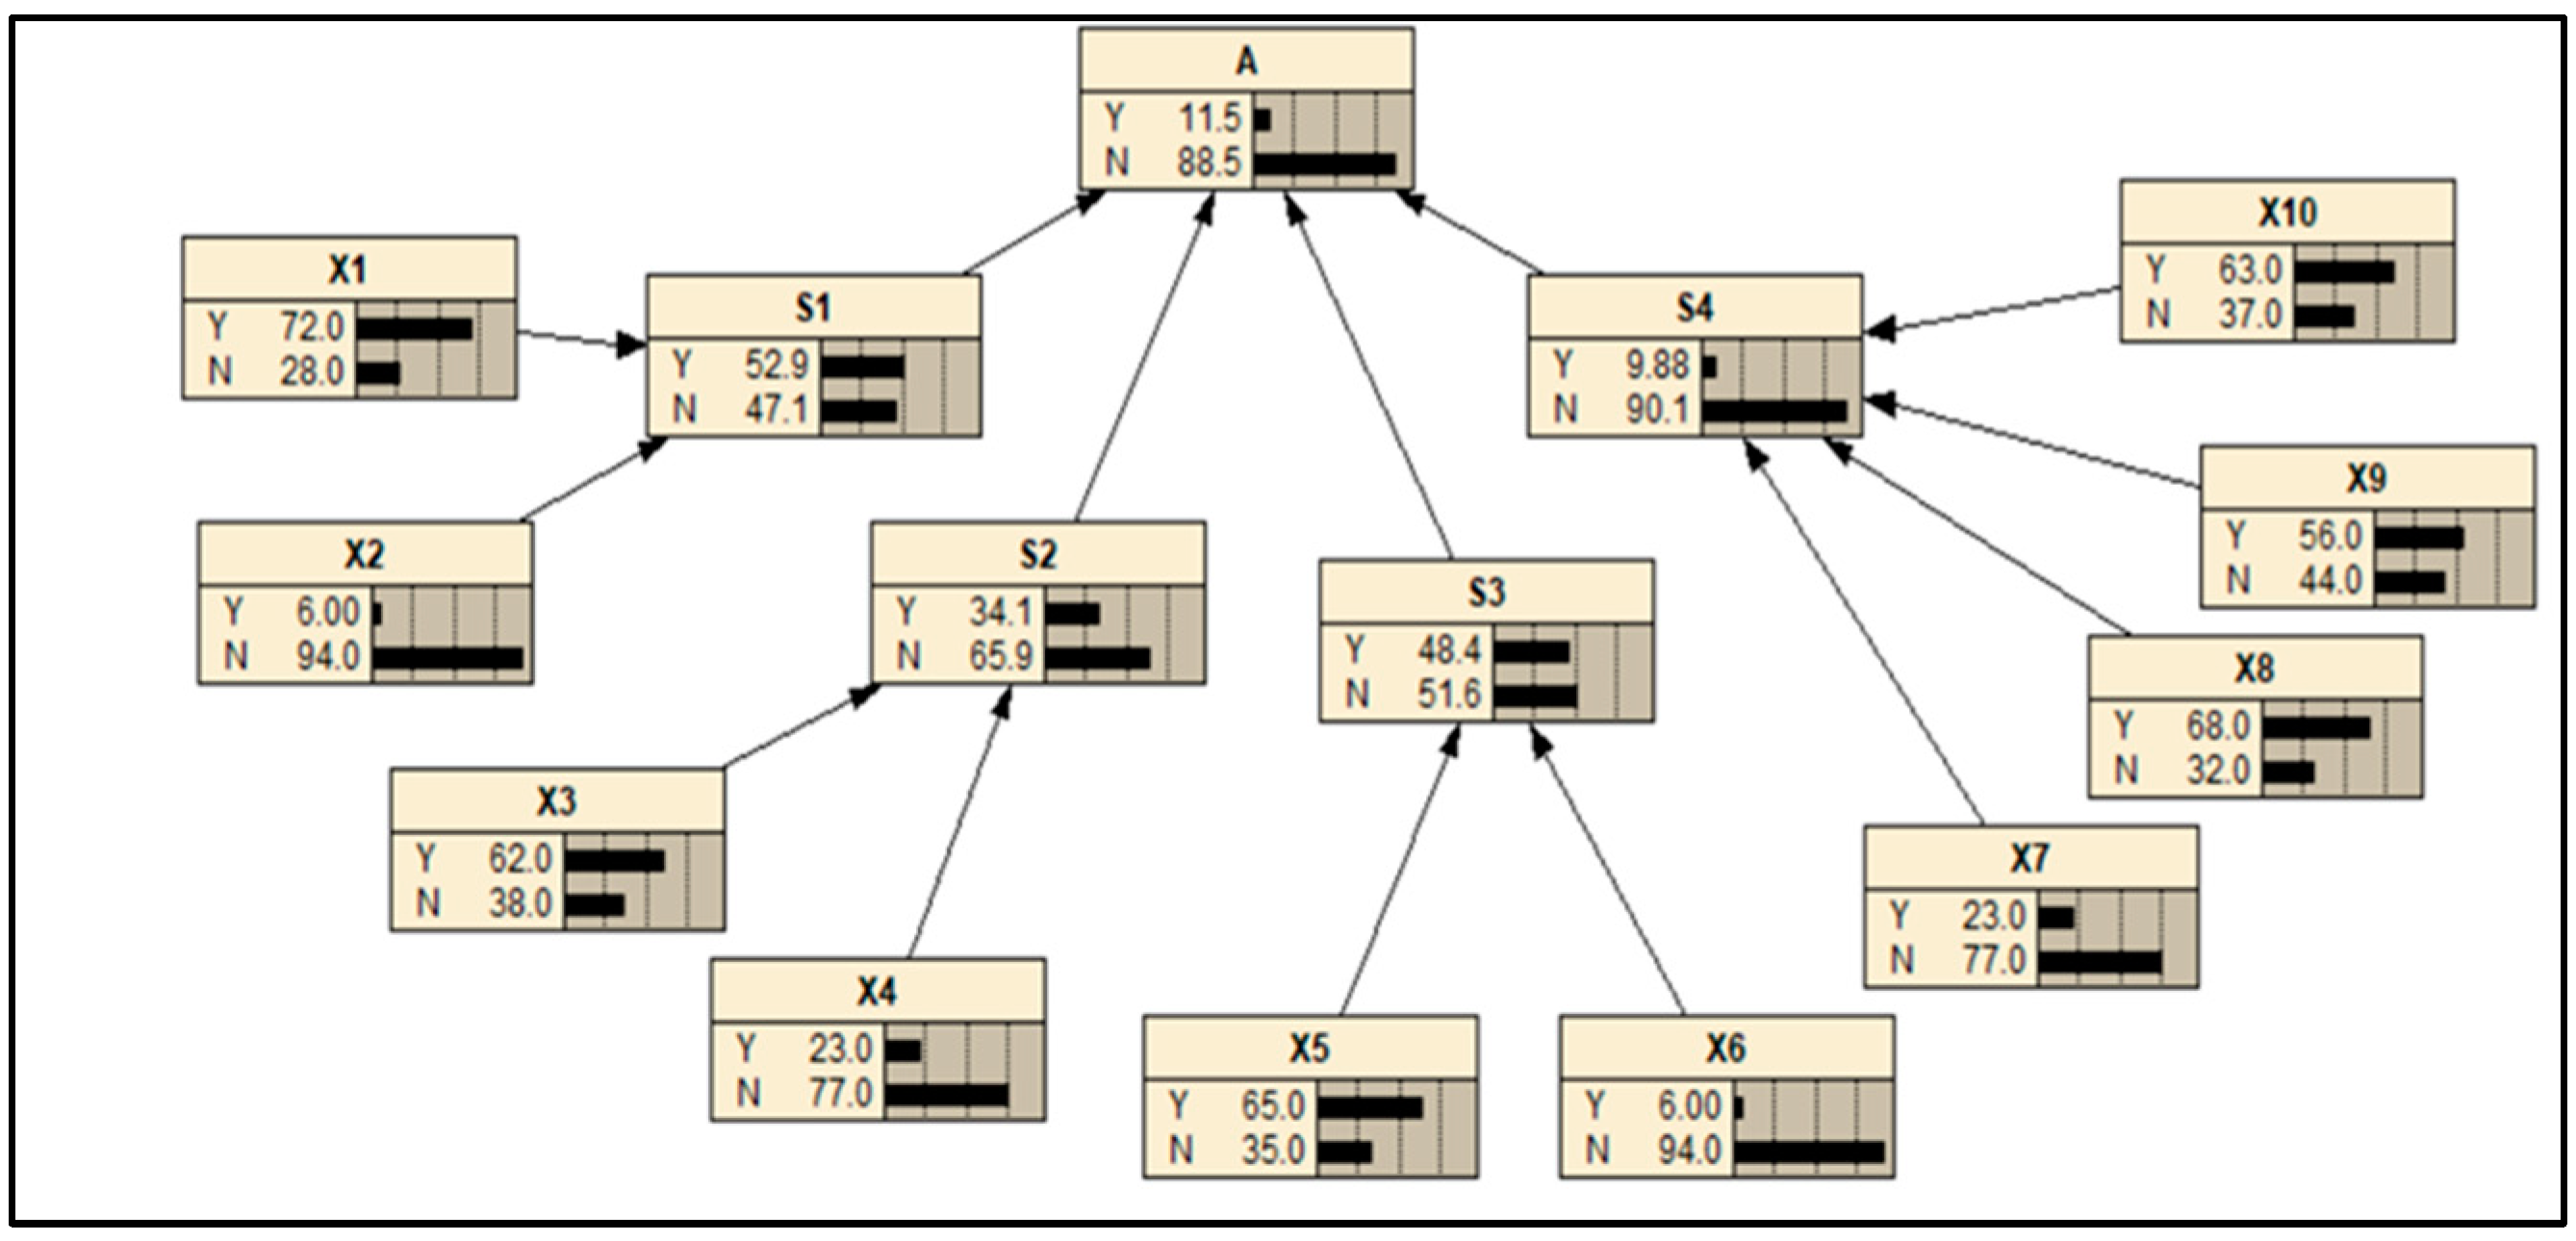
(1) This research divided the risk degree of dangerous goods transportation accidents into seven levels: very low (VL), low (L), flat low (FL), medium (M), flat high (FH), high (H), and very high (VH). (2) According to the results of the conditional probability calculation, the probability of the driver factor, vehicle emergency factor, tank emergency factor, road factor, and lighting situation occurring was high. (3) The dangerous goods transportation accidents on the cross-tributary bridges of Baiyangdian Lake were possible events, with a node A (PA) value of 0.115 and logarithmic probability P value of 4.061. The risk level was relatively high, indicating that accidents posed a potential threat to water environment and human health. (4) Vehicle emergent factors, vehicle wear factors, and weather factors had a greater impact on the occurrence of accidents, with the decreasing order of X4 > X3 > X7. (5) The combination of X1, X4, X6, and X7 contributed to an accident the most. This showed that the highest probability (0.142) of an accident occurred in the region where the driver was not in good condition, the vehicle and tank were worn, and the weather was bad. (6) When the vehicle and the tank were in good condition, the most likely combination of conditions leading to the accident was: X1, X7, X9, X10. This indicated that the probability of an accident was the highest (0.117) on the cross-tributary bridges with poor driver status, bad weather conditions, and no street lighting at night. (7) Emergency prevention and control measures proved to be effective approaches to mitigating the risk of sudden water pollution accidents.
The identification and assessment of sudden water pollution risk in Baiyangdian Lake are influenced by numerous uncertain variables. Further research is required in the following areas:
(1) To successfully build a flawless Bayesian network structure, the chosen factors for constructing the model must be refined further. Collaborative discussions among experts are necessary for the perfect determination of the Bayesian network structure. The quantitative analysis of accidents relies on accurately determining the probability of each factor in the network. This study utilized the expert consultation method to acquire the probability of each parameter. The constant revision and updating of the network should be performed by incorporating historical traffic accident data in future research.
(2) With the ongoing advancements in geographic information system technology, future studies can utilize a GIS visual operating system to establish an emergency plan GIS system for sudden water pollution incidents in Baiyangdian Lake. This system will offer spatial auxiliary decision support for the management of sudden water pollution in Baiyangdian Lake and the development of emergency measures for water pollution accidents.

Supplementary Materials

The following supporting information can be downloaded at: https://www.mdpi.com/article/10.3390/w15162993/s1, Table S1. Main risk factors and their distribution states of accident A. Figure S1. (a) Bayesian diagnosis reasoning results of dangerous goods transportation accidents 1 (b) Bayesian diagnosis reasoning results of dangerous goods transportation accidents 2 (c) Bayesian diagnosis reasoning results of dangerous goods transportation accidents 3.

Author Contributions

Methodology, C.L., Z.Y. and Y.T.; formal analysis, Z.Y., X.Y. and Z.P.; data curation, Z.Y., X.Y. and Y.T.; writing—original draft, Z.Y. and X.Y.; resources, C.L. and Y.Y.; writing—review & editing, C.L. and X.W.; validation, Q.L.; investigation, Y.W.; All authors have read and agreed to the published version of the manuscript.

Funding

This research was funded by [Joint Funds of the National Natural Science Foundation of China] grant number [U2243236], [National Science Foundation for Distinguished Young Scholars] grant number [52025092] and [Open Fund of State Key Laboratory of Remote Sensing Science] grant number [12800-310430011].

Institutional Review Board Statement

Not applicable.

Informed Consent Statement

Not applicable.

Data Availability Statement

All data included in this study are available upon request by contacting the corresponding author.

Conflicts of Interest

The authors declare that they do not have any competing interest that could have appeared to influence the work reported in this paper.

References

  1. Xiao, Y.; Huang, S.L.; Zhou, J.G.; Kong, F.Q.; Liu, M.Z.; Li, Y. Risk Assessment of Upper-Middle Reaches of Luanhe River Basin in Sudden Water Pollution Incidents Based on Control Units of Water Function Areas. Water 2018, 10, 1268. [Google Scholar] [CrossRef]
  2. Hou, D.B.; Ge, X.F.; Huang, P.J.; Zhang, G.X.; Loaiciga, H. A real-time, dynamic early-warning model based on uncertainty analysis and risk assessment for sudden water pollution accidents. Environ. Sci. Pollut. Res. 2014, 21, 8878–8892. [Google Scholar] [CrossRef] [PubMed]
  3. Zheng, H.Z.; Lei, X.H.; Shang, Y.Z.; Duan, Y.; Kong, L.Z.; Jiang, Y.Z.; Wang, H. Sudden water pollution accidents and reservoir emergency operations: Impact analysis at Danjiangkou Reservoir. Environ. Technol. 2018, 39, 787–803. [Google Scholar] [CrossRef]
  4. Zhao, Y.; Pan, Y.L.; Wang, W.S.; Guo, L. A Brain-Inspired Dynamic Environmental Emergency Response Framework for Sudden Water Pollution Accidents. Water 2021, 13, 3097. [Google Scholar] [CrossRef]
  5. Shi, B.; Jiang, J.P.; Liu, R.T.; Khan, A.U.; Wang, P. Engineering risk assessment for emergency disposal projects of sudden water pollution incidents. Environ. Sci. Pollut. Res. 2017, 24, 14819–14833. [Google Scholar] [CrossRef]
  6. He, F.; Ma, J.; Lai, Q.Y.; Shui, J.; Li, W.X. Environmental Impact Assessment of a Wharf Oil Spill Emergency on a River Water Source. Water 2023, 15, 346. [Google Scholar] [CrossRef]
  7. Li, D.Y.; Wei, Y.M.; Dong, Z.C.; Wang, C.H.; Wang, C.C. Quantitative study on the early warning indexes of conventional sudden water pollution in a plain river network. J. Clean. Prod. 2021, 303, 127067. [Google Scholar] [CrossRef]
  8. Yan, B.; Liu, Y.T.; Gao, Z.W.; Liu, D.H. Simulation of Sudden Water Pollution Accidents in Hunhe River Basin Upstream of Dahuofang Reservoir. Water 2022, 14, 925. [Google Scholar] [CrossRef]
  9. Tang, C.H.; Yi, Y.J.; Yang, Z.F.; Cheng, X. Water pollution risk simulation and prediction in the main canal of the South-to-North Water Transfer Project. J. Hydrol. 2014, 519, 2111–2120. [Google Scholar] [CrossRef]
  10. Yin, H.L.; Lin, Y.Y.; Zhang, H.J.; Wu, R.B.; Xu, Z.X. Identification of pollution sources in rivers using a hydrodynamic diffusion wave model and improved Bayesian-Markov chain Monte Carlo algorithm. Front. Environ. Sci. Eng. 2023, 17, 85. [Google Scholar] [CrossRef]
  11. Holeczek, N. Hazardous materials truck transportation problems: A classification and state of the art literature review. Transp. Res. Part D Transp. Environ. 2019, 69, 305–328. [Google Scholar] [CrossRef]
  12. Blasco, J.; Duran-Grados, V.; Hampel, M.; Moreno-Gutierrez, J. Towards an integrated environmental risk assessment of emissions from ships’ propulsion systems. Environ. Int. 2014, 66, 44–47. [Google Scholar] [CrossRef] [PubMed]
  13. Chen, L.; Habibovic, A.; Englund, C.; Voronov, A.; Walter, A.L. Coordinating dangerous goods vehicles: C-ITS applications for safe road tunnels. IEEE Int. Veh. Symposium 2015, 2015, 156–161. [Google Scholar]
  14. Yang, Y.L.; Lei, X.H.; Long, Y.; Tian, Y.; Zhang, Y.H.; Yao, Y.; Hou, X.S.; Shi, M.S.; Wang, P.W.; Zhang, C.L.; et al. A novel comprehensive risk assessment method for sudden water accidents in the Middle Route of the South-North Water Transfer Project (China). Sci. Total Environ. 2020, 698, 134167. [Google Scholar] [CrossRef] [PubMed]
  15. Xia, Q.; Wei, Q.P. Analysis on the Necessity and Reasonableness of Project Management of Dangerous Cargo Declaration. Aebmr. Adv. Econ. 2017, 26, 547–551. [Google Scholar]
  16. Hua, W.Y.; Chen, J.H.; Qin, Q.D.; Wan, Z.; Song, L. Causation analysis and governance strategy for hazardous cargo accidents at ports: Case study of Tianjin Port’s hazardous cargo explosion accident. Mar. Pollut. Bull. 2021, 173, 113053. [Google Scholar] [CrossRef]
  17. Stojanovic, N.; Boskovic, B.; Petrovic, M.; Grujic, I.; Abdullah, O.I. The impact of accidents during the transport of dangerous good, on people, the environment, and infrastructure and measures for their reduction: A review. Environ. Sci. Pollut. Res. 2023, 30, 32288–32300. [Google Scholar] [CrossRef]
  18. Li, D.Y.; Dong, Z.C.; Shi, L.Y.; Liu, J.T.; Zhu, Z.Y.; Xu, W. Risk Probability Assessment of Sudden Water Pollution in the Plain River Network Based on Random Discharge from Multiple Risk Sources. Water Resour. Manag. 2019, 33, 4051–4065. [Google Scholar] [CrossRef]
  19. Li, D.Y.; Dong, Z.C.; Wang, C.H.; Liu, J.T.; Yao, H.Y. Calculation Method for the Early Warning Index of Sudden Water Pollution Based on the Linear Variation Assumption of the Substance Concentration in the River Network. Water Resour. Manag. 2020, 34, 2821–2835. [Google Scholar] [CrossRef]
  20. Wu, W.; Ren, J.C.; Zhou, X.D.; Wang, J.W.; Guo, M.J. Identification of source information for sudden water pollution incidents in rivers and lakes based on variable-fidelity surrogate-DREAM optimization. Environ. Modell. Softw. 2020, 133, 104811. [Google Scholar] [CrossRef]
  21. Cozzani, V.; Bonvicini, S.; Spadolli, G.; Zanelli, S. Hazmat transport: A methodological framework for the risk analysis of marshalling yards. J. Hazard. Mater. 2007, 147, 412–423. [Google Scholar] [CrossRef] [PubMed]
  22. Breton, T.; Sanchez-Gheno, J.C.; Alamilla, J.L.; Alvarez-Ramirez, J. Identification of failure type in corroded pipelines: A Bayesian probabilistic approach. J. Hazard. Mater. 2010, 179, 628–634. [Google Scholar] [CrossRef] [PubMed]
  23. Khan, R.U.; Yin, J.B.; Mustafa, F.S.; Anning, N. Risk assessment for berthing of hazardous cargo vessels using Bayesian networks. Ocean Coast. Manag. 2021, 210, 105673. [Google Scholar] [CrossRef]
  24. Akhavan, M.; Sebt, M.V.; Ameli, M. Risk assessment modeling for knowledge based and startup projects based on feasibility studies: A Bayesian network approach. Knowl.-Based Syst. 2021, 222, 106992. [Google Scholar] [CrossRef]
  25. Tang, C.H.; Yi, Y.J.; Yang, Z.F.; Sun, J. Risk forecasting of pollution accidents based on an integrated Bayesian Network and water quality model for the South to NorthWater Transfer Project. Ecol. Eng. 2016, 96, 109–116. [Google Scholar] [CrossRef]
  26. Ren, J.; Wang, X.; Li, G.F. Bayesian Method for Water Quality Emergency Monitoring in Environmental Pollution Accident Disposal. Big Data 2023, 11, 117–127. [Google Scholar] [CrossRef]
  27. Liu, Y.G.; Yang, Y.X.; Xu, C.D. Risk Evaluation of Water Pollution in the Middle Catchments of Weihe River. J. Residuals Sci. Technol. 2015, 12, S133–S136. [Google Scholar] [CrossRef] [PubMed]
  28. Li, D.Y.; Shi, L.Y.; Dong, Z.C.; Liu, J.T.; Xu, W. Risk analysis of sudden water pollution in a plain river network system based on fuzzy-stochastic methods. Stoch. Environ. Res. Risk Assess. 2019, 33, 359–374. [Google Scholar] [CrossRef]
  29. Zhang, H.; Li, W.J.; Miao, P.P.; Sun, B.W.; Kong, F.Q. Risk grade assessment of sudden water pollution based on analytic hierarchy process and fuzzy comprehensive evaluation. Environ. Sci. Pollut. Res. 2020, 27, 469–481. [Google Scholar] [CrossRef]
  30. Guan, X.Y.; Ren, X.Q.; Tao, Y.; Chang, X.M.; Li, B. Study of the Water Environment Risk Assessment of the Upper Reaches of the Baiyangdian Lake, China. Water 2022, 14, 2557. [Google Scholar] [CrossRef]
  31. Chen, Q.Y.; Liu, J.L.; Ho, K.C.; Yang, Z.F. Development of a relative risk model for evaluating ecological risk of water environment in the Haihe River Basin estuary area. Sci. Total Environ. 2012, 420, 79–89. [Google Scholar] [CrossRef] [PubMed]
  32. Liu, J.; Liu, R.Z.; Yang, Z.F.; Kuikka, S. Quantifying and predicting ecological and human health risks for binary heavy metal pollution accidents at the watershed scale using Bayesian Networks. Environ. Pollut. 2021, 269, 116125. [Google Scholar] [CrossRef]
  33. Hou, W.T.; Ding, M.F.; Li, X.H.; Zhou, X.H.; Zhu, Q.; Varela-Ramirez, A.; Yi, C. Comparative evaluation of cardiovascular risks among nine FDA-approved VEGFR-TKIs in patients with solid tumors: A Bayesian network analysis of randomized controlled trials. J. Cancer Res. Clin. 2021, 147, 2407–2420. [Google Scholar] [CrossRef] [PubMed]
  34. Wang, G.W.; Lv, C.C.; Gu, C.K.; Yu, Y.; Yang, Z.L.; Zhang, Z.X.; Tang, C.Y. Pollutants Source Assessment and Load Calculation in Baiyangdian Lake Using Multi-Model Statistical Analysis. Water 2022, 14, 3386. [Google Scholar] [CrossRef]
  35. Yao, X.; Wang, Z.; Liu, W.; Zhang, Y.; Wang, T.H.; Li, Y.L. Pollution in river tributaries restricts the water quality of ecological water replenishment in the Baiyangdian watershed, China. Environ. Sci. Pollut. Res. 2023, 30, 51556–51570. [Google Scholar] [CrossRef] [PubMed]
  36. Zywiec, W.J.; Mazzuchi, T.A.; Sarkani, S. Analysis of process criticality accident risk using a metamodel-driven Bayesian network. Reliab. Eng. Syst. Saf. 2021, 207, 107322. [Google Scholar] [CrossRef]
  37. Yin, B.T.; Li, B.Y.; Liu, G.; Wang, Z.Y.; Sun, B.J. Quantitative risk analysis of offshore well blowout using bayesian network. Saf. Sci. 2021, 135, 105080. [Google Scholar] [CrossRef]
  38. Huang, S.Q.; Wang, H.M.; Xu, Y.J.; She, J.W.; Huang, J. Key Disaster-Causing Factors Chains on Urban Flood Risk Based on Bayesian Network. Land 2021, 10, 210. [Google Scholar] [CrossRef]
  39. Zhu, S.M.; Li, J.; Zhao, X.Y. Comparative risk of new-onset hyperkalemia for antihypertensive drugs in patients with diabetic nephropathy: A Bayesian network meta-analysis. Int. J. Clin. Pract. 2021, 75, e13940. [Google Scholar] [CrossRef]
  40. Roostaei, J.; Colley, S.; Mulhern, R.; May, A.A.; Gibson, J.M. Predicting the risk of GenX contamination in private well water using a machine-learned Bayesian network model. J. Hazard. Mater. 2021, 411, 125075. [Google Scholar] [CrossRef]
  41. Liu, M.; Liu, Z.Z.; Chu, F.; Zheng, F.F.; Chu, C.B. A new robust dynamic Bayesian network approach for disruption risk assessment under the supply chain ripple effect. Int. J. Prod. Res. 2021, 59, 265–285. [Google Scholar] [CrossRef]
  42. Liu, Z.K.; Ma, Q.; Cai, B.P.; Liu, Y.H.; Zheng, C. Risk assessment on deepwater drilling well control based on dynamic Bayesian network. Process Saf. Environ. Prot. 2021, 149, 643–654. [Google Scholar] [CrossRef]
  43. Siu, N.O.; Kelly, D.L. Bayesian parameter estimation in probabilistic risk assessment. Reliab. Eng. Syst. Saf. 1998, 62, 89–116. [Google Scholar] [CrossRef]
  44. Liedloff, A.C.; Woodward, E.L.; Harrington, G.A.; Jackson, S. Integrating indigenous ecological and scientific hydro-geological knowledge using a Bayesian Network in the context of water resource development. J. Hydrol. 2013, 499, 177–187. [Google Scholar] [CrossRef]
  45. Qazi, A.; Simsekler, M.C.E. Assessment of humanitarian crises and disaster risk exposure using data-driven Bayesian Networks. Int. J. Disaster Risk Reduct. 2021, 52, 101938. [Google Scholar] [CrossRef]
  46. Heckerman, D.; Geiger, D.; Chickering, D.M. Learning Bayesian Networks—The Combination of Knowledge and Statistical-Data. Mach. Learn. 1995, 20, 197–243. [Google Scholar] [CrossRef]
  47. Yunana, D.; Maclaine, S.; Tng, K.H.; Zappia, L.; Bradley, I.; Roser, D.; Leslie, G.; MacIntyre, C.R.; Le-Clech, P. Developing Bayesian networks in managing the risk of Legionella colonisation of groundwater aeration systems. Water Res. 2021, 193, 116854. [Google Scholar] [CrossRef]
  48. Kaikkonen, L.; Parviainen, T.; Rahikainen, M.; Uusitalo, L.; Lehikoinen, A. Bayesian Networks in Environmental Risk Assessment: A Review. Integr. Environ. Assess. Manag. 2021, 17, 62–78. [Google Scholar] [CrossRef]
  49. Mitchell, C.J.; Lawrence, E.; Chu, V.R.; Harris, M.J.; Landis, W.G.; von Stackelberg, K.E.; Stark, J.D. Integrating Metapopulation Dynamics into a Bayesian Network Relative Risk Model: Assessing Risk of Pesticides to Chinook Salmon (Oncorhynchus tshawytscha) in an Ecological Context. Integr. Environ. Assess. Manag. 2021, 17, 95–109. [Google Scholar] [CrossRef]
  50. Xie, X.L.; Zuo, J.X.; Xie, B.Q.; Dooling, T.A.; Mohanarajah, S. Bayesian network reasoning and machine learning with multiple data features: Air pollution risk monitoring and early warning. Nat. Hazards 2021, 107, 2555–2572. [Google Scholar] [CrossRef]
  51. Carriger, J.F.; Parker, R.A. Conceptual Bayesian networks for contaminated site ecological risk assessment and remediation support. J. Environ. Manag. 2021, 278, 111478. [Google Scholar] [CrossRef] [PubMed]
  52. Parviainen, T.; Goerlandt, F.; Helle, I.; Haapasaari, P.; Kuikka, S. Implementing Bayesian networks for ISO 31000:2018-based maritime oil spill risk management: State-of-art, implementation benefits and challenges, and future research directions. J. Environ. Manag. 2021, 278, 111520. [Google Scholar] [CrossRef] [PubMed]
  53. Michie, S.; Richardson, M.; Johnston, M.; Abraham, C.; Francis, J.; Hardeman, W.; Eccles, M.P.; Cane, J.; Wood, C.E. The Behavior Change Technique Taxonomy (v1) of 93 Hierarchically Clustered Techniques: Building an International Consensus for the Reporting of Behavior Change Interventions. Ann. Behav. Med. 2013, 46, 81–95. [Google Scholar] [CrossRef]
  54. Dalkey, N.; Helmer, O. An Experimental Application of the Delphi Method to the Use of Experts. Manag. Sci. 1963, 9, 458–467. [Google Scholar] [CrossRef]
  55. Chen, C.T.; Lin, C.T.; Huang, S.F. A fuzzy approach for supplier evaluation and selection in supply chain management. Int. J. Prod. Econ. 2006, 102, 289–301. [Google Scholar] [CrossRef]
  56. Chang, D.Y. Applications of the extent analysis method on fuzzy AHP. Eur. J. Oper. Res. 1996, 95, 649–655. [Google Scholar] [CrossRef]
  57. Yang, M.S.; Ko, C.H. On a class of fuzzy c-numbers clustering procedures for fuzzy data. Fuzzy Sets Syst. 1996, 84, 49–60. [Google Scholar] [CrossRef]
  58. Vanlaarhoven, P.J.M.; Pedrycz, W. A Fuzzy Extension of Saatys Priority Theory. Fuzzy Sets Syst. 1983, 11, 229–241. [Google Scholar] [CrossRef]
  59. Wang, Y.M.; Luo, Y.; Hua, Z. On the extent analysis method for fuzzy AHP and its applications. Eur. J. Oper. Res. 2008, 186, 735–747. [Google Scholar] [CrossRef]
  60. Hsieh, H.F.; Shannon, S.E. Three approaches to qualitative content analysis. Qual. Health Res. 2005, 15, 1277–1288. [Google Scholar] [CrossRef]
  61. Dlamini, W.M. A Bayesian belief network analysis of factors influencing wildfire occurrence in Swaziland. Environ. Modell. Softw. 2010, 25, 199–208. [Google Scholar] [CrossRef]
  62. Hamilton, D.P.; Schladow, S.G. Prediction of water quality in lakes and reservoirs. 1. Model description. Ecol. Model. 1997, 96, 91–110. [Google Scholar] [CrossRef]
  63. Landis, W.G. The Origin, Development, Application, Lessons Learned, and Future Regarding the Bayesian Network Relative Risk Model for Ecological Risk Assessment. Integr. Environ. Assess. Manag. 2021, 17, 79–94. [Google Scholar] [CrossRef] [PubMed]
  64. Piffady, J.; Carluer, N.; Gouy, V.; le Henaff, G.; Tormos, T.; Bougon, N.; Adoir, E.; Mellac, K. ARPEGES: A Bayesian Belief Network to Assess the Risk of Pesticide Contamination for the River Network of France. Integr. Environ. Assess. Manag. 2021, 17, 188–201. [Google Scholar] [CrossRef] [PubMed]
  65. Moe, S.J.; Carriger, J.F.; Glendell, M. Increased Use of Bayesian Network Models Has Improved Environmental Risk Assessments. Integr. Environ. Assess. Manag. 2021, 17, 53–61. [Google Scholar] [CrossRef] [PubMed]
  66. Sahlin, U.; Helle, I.; Perepolkin, D. “This Is What We Don’t Know”: Treating Epistemic Uncertainty in Bayesian Networks for Risk Assessment. Integr. Environ. Assess. Manag. 2021, 17, 221–232. [Google Scholar] [CrossRef] [PubMed]
  67. Liu, K.F.; Yang, L.Z.; Li, M. Application of Cloud Model and Bayesian Network to Piracy Risk Assessment. Math. Probl. Eng. 2021, 2021, 1–14. [Google Scholar] [CrossRef]
  68. Borgheipour, H.; Tehrani, G.M.; Eskandari, T.; Mohammadieh, O.C.; Mohammadfam, I. Dynamic risk analysis of hydrogen gas leakage using Bow-tie technique and Bayesian network. Int. J. Environ. Sci. Technol. 2021, 18, 3613–3624. [Google Scholar] [CrossRef]
  69. Song, Y.C.; Kou, S.Y.; Wang, C. Modeling crash severity by considering risk indicators of driver and roadway: A Bayesian network approach. J. Saf. Res. 2021, 76, 64–72. [Google Scholar] [CrossRef] [PubMed]
  70. Zeng, R.; Jiang, Y.T.; Chen, T.W.; Guo, D.D.; Li, R. Longitudinal associations of sleep duration and sleep quality with coronary heart disease risk among adult population: Classical meta-analysis and Bayesian network meta-analysis. Sleep Biol. Rhythm. 2021, 19, 265–276. [Google Scholar] [CrossRef]
  71. Sanuy, M.; Jimenez, J.A. Probabilistic characterisation of coastal storm-induced risks using Bayesian networks. Nat. Hazards Earth Syst. Sci. 2021, 21, 219–238. [Google Scholar] [CrossRef]
  72. Yang, L.; Li, K.P.; Song, G.Z.; Khan, F. Dynamic Railway Derailment Risk Analysis with Text-Data-Based Bayesian Network. Appl. Sci. 2021, 11, 994. [Google Scholar] [CrossRef]
  73. Li, Z.; Hu, S.P.; Gao, G.P.; Xi, Y.T.; Fu, S.S.; Yao, C.Y. Risk Reasoning from Factor Correlation of Maritime Traffic under Arctic Sea Ice Status Association with a Bayesian Belief Network. Sustainability 2021, 13, 147. [Google Scholar] [CrossRef]
  74. Machado, E.R.; do Valle, R.F.; Pissarra, T.C.T.; Siqueira, H.E.; Fernandes, L.F.S.; Pacheco, F.A.L. Diagnosis on Transport Risk Based on a Combined Assessment of Road Accidents and Watershed Vulnerability to Spills of Hazardous Substances. Int. J. Environ. Res. Public Health 2018, 15, 2011. [Google Scholar] [CrossRef] [PubMed]
  75. Xu, B.; Hu, J.; Hu, T.; Wang, F.L.; Luo, K.Y.; Wang, Q.F.; He, X.Q. Quantitative assessment of seismic risk in hydraulic fracturing areas based on rough set and Bayesian network: A case analysis of Changning shale gas development block in Yibin City, Sichuan Province, China. J. Petrol. Sci. Eng. 2021, 200, 108226. [Google Scholar] [CrossRef]
  76. Khan, R.U.; Yin, J.B.; Mustafa, F.S. Accident and pollution risk assessment for hazardous cargo in a port environment. PLoS ONE 2021, 16, e0252732. [Google Scholar] [CrossRef]
  77. Li, C.; Tian, Y.; Zhao, Y.; Wang, X. Research progress on risk assessment and emergency countermeasures of sudden water pollution. J. Agro-Environ. Sci. 2020, 39, 1161–1167. [Google Scholar]
  78. Zhao, Y.B.; Zhang, K.; Xu, X.T.; Shen, H.Z.; Zhu, X.; Zhang, Y.X.; Hu, Y.T.; Shen, G.F. Substantial Changes in Nitrogen Dioxide and Ozone after Excluding Meteorological Impacts during the COVID-19 Outbreak in Mainland China. Environ. Sci. Technol. Lett. 2020, 7, 402–408. [Google Scholar] [CrossRef]
  79. Linares, C.; Diaz, J.; Negev, M.; Martinez, G.S.; Debono, R.; Paz, S. Impacts of climate change on the public health of the Mediterranean Basin population—Current situation, projections, preparedness and adaptation. Environ. Res. 2020, 182, 109107. [Google Scholar] [CrossRef]
  80. Ding, L.; Chen, K.L.; Liu, T.; Cheng, S.G.; Wang, X. Spatial-Temporal Hotspot Pattern Analysis of Provincial Environmental Pollution Incidents and Related Regional Sustainable Management in China in the Period 1995–2012. Sustainability 2015, 7, 14385–14407. [Google Scholar] [CrossRef]
  81. Yang, H.D.; Shao, D.G.; Lu, B.Y. A New Traceability Method for Sudden Water Pollution Accidents. Adv. Mater. Res. 2013, 807–809, 1570–1574. [Google Scholar] [CrossRef]
  82. Wang, H.T.; Jia, X.B.; Liu, D.M.; Wang, Z.W.; Pan, Y.H. Emergency treatment measures for sudden pollution incidents in source water with some contaminants: A review. Adv. Mater. Res. 2013, 781–784, 1950–1953. [Google Scholar] [CrossRef]
  83. Pan, F.H.; Wang, Y.B.; Zhang, X.X. Emergency measure of soft isolation controlling pollution diffusion response to sudden water pollution accidents. Water Sci. Technol. 2019, 80, 1238–1248. [Google Scholar] [CrossRef] [PubMed]
Figure 1. Schematic diagram of this work.
Water 15 02993 g001
Figure 2. The Baiyangdian Lake Basin map.
Water 15 02993 g002
Figure 3. Bayesian network structure of the A accident.
Water 15 02993 g003
Figure 4. Dangerous goods leakage route of the cross-tributary bridges of Baiyangdian Lake.
Water 15 02993 g004
Figure 5. Influence factors of dangerous goods transportation accidents.
Water 15 02993 g005
Figure 6. Bayesian causal reasoning results of dangerous goods transportation accidents.
Water 15 02993 g006
Table 1. The probability level and risk level of natural probability (PN) and logarithmic probability (P).
Probability LevelPN IntervalP IntervalDescriptionRisk Level
50.3–15.0–4.5ProbablyHigh
40.03–0.34.5–3.5MayHigher
30.003–0.033.5–2.5OccasionallyMedium
20.0003–0.0032.5–1.5Not too possibleLower
1<0.0003<1.5ImpossibleLow
Table 2. The relationship of risk level and triangular fuzzy numbers.
Risk LevelTriangular Fuzzy NumberProbability Range
Very low (VL)(0.0, 0.0, 0.1)<1%
Low (L)(0.0, 0.1, 0.3)1~10%
Flat low (FL)(0.0, 0.1, 0.3)10~33%
Medium (M)(0.3, 0.5, 0.7)33~66%
Flat high (FH)(0.5, 0.7, 0.9)66~90%
High (H)(0.7, 0.9, 1.0)90~99%
Very high (VH)(0.9, 1.0, 1.0)>99%
Table 3. Scenario setting parameters.
Scene SettingOil Spill (T)Density (kg/m3)Leak Time (h)
Scenario 1107220.5
Scenario 2257220.5
Table 4. Possibility of evidence node occurrence by the expert fuzzy language method.
Evidence NodeExpert Advice
X1FHHMFHFHFHH
X2LVLVLLLLL
X3MVHMMMHM
X4FLLMLFLMFL
X5FLMVHFHHFHM
X6VLLLLLVLL
X7FLLMFLMLFL
X8FHVHMHLFHH
X9LMLFHHHFH
X10HMFHMMHM
Table 5. Statistical table of triangular fuzzy numbers appraised by experts.
Risk LevelTriangular Fuzzy NumberX1X2X3X4X5X6X7X8X9X10
Very low (VL)(0.0, 0.0, 0.1)/5///2////
Low (L)(0.0, 0.1, 0.3)/2/2/5212/
Relatively low (FL)(0.0, 0.1, 0.3)///31/3///
Medium (M)(0.3, 0.5, 0.7)1/522/2114
Relatively high (FH)(0.5, 0.7, 0.9)4///2//221
High (H)(0.7, 0.9, 1.0)2/1/1//222
Very high (VH)(0.9, 1.0, 1.0)//1/1//1//
Table 6. Average triangular fuzzy numbers and the conditional probability of evidence nodes.
Evidence NodeAverage Triangular Fuzzy NumberN (Does Not Happen)Y (Happen)
X1(0.53, 0.73, 0.90)0.280.72
X2(0.0, 0.03, 0.16)0.940.06
X3(0.44, 0.63, 0.79)0.380.62
X4(0.09, 0.21, 0.41)0.770.23
X5(0.47, 0.66, 0.81)0.35 0.65
X6(0.0, 0.03, 0.16)0.940.06
X7(0.09, 0.21, 0.41)0.770.23
X8(0.51, 0.69, 0.83)0.320.68
X9(0.39, 0.56, 0.73)0.440.56
X10(0.44, 0.64, 0.81)0.370.63
Table 7. Prediction of pollutant concentration in the Nanliuzhuang section.
Scenario SettingOil Leakage Volume (T)Density (kg/m3)Leakage Time (h)
Scenario 1106680.5
Scenario 2256680.5
Table 8. Emergency prevention index system for sudden water pollution incidents.
Target LayerFirst Level IndexSecond Level Index
Emergency prevention index systemWarning source indexAccident type
Pollutant type
Occurrence region
Early warning indexAffected population
Affected area
Influence duration
Region sort
The maximum exceeding multiple of water quality
Disclaimer/Publisher’s Note: The statements, opinions and data contained in all publications are solely those of the individual author(s) and contributor(s) and not of MDPI and/or the editor(s). MDPI and/or the editor(s) disclaim responsibility for any injury to people or property resulting from any ideas, methods, instructions or products referred to in the content.

