Abstract
The cultivated land area in China is approaching the red line of farmland protection. The newly reclaimed land will become a vital reserved land resource, and it possesses a large exploratory potential. Newly reclaimed soil usually has low productivity with poor physical and chemical properties as well as weak fertility, and it is prone to serious soil erosion. The effects of corn straw biochar and rice husk biochar (at the mass ratio of 2%, 4%, and 8%) on the soil infiltration process and soil moisture distribution in the soil profile were studied. The results showed that the infiltration duration was prolonged, and the wetting front migration distance and infiltration rate were decreased under biochar addition treatments, except under the low addition rate for rice husk biochar. The Philip model and Kostiakov model accurately described the water infiltration process of the newly reclaimed soil with both kinds of biochar. The two kinds of biochar used in this study affected both the initial infiltration rates and stable infiltration rates, and water infiltration was more sensitive to rice husk biochar and its addition rate. The moisture in the soil profile after infiltration was simulated using a one-dimensional algebraic model. The surface soil moisture was improved with both kinds of biochar addition, and the water retention ability was enhanced with an increased biochar addition rate. In conclusion, corn straw biochar with a high addition rate is beneficial for inhibiting soil water infiltration and improving weak water retention ability in the newly reclaimed area, which is a recommended choice for efficient soil construction in newly reclaimed land.
1. Introduction
According to the data of the third National Land Survey, the cultivated land in China decreased by 7.33 million ha by the end of 2019. Compared with the 135.33 million ha of cultivated land at the end of 2009, there was an average annual decrease of more than 0.67 million ha, and the cultivated land area was approaching the red line of farmland protection at 120 million ha [1]. Newly reclaimed land, as a vital reserved land resource, possesses large exploratory potential. However, newly reclaimed soil usually has low productivity with poor physical and chemical properties, serious soil erosion, and weak fertility. Therefore, it is of great scientific significance to improve its water and fertilizer conservation ability, thereby increasing the cultivated land resources, protecting food security, and guaranteeing the sustainable development of agriculture. Biochar, also called black gold for agriculture, is a carbon-rich material made from organic waste under a no-oxygen environment and is known to contain 40−75% carbon. Biochar is mainly composed of C, H, O, and N, followed by ash (such as K, Ca, Na, Mg, Si, etc.) [2,3]. It is widely used in agriculture and has a vital role in soil improvement. The biochar, bacillus subtilis, and a water-retaining agent were used for soil amendment in the Loess Plateau. The results showed that this biochar had the best improvement effects, and there was a great application potential for biochar to improve the poor soil water holding capacity and low fertility of the Loess Plateau’s soil [4]. A study by Yang et al. revealed that biochar addition significantly improved soil organic carbon storage and stimulated root density and apple yield. Overall, the economic benefit of applying biochar was positive among all the soil amendments [5]. It can be seen that biochar is an economical and convenient soil amendment as a recycled product of agricultural and forestry wastes. Therefore, it is with urgently necessary to study biochar application in newly reclaimed land.
It has been reported that a clear understanding of water movement and distribution enhances soil moisture retention and water use efficiency, and further benefits dryland agriculture [6]. Infiltration is the critical factor that induces soil water loss and determines the soil water balance as well as the efficient utilization of irrigation water [7]. Therefore, it is necessary to determine the infiltration process of newly reclaimed land with soil amendment, which is important for its highly efficient utilization. Li et al. determined that the infiltration capacity of clay loam can be significantly improved by adding biochar (at a ratio of 4%) to the surface soil, but biochar addition had no significant effect on soil evaporation [8]. The study by Zhan et al. showed that the application of potato stem biochar to a chestnut field significantly improved soil infiltration capacity [9]. Wang et al. studied the effects of biochar on Holecal soil and found that applying biochar slowed down the soil infiltration rate [10]. To sum up, the effects of biochar on soil infiltration are not conclusive, and they probably vary with soil type, biochar type, addition rate, and the particle size of the biochar. Most of the former studies focused on the soil’s response to treatment with or without biochar application; however, studies on the biochar addition rate are inconclusive, and there are few results available for biochar types. Furthermore, many conclusions were obtained from cultivated soil, and there are few results for newly reclaimed soil.
It is beneficial to reduce soil water loss and determine soil water balance to understand the process of soil water infiltration. Wang et al. established a vertical one-dimensional algebraic infiltration model, which fully focused on the soil infiltration process, and proposed a computational model for soil water redistribution after infiltration [11]. Zhao et al. found that a one-dimensional algebraic infiltration model had good applicability in severely saline–alkali soils during micro-saline water infiltration experiments, and it accurately simulated the moisture in the soil profile when the soil depth was less than 35 cm [12]. Wang et al. found that a one-dimensional algebraic model effectively described the distribution of soil moisture in sandy soil under different planting years using one-dimensional soil column infiltration experiments [13]. However, the application of a one-dimensional algebraic infiltration model in soils with biochar addition has rarely been reported. Therefore, we investigated soil water infiltration with two different types of biochar (corn straw biochar and rice husk biochar) and three addition amounts (a mass ratio of 2%, 4%, and 8%) using soil column simulation experiments in the laboratory, where the treatment without biochar application was set as the control (CK). We hypothesize that biochar amendment will improve the soil infiltration performance and promote water retention as well as soil moisture in the soil profile. The aims of this work are (1) to investigate the impact of biochar and addition amount on soil infiltration, (2) to simulate the infiltration procedure and characterize the parameters, and (3) to verify the applicability of one-dimensional algebraic models for simulating soil moisture in the soil profile with biochar addition.
2. Materials and Methods
2.1. Test Soil and Biochar Preparation
The tested soil was collected from the Agricultural Soil and Water Environment and Ecology experimental site at Yangzhou University. As a new experimental site, the former soil was uncultivated land with low productivity, which can be defined as reclaimed land. The soil was collected at the top 0–25 cm as a “Z” form; large gravel was moved, the soil was air-dried and then sieved through 2 mm. Soil particle size composition was measured using a Malvern laser particle size analyzer (MS–3000); clay was 4.38%, silt was 32.76%, and sand was 62.86%, which belonged to sandy loam according to international classification. The soil bulk density was 1.37 g·cm−3, the soil available nitrogen content was 32.08 mg·kg−1, the soil organic matter content was 7.20 g·kg−1, the saturated water content was 38.05%, and the saturated hydraulic conductivity was 8.07 × 10⁻⁴ cm·s−1. Two types of biochar were bought from Henan Lize Environmental Protection Technology Co. LTD, which originated from corn straw and rice husk, respectively, and were pyrolyzed at 600 °C for 12 h; the characteristics of the two kinds of biochar are listed in Table 1.

Table 1.
The characteristics of biochar.
2.2. Experimental Design
The experiment was carried out in the laboratory of Agricultural Soil and Water Environment and Ecology, Yangzhou University, from April to June of 2021. The raw materials of biochar, corn straw and rice husk are easy to derive, and have sufficient reserves in the research area. In addition, biochar derived from plants was reported to have a better performance and higher carbon content [14]. Therefore, the corn straw biochar (A) and rice husk biochar (B) were chosen to be tested in this study. In the experiment, biochar addition rates were 2%, 4%, 8% of dry soil mass; seven treatments were set as A2 (2% corn straw biochar), A4 (4% corn straw biochar), A8 (8% corn straw biochar), B2 (2% rice husk biochar), B4 (4% rice husk biochar), B8 (8% rice husk biochar) and the soil without biochar addition was set as the control (CK). There were four replicates for each treatment.
2.3. Infiltration Experiment
A specially designed transparent polymethyl methacrylate cylinder with an inner diameter of 100 mm and a height of 400 mm was used for one-dimensional vertical infiltration. The cylinder was vertically fixed, and a scale with mm was attached on the side, with a valve installed at the bottom. Vaseline was evenly applied to the inner wall of the cylinder to reduce the pipe wall effect on soil water infiltration. Two layers of 100 mesh gauze sand and a layer of filter paper were placed at the bottom of the column before filling to prevent the loss of soil particles and facilitate ventilation. The soil and biochar were mixed evenly according to designed mass ratio, stood at room temperature for 24 h, and then filled up with a bulk density of 1.37 g·cm−3. As biochar is usually applied at the surface soil layer in the field [15], biochar was added to a depth of 0–250 mm of the soil column, and the rest of the column was filled with only the soil. The column was filled layer by layer in 50 mm intervals; each layer of mixture (biochar and soil samples) or soil was calculated and weighed separately, then mixed evenly, and loaded into the soil column. The soil was disturbed between layers to prevent stratification during infiltration. The top of the soil was covered with a filter paper to prevent erosion.
During the experiment, a Mariotte bottle was used to supply water and maintain a constant head at 40 mm. The Mariotte bottle was also a transparent polymethyl methacrylate cylinder, measuring 100 mm in inner diameter and 600 mm in height. It had an outlet that connected to the external air through an air intake tube at the bottom. The infiltration amount and the wetting front were recorded every 30 s for the first 3 min, 1 min for 3–10 min, every 2 min for 10–20 min, every 4 min for 20–60 min, and then every 5 min until the end of the experiment. Time recording ended and water supply stopped when the wetting front migrated nearly to the bottom of soil column (300 mm); this moment was considered the end of the experiment, and the time duration was recorded as the water infiltration duration. The total water loss in the Mariotte bottle could be considered the cumulated infiltration amount.
The soil column was destroyed after the end of infiltration; soil samples were taken using 5 cm soil layers, and then dried in an oven to determine soil moisture at each depth.
2.4. Model Simulation
The relationship between the wetting front migration distance and the infiltration time can be described as the power function F = atb, where F is the wetting front migration distance (mm), t is the infiltration time, min, and a and b are the dimensionless empirical constants. The a value indicates the wetting front migration distance within the first unit of time, and the b value indicates the attenuation of the wetting front’s advance process [16].
The infiltration process was fitted using the Philip model [17] and the Kostiakov model [18]. The Philip model is expressed as follows:
I(t) = St0.5 + At
The Kostiakov model is expressed as follows:
where I(t) is the cumulative infiltration, mm; S is the sorptivity, mm·min−0.5; A is the steady infiltration rate, mm·min−1; and t is the infiltration time, min; K > 0 and 0 < n′ < 1 are dimensionless empirical constants.
I(t) = Ktn′
Simulating soil water content accurately plays a very important role in agricultural water management, determining irrigation system and improving crop yield during agricultural research [19]. In order to study the relationship between the one-dimensional vertical water infiltration process and soil water content at profile, and to predict the soil moisture distribution with biochar addition, the moisture in the soil profile was simulated using a one-dimensional algebraic model and its applicability in biochar-amended soil was verified.
The soil water retention curve can be described with the following equation [20]:
where θ is the soil water content (cm3·cm−3), θs is the saturated water content (cm3·cm−3), θr is the residual water content (cm3·cm−3), hd is the air entry suction (cm), h is the soil water suction corresponding to the water content θ, and N is a parameter. The Richards equation has been used widely to describe soil water movement. For one-dimensional vertical infiltration into soil, the governing equation and the initial and boundary conditions are as follows:
where D(θ) is the diffusivity, θi is the initial soil water content (cm3·cm−3), t is time, and z is the vertical coordinate, positive downward. The rest of the symbols are the same as above.
Based on the above equations, Wang et al. derived an algebraic model to describe the soil water infiltration properties as follows [21]:
where I is the cumulative infiltration(cm); zf is the generalized wetting front depth (cm); and parameter α is the comprehensive shape coefficient of the soil water content distribution in terms of Equations (5) and (6). The rest of the symbols are the same as above.
If the initial soil water content is low, let θr = θi; then, Equations (5) and (6) become as follows:
The symbols are the same as above. θs and θi can estimated easily based on the soil texture and initial conditions. The coefficient α can be estimated experimentally. If the relationship between I and zf is obtained via an experiment, α may be determined based on Equation (7), and then the soil water content at any vertical coordinate z can be obtained using Equation (8).
The root mean square error (RMSE) and coincidence index (D) are calculated using Equations (9) and (10), respectively [22]. They are selected for simulation error analysis, which included the compassion between the observed moisture in the soil profile and simulated ones.
where Si is the predicted soil water content (cm3·cm−3), Oi is the measured ones, is mean value of the measured ones, and n is sample size. RMSE is used to evaluate the deviation between the simulated values and the measured ones. The closer the RMSE is to 0, the more accurate the model simulation is. The coincidence index (D) is between 0 and 1; the higher the value, the more accurate the simulated values, and the better the model prediction.
2.5. Data Analysis
Data were calculated and processed using Microsoft Excel 2010. A one-way ANOVA was applied to test the difference of each treatment, and conducted using the SPSS 20.0. Multiple comparisons of mean annual values were performed using the least significant difference (LSD) at p < 0.05. Figures were created using Origin 8.0.
3. Results
3.1. Effects of Biochar Addition on Soil Water Infiltration
The migration of the wetting front in reclaimed soil with biochar addition is shown in Figure 1. It can be seen from Figure 1 that the wetting front moved quickly in the initial stage and then slowly migrated to stable. In contrast, wetting front migration was only promoted by lower rates of rice husk biochar treatment (B2). When the wetting front reached 300 mm (bottom of soil column), the duration of water infiltration was 228 min for CK. Compared to CK, the duration under A2, A4, A8 was increased by 35.0%, 46.0% and 59.1%, respectively.
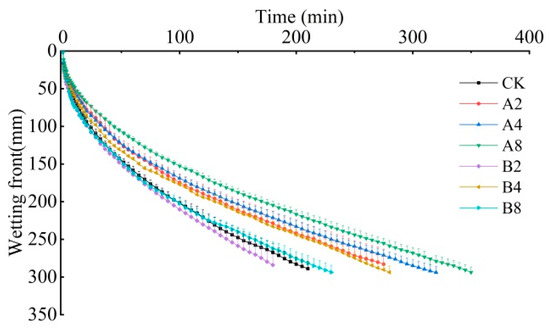
Figure 1.
Wetting front migration distance with infiltration time.
Parameters a and b of the fitting function between the wetting front migration and the infiltration time are listed in Table 2. The coefficients of determination R2 all exceeded 0.99, and reached an extremely significant level (p < 0.01), indicating a perfect fitting performance. The a value decreased with a raise of maize straw biochar, while initially decreasing and then increasing with an increase in rice husk biochar addition. Compared to CK, rice husk biochar promoted wetting front migration, while maize straw biochar limited it within the first unit of time (30 s). By taking the first derivative of that function, the value of a × b can roughly describe the migration rate of the wetting front. It can be found that except B2 and B8, the values of a × b were all lower than that under CK, which indicates that the wetting front migrated slowly with increasing rates of biochar. Additionally, it migrated more slowly with increasing rates of maize straw biochar than that with rice husk biochar.
Table 2.
The fitting parameters of wetting front migration and infiltration time.
To sum up, maize straw biochar and medium addition of rice husk biochar could increase infiltration duration, and retard wetting front migration, which would be beneficial for improving the fast infiltration and weak water retention capacity of reclaimed land.
The cumulative infiltration (CI) dynamics are shown in Figure 2A, and the CI at 10 min, 60 min and 150 min is showed in Figure 2B, respectively. The CI increased rapidly at the initial stage, and then slowly stabilized; the cumulative infiltration curves were steep and showed a high coincidence at the beginning. It can be seen from Figure 2B that the CI at 10 min began to disperse; the CIs with corn straw biochar were significantly lower than the others, and ranged from 32.8 m (A8) to 35.3 mm (A2). The CI under CK, B2 and B8 at 60 min was significantly higher than that under the other treatments. In the rice husk biochar group, the CI under medium addition (B4) was significantly lower than that under B2 and B8. At the end of infiltration, the CI under A8 was significantly higher than that under other treatments, as the soil was almost saturated; thus, there was a slight but not significant difference in cumulative infiltration among other treatments except A8.
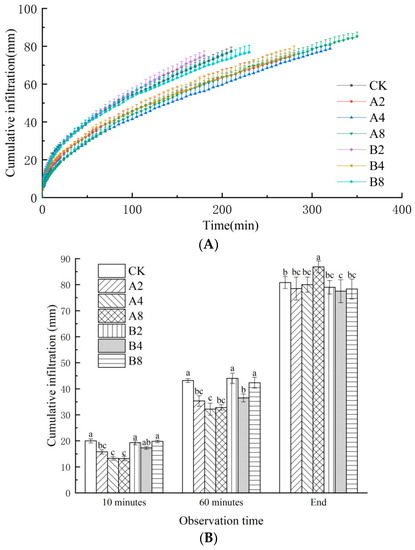
Figure 2.
(A) The cumulative infiltration dynamics under different biochar varieties and addition rates. (B) The specific cumulative infiltration at different infiltration times. Notes: The different lowercase letters on each set of columns indicate significant differences at this time (p < 0.05).
3.2. The Relationship between Cumulative Infiltration and Wetting Front Migration
The cumulative infiltration (CI) and the wetting front migration distance (Zf) was quantified as CI = n″Zf, with n″ being the shape coefficient. The fitting results are listed in Table 3. The value of n″ reflects the variation of cumulative infiltration with unit wetting front migration distance. The determination coefficient R2 of the regression was over 0.99, which indicating a good linear relationship between them. The n″ value ranged from 0.3229 to 0.3629, as shown in Table 3. Compared to CK, the n″ value varied, declining at first and then increasing with an increased addition rate of both kinds of biochar. The n″ value was highest under A8 and lowest under B4, which revealed that over the course of a unit wetting front migration distance, the cumulative infiltration was greatest with 8% maize straw biochar, while it was lowest with 4% rice husk biochar.
Table 3.
Fitting coefficient of the relationship between cumulative infiltration and wetting front migration distance.
3.3. The Simulation of the Infiltration Process
The infiltration process was simulated using the Philip model [17], and the fitting results are listed in Table 4. The determination coefficient R2 of the regression was over 0.995, indicating that the Philip model accurately simulated the water infiltration of reclaimed soil with different biochar types and their application.
Table 4.
The fitting results of the Philip model.
The fitting results of the Philip model are listed in Table 4. In the initial stage, the infiltration rate was dominated by a large soil matrix potential, and mainly manifested as the sorptivity. It can be seen from Table 4 that the sorptivity under the treatments was lower than CK, indicating that the biochar addition retarded the sorptivity. Then, the infiltration gradually developed to a stable stage, and the stable infiltration rate began to play a dominant role. The stable infiltration rates were significantly lower than that under CK except B8, which also reflected the retarding effects of biochar on soil water infiltration. With the increase in the corn straw biochar addition rate, the sorptivity increased first and then decreased, while an opposite tendency was observed with rice husk biochar addition. The stable infiltration rate was enhanced by the increase in both kinds of biochar addition rates; it varied widely with increasing the addition rate of rice husk biochar, and increased extremely obviously under B8, being almost 8.4 times of that under B2. Thus, it can be estimated that soil water infiltration is more sensitive to rice husk biochar and its addition rate.
The fitting results of the Kostiakov model are listed in Table 5; the determination coefficient R2 of the regression was over 0.997, indicating a satisfying simulation performance. According to the fitting results, the K values of the biochar treatments were lower than that of CK, and reached a significant level (p < 0.05) except for the case of B8, indicating that the biochar addition was beneficial for inhibiting initial soil water infiltration. As the addition rate of biochar increased, the K values first increased and then decreased in corn straw biochar, while an inverse tendency was observed with the addition of rice husk biochar, indicating that the soil water infiltration will be differently affected by different biochar types, and the suitable addition rate threshold for each kind of biochar is different.
Table 5.
The fitting results of the Kostiakov model.
3.4. The Simulation of Moisture in the Soil Profile
The one-dimensional algebraic model was used to simulate soil moisture in profile after infiltration; the simulated soil moisture and observed values are shown in Figure 3. It can be observed that the soil moisture in profile was decreased with a soil depth increase. In the 0–15 cm soil layer, the simulated values were essentially consistent with the measured ones, while the simulated values were smaller than the measured ones in the 15–35 cm soil layer. The soil moisture in the 0–15 cm layer under treatment with biochar was much higher than that under CK; in addition, that in the 0–10 cm layer increase with an increase in biochar application. At the end of infiltration, the surface soil moisture (0–5 cm) was highest under A8, with 0.52, and lowest under CK, with 0.43.
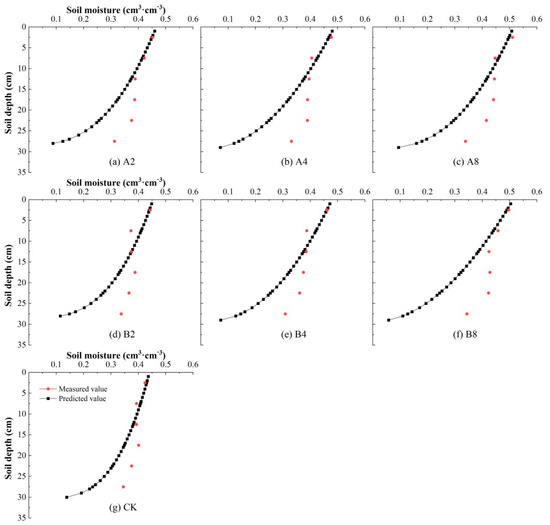
Figure 3.
The simulated moisture and measured values in the soil profile under different treatments.
The root mean square error (RMSE) and coincidence index (D) are listed in Table 6. The RMSE between the simulated values and the observed ones ranged from 0.174% to 0.767%, and the D value under each treatments ranged from 0.543 to 0.756. The results revealed that the one-dimensional algebraic model could simulate the dynamics of soil moisture in profile with biochar addition. It should pointed out that the RMSE under treatments with biochar addition was much higher than that of CK. Except for A8 and B4, the D value under other treatments with biochar was lower than that of CK, which indicates that the accuracy of the one-dimensional algebraic model will decrease with the application of biochar to soil. Generally, the D value ranged more widely in the rice husk biochar group than in the corn biochar group, and it was relatively high under A8 with 0.7258 and B4 with 0.7125, respectively. This verified that the performance of the one-dimensional algebraic model would also be affected by biochar type and addition rates, especially with rice husk biochar.
Table 6.
Simulation accuracy analysis of soil moisture under different biochar additions.
4. Discussion
Infiltration is a critical process that influences soil moisture distribution and determines soil water balance, as well as irrigation water efficient utilization. Biochar addition could improve the soil’s physical properties, such as soil bulk density, soil porosity and soil aggregate [23,24], thereby influencing the soil water infiltration process. In this study, the infiltration process of each treatment varied in extremely similar ways and the cumulative infiltration curves were highly coincidental at the initial infiltration stage. This could be explained by the fact that the soil was dry, with a low water content and a high soil matric potential at the initial stage of infiltration, the soil water infiltration was mainly dominated by soil conditions, and thus less affected by biochar addition. With the extension of time, the infiltration duration was prolonged, and the wetting front migration was postponed with biochar, except in the case of a low addition rate of rick husk biochar. In addition, the high addition rate of maize straw biochar was beneficial for inhabiting rapid infiltration and improving the weak water retention capacity of newly reclaimed soil, which was in accordance with findings of former researchers [25,26]. This might be explained by the fact that the specific surface area and total pore volume of corn straw carbon are larger than that of rice husk carbon, and its large specific surface area and porous characteristics lead to a more significant increase in the adsorption capacity, ultimately inhibiting water transport. In addition, there were also many results reporting that biochar addition could promote water infiltration [27,28,29,30], which is contrary to the results from our research. This might be explained by different soil textures, as the tested soil in this study was sandy loam with a high proportion of sand. The biochar particle may block large pores in the soil, zigzagging the soil water infiltration path and thereby retarding infiltration process.
In the early infiltration stage, due to the dry soil and large matrix potential, soil water infiltration was mainly dominated by the action of intermolecular gravity and coulomb force. As time passed, the infiltration gradually entered the stable stage. Both the Philip model and the Kostiakov model accurately simulated the water infiltration process of newly reclaimed soil with added biochar. Both the fitted sorptivity and the stable infiltration rates under treatments with biochar addition were mostly lower than those under CK, which indicates that the reducing effects of biochar on infiltration rate existed both in the initial infiltration rates and in the stable infiltration rates. Zou et al. also revealed the addition of biochar significantly reduced the initial infiltration rate in the early infiltration stage in Aeolian sand soil [31]. With the extension of time, the migration distance of the wet front, and the cumulative infiltration and infiltration rates of biochar treatment were lower than that of the CK. Li et al. studied the effects of maize straw biochar for infiltration in saline soil from Hetao irrigation district. Te results showed that biochar addition inhibits the initial infiltration rate; when the soil reached saturation, the stable infiltration rate with biochar addition was much higher than that under CK, and the biochar enhanced the soil permeability in the later infiltration period [32]. The difference might be caused by different soil textures and soil salinity values, in addition to the fact that the addition rate in their study was much lower, with only 1% and 2% of dry soil mass.
According to simulated sorptivity and stable infiltration rate, the soil infiltration performance was largely influenced by rice husk biochar addition (both the sorptivity and the stable infiltration rate varied widely). In addition, the sorptivity showed an opposite trend with the addition of two different kinds of biochar, which indicated that biochar with different source materials could have widely different roles in influencing the characteristics of soil infiltration. Therefore, subsequent studies should pay more attention to the performance of the used biochar and trace the mechanism of biochar influence on soil water infiltration and distribution at the initial preparation stage.
Biochar addition enhanced surface soil moisture after infiltration. The average moisture in the soil profile with biochar addition was higher than that under CK. In addition, the higher the biochar application, the better the soil water content situation at profile, which was consistent with Huang et al.’s [23] and Zeng et al.’s results [33]. This might be induced by the huge specific surface area and porosity of the biochar, and its hydrophilic structure, including carboxyl, hydroxyl, and aliphatic double bonds, which give biochar a strong adsorption and water holding capacity [34]. Liu et al. [35] reported a dissatisfactory simulation of the one-dimensional algebraic model in the deeper soil layers. In our study, despite the one-dimensional algebraic model being able to simulate the soil moisture at surface depth (0–15 cm) well, the simulated soil moisture was much smaller than the measured values in the 15–35 cm soil layer. It is worth noting that soil moisture was mainly concentrated in the 0–20 cm layer with a high addition of corn straw biochar, while the peak of soil moisture under a high addition of rice husk biochar was deeper, around 15–25 cm. This indicated that corn straw biochar was more conducive to soil water conservation at a root depth; however, we should be cautious of deep leakage occurrence when using rice husk biochar.
5. Conclusions
The tested soil was sandy loam from newly reclaimed land; it is prone to soil erosion during heavy rainfall, which will increase the soil nutrients’ loss possibility. The main conclusions are as follows: (1) The soil water infiltration process was improved by biochar addition; the positive effect of corn straw biochar was better than that of rice husk biochar, and the effect was enhanced with an increase in the corn straw biochar addition rate. (2) The Philip model and Kostiakov model accurately describe the water infiltration process of the newly reclaimed soil with biochar. The retarding effects of biochar on the infiltration rate were reflected in both the sorptivity and stable infiltration rates. (3) The surface soil moisture was improved with the addition of both kinds of biochar, and the soil moisture in the soil profile with biochar addition could be simulated using a one-dimensional algebraic model.
In summary, corn straw biochar with a high addition rate is beneficial for inhibiting soil water infiltration and improving water retention ability in newly reclaimed soil, which is a relatively recommended choice for an efficient soil construction in newly reclaimed land.
Author Contributions
Conceptualization, S.F. and J.W.; methodology, D.S. and Y.L.; formal analysis and investigation, J.W., D.S. and A.C.; writing—original draft preparation, J.W.; writing—review and editing, J.W. and C.L.; funding acquisition, J.W. and Y.L.; resources, C.L.; supervision, S.F. and C.L. All authors have read and agreed to the published version of the manuscript.
Funding
This research was funded by the Special Foundation of National Natural Science Foundation of China (Grants No. 51609209), the Key Laboratory Program of the Shangqiu Station of National Field Agro-ecosystem (Grants No. SQZ-2023-01), and the Natural Science Foundation of Jiangsu Province (Grants No. BK20160471, BK20200941).
Data Availability Statement
The data that support the findings of this study are available from the corresponding author, [C.L.], upon reasonable request.
Acknowledgments
Special thanks to Sun Yidi for the revision of the paper.
Conflicts of Interest
The authors declare no conflict of interest.
References
- Ministry of Natural Resources, People’s Republic of China. Major Data Bulletin of the Third National Land Resource Survey. Available online: https://www.mnr.gov.cn/dt/ywbb/202108/t20210826_2678340.html (accessed on 15 December 2021).
- Glaser, B.; Haumaier, L.; Guggenberger, G.; Zech, W. Black carbon in soils: The use of benzenecarboxylic acids as specific markers. Org. Geochem. 1998, 29, 811–819. [Google Scholar] [CrossRef]
- Lehmann, J.; Joseph, S. Biochar for Environmental Management: Science and Technology; Earthscan Ltd.: London, UK, 1998. [Google Scholar]
- Zhao, X.; Liu, S.; Gao, X.; Ding, Y.; Li, Z.; Yang, Y.; Yang, M. Effect evaluation of soil amendments on soil quantity of mountain apple orchards in the hilly region of Loess Plateau, China. Acta Ecol. Sin. 2022, 42, 7080–7091. [Google Scholar] [CrossRef]
- Yang, S.; Wang, J.; Liu, S.; Miao, Y.; Zhang, Y. Effects of soil amendments on soil physical and chemical properties of dryland apple orchards and economic efficiency in the Loess Plateau. Water Sav. Irrig. 2023, 1, 40–46. [Google Scholar] [CrossRef]
- Cao, D.; Shi, B.; Wei, G.; Chen, S.; Zhu, H. An improved distributed sensing method for monitoring soil moisture profile using heated carbon fibers. Measurement 2018, 123, 175–184. [Google Scholar] [CrossRef]
- Liang, J.; Xing, X.; Gao, Y. A modified physical-based water-retention model for continuous soil moisture estimation during infiltration: Experiments on saline and non-saline soils. Arch. Agron. Soil Sci. 2020, 66, 1344–1357. [Google Scholar] [CrossRef]
- Li, S.; Wang, X.; Wang, S.; Zhang, Y.; Wang, S.; Shangguan, Z. Effects of application patterns and amount of biochar on water infiltration and evaporation. Trans. Chin. Soc. Agric. Eng. 2016, 32, 135–144. [Google Scholar] [CrossRef]
- Zhan, S.; Song, M.; Li, Z.; Ma, H. Effects of different straw biochars on soil water infiltration and evaporation. J. Soil Water Conserv. 2021, 35, 294–300. [Google Scholar] [CrossRef]
- Wang, Y.; Bao, W.; Bai, Y.; Lu, X.; Xia, Z.; Yang, F.; Zhong, Y. Effects of biochar on soil water transport characteristics of Heilu soil. J. Drain. Irrig. Mach. Eng. 2020, 38, 292–297. [Google Scholar] [CrossRef]
- Wang, Q.; Shao, M.; Zheng, J. Water Movement and Solute Transport in Soil; China Water & Power Press: Beijing, China, 2007; pp. 20–21. [Google Scholar]
- Zhao, L.; Gao, P.; Wang, N.; Liu, X.; Yang, D.; Liu, Q. Applicability of one dimensional algebraic model in brackish water irrigation of severe saline—Alkali soil. J. Drain. Irrig. Mach. Eng. 2017, 35, 248–255. [Google Scholar]
- Wang, Y.; Ruan, X.; Bai, Y.; Gao, X. Process of soil moisture infiltration and model analysis of gravel-mulched land with different planting years. J. Drain. Irrig. Mach. Eng. 2022, 40, 1048–1055. [Google Scholar]
- Wang, J.; Ling, Q.; Zhang, Y.; Wang, X.; Lin, J.; Zhang, W.; Liu, Z.; Wang, X. Preparation of biochar and its application in environmental pollution management. J. Nantong Univ. (Nat. Sci. Ed.) 2022, 21, 1–14. [Google Scholar]
- Obia, A.; Børresen, T.; Martinsen, V.; Cornelissen, G.; Mulder, J. Vertical and lateral transport of biochar in light-textured tropical soils. Soil Tillage Res. 2017, 165, 34–40. [Google Scholar] [CrossRef]
- Song, R.; Chu, X.; Ye, J.; Bai, L.; Zhang, R.; Yang, J. Effects of surface soil mixed with sand on water infiltration and evaporation in laboratory. Trans. Chin. Soc. Agric. Eng. 2010, 26, 109–114. [Google Scholar]
- Philip, J.R. The Theory of infiltration about sorptivity and algebraic infiltration equations. Soil Sci. 1957, 83, 345–357. [Google Scholar] [CrossRef]
- Kostiakov, A.N. On the dynamics of the coefficient of water percolation in soils and on the necessity of studying dynamic point of view for purposes of amelioration. In Transactions of the Sixth Commission of the International Society of Soil Science Part A; Society of Soil Science: Moscow, Russia, 1932; pp. 17–21. [Google Scholar]
- Jackson, T.J.; Hawley, M.E.; O’Neill, P.E. Preplanting soil moisture using passive microwave sensors. Water Resour. Bull. 1987, 23, 11–19. [Google Scholar] [CrossRef]
- Brooks, R.H.; Corey, A.T. Hydraulic Properties of Porous Media and Their Relation to Drainage Design. Trans. ASAE 1964, 7, 26–28. [Google Scholar] [CrossRef]
- Wang, Q.; Robert, H.; Shao, M. Algebraic model for one-dimensional infiltration and soil water distribution. Soil Sci. 2003, 168, 671–676. [Google Scholar] [CrossRef]
- Willmott, C.J. Some comments on the evaluation of model performance. Bull. Am. Meteorol. Soc. 1982, 63, 1309–1313. [Google Scholar] [CrossRef]
- Huang, C. Effects of Common Biochar and Acid-Modified Biochar on Soil Water and Salt Distribution and Spinach Growth in Tidal Flat Area; Yangzhou University: Yangzhou, China, 2021. [Google Scholar] [CrossRef]
- Yan, M.; Li, X.; Liu, Y.; He, L.; Zhang, J. Biochar enhanced soil aggregation and C-related enzyme activity in post-mining land on the Loess Plateau, China. Land Degrad. Dev. 2022, 33, 1054–1061. [Google Scholar] [CrossRef]
- Bao, W.; Bai, Y.; Zhao, Y.; Zhang, X.; Wang, Y.; Zhong, Y. Effect of biochar on soil water infiltration and water holding capacity in the arid regions of middle Ningxia. Chin. J. Soil Sci. 2018, 49, 1326–1332. [Google Scholar] [CrossRef]
- Gao, Y.; Shen, H.; Yang, T.; He, N.; Ma, X. The effects of different biochar additions on soil water movement. China Rural. Water Hydropower 2021, 9, 134–140. [Google Scholar]
- Wen, M. Effect of Biochar on Soil Hydrodynmic Parmeter in the Loess Plateau; Northwest Agricultural and Forestry University: Yangling, China, 2021. [Google Scholar]
- Qi, R.; Zhang, L.; Yan, Y.; Wen, M.; Zheng, J. Effects of biochar addition into soils in semiarid land on water infiltration under the condition of the same bulk density. Chin. J. Appl. Ecol. 2014, 25, 2281–2288. [Google Scholar] [CrossRef]
- Cen, R.; Qu, Z.; Sun, G.; Yang, F. Effects of biochar on the physical properties and infilration of clay loam. Res. Soil Water Conserv. 2016, 23, 284–289. [Google Scholar] [CrossRef]
- Wei, Q. Study on Soil Percolation Characteristics and Water Retention Evaporation of Biochar; Guangxi University: Nanning, China, 2019. [Google Scholar] [CrossRef]
- Zou, Y.; Zhang, S.; Shi, Z.; Zhou, H.; Zheng, H.; Hu, J.; Mei, J.; Bai, L.; Jia, J. Effects of mixed-based biochar on water infiltration and evaporation in aeolian sand soil. J. Arid Land 2022, 14, 374–389. [Google Scholar] [CrossRef]
- Li, S.; Li, Y.; Zhang, M.; Jiang, B.; Wei, C.; Su, Y.; Zeng, X. Effects of different amendments on infiltration characteristics and soil water and salt distribution of saline-alkali soil in Hetao irrigation district. J. Soil Water Conserv. 2023, 37, 296–303. [Google Scholar] [CrossRef]
- Zeng, F.; Zhou, Y.; Zhang, W.; Yun, J.; Zhang, W.; Shao, Q. Effects of rate and particle size of biochar on water infiltration and redistribution characteristics of purple soil. J. Southwest Univ. (Nat. Sci. Ed.) 2022, 44, 136–144. [Google Scholar] [CrossRef]
- Wei, C.; Ren, Y.; Liu, F.; Deng, Y.; Yuan, X. Research progress of application of biochar and biochar-based fertilizer in agriculture. J. Henan Agric. Sci. 2016, 45, 14–19. [Google Scholar] [CrossRef]
- Liu, Y.; Li, M.; Xu, Z.; Ma, X.; Song, Y.; Zhang, J.; Wang, S.; Gao, P. Effects of different improvers on water and salt migration in saline-alkali soil. Agric. Res. Arid Areas 2020, 38, 183–191. [Google Scholar]
Disclaimer/Publisher’s Note: The statements, opinions and data contained in all publications are solely those of the individual author(s) and contributor(s) and not of MDPI and/or the editor(s). MDPI and/or the editor(s) disclaim responsibility for any injury to people or property resulting from any ideas, methods, instructions or products referred to in the content. |
© 2023 by the authors. Licensee MDPI, Basel, Switzerland. This article is an open access article distributed under the terms and conditions of the Creative Commons Attribution (CC BY) license (https://creativecommons.org/licenses/by/4.0/).