Article

Assessing the Cooling Effect of Blue-Green Spaces: Implications for Urban Heat Island Mitigation

1
Geomatics Engineering Group, Department of Civil Engineering, Indian Institute of Technology Roorkee, Roorkee 247667, India
2
Institute for Sustainable Industries and Liveable Cities, Victoria University, Melbourne, VIC 3011, Australia
*
Author to whom correspondence should be addressed.
Water 2023, 15(16), 2983; https://doi.org/10.3390/w15162983
Submission received: 15 July 2023 / Revised: 30 July 2023 / Accepted: 16 August 2023 / Published: 18 August 2023
(This article belongs to the Special Issue Water Sensitive Urban Design and Decentralised Systems)

Abstract

:
The Urban Heat Island (UHI) effect is a significant concern in today’s rapidly urbanising cities, with exacerbating heatwaves’ impact, urban livelihood, and environmental well-being. This study aims to assess the cooling effect of blue-green spaces in Bhubaneswar, India, and explore their implications for mitigating UHI effects. Satellite images were processed with Google Earth Engine (GEE) to produce information on the blue-green spaces’ land surface temperatures (LST). The Normalised Difference Vegetation Index (NDVI) and Modified Normalised Difference Water Index (MNDWI) were employed to quantify the presence and characteristics of these blue-green spaces. The findings revealed significant spatial variations in the LST, with higher temperatures observed in bare land and built-up areas and lower temperatures in proximity to the blue-green spaces. In addition, a correlation analysis indicated the strong influence of the built-up index (NDBI) on the LST, emphasising the impact of urbanisation on local climate dynamics. The analysis demonstrated the potential of blue-green spaces in reducing surface temperatures and mitigating UHI effects. Based on these results, strategic interventions were proposed, such as increasing the coverage of green spaces, optimising access to water bodies, and integrating water-sensitive design principles into urban planning to enhance the cooling effects and foster a more sustainable and resilient urban environment. This study highlighted the importance of leveraging remote sensing and GEE for urban UHI analyses. It provides valuable insights for policymakers and urban planners to prioritise nature-based solutions for heat mitigation in Bhubaneswar and other similar cities. Future research could delve deeper into a quantitative assessment of the cooling benefits of specific blue-green infrastructure interventions and explore their socio-economic impacts on urban communities.

1. Introduction

All of the world’s major cities are experiencing urban expansion. Moreover, the urbanisation process contributes to an increase in the thermal stress of an area through local or global warming [1,2,3]. The continuous process of urban expansion intensifies the current urban warming status [3,4,5]. A phenomenon known as the Urban Heat Island (UHI) effect has been caused by the impact of urbanisation. The UHI effect is a mesoscale phenomenon characterised by higher surface and atmospheric temperatures in urban areas compared to their surrounding peri-urban or rural areas, due to the different heating mechanisms between artificial surfaces and other natural land surfaces [6,7,8,9,10].
Rising temperatures fuelled by climate change pose one of the significant anthropogenic threats to urban livelihoods, as well as human and environmental well-being. Thus, understanding the UHI effect is often regarded as a key parameter in urban planning and management, because the dynamism of land surfaces can increase the variability of Land Surface Temperature (LST) distribution in heterogeneous urban settings [11,12,13,14,15,16]. LST reflects the Earth’s surface temperature, which depends on the different land surface dynamism [17,18]. The intensity of the LST has recently increased sharply in many cities across the globe [1,13,19,20,21,22,23,24]. A higher urban LST has a significant intensity and the impacts of heatwaves in cities.
Further, heatwaves and high summertime temperatures have become increasingly common. They are expected to become even more common in the following decades in the northern hemisphere, especially on the Indian subcontinent, because of rising temperatures arriving earlier and lingering for longer periods [25,26]. Furthermore, heatwaves will likely increase in frequency, duration, and intensity under climate change, according to several studies [27,28,29] Heatwaves and extreme heat have been identified as a type of disaster that can cause significant mortality rates. Mortality rates have been linked to extreme heat events in multiple studies conducted over the years in and outside India [29]. The death toll from heatwaves across the various Indian states was 25,716 between 1992 and 2016 [30]. Andhra Pradesh, Telangana, and Odisha had the highest number of heat-related deaths. Around Odisha (in eastern India), severe heatwaves were reported in 1998, leading to the unfortunate deaths of humans and livestock [31]. In 2015, the southeastern region of India (including Odisha) resulted in a death toll exceeding 2500 individuals [32]. Summers in Odisha are becoming harshly hot and humid, and the resulting human suffering is now nearly unavoidable. Odisha’s largest and capital city, Bhubaneswar, experiences high diurnal temperatures during the summer months, with extremes exceeding 40 °C for multiple consecutive days [33]. Bhubaneswar has been experiencing rapid urbanisation and population growth in recent years, resulting in adverse climatic conditions such as an intensified UHI effect, which poses significant challenges to the liveability and well-being of the city. In order to achieve resilient and sustainable urban areas offering healthy living environments for their dwellers, taking steps is required to mitigate UHI effects and adaption strategies.
Urban areas are primarily attributed to heterogeneous land use land cover (LULC) classes such as built-up areas, water bodies, and green spaces. However, urban areas have been suffering from the degradation of water bodies and green spaces (also known as blue-green spaces) due to the intensity of population growth, urbanisation, industrialisation, and transportation infrastructure, which cause UHI effects [34]. “Blue-green spaces” refers to areas characterised by water or vegetation such as ponds, lakes, wetlands, rivers, cropland, grassland, and urban vegetation [35,36]. Incorporating blue-green spaces is an effective and economical strategy in mitigating UHI effects, reducing heat stress, and contributing to local ecological environment protection, making them an integral component of sustainable urban development, thereby providing dwellers with comfortable outdoor environments [35,37,38,39,40]. Therefore, utilising blue-green spaces’ cooling potential and capacity for urban environments is a promising approach to mitigating UHI effects [35,41].
Though mitigating UHI effects and strengthening the resilience of cities with the function of blue-green spaces has been widely acknowledged [42], their specific impacts and interactions in the context of Bhubaneswar city, India, require additional research. As a rapidly growing “Tier-2” city, Bhubaneswar faces significant urbanisation pressures and economic growth, making it crucial to address the challenges posed by UHI effects and ensure the well-being of its dwellers. The city experiences distinct climatic conditions influenced by its proximity to the coast. Despite the widespread acknowledgement of the importance of blue-green spaces in mitigating UHI effects and enhancing urban resilience, these spaces’ specific impacts and interactions in Bhubaneswar remain understudied. Furthermore, it is imperative to investigate the potential of additional water-sensitive design interventions essential for developing effective urban planning strategies to create more climate-resilient cities [43].
Therefore, this study aimed to assess the cooling effect of blue-green spaces in Bhubaneswar, explore their implications for mitigating UHI effects using satellite imagery and the capabilities of GEE, which is a powerful geospatial analysis platform for analysing and quantifying the cooling effect of these elements, and evaluate their potential implications for UHI mitigation. The findings of this study will contribute to the existing body of knowledge on UHI mitigation strategies and provide valuable insights into the specific context of Bhubaneswar. Specifically, the relationships between the vegetation, water, and built-up indices with LST variations in the city were analysed. Additionally, the potential of water-sensitive design interventions such as green roofs and harvesting sites in further enhancing UHI mitigation efforts was explored. The findings of this study could inform evidence-based urban planning and design decisions, promoting the integration of blue-green spaces and water-sensitive design principles to create more sustainable and resilient urban environments.
The methodology and its application presented here for assessing the UHI effect and the impact of mitigation approaches on it for any urban development will help environmental professionals and researchers across the globe in conducting similar studies for creating sustainable and resilient cities, mitigating the adverse impacts of urbanisation and climate change.

2. Study Area

Bhubaneswar (Figure 1), the largest and capital city of Odisha, situated in eastern India, serves as the focal point of this study on UHI mitigation. It is one of India’s fastest-growing cities, an emerging education and information technology (IT) hub. The Extended Bhubaneswar Development Area (BDA) is an area of study that spans approximately 1110 square km and has a population of over 1.2 million.
The distinctive geographical and climatic characteristics of the eastern coastal plains make Bhubaneswar highly susceptible to various natural hazards such as floods, cyclones, heavy winds, earthquakes, and others. An assessment of hazards and vulnerabilities reveals that the city is prone to risks such as waterlogging, flooding, cyclonic winds, and heatwaves. Over the past years, Odisha, specifically Bhubaneswar, has encountered uncommon and contrasting extreme weather events, encompassing floods, droughts, cyclones, and heatwaves [33]. With increasing urbanisation and climate change, Bhubaneswar faces the challenges of heatwaves and UHI effects.
This study investigated the effectiveness of blue-green spaces and water-sensitive design in mitigating UHI effects in Bhubaneswar. The findings from this research will contribute to the knowledge of urban climate resilience and inform sustainable urban planning and design strategies for Bhubaneswar and similar cities, in order to support evidence-based decision making for creating more liveable and sustainable urban environments.

3. Methodology

A methodology for assessing the cooling effects of blue-green spaces on urban heat island mitigation was developed (Figure 2). The steps involved in the method are described in the following sections.

3.1. Data Sources

The following remote sensing datasets from the Earth Engine data catalog were used in this study by filtering it to the most recent summer months (March, April, and May (MAM)) of 2023, with cloud masking and for the study area:
  • USGS Landsat 8 Collection 2 Tier 1 TOA Reflectance (LANDSAT/LC08/C02/T1_TOA)
  • USGS Landsat 8 Level 2, Collection 2, Tier 1 (LANDSAT/LC08/C02/T1_L2)
These datasets were acquired by the USGS (United States Geological Survey) and are provided as analysis-ready data in GEE.

3.2. Data Processing and Analysis Using GEE

The data processing and analysis for this study were conducted using GEE, a cloud-based geospatial platform that provides access to a vast collection of satellite imagery and computational capabilities. GEE offers a range of tools and functions that facilitate the efficient and scalable processing of remote sensing data. The satellite imagery datasets were imported into the GEE environment, including Landsat datasets for the LST estimation and landscape indices calculation. The Landsat datasets were pre-processed to account for atmospheric effects and filtered to select the relevant periods for analysis.
The advantage of using GEE lay in its ability to handle large-scale geospatial datasets efficiently, allowing for the seamless processing and analysis of remote sensing data. The platform’s cloud-based architecture enables collaborative work, reproducibility, and the easy sharing of codes and results. The data processing and analysis for this study were conducted using GEE, leveraging its powerful capabilities for remote sensing data processing, spectral index calculation, spatial analyses, and map generation. The use of GEE facilitated efficient and reproducible workflows, enabling us to derive valuable insights into the urban environment and its thermal characteristics.

3.2.1. Landscape Indices and Land Cover Extraction

Landscape indices are used to represent surface properties and show their relation to the LST. Green spaces, built-up areas, and water bodies were extracted from the Landsat 8 dataset using remote sensing techniques. A combination of indices and thresholds was applied to the land cover data to identify and extract the urban blue-green spaces. The widely used NDVI [44] was used to detect vegetation areas, with a threshold of 0.35, and the MNDWI [45] was applied to detect water bodies, with a threshold of 0.05. The selection of the thresholds for the NDVI and MNDWI in this study was based on a combination of relevant studies [46,47] and a visual examination of the data. The commonly used NDBI [48] was used to detect impervious layers and urban buildings. The formulae of the landscape indices are as follows:
N D V I = ( N I R R e d ) / ( N I R + R e d )
M N D W I = ( G r e e n S W I R ) / ( G r e e n + S W I R )
N D B I = ( S W I R N I R ) / ( S W I R + N I R )
Masking or filtering techniques were also used to remove non-vegetated and non-water areas from the NDVI and MNDWI. By combining these two masks, the blue-green spaces were extracted.

3.2.2. Retrieved LST

The LST is derived from thermal bands because they involve some surface emissivity (ε) estimates [49]. Both ε and LST are the functions of the thermal radiation acquired by satellites. ε refers to the ability of a material to emit thermal radiation, relative to a black body at the same temperature. It quantifies the efficiency of a material in emitting thermal energy and varies between 0 (indicating a highly reflective surface) and 1 (indicating a surface that absorbs and emits thermal radiation effectively). An accurate estimation of ε is necessary to obtain the correct LST.
As a first step, the Landsat data were loaded, followed by cloud screening, and then filtering for time (summer months) and study area. The brightness temperature band was selected. The NDVI, fractional vegetation, and emissivity were calculated [50,51,52]. Lastly, the LST was calculated for each pixel by combining the brightness, temperature, and emissivity. A simple, single-channel algorithm, a linearised approximation of the radiation transfer equation, was used for the LST calculation [53].
The retrieved LST values were then analysed and interpreted to gain insights into the thermal characteristics of the study area. Following these steps, the retrieved LST provided valuable information for understanding the thermal dynamics and variations across the study area, which could be used for UHI analyses, environmental monitoring, and climate change studies.

3.2.3. Correlation Analysis

The “create fishnet” and “extract multi values to point” tools were employed using ArcGIS to derive correlational data. Subsequently, the data were analysed and visualised using a scatter plot investigation tool in MS Excel. The utilisation of the ArcGIS software facilitated an assessment of the correlation and overall condition of the study area.
In the correlation analysis between the LST and landscape indices, namely the NDVI, MNDWI, and NDBI, significant insights were obtained regarding the thermal dynamics of the study area. Each land cover class displayed distinct thermal characteristics, with water bodies demonstrating cooler temperatures, while built-up areas exhibited relatively higher temperatures than other land uses.

3.2.4. Masking and LST Spatial Analysis

In order to compare the thermal characteristics of the blue-green spaces (e.g., vegetation and water bodies) and non-blue-green spaces (e.g., built-up areas), a masking technique was applied. This masking aimed to isolate and analyse the LST values within these two land cover types. A blue-green space mask was created to include pixels representing blue-green spaces by applying a threshold on the NDVI and MNDWI. Conversely, a non-blue-green space mask was designed to include pixels representing non-blue-green spaces, primarily bare land and built-up areas. Pixels with NDVI values other than the specified threshold or MNDWI values other than the specified threshold were classified as non-blue-green spaces.
The LST values within the blue-green spaces and non-blue-green spaces were separately analysed to understand their thermal characteristics and potential differences. Statistical measures, such as mean, standard deviation, and range, were computed for the LST values within the blue-green spaces and non-blue-green spaces. A comparative analysis was carried out to evaluate the temperature differences between the blue-green spaces and non-blue-green spaces. This involved calculating and assessing the statistical significance of the LST values between the blue-green spaces and non-blue-green spaces. By employing the masking technique and conducting a spatial analysis, we examined the thermal characteristics of the blue-green spaces and non-blue-green spaces separately. This approach provided valuable insights into the temperature variations associated with the different land cover types, aiding our understanding of UHI effects and the role of blue-green spaces in moderating temperature.
Further, a threshold value of 36.2 °C was used to create a mask for the LST data. This process involved identifying and isolating LST values equal to or above the threshold value; 36.2 °C is the hot day advisory threshold provided by the National Disaster Management Authority (NDMA) under the heat-health temperature warning for the study area.

3.2.5. Validation of Estimated LST

Instead of field measurements, a cross-validation approach was employed to examine the Landsat-estimated LST’s reliability using a Moderate Resolution Imaging Spectroradiometer (MODIS) MOD11A1 V6.1 LST product [54] available on GEE. MOD11A1 provides daily LST values with a 1000 m resolution. The MODIS LST product of the date 13 April 2023 was chosen and served as a ground truth for validating the Landsat-estimated LST of the same date. The selection of MODIS LST products over alternative standard LST products was primarily based on the temporal alignment of Terra’s equatorial crossing time at 10:30 am. This temporal proximity to Landsat’s equatorial crossing time, specifically between 10 am and 10:25 am, contributed to the preference for MODIS LST products.
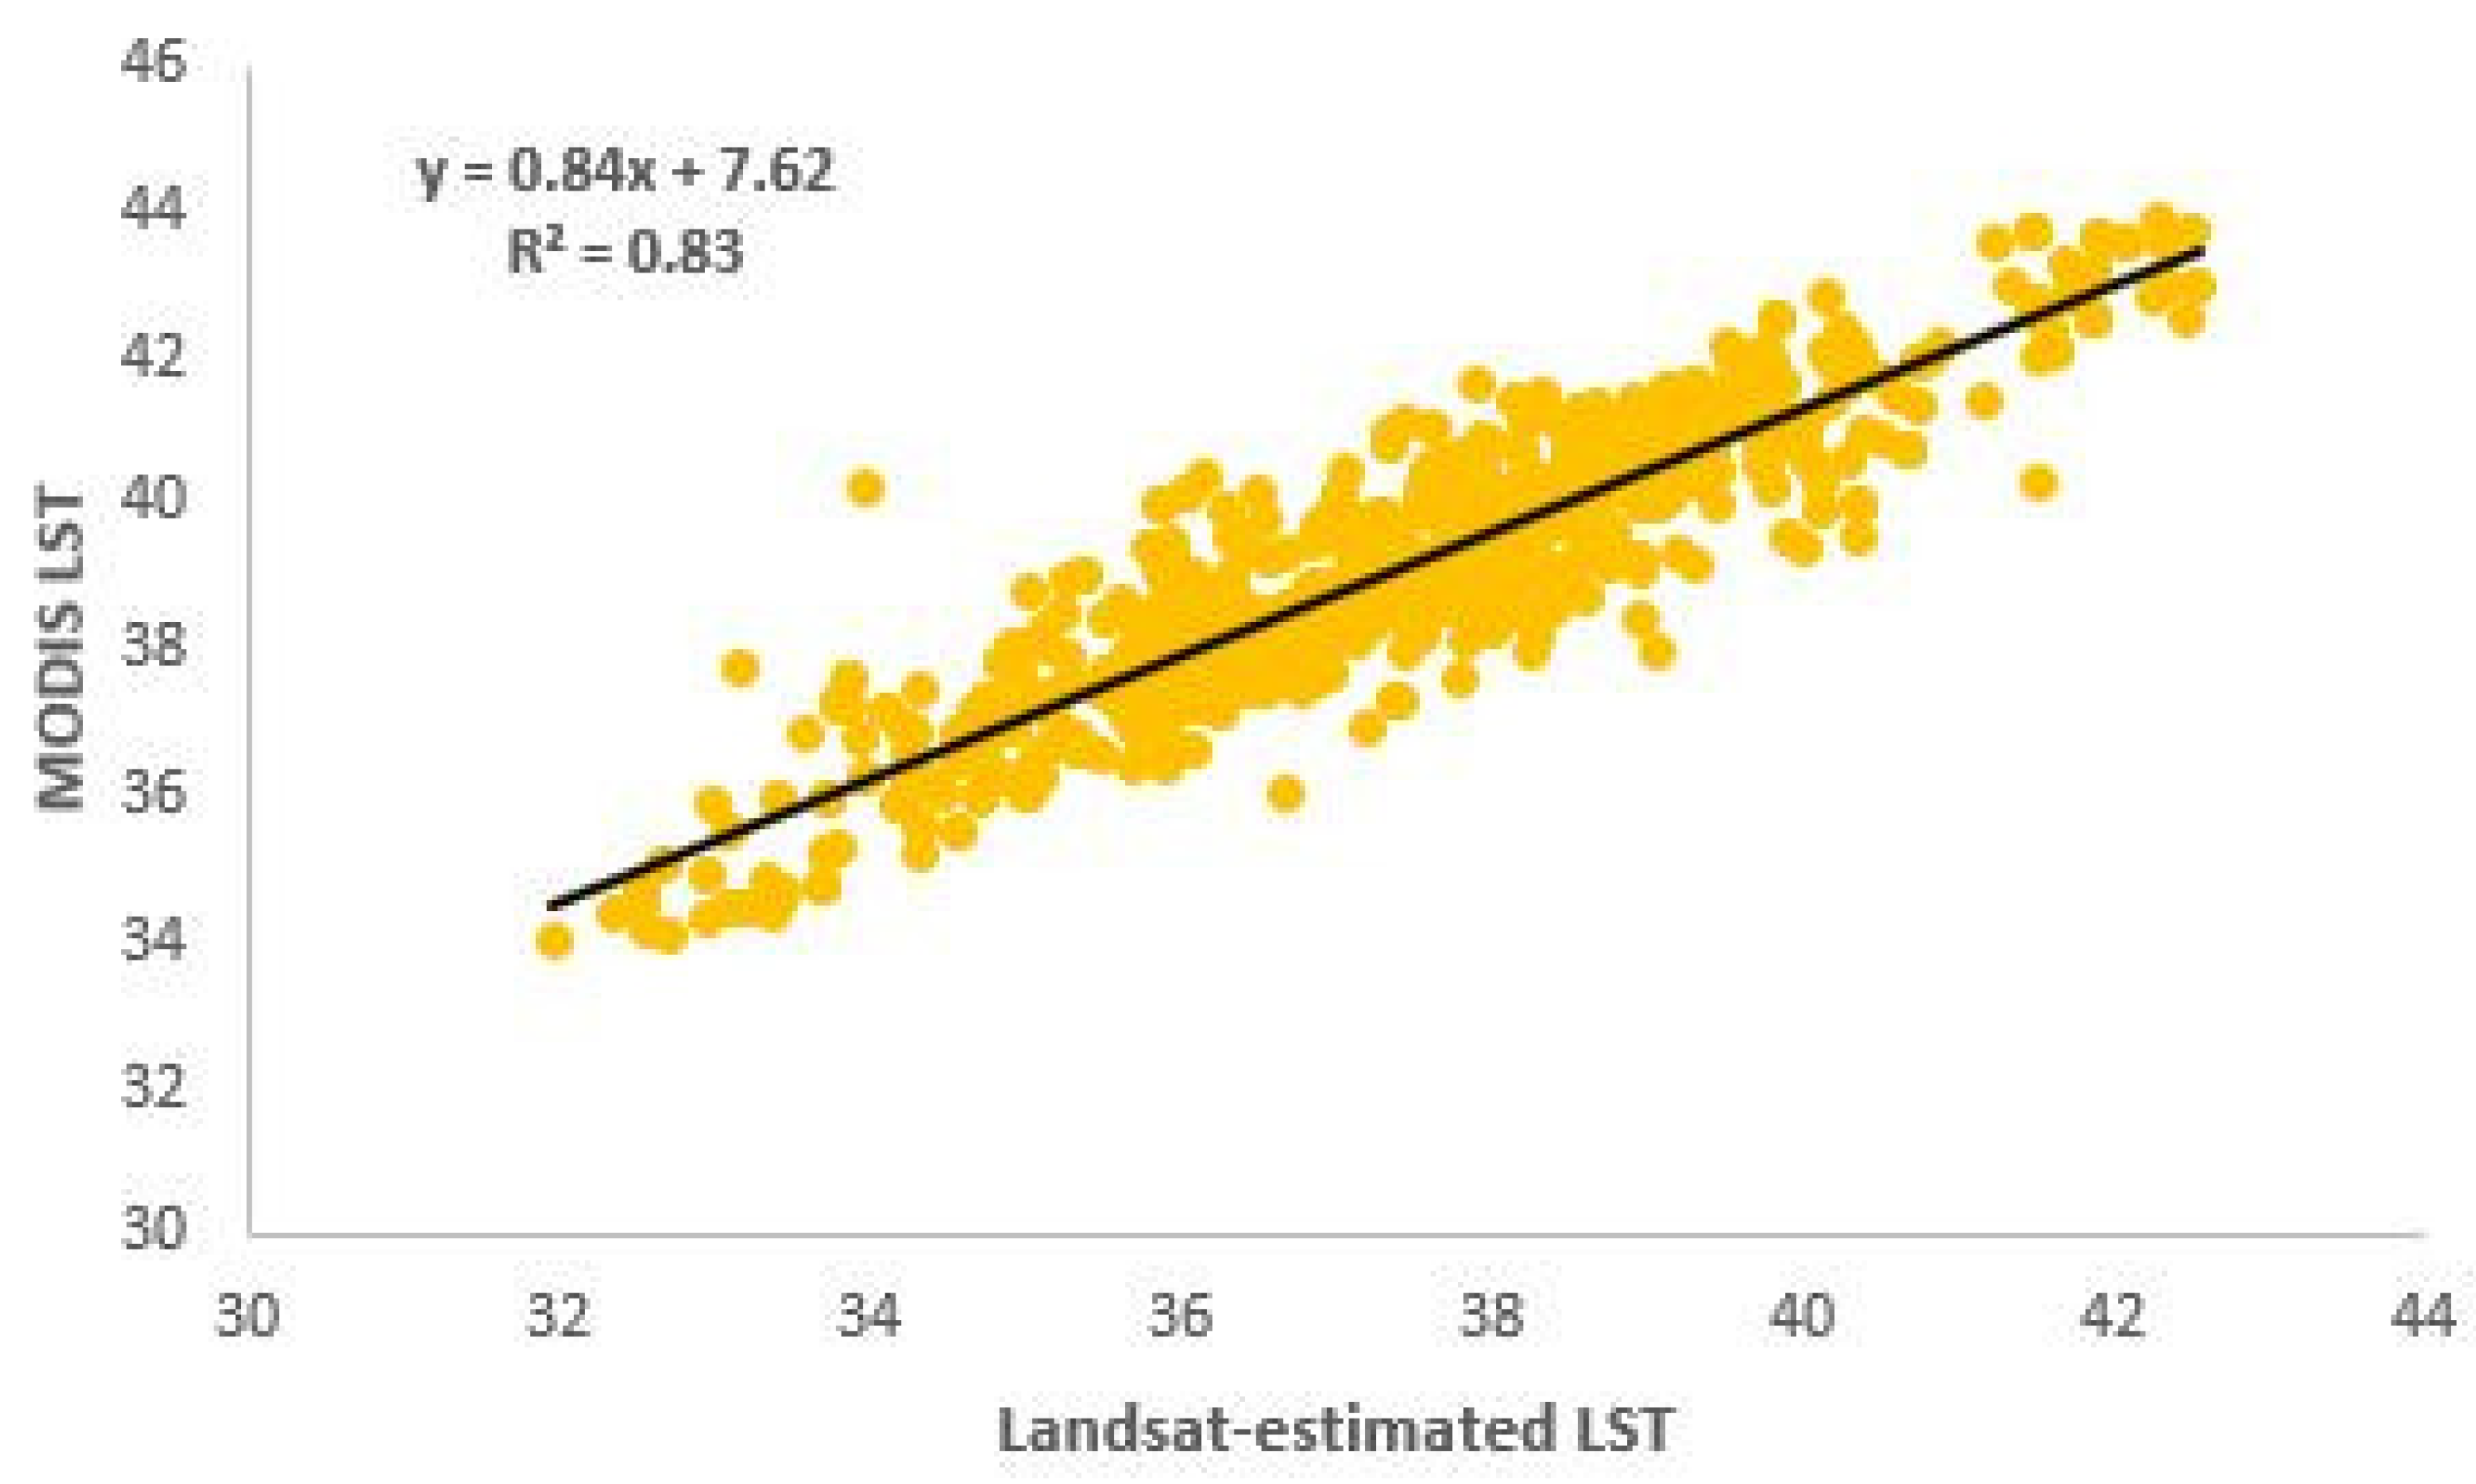
For the cross-validation, the spatial resolution and projection system of the standard and derived LST products had to be identical. Thus, the Landsat-estimated LST was resampled to 1000 m and reprojected into the GCS WGS 84 coordinate system. LST values were extracted from both the Landsat and MODIS products at 700 randomly sampled points within the study area. A correlation analysis was performed, considering the Landsat-estimated LST as the dependent variable and the MODIS-derived LST as the independent variable.

4. Results

The results section presents the findings and outcomes of the analysis conducted in this study, focusing on examining the various factors related to the LST and landscape indices. This section provides a concise overview of the key findings, highlighting the relationships between the LST, landscape indices, and their implications for the urban environment in the study area.

4.1. Landscape Indices

The analysis of the landscape indices provides valuable insights into the vegetation, water, and built-up characteristics of the study area. In this section, visual representations (Figure 3) and calculated values (Table 1) of three landscape indices, namely the NDVI, MNDWI, and NDBI, are presented, which offer important indicators of LULC dynamics.
The statistical summary and visual interpretation of these indices for the study area in 2023 are as follows:
  • NDVI: The NDVI values’ range indicated a moderate vegetation cover, with the northwestern part of Bhubaneswar, which is part of the Chandaka Forest range, exhibiting a higher vegetation density than others.
  • MNDWI: The study area exhibited a predominant presence of non-water features, resulting in negative mean MNDWI values. Notably, Kuakhai and its distributaries, the Daya and Bhargavi rivers, gracefully flow through the central–eastern part of Bhubaneswar, accompanied by sporadic occurrences of smaller water bodies such as lakes, dams, and ponds scattered throughout the city.
  • NDBI: The NDBI values ranged from −0.72 to 0.31, with a mean value of -0.08 and a standard deviation of 0.11. A previous study suggested that the urban area has undergone significant growth and intensification over the past two decades, expanding outward from the centre along major transportation routes. Recent years have witnessed a sprawl of urban development, with an increasing intensity of structures in already urbanised areas, particularly in close proximity to the city centre [55,56].
These statistical values provide an overview of the spectral characteristics of the study area and can be used to analyse the distribution and variability of its vegetation, water bodies, and built-up areas. The correlation analysis between these landscape indices and LST can further provide insights into the relationships between the land cover features and thermal variations.

4.2. Spatial Distribution of LST

Urbanisation contributes significantly to climate change and the resulting thermal variations across the Earth’s surface. Consequently, estimating the LST accurately is of the utmost importance for studying the effects of urbanisation and climate change on urban environments [34].
The spatial distribution of the LST provides valuable insights into the temperature patterns and variations across the study area. By analysing the LST data, it was understood how the thermal conditions varied spatially, allowing us to identify areas of higher or lower temperatures.
The LST distribution map revealed distinct thermal patterns across the study area. The area is characterised by vegetation cover, and its water bodies exhibited relatively lower temperatures, indicating the presence of cooler microclimates. These regions benefit from the cooling effects of evapotranspiration and shading provided by vegetation and the presence of water, which acts as a natural heat sink. Such blue-green spaces contribute to mitigating UHI effects and creating more comfortable living environments.
On the other hand, bare land and impervious surfaces, including sand patches, urban structures, roads, and pavements, exhibited higher LST values. These areas experience elevated temperatures due to the absorption and re-emission of solar radiation by artificial materials, sand patches, and the limited presence of vegetation. The spatial distribution of the LST in these non-vegetated non-blue-green spaces showed pronounced temperature gradients, with localised hotspots corresponding to densely built urban areas.
A thermal hotspot map (Figure 4) was generated based on the masked LST data to further understand the thermal stress of the study area. This map highlights the areas with the highest temperatures, indicating the presence of intense heat accumulation and potential thermal stress. The southwestern part of the city stood out as a significant thermal hotspot due to its distance from the river and low vegetation density. Identifying thermal hotspots provides valuable information for urban planning and implementing heat mitigation strategies.
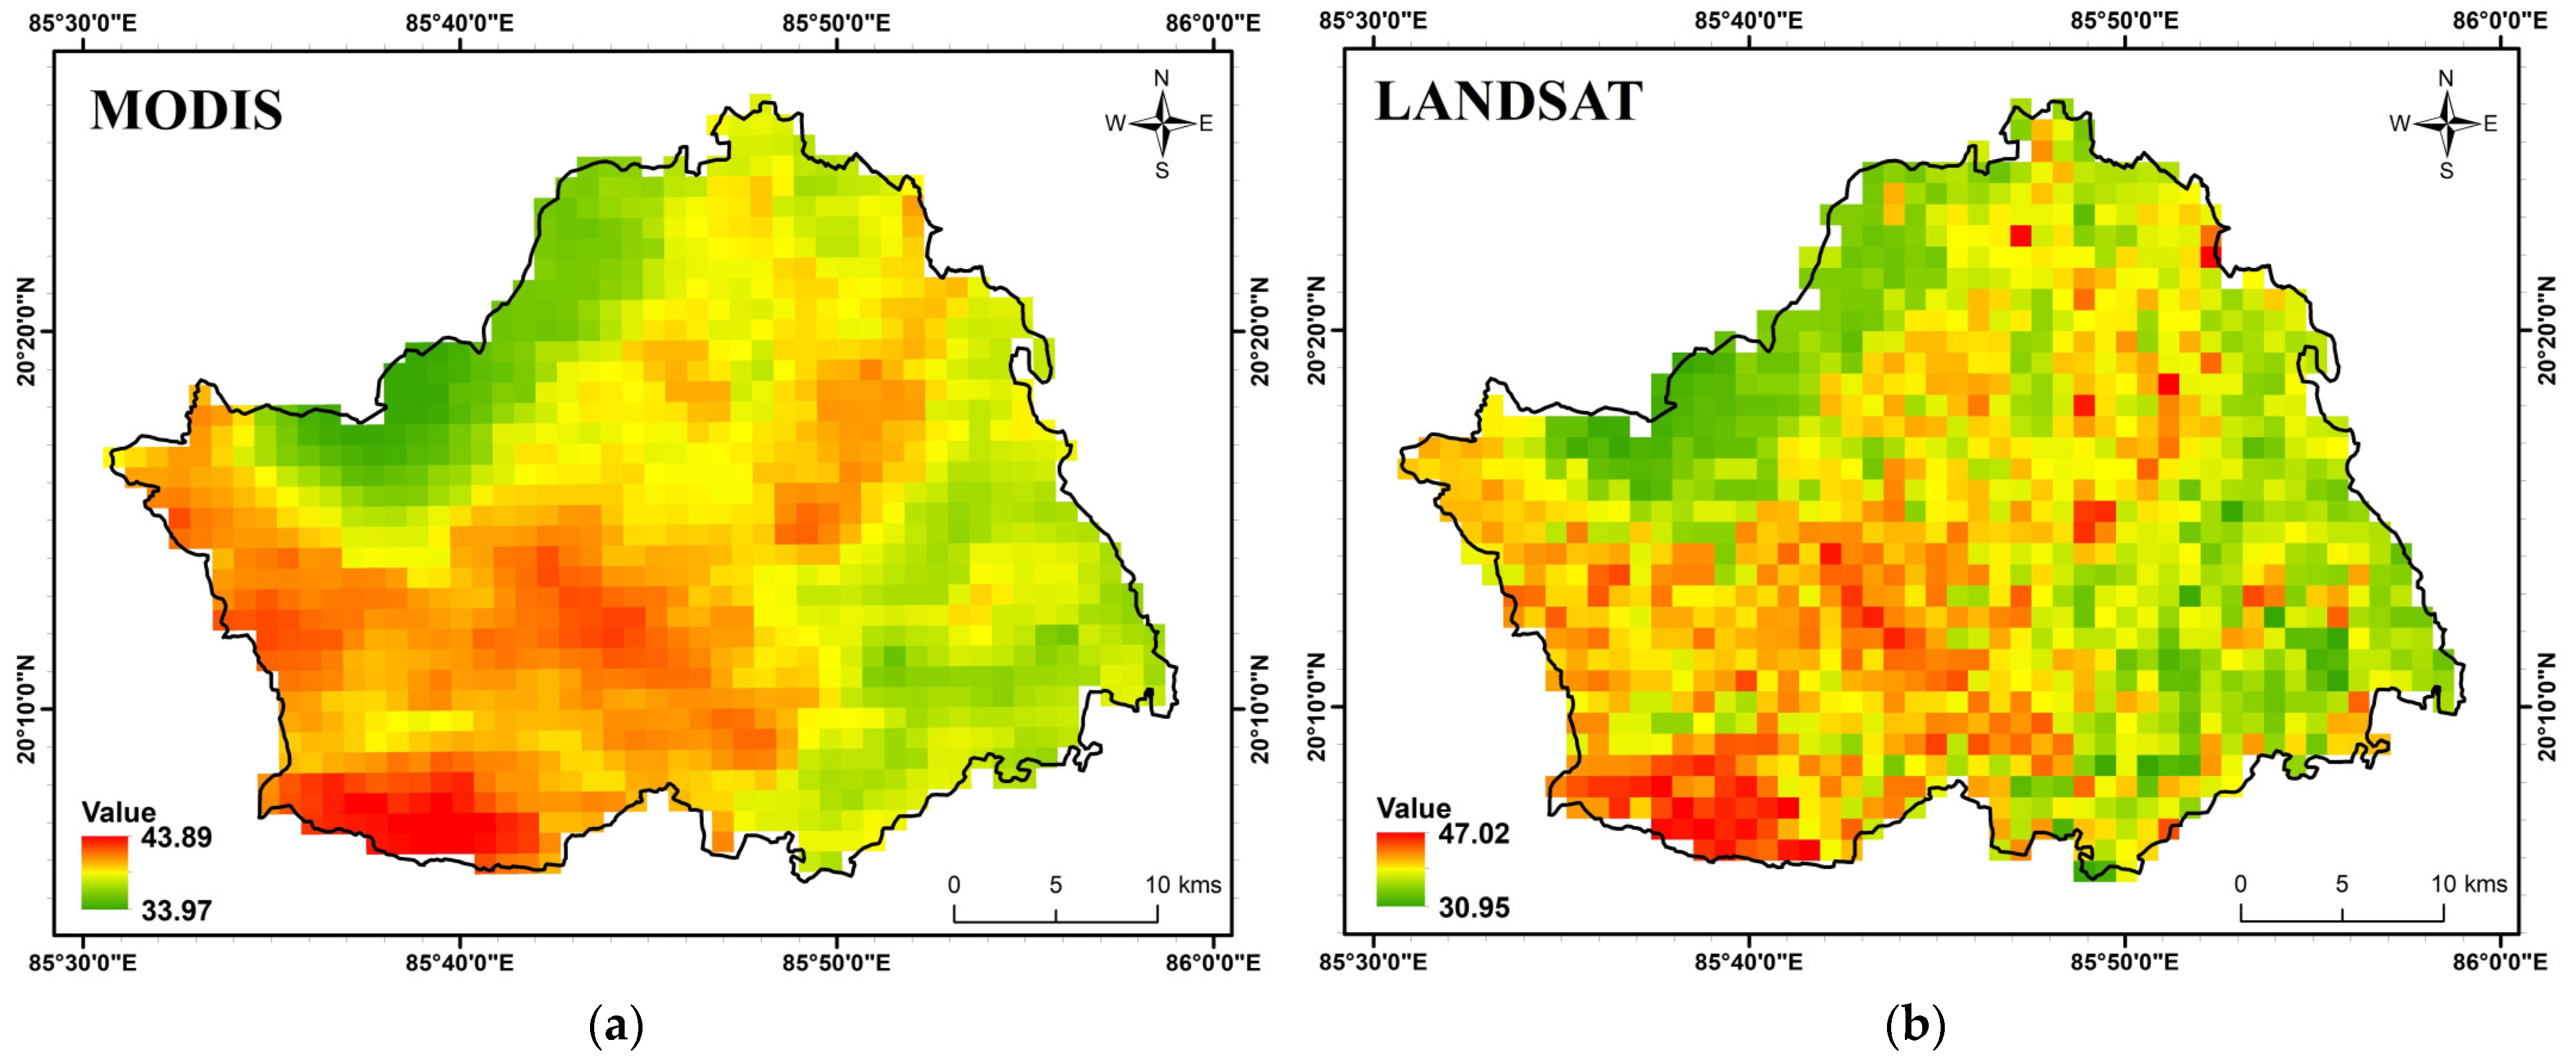
Figure 5 illustrates the MODIS LST product (MOD11A1) for 13 April 2023 and resampled Landsat-estimated LST. The nearest neighbour resampling of the Landsat-derived LST to the spatial resolution of the MODIS product decreased the maximum temperature from 47.85 to 47.02 °C and increased the minimum temperature from 30.38 to 30.95 °C. Statistical summaries of both the MODIS and Landsat LST are shown in Table 2.
The mean temperature values further reflected the closeness of the LST values in both datasets. Figure 6 illustrates the positive correlation (R2 = 0.83) and depicts that both the MODIS and Landsat LST were highly correlated, indicating the high reliability of the Landsat-estimated LST. Therefore, the Landsat-estimated LST can be used for further analysis.
In the following sections, we will delve deeper into comparing the LSTs between the blue-green and non-blue-green areas and explore the implications of these temperature variations for the urban environment.

4.3. Comparison of LST between Different Urban Areas

Landscape features significantly impact the LST, as they considerably change the thermal characteristics of surfaces [57]. A comprehensive masking approach was applied to investigate the thermal characteristics of the blue-green and non-blue-green spaces within the study area. The blue-green spaces, encompassing vegetation and water bodies, were masked from the LST data, allowing for a focused analysis of the contrasting thermal behaviour between these two land cover types. The masked LST data revealed distinct temperature variations, providing valuable insights into the cooling effects of blue-green spaces and the thermal patterns associated with non-blue-green areas.
In Table 3, the statistics reveal notable differences in the temperatures between the blue-green and non-blue-green spaces. The blue-green spaces exhibited lower LST values, with a minimum of 23.87 °C and maximum of 38.07 °C. The mean LST in these areas was 31.97 °C, with a standard deviation of 1.53 °C. This indicates a relatively cooler thermal environment, attributed to the presence of vegetation and water bodies, which help to mitigate UHI effects.
In contrast, the non-blue-green spaces, characterised by bare land and built-up areas, demonstrated higher LST values. The minimum LST recorded in these areas was 24.62 °C, while the maximum reached 40.38 °C. The mean LST in the non-blue-green spaces was 34.12 °C, with a standard deviation of 1.34 °C. These higher LST values reflected the heat-absorbing nature of urban infrastructure, sand patches, and the limited presence of vegetation.
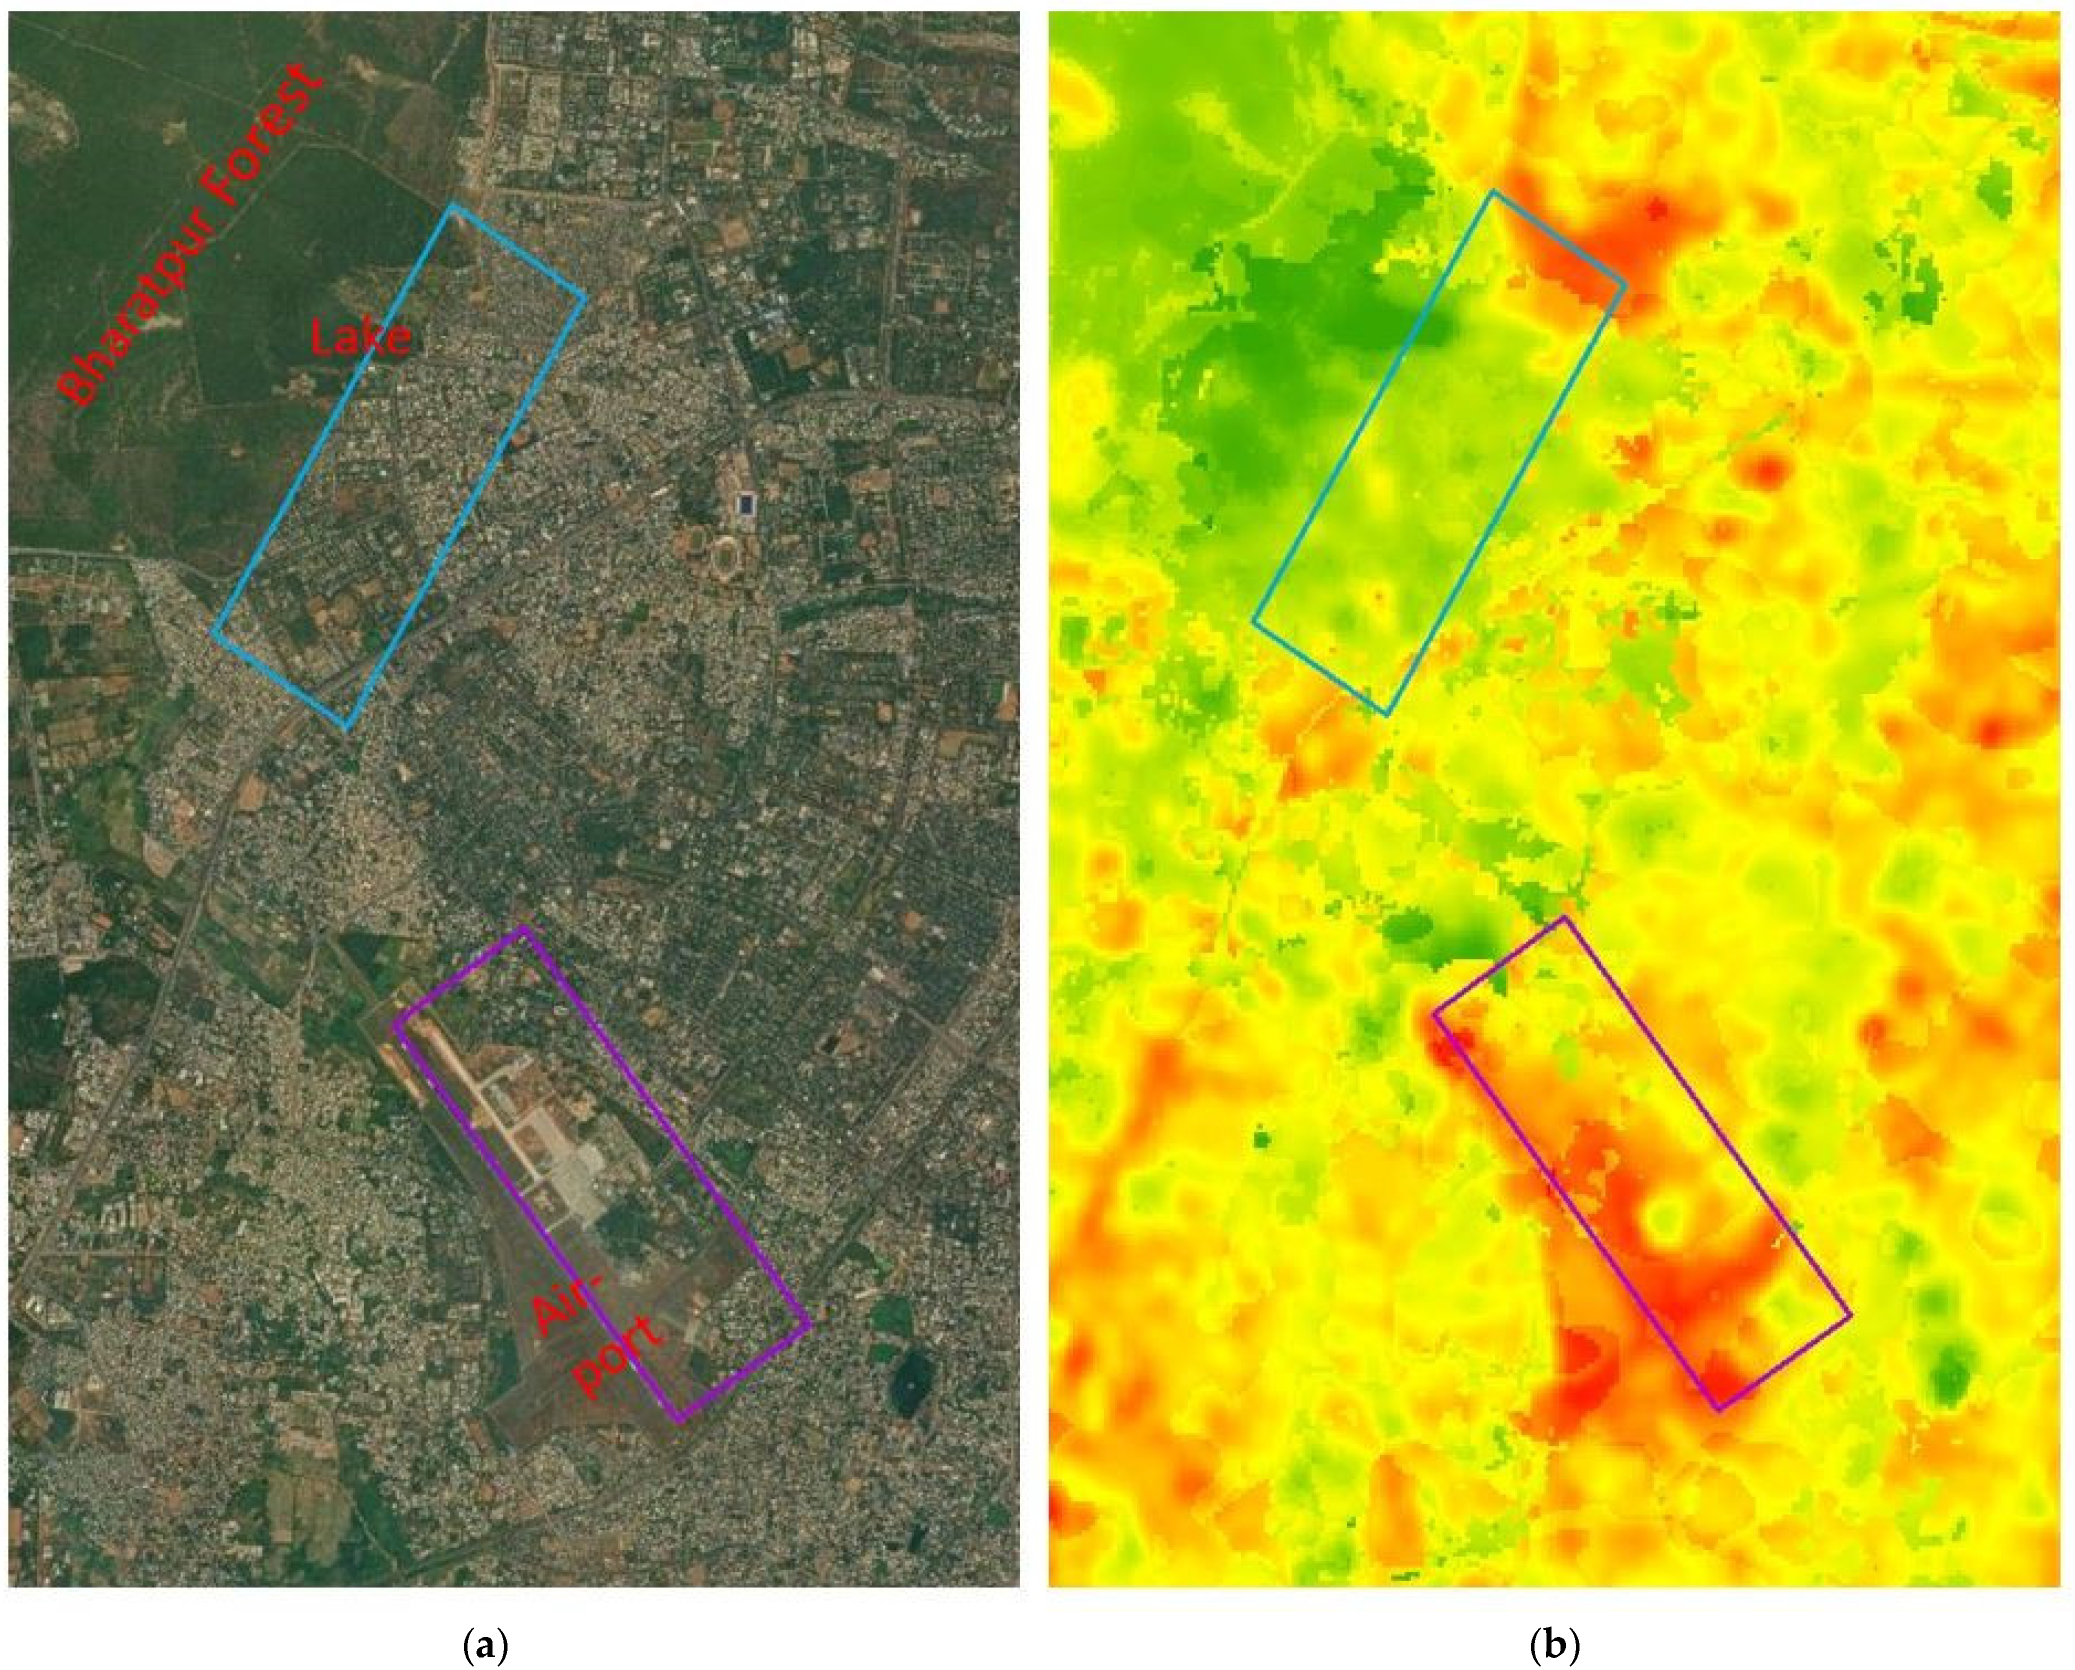
Two sample locations across the study area were identified as, in particular, two types of land cover classes: the Bharatpur forest area, which also includes Ekamra Kanan Lake (representing a blue-green space) and the airport (representing a non-blue-green space). Rectangles of 3 km × 1 km were created for both locations for an LST visualisation and comparison to neighbouring urban areas, as shown in Figure 7.
Figure 7 illustrates the LST distribution in neighbouring areas of the blue-green spaces and non-blue-green spaces, and Table 4 provides a statistical summary of the LST values for the respective sample sites.
These findings highlight the distinct thermal characteristics of blue-green spaces, which demonstrate cooler microclimates compared to non-blue-green areas, and demonstrate the potential cooling effect of blue-green spaces in terms of mitigating UHI effects.

4.4. Correlation Analysis Using Landscape Indices and LST

A correlation analysis was performed using the R-squared (R2) statistic to assess the relationship between the LST and landscape indices. R2 measured how well the landscape indices explained the variability in the LST values. The R2 values, as seen in Figure 8, were obtained for 2023.
These results indicate a moderate positive correlation between the LST and NDBI (R2 = 0.69), suggesting that the built-up index strongly influences the thermal variation in the urban environment. The correlations between the LST and NDVI (R2 = 0.32) and MNDWI (R2 = 0.31) were relatively weaker, but still demonstrated some association. This indicates a higher vegetation cover, and the MNDWI values corresponded to lower land surface temperatures, suggesting the cooling effect of the blue-green spaces in the study area.
The observed correlations between the LST and these landscape indices provide insights into the impact of landscape features, vegetation cover, water content, and built-up areas on the thermal characteristics of the study area. The findings suggest that the NDBI had a more pronounced effect on LST variations, highlighting the influence of urbanisation and human activities on local climate dynamics.

5. Discussion

5.1. Cooling Effect of Blue-Green Spaces

By examining the spatial distribution of the LST, we gained insights into the thermal characteristics of the different land cover types within the study area. This information is crucial for urban planning incorporating Water-Sensitive Urban Design (WSUD) approaches, climate modelling, and implementing strategies for mitigating adverse UHI effects. Understanding the spatial variability of the LST aids in identifying areas that are more susceptible to heat stress and guides the prioritisation of interventions for enhancing the thermal comfort and liveability of urban environments.
The ability of blue-green spaces to mitigate UHI effects may be influenced by unique attributes of an urban area such as climate, geographical location, built environment, and land use patterns. In this study, the analysis of the LST in blue-green spaces showcased lower temperature values, indicating the presence of cooler microclimates compared to those of non-blue-green spaces. These cooler temperatures could be attributed to the shading and evapotranspiration provided by vegetation and the cooling effects of water bodies. The spatial distribution of the LST in the blue-green spaces exhibited a more uniform pattern with relatively lower temperature ranges. It is high time to understand that the cooling effects of blue-green spaces have the potential to mitigate the occurrence of extreme weather patterns, particularly in periods of extreme heat [35].
Unregulated urbanisation has been identified as a leading cause of damage to blue-green spaces. A study conducted in the greater Kolkata area (India) revealed that the rapid expansion of urban areas and an increasing population exerted a substantial impact on the availability and quality of blue-green spaces [58]. Particularly affected were regions that previously harboured water bodies, vegetation, and agricultural land. The conversion of these natural areas into built-up environments led to the loss of valuable green and blue infrastructure and disrupted the ecological balance and ecosystem services provided by blue-green spaces. Consequently, the UHI effects intensified, exacerbating the challenges associated with rising temperatures and compromising urban liveability.
The non-blue-green spaces, predominantly bare land and built-up surfaces, exhibited higher LST values, indicating the presence of UHI effects. These areas experience elevated temperatures due to the absorption and retention of solar radiation by sand patches and artificial materials. The spatial distribution of the LST in the non-blue-green spaces revealed pronounced temperature gradients.
Overall, the comparison of the LST between the blue-green and non-blue-green spaces underscored the significant influence of land cover types on local temperature variations. The findings emphasise the importance of incorporating green and blue infrastructure and sustainable urban design, incorporating WSUD to mitigate urban heat island effects and enhance the overall thermal comfort of urban environments.

5.2. Explore Potential Water-Sensitive Design

Addressing urban thermal environment challenges through strategic approaches has become an imperative need in today’s context [38]. The escalating concerns associated with heat stress and UHI effects demand scientific strategies for mitigation. Expanding our understanding and implementing effective measures is crucial to alleviating the adverse impacts of the urban thermal environment. In the context of Bhubaneswar, several water-sensitive design interventions can be explored to address the challenges associated with urbanisation and the mitigation of UHI effects.
One such intervention is the implementation of green and blue infrastructure, which involves incorporating natural elements and vegetation into urban spaces. The comparison of the LST between the blue-green and non-blue-green spaces in this study underscored the importance of green and blue infrastructure in regulating urban temperatures. The presence of vegetation and water bodies in blue-green spaces contributes to moderating temperature extremes and the creation of more comfortable microclimates. These findings highlight the potential of integrating green spaces and sustainable urban design strategies for mitigating adverse UHI effects and improving the overall thermal comfort within the study area.
Green spaces such as vegetated areas, grasslands, croplands, urban forests, gardens, and parks help to regulate temperatures through evapotranspiration and airflow. These provide greater exposure to nature and shade through the tree canopy and enhance air quality improvement by absorbing surrounding carbon dioxide through photosynthesis, among other environmental benefits for urban dwellers, which, in turn, promotes sustainable urban living [34,35,59,60]. The role of green spaces in promoting a healthy lifestyle [34,61] and mitigating UHI effects is significant; however, the cooling effects of these spaces are complex and varied [38]. Larger green areas often have stronger cooling effects [62], and other studies have found that complex-shaped green spaces cool more effectively than simple-shaped ones [38,63,64,65].
Similarly, water bodies, such as lakes, ponds, and rivers, can significantly reduce temperatures through evaporative cooling and create microclimatic conditions that counteract the heat build-up in urban areas. Water bodies act as heat sinks, absorbing and dissipating heat energy through evaporation and convection. They can help to moderate temperatures in their vicinity, providing a cooling effect to surrounding areas. According to a meta-analysis of data from 27 local meteorological stations, the northern hemisphere’s water bodies can have a cooling effect of 16.4 °C during the hottest months [66]. Additionally, water bodies contribute to the aesthetic appeal of cities, support biodiversity, and provide recreational opportunities for their dwellers.
In addition to green and blue infrastructure, integrating water-efficient technologies can further enhance the water sensitivity in Bhubaneswar. One such technology is rainwater- and stormwater-harvesting (SWH) systems, which have been proven effective in evaporating, cooling, and promoting urban sustainability. A study on Melbourne for suitable SWH site selection based on a multi-criteria decision analysis (MCDA) evaluation could be useful for urban planners and water managers [67]. By implementing SWH systems and embracing water-sensitive design approaches, Bhubaneswar can enhance its water resilience, reduce its reliance on external water sources, and contribute to sustainable urban development.
One more promising water-sensitive design solution for urban areas is cool roofs. Studies conducted in Indian cities such as Ahmedabad and Hyderabad have highlighted their benefits, including reduced surface temperatures, improved indoor comfort, and energy savings [68,69]. Implementing cool roofs on a larger scale can mitigate UHI effects, enhance thermal comfort, and promote sustainability. Raising awareness, providing incentives, and fostering collaboration among stakeholders is essential for their widespread adoption in Indian cities like Bhubaneswar. Cool roofs contribute to a more sustainable and resilient urban environment while conserving water resources.
By adopting these water-sensitive design interventions, Bhubaneswar could mitigate the impacts of urbanisation on its water resources, improve its water quality, and enhance its overall water sustainability. These approaches demonstrate the city’s commitment to creating a more resilient and environmentally conscious urban environment.

5.3. Heat Action Plans (HAPs) as a Strategic Approach for Managing Urban Heat

Better heat preparedness measures and incorporating action plans are essential right from the nascent stage in “Tier 2” cities like Bhubaneswar, as Tier 2 cities are commonly regarded as “engines of growth” due to their economic potential. HAPs have emerged as a vital tool for addressing the challenges posed by urban heat and safeguarding the well-being of communities. These plans generally encompass a heatwave alert system to notify vulnerable populations, interdepartmental coordination, initiatives for raising awareness, training, promoting behaviour changes to minimise heat exposure, and short-term measures such as healthcare interventions and adjusting work schedules, as well as long-term strategies such as infrastructure investments (e.g., water-harvesting systems), agricultural practice changes, and urban planning adjustments (e.g., green corridors) [70]. These comprehensive strategies are designed to proactively manage extreme heat events and mitigate their adverse impacts.
Ahmedabad (India) city’s devastating heatwave in 2010, claiming more than 1300 lives, prompted the development of coordinated HAPs to address such risks [71]. The first HAP in south Asia has successfully prevented over 1100 annual deaths since its implementation in Ahmedabad [72]. These initiatives highlight the importance of mitigating UHI effects and safeguarding vulnerable populations. Various factors such as age, disabilities, housing conditions, and individual behaviours contribute to the risks of heat-related illnesses, and these risks can vary based on geographic location and the adaptive measures taken by individuals [73]. Many low-income and marginalised groups already have trouble affording thermal comfort in their overcrowded, poorly ventilated houses when temperatures rise [74].
Recent HAPs for Bhubaneswar were released in 2020 [33]. These HAPs acknowledged the significance of considering all parameters of exposure, sensitivity, and vulnerability when developing response plans, especially the identification and vulnerability assessments of population and livelihood. However, integrating HAPs with other policies in Bhubaneswar is crucial to effectively addressing the challenges posed by UHI effects. By aligning HAPs with existing urban development and environmental and public health policies, synergistic approaches can be adopted to enhance the city’s resilience to extreme heat events. This integration can facilitate coordinated efforts, resource allocation, and implementation strategies, ensuring that the mitigation and adaptation measures outlined in the HAPs are effectively integrated into broader policy frameworks. By leveraging existing policies and promoting cross-sectoral collaboration, Bhubaneswar could develop a comprehensive and holistic approach to combating the adverse impacts of urban heat and safeguarding the well-being of its dwellers.
There is discussion about improving urban landscapes with green and blue infrastructure in long-term adaption and mitigation measures in Bhubaneswar HAPs. Green infrastructure such as vertical greenery (green wall), green roofs, wetlands, and urban forests, and blue infrastructure such as investments in water bodies and fountains are being discussed in these long-term measures. Expanding the creation of blue-green spaces remains crucial to mitigating UHI effects, as indicated by the findings from the LST analysis. Further, there is a need to include long-term measures such as cool roofs and short-term, nature-based measures such as green roofs, maintaining existing water bodies, reducing water wastage, banning solid waste burning, preventing forest fires, and shade provision in Bhubaneswar HAPs.

6. Conclusions

This study investigated the UHI phenomenon in Bhubaneswar using remote sensing and geospatial analysis techniques. The analysis of the LST and landscape indices provided insights into the spatial distribution of heat and the relationship between the land cover characteristics and surface temperature. The Landsat-estimated LST was successfully validated by the MODIS LST. The results revealed the presence of thermal hotspots (above 36.2 °C) in the southwestern part of the city, which were attributed to factors such as low vegetation density and proximity to water bodies. Additionally, the comparison between the blue-green and non-blue-green spaces highlighted the cooling effect of blue-green spaces and their impact on reducing surface temperature. There was a 2.15 °C mean temperature difference between the blue-green spaces and non-blue-green spaces within the study period.
The implications of UHI mitigation were discussed, emphasising the importance of integrating strategies such as promoting green and blue infrastructure, water-sensitive designs, and implementing HAPs. The successful implementation of HAPs in other cities, as evidenced by reductions in heat-related fatalities, underscores the potential effectiveness of such measures in Bhubaneswar. Furthermore, water-sensitive designs, such as cool roofs, rainwater harvesting, and stormwater management systems, can enhance water sensitivity and contribute to UHI mitigation efforts. There is a need to include short-term, nature-based adaption and mitigation measures in the existing HAPs of Bhubaneswar, such as green roofs, maintaining existing water bodies, reducing water wastage, banning solid waste burning, preventing forest fires, and shade provision, and long-term measures such as cool roofs.
Overall, this study highlighted the importance of understanding and addressing the UHI phenomenon in the context of Bhubaneswar. The findings and recommendations presented here provide valuable insights for policymakers, urban planners, and researchers across the globe working towards creating sustainable and resilient cities, which prioritise the well-being and comfort of their inhabitants while mitigating the adverse impacts of urbanisation and climate change.

Author Contributions

Each co-author contributed to the research published in this paper. Conceptualization, A.K.S.; Data curation, P.; Formal Analysis, P. and A.K.S.; Investigation, P.; Methodology, P. and A.K.S.; Project administration, R.D.G.; Resources, R.D.G.; Software, P.; Supervision, R.D.G. and A.K.S.; Validation, R.D.G. and A.K.S.; Visualization, P. and R.D.G.; Writing—original draft, P.; Writing—review & editing, R.D.G. and A.K.S. All authors have read and agreed to the published version of the manuscript.

Funding

This research received no external funding.

Data Availability Statement

Not applicable.

Acknowledgments

We are sincerely grateful to Google Earth Engine’s for available remote sensing data and data processing.

Conflicts of Interest

The authors declare no conflict of interest.

References

  1. Fu, P.; Weng, Q. A Time Series Analysis of Urbanization Induced Land Use and Land Cover Change and Its Impact on Land Surface Temperature with Landsat Imagery. Remote Sens. Environ. 2016, 175, 205–214. [Google Scholar] [CrossRef]
  2. Grimm, N.B.; Faeth, S.H.; Golubiewski, N.E.; Redman, C.L.; Wu, J.; Bai, X.; Briggs, J.M. Global Change and the Ecology of Cities. Science 2008, 319, 756–760. [Google Scholar] [CrossRef] [PubMed]
  3. Mondal, A.; Guha, S.; Kundu, S. Dynamic Status of Land Surface Temperature and Spectral Indices in Imphal City, India from 1991 to 2021. Geomat. Nat. Hazards Risk 2021, 12, 3265–3286. [Google Scholar] [CrossRef]
  4. Guha, S.; Govil, H.; Dey, A.; Gill, N. A Case Study on the Relationship between Land Surface Temperature and Land Surface Indices in Raipur City, India. Geogr. Tidsskr.-Dan. J. Geogr. 2020, 120, 35–50. [Google Scholar] [CrossRef]
  5. Zhou, D.; Xiao, J.; Bonafoni, S.; Berger, C.; Deilami, K.; Zhou, Y.; Frolking, S.; Yao, R.; Qiao, Z.; Sobrino, J.A. Satellite Remote Sensing of Surface Urban Heat Islands: Progress, Challenges, and Perspectives. Remote Sens. 2019, 11, 48. [Google Scholar] [CrossRef]
  6. Guo, L.; Liu, R.; Men, C.; Wang, Q.; Miao, Y.; Zhang, Y. Quantifying and Simulating Landscape Composition and Pattern Impacts on Land Surface Temperature: A Decadal Study of the Rapidly Urbanizing City of Beijing, China. Sci. Total Environ. 2019, 654, 430–440. [Google Scholar] [CrossRef]
  7. Tran, D.X.; Pla, F.; Latorre-Carmona, P.; Myint, S.W.; Caetano, M.; Kieu, H.V. Characterizing the Relationship between Land Use Land Cover Change and Land Surface Temperature. ISPRS J. Photogramm. Remote Sens. 2017, 124, 119–132. [Google Scholar] [CrossRef]
  8. Singh, P.; Kikon, N.; Verma, P. Impact of Land Use Change and Urbanization on Urban Heat Island in Lucknow City, Central India. A Remote Sensing Based Estimate. Sustain. Cities Soc. 2017, 32, 100–114. [Google Scholar] [CrossRef]
  9. Ravanelli, R.; Nascetti, A.; Cirigliano, R.V.; Di Rico, C.; Leuzzi, G.; Monti, P.; Crespi, M. Monitoring the Impact of Land Cover Change on Surface Urban Heat Island through Google Earth Engine: Proposal of a Global Methodology, First Applications and Problems. Remote Sens. 2018, 10, 1488. [Google Scholar] [CrossRef]
  10. Voogt, J.A.; Oke, T.R. Thermal Remote Sensing of Urban Climates. Remote Sens. Environ. 2003, 86, 370–384. [Google Scholar] [CrossRef]
  11. Amiri, R.; Weng, Q.; Alimohammadi, A.; Alavipanah, S.K. Spatial-Temporal Dynamics of Land Surface Temperature in Relation to Fractional Vegetation Cover and Land Use/Cover in the Tabriz Urban Area, Iran. Remote Sens. Environ. 2009, 113, 2606–2617. [Google Scholar] [CrossRef]
  12. Arnfield, A.J. Two Decades of Urban Climate Research: A Review of Turbulence, Exchanges of Energy and Water, and the Urban Heat Island. Int. J. Climatol. 2003, 23, 1–26. [Google Scholar] [CrossRef]
  13. Guha, S.; Govil, H. Annual Assessment on the Relationship between Land Surface Temperature and Six Remote Sensing Indices Using Landsat Data from 1988 to 2019. Geocarto Int. 2022, 37, 4292–4311. [Google Scholar] [CrossRef]
  14. Guha, S.; Govil, H. Seasonal Impact on the Relationship between Land Surface Temperature and Normalized Difference Vegetation Index in an Urban Landscape. Geocarto Int. 2022, 37, 2252–2272. [Google Scholar] [CrossRef]
  15. Mirzaei, P.A. Recent Challenges in Modeling of Urban Heat Island. Sustain. Cities Soc. 2015, 19, 200–206. [Google Scholar] [CrossRef]
  16. Rinner, C.; Hussain, M. Toronto’s Urban Heat Island-Exploring the Relationship between Land Use and Surface Temperature. Remote Sens. 2011, 3, 1251–1265. [Google Scholar] [CrossRef]
  17. Halder, B.; Bandyopadhyay, J. Evaluating the Impact of Climate Change on Urban Environment Using Geospatial Technologies in the Planning Area of Bilaspur, India. Environ. Chall. 2021, 5, 100286. [Google Scholar] [CrossRef]
  18. Kayet, N.; Pathak, K.; Chakrabarty, A.; Sahoo, S. Spatial Impact of Land Use/Land Cover Change on Surface Temperature Distribution in Saranda Forest, Jharkhand. Model Earth Syst. Environ. 2016, 2, 127. [Google Scholar] [CrossRef]
  19. Chun, B.; Guldmann, J.M. Spatial Statistical Analysis and Simulation of the Urban Heat Island in High-Density Central Cities. Landsc. Urban Plan. 2014, 125, 76–88. [Google Scholar] [CrossRef]
  20. Coseo, P.; Larsen, L. How Factors of Land Use/Land Cover, Building Configuration, and Adjacent Heat Sources and Sinks Explain Urban Heat Islands in Chicago. Landsc. Urban Plan. 2014, 125, 117–129. [Google Scholar] [CrossRef]
  21. Dai, Z.; Guldmann, J.M.; Hu, Y. Spatial Regression Models of Park and Land-Use Impacts on the Urban Heat Island in Central Beijing. Sci. Total Environ. 2018, 626, 1136–1147. [Google Scholar] [CrossRef]
  22. Kim, J.P.; Guldmann, J.M. Land-Use Planning and the Urban Heat Island. Environ. Plan B Plann. Des. 2014, 41, 1077–1099. [Google Scholar] [CrossRef]
  23. Zhang, H.; Qi, Z.F.; Ye, X.Y.; Cai, Y.B.; Ma, W.C.; Chen, M.N. Analysis of Land Use/Land Cover Change, Population Shift, and Their Effects on Spatiotemporal Patterns of Urban Heat Islands in Metropolitan Shanghai, China. Appl. Geogr. 2013, 44, 121–133. [Google Scholar] [CrossRef]
  24. Zhou, W.; Huang, G.; Cadenasso, M.L. Does Spatial Configuration Matter? Understanding the Effects of Land Cover Pattern on Land Surface Temperature in Urban Landscapes. Landsc. Urban Plan. 2011, 102, 54–63. [Google Scholar] [CrossRef]
  25. Krishnan, R.; Sanjay, J.; Gnanaseelan, C.; Mujumdar, M.; Kulkarni, A.; Chakraborty, S. Assessment of Climate Change over the Indian Region A Report of the Ministry of Earth Sciences (MoES); Government of India: New Delhi, India, 2020. [Google Scholar]
  26. Halder, D.; Garg, R.D.; Fedotov, A. Latitudinal Trend Analysis of Land Surface Temperature to Identify Urban Heat Pockets in Global Coastal Megacities. Remote Sens. 2023, 15, 1355. [Google Scholar] [CrossRef]
  27. Habeeb, D.; Vargo, J.; Stone, B. Rising Heat Wave Trends in Large US Cities. Nat. Hazards 2015, 76, 1651–1665. [Google Scholar] [CrossRef]
  28. Perkins, S.E.; Alexander, L.V.; Nairn, J.R. Increasing Frequency, Intensity and Duration of Observed Global Heatwaves and Warm Spells. Geophys. Res. Lett. 2012, 39, 10. [Google Scholar] [CrossRef]
  29. Rathi, S.K.; Chakraborty, S.; Mishra, S.K.; Dutta, A.; Nanda, L. A Heat Vulnerability Index: Spatial Patterns of Exposure, Sensitivity and Adaptive Capacity for Urbanites of Four Cities of India. Int. J. Environ. Res. Public Health 2022, 19, 283. [Google Scholar] [CrossRef]
  30. India National Disaster Management Authority. National Guidelines for Preparation of Action Plan-Prevention and Management of Heatwave; India National Disaster Management Authority: New Delhi, India, 2019.
  31. Mazdiyasni, O.; Aghakouchak, A.; Davis, S.J.; Madadgar, S.; Mehran, A.; Ragno, E.; Sadegh, M.; Sengupta, A.; Ghosh, S.; Dhanya, C.T.; et al. Increasing Probability of Mortality during Indian Heat Waves. Available online: https://www.science.org/doi/full/10.1126/sciadv.1700066 (accessed on 25 June 2023).
  32. Pattanaik, D.R.; Mohapatra, M.; Srivastava, A.K.; Kumar, A. Heat Wave over India during Summer 2015: An Assessment of Real Time Extended Range Forecast. Meteorol. Atmos. Phys. 2017, 129, 375–393. [Google Scholar] [CrossRef]
  33. Integrated Research and Action for Development (IRADe). Heat Wave Action Plan-Bhubaneswar City; Integrated Research and Action for Development (IRADe): New Delhi, India, 2020. [Google Scholar]
  34. Halder, B.; Bandyopadhyay, J.; Al-Hilali, A.A.; Ahmed, A.M.; Falah, M.W.; Abed, S.A.; Falih, K.T.; Khedher, K.M.; Scholz, M.; Yaseen, Z.M. Assessment of Urban Green Space Dynamics Influencing the Surface Urban Heat Stress Using Advanced Geospatial Techniques. Agronomy 2022, 12, 2129. [Google Scholar] [CrossRef]
  35. Cai, Y.B.; Wu, Z.J.; Chen, Y.H.; Wu, L.; Pan, W. Bin Investigate the Difference of Cooling Effect between Water Bodies and Green Spaces: The Study of Fuzhou, China. Water 2022, 14, 1471. [Google Scholar] [CrossRef]
  36. Gascon, M.; Mas, M.T.; Martínez, D.; Dadvand, P.; Forns, J.; Plasència, A.; Nieuwenhuijsen, M.J. Mental Health Benefits of Long-Term Exposure to Residential Green and Blue Spaces: A Systematic Review. Int. J. Environ. Res. Public Health 2015, 12, 4354–4379. [Google Scholar] [CrossRef] [PubMed]
  37. Gunawardena, K.R.; Wells, M.J.; Kershaw, T. Utilising Green and Bluespace to Mitigate Urban Heat Island Intensity. Sci. Total Environ. 2017, 584–585, 1040–1055. [Google Scholar] [CrossRef]
  38. Qiu, X.; Kil, S.H.; Jo, H.K.; Park, C.; Song, W.; Choi, Y.E. Cooling Effect of Urban Blue and Green Spaces: A Case Study of Changsha, China. Int. J. Environ. Res. Public Health 2023, 20, 2613. [Google Scholar] [CrossRef] [PubMed]
  39. Martins, T.A.L.; Adolphe, L.; Bonhomme, M.; Bonneaud, F.; Faraut, S.; Ginestet, S.; Michel, C.; Guyard, W. Impact of Urban Cool Island Measures on Outdoor Climate and Pedestrian Comfort: Simulations for a New District of Toulouse, France. Sustain. Cities Soc. 2016, 26, 9–26. [Google Scholar] [CrossRef]
  40. Yu, Z.; Yang, G.; Zuo, S.; Jørgensen, G.; Koga, M.; Vejre, H. Critical Review on the Cooling Effect of Urban Blue-Green Space: A Threshold-Size Perspective. Urban For. Urban Green 2020, 49, 126630. [Google Scholar] [CrossRef]
  41. Yu, Z.; Yao, Y.; Yang, G.; Wang, X.; Vejre, H. Strong Contribution of Rapid Urbanization and Urban Agglomeration Development to Regional Thermal Environment Dynamics and Evolution. Ecol. Manag. 2019, 446, 214–225. [Google Scholar] [CrossRef]
  42. Jamei, E.; Tapper, N. WSUD and Urban Heat Island Effect Mitigation. In Approaches to Water Sensitive Urban Design: Potential, Design, Ecological Health, Urban Greening, Economics, Policies, and Community Perceptions; Elsevier: Amsterdam, The Netherlands, 2018; pp. 381–407. ISBN 9780128128435. [Google Scholar]
  43. Beecham, S.; Razzaghmanesh, M.; Bustami, R.; Ward, J. The Role of Green Roofs and Living Walls as WSUD Approaches in a Dry Climate. In Approaches to Water Sensitive Urban Design: Potential, Design, Ecological Health, Urban Greening, Economics, Policies, and Community Perceptions; Elsevier: Amsterdam, The Netherlands, 2018; pp. 409–430. ISBN 9780128128435. [Google Scholar]
  44. Rouse, W.; Haas, R.H.; Deering, D.W. Paper A 20 Monitoring Vegetation Systems In The Great Plains With Erts. In Proceedings of the Third Earth Resources Technology Satellite-1 Symposium: Section A–B, Washington, DC, USA, 10–14 December 1973. [Google Scholar]
  45. Xu, H. Modification of Normalised Difference Water Index (NDWI) to Enhance Open Water Features in Remotely Sensed Imagery. Int. J. Remote Sens. 2006, 27, 3025–3033. [Google Scholar] [CrossRef]
  46. De Moura Reis, L.G.; de Oliveira Souza, W.; Ribeiro Neto, A.; Fragoso, C.R.; Ruiz-Armenteros, A.M.; da Silva Pereira Cabral, J.J.; Montenegro, S.M.G.L. Uncertainties Involved in the Use of Thresholds for the Detection of Water Bodies in Multitemporal Analysis from Landsat-8 and Sentinel-2 Images. Sensors 2021, 21, 7479. [Google Scholar] [CrossRef]
  47. Al-Doski, J.; Mansor, S.B.; Zulhaidi, H.; Shafri, M. NDVI Differencing and Post-Classification to Detect Vegetation Changes in Halabja City, Iraq. IOSR J. Appl. Geol. Geophys. 2013, 1, 1–10. [Google Scholar] [CrossRef]
  48. Zha, Y.; Gao, J.; Ni, S. Use of Normalized Difference Built-up Index in Automatically Mapping Urban Areas from TM Imagery. Int. J. Remote Sens. 2003, 24, 583–594. [Google Scholar] [CrossRef]
  49. Li, Z.L.; Wu, H.; Wang, N.; Qiu, S.; Sobrino, J.A.; Wan, Z.; Tang, B.H.; Yan, G. Land Surface Emissivity Retrieval from Satellite Data. Int. J. Remote Sens. 2013, 34, 3084–3127. [Google Scholar] [CrossRef]
  50. Chakraborty, T.C.; Lee, X.; Ermida, S.; Zhan, W. On the Land Emissivity Assumption and Landsat-Derived Surface Urban Heat Islands: A Global Analysis. Remote Sens. Environ. 2021, 265, 112682. [Google Scholar] [CrossRef]
  51. Malakar, N.K.; Hulley, G.C.; Hook, S.J.; Laraby, K.; Cook, M.; Schott, J.R. An Operational Land Surface Temperature Product for Landsat Thermal Data: Methodology and Validation. IEEE Trans. Geosci. Remote Sens. 2018, 56, 5717–5735. [Google Scholar] [CrossRef]
  52. Sekertekin, A.; Bonafoni, S. Sensitivity Analysis and Validation of Daytime and Nighttime Land Surface Temperature Retrievals from Landsat 8 Using Different Algorithms and Emissivity Models. Remote Sens. 2020, 12, 2776. [Google Scholar] [CrossRef]
  53. Ermida, S.L.; Soares, P.; Mantas, V.; Göttsche, F.M.; Trigo, I.F. Google Earth Engine Open-Source Code for Land Surface Temperature Estimation from the Landsat Series. Remote Sens. 2020, 12, 1471. [Google Scholar] [CrossRef]
  54. Mishra, K.; Garg, R.D. Assessing Variations in Land Cover-Land Use and Surface Temperature Dynamics for Dehradun, India, Using Multi-Time and Multi-Sensor Landsat Data. Environ. Monit. Assess. 2023, 195, 373. [Google Scholar] [CrossRef]
  55. Das, T.; Jana, A.; Mandal, B.; Sutradhar, A. S Patio-Temporal Pattern of Land Use and Land Cover and Its Effects on Land Surface Temperature Using Remote Sensing and GIS Techniques: A Case Study of Bhubaneswar City, Eastern India (1991–2021). Geo-Journal 2022, 87, 765–795. [Google Scholar] [CrossRef]
  56. Pritipadmaja; Garg, R.D. Evaluating the Impact of Climate Change on the Urban Environment Using Geospatial Technologies in Bhubaneswar, India. ISPRS Int. Arch. Photogramm. Remote. Sens. Spat. Inf. Sci. 2022, 48, 159–166. [Google Scholar] [CrossRef]
  57. Roy, B.; Bari, E. Examining the Relationship between Land Surface Temperature and Landscape Features Using Spectral Indices with Google Earth Engine. Heliyon 2022, 8, e10668. [Google Scholar] [CrossRef]
  58. Halder, B.; Bandyopadhyay, J.; Banik, P. Evaluation of the Climate Change Impact on Urban Heat Island Based on Land Surface Temperature and Geospatial Indicators. Int. J. Environ. Res. 2021, 15, 819–835. [Google Scholar] [CrossRef]
  59. Doick, K.J.; Peace, A.; Hutchings, T.R. The Role of One Large Greenspace in Mitigating London’s Nocturnal Urban Heat Island. Sci. Total Environ. 2014, 493, 662–671. [Google Scholar] [CrossRef]
  60. Rahman, M.A.; Moser, A.; Rötzer, T.; Pauleit, S. Within Canopy Temperature Differences and Cooling Ability of Tilia Cordata Trees Grown in Urban Conditions. Build Environ. 2017, 114, 118–128. [Google Scholar] [CrossRef]
  61. Hashim, B.M.; Al Maliki, A.; Sultan, M.A.; Shahid, S.; Yaseen, Z.M. Effect of Land Use Land Cover Changes on Land Surface Temperature during 1984–2020: A Case Study of Baghdad City Using Landsat Image. Nat. Hazards 2022, 112, 1223–1246. [Google Scholar] [CrossRef]
  62. Du, H.; Cai, W.; Xu, Y.; Wang, Z.; Wang, Y.; Cai, Y. Quantifying the Cool Island Effects of Urban Green Spaces Using Remote Sensing Data. Urban Urban Green 2017, 27, 24–31. [Google Scholar] [CrossRef]
  63. Sun, X.; Tan, X.; Chen, K.; Song, S.; Zhu, X.; Hou, D. Quantifying Landscape-Metrics Impacts on Urban Green-Spaces and Water-Bodies Cooling Effect: The Study of Nanjing, China. Urban Urban Green 2020, 55, 126838. [Google Scholar] [CrossRef]
  64. Wang, C.; Ren, Z.; Dong, Y.; Zhang, P.; Guo, Y.; Wang, W.; Bao, G. Efficient Cooling of Cities at Global Scale Using Urban Green Space to Mitigate Urban Heat Island Effects in Different Climatic Regions. Urban Urban Green 2022, 74, 127635. [Google Scholar] [CrossRef]
  65. Chang, C.R.; Li, M.H.; Chang, S.D. A Preliminary Study on the Local Cool-Island Intensity of Taipei City Parks. Landsc. Urban Plan. 2007, 80, 386–395. [Google Scholar] [CrossRef]
  66. Völker, S.; Baumeister, H.; Classen, T.; Hornberg, C.; Kistemann, T. Evidence for the Temperature-Mitigating Capacity of Urban Blue Space—A Health Geographic Perspective. Erdkunde 2013, 67, 355–371. [Google Scholar] [CrossRef]
  67. Inamdar, P.M.; Sharma, A.K.; Cook, S.; Perera, B.J.C. Evaluation of Stormwater Harvesting Sites Using Multi Criteria Decision Methodology. J. Hydrol. 2018, 562, 181–192. [Google Scholar] [CrossRef]
  68. Joshi, J.; Magal, A.; Limaye, V.S.; Madan, P.; Jaiswal, A.; Mavalankar, D.; Knowlton, K. Climate Change and 2030 Cooling Demand in Ahmedabad, India: Opportunities for Expansion of Renewable Energy and Cool Roofs. Mitig. Adapt. Strat. Glob. Change 2022, 27, 44. [Google Scholar] [CrossRef] [PubMed]
  69. Telangana Cool Roof Policy 2023–2028; Government of Telangana: Hyderabad, India, 2023.
  70. Executive Summary 1998. Available online: www.cprindia.org (accessed on 20 June 2023).
  71. Knowlton, K.; Kulkarni, S.P.; Azhar, G.S.; Mavalankar, D.; Jaiswal, A.; Connolly, M.; Nori-Sarma, A.; Rajiva, A.; Dutta, P.; Deol, B.; et al. Development and Implementation of South Asia’s First Heat-Health Action Plan in Ahmedabad (Gujarat, India). Int. J. Environ. Res. Public Health 2014, 11, 3473–3492. [Google Scholar] [CrossRef] [PubMed]
  72. Hess, J.J.; Sathish, L.M.; Knowlton, K.; Saha, S.; Dutta, P.; Ganguly, P.; Tiwari, A.; Jaiswal, A.; Sheffield, P.; Sarkar, J.; et al. Building Resilience to Climate Change: Pilot Evaluation of the Impact of India’s First Heat Action Plan on All-Cause Mortality. J. Environ. Public Health 2018, 2018, 7973519. [Google Scholar] [CrossRef] [PubMed]
  73. Jodhpur Heat Action Plan 2023. Available online: https://www.mahilahousingtrust.org/ (accessed on 25 May 2023).
  74. Ozone Cell Ministry of Environment, Forest & Climate Change Government of India. India Cooling Action Plan; Ministry of Environment, Forest & Climate Change: New Delhi, India, 2019.
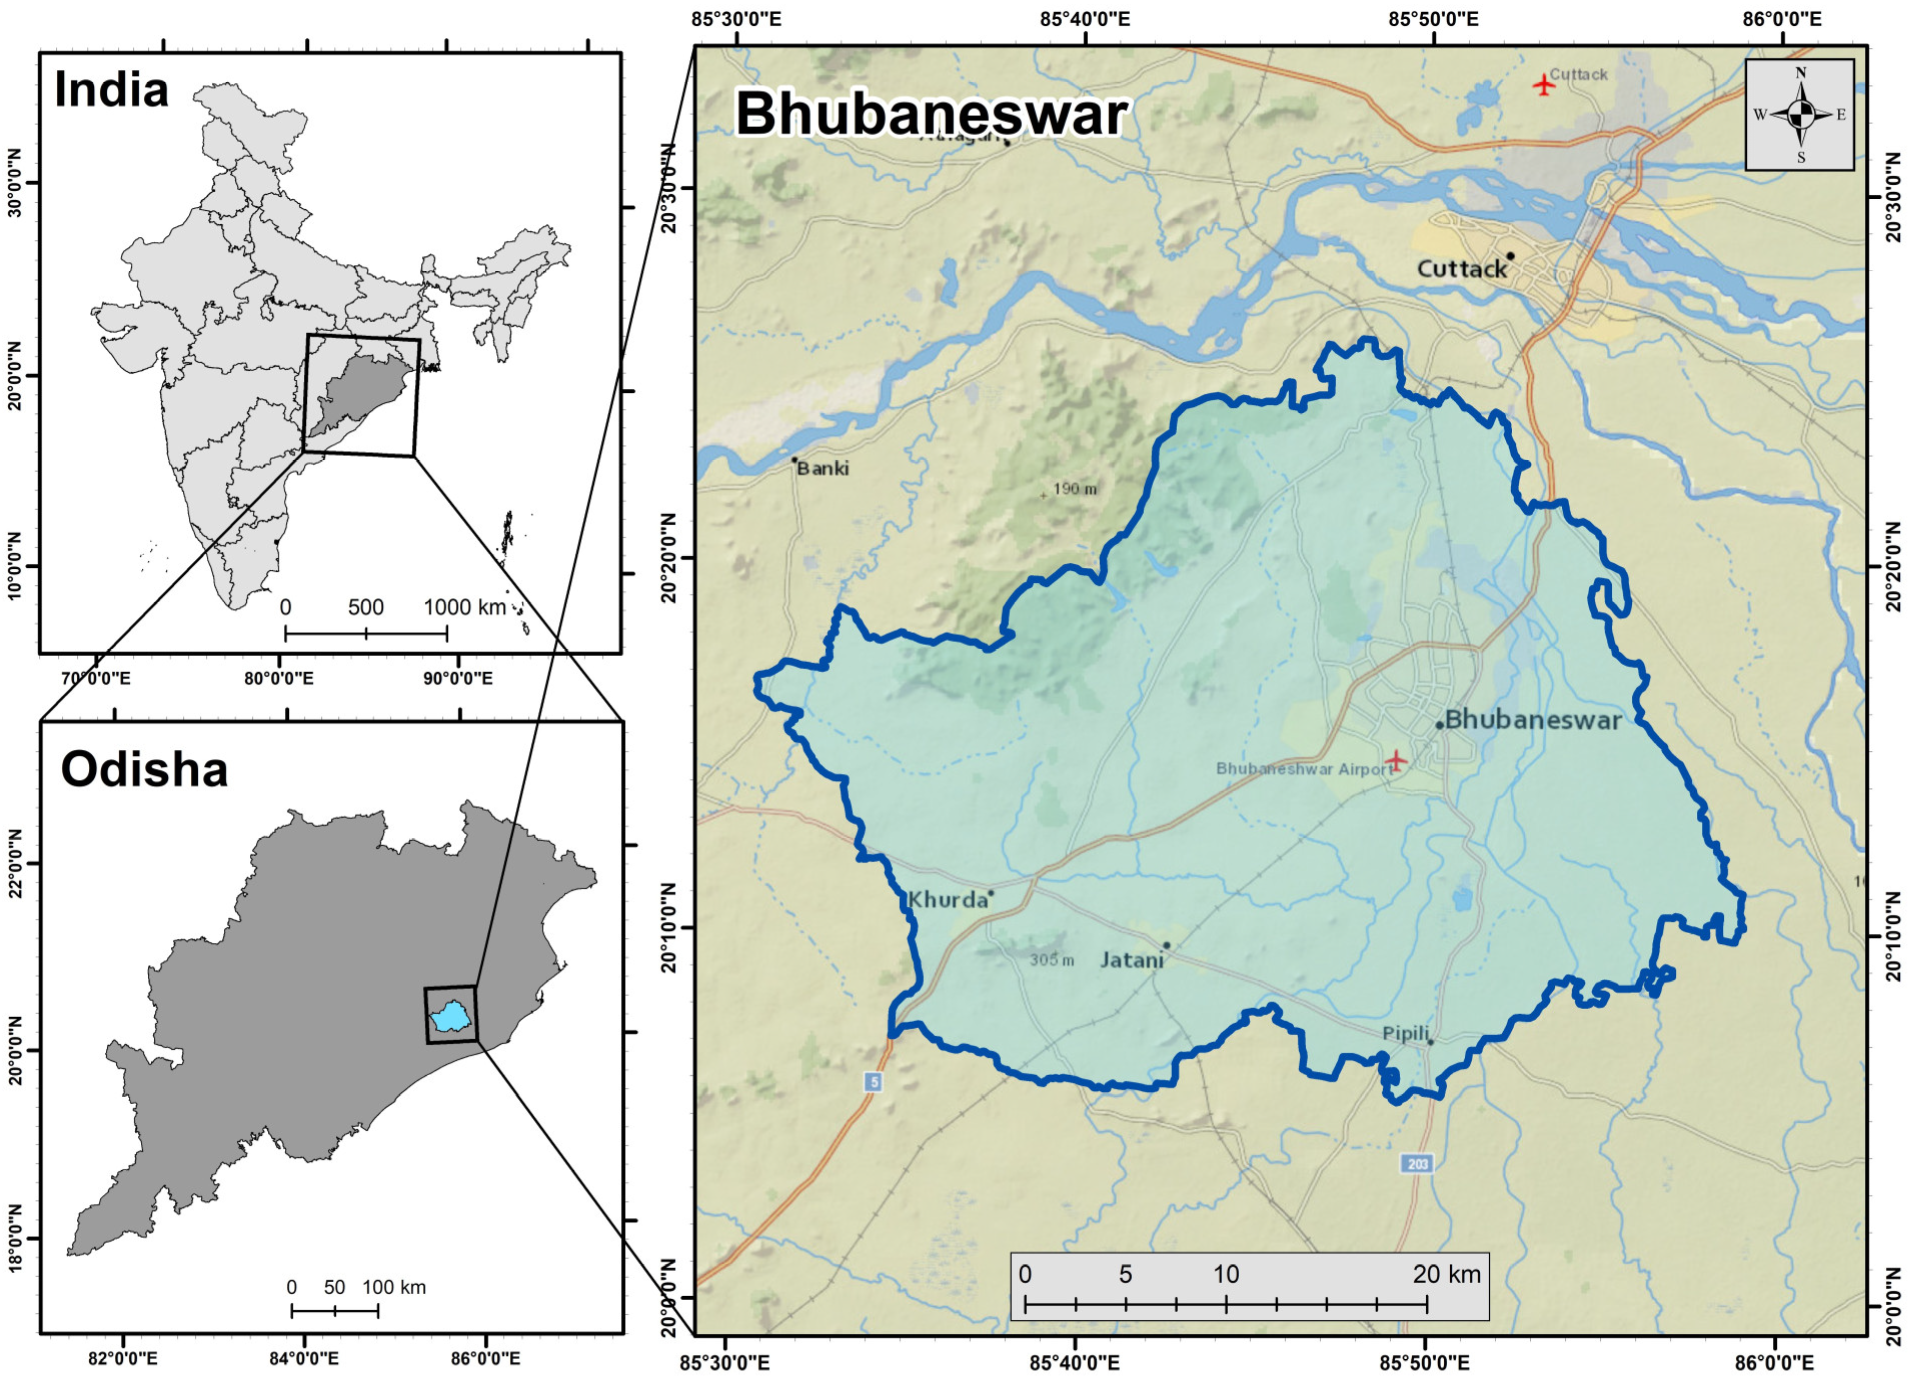
Figure 1. Locational map of study area showing Bhubaneswar city.
Water 15 02983 g001
Figure 2. Methodology for the assessment of cooling effect of blue-green spaces on UHI mitigation.
Water 15 02983 g002
Figure 3. Landscape indices for Bhubaneswar: (a) Normalised Difference Vegetation Index (NDVI); (b) Modified Normalised Difference Water Index (MNDWI); and (c) Normalised Difference Built-up Index (NDBI).
Water 15 02983 g003
Figure 4. Spatial distribution of temperature in Bhubaneswar: (a) Land Surface Temperature (LST); and (b) thermal hotspots.
Water 15 02983 g004
Figure 5. Spatial distribution of LST in Bhubaneswar: (a) MODIS LST product (MOD11A1); and (b) resampled Landsat-estimated LST.
Water 15 02983 g005
Figure 6. Correlation analysis between MODIS LST product and Landsat-estimated LST of 13 April 2023.
Water 15 02983 g006
Figure 7. (a) Sample sites representative of neighbouring areas of blue-green spaces and non-blue-green spaces over the study area, and (b) LST visualisation of sample sites.
Water 15 02983 g007
Figure 8. Correlation analysis between LST and landscape indices.
Water 15 02983 g008
Table 1. Statistical summary of landscape indices (NDVI, MNDWI, and NDBI).
Landscape IndicesMinMaxMeanStd Dev.
NDVI−0.210.710.350.10
MNDWI−0.510.66−0.280.94
NDBI−0.720.31−0.080.11
Table 2. Statistical Summary for MODIS LST product and Landsat-estimated LST of 13 April 2023.
MODIS LST ProductResampled Landsat-Estimated LST
Min33.9730.95
Max43.8947.02
Mean39.1537.44
Std dev.1.812.36
Table 3. Statistical Summary for LST in blue-green spaces and non-blue-green spaces.
MinMaxMeanStd Dev.
Blue-green Spaces23.8738.0731.971.53
Non-blue-green Spaces24.6240.3834.121.34
Table 4. Statistical Summary for LST in neighbouring urban areas of blue-green spaces and non-blue-green spaces of the sample sites.
MinMaxMeanStd Dev.
Blue-green spaces27.0436.0031.861.31
Non-blue-green spaces28.7337.2634.081.30
Disclaimer/Publisher’s Note: The statements, opinions and data contained in all publications are solely those of the individual author(s) and contributor(s) and not of MDPI and/or the editor(s). MDPI and/or the editor(s) disclaim responsibility for any injury to people or property resulting from any ideas, methods, instructions or products referred to in the content.