Article

Construction of River Health Assessment System in Areas with Significant Human Activity and Its Application

1
School of Water Conservancy, North China University of Water Resources and Electric Power, Zhengzhou 450046, China
2
School of Management and Economics, North China University of Water Resources and Electric Power, Zhengzhou 450046, China
3
College of Water Resources, North China University of Water Resources and Electric Power, Zhengzhou 450046, China
4
School of Geography, Earth and Environmental Sciences, University of Birmingham, Birmingham B15 2TT, UK
*
Author to whom correspondence should be addressed.
Water 2023, 15(16), 2969; https://doi.org/10.3390/w15162969
Submission received: 2 May 2023 / Revised: 27 July 2023 / Accepted: 14 August 2023 / Published: 18 August 2023
(This article belongs to the Section Water and One Health)

Abstract

:
The assessment of river health holds paramount significance in diagnosing the conditions of river water environments, and its research serves as a crucial foundation for the functional management and restoration of rivers. We discuss the concept and assessment criteria of health in areas characterized by significant human activity. Utilizing the “over the riverbank” and “under the riverbank” quantification criteria as the framework, a comprehensive river health assessment index system is developed, encompassing seven aspects (riparian zone condition, pollution discharge condition, human–water interaction, physical structure, water environment, water ecology, and socio-economic service function) and 35 indicators. This study introduces the River Health Index (RHI), specifically tailored for regions with significant human activity, facilitating the quantitative assessment of river health status and precise calculation of the River Health Index in these areas. The research employs the RHI to assess the health condition of the Cangzhou section of the Qingliang River in China. The results indicate that the Qingliang River is in a suboptimal state of health, with the key limiting factors being the aspects of “water environment” and “water ecology”. The research demonstrates that the proposed river health assessment system for areas with significant human activity effectively reflects the objective reality of the Qingliang River, exhibiting a high level of reliability and applicability.

1. Introduction

Rivers are the result of the combined influence of atmospheric circulation and the Earth’s underlying surface, and they serve as crucial carriers of freshwater on our planet [1]. With natural, ecological, and social functions, such as hydrological regulation, aquatic habitat support, and navigation, rivers hold significant importance for human society. However, as urban areas expand, human interference with rivers is escalating. The natural conditions of rivers in regions characterized by significant human activity have undergone profound alterations. Examples of such disturbances include channelization and the excavation of diversion canals to straighten river courses, the construction of dams for flood control, the establishment of hydrophilic platforms for recreational purposes, the modification of riparian vegetation, and the escalation of pollution emissions due to industrial development. These human-induced disturbances have profoundly impacted river morphology and natural hydrological processes, resulting in disruptions to the river flow regime and the overall hydrological cycle. Consequently, river ecosystems have experienced continuous degradation due to human interventions [2]. Therefore, river health assessment has emerged as a prominent international academic research area [3].
River health assessment work has witnessed extensive implementation, yielding a plethora of research outcomes. The research on river health assessment in European and North American countries evolved from water quality assessment. Since the 1980s, countries such as the United States, the United Kingdom, Sweden, Australia, South Africa, and others have undertaken river health assessment, devising a series of evaluation methods like IBI, PIVPACS, RCE, and RBPs. Among these, IBI employs indicator organisms such as fish, aquatic plants, and macroinvertebrates for health assessment [4]. PIVPACS, on the other hand, assesses river health by examining the survival status of macroinvertebrates [5], boasting clear indicators and ease of monitoring. However, a limitation lies in its reliance on a single species to gauge river health. If the selected species proves insensitive to certain external disturbances, a scenario may arise where river health is compromised, but the selected species remains unchanged. RCE focuses on the riparian zone and river environment assessment in agricultural landscapes [6]. It finds its primary application in the health assessment of small streams in agricultural regions and is characterized by swift assessment procedures. RBPs, on the other hand, provide standards for monitoring and evaluating methods concerning periphytic algae, macroinvertebrates, and fish [7], making them well-suited for comparisons across different areas. In the European Union, unified objectives and requirements in the realm of water environment have been established, leading to the formulation of the Water Framework Directive (WFD) in 2002. The WFD categorizes surface water bodies into rivers, lakes, transitional waters, and coastal waters, with the overarching aim of ensuring the adequate supply of high-quality water to sustainably, equitably, and harmoniously meet water use needs.
In recent years, numerous scholars have undertaken river health assessment work. For instance, Oeding et al. established the Diatom Species Index of Australian Rivers (DSIAR) based on the biomonitoring of algae [8]. Similarly, Varol et al. employed water quality indices, multivariate statistics, and absolute principal component score-multiple linear regression (APCS-MLR) to evaluate the water quality of the Karasu River in Turkey [9]. The field of geomorphology has long acknowledged the influence of human activities on fluvial landscapes [10]. Downs and Hervé examined contemporary approaches to catchment-historical cumulative impact analyses of river channel morphology. Based on their findings, they assessed the relative impact of human activities on the river system, highlighting that the continuous impact is more pronounced in small- and medium-sized rivers. Furthermore, Wohl extensively discussed the diverse direct and indirect impacts of human activities on rivers and proposed corresponding management suggestions [11]. Across research centers for River Geomorphology in Western Europe, Great Britain, and Australia, the emphasis on human alterations of river systems has broadly evolved in parallel [12,13].
The study of river health in China commenced relatively late, and it was in 2002 when Tang et al. first explored the assessment of river ecosystem health [14]. Subsequently, significant water conservancy commissions, such as those responsible for the Yangtze, Yellow, and Pearl River basins, conducted their own river health studies [15,16,17]. Building upon international research outcomes on river health assessment, a multitude of Chinese scholars have undertaken a series of investigations related to river health assessment. For example, Yao et al. developed a zooplankton index of bio-integrity (Z-IBI) evaluation system to assess the impact of industrial activities, dam construction, and agriculture on the Wanan reach of the Ganjiang River in China [18]. Wan et al. established a comprehensive river health assessment index system and utilized an improved coupling model of set pair analysis with Extenics to assess and predict the health of the Weihe River basin [19]. Additionally, Zhao et al. proposed a method to predict river health under varying climate change conditions [20]. Concurrently, the river health assessment incorporates technical tools and index systems, such as the geographic information system (GIS) and the pressure-state-response model (PSR), to visualize the assessment results more effectively [21,22,23].
Significant progress has been achieved in the field of river health assessment. However, the existing assessment methods may lack relevance when applied to rivers with diverse functional characteristics in regions with significant human activity. As of now, a comprehensive and unified understanding of river health in such regions remains elusive. The current indicator construction fails to encompass the distinct functional traits of different rivers, thus necessitating the development of a more comprehensive assessment system. Consequently, there is an urgent imperative to investigate a health assessment framework suitable for rivers with diverse functions in areas of significant human activity, with the aim of enhancing the precision and reliability of river health assessment. In light of this context, we examine the distinct functions of rivers situated in regions characterized by significant human activity and formulate a river health assessment index system, encompassing seven crucial aspects: riparian zone condition, pollution discharge condition, human–water interaction, physical structure, water environment, water ecology, and socio-economic function. Furthermore, the study employs the Qingliang River as a case example to demonstrate the practical application of this assessment system and to propose strategies for river health management and protection.
The structure of this paper is as follows: Section 2 provides a summary of the conceptual meaning of river health in regions with significant human activity, along with the introduction of benchmarks and the general framework of the assessment system. In Section 3, the index system and assessment criteria for river health are developed. Section 4 offers a brief overview of the study area and data sources, followed by the application of the river health assessment system to the Qingliang River. Finally, the results pertaining to the Qingliang River are presented, accompanied by a comprehensive discussion, relevant recommendations, and a summary of the main conclusions.

2. Concepts and Assessment Benchmarks of River Health in Areas of Significant Human Activity

2.1. Study of River Health in Areas of Significant Human Activity

Rapport first introduced the concept of “ecosystem health” in the 1980s [24]. Initially, research was primarily focused on the river ecosystem and the health of river life and function. However, as time progressed, the concept of river health evolved and expanded to encompass other aspects of rivers. Existing definitions of river health can be broadly categorized into three main groups. The first category defines river health as the integrity of river ecosystems, placing emphasis on the ecological functions of rivers. Scholars such as Karr, An, and Schofield are representative proponents of this perspective [25,26,27]. The second category posits that river health is not solely related to the integrity of the ecosystem but also takes into account its role in human society, underscoring the integration of river ecological function with social function. Scholars like Fairweather, Meyer, and Vugteveen are prominent figures endorsing this viewpoint [28,29,30]. Presently, this understanding is widely recognized by the academic community. The third category asserts that river health is not a strictly scientific concept in the conventional sense, but rather a state of balance between ecological and social functions aimed at achieving river management objectives. It emphasizes river health as an assessment tool for river management. Scholars such as Ladson, Rogers, and Norris are influential representatives of this perspective [31,32,33]. In summary, the concept of river health has undergone significant development since its inception in the 1980s. It now encompasses various dimensions, reflecting the integration of ecological and social aspects in understanding and managing river health. The perspectives put forward by different scholars contribute to a more comprehensive understanding of river health and its practical implications.
Significant human activity refers to the frequent intervention of the ecological environment by human activities [34], encompassing the detrimental impacts of urbanization on river environments, as well as the restoration and regulation of river ecology through human engineering. The purpose of river health assessment is to strike a balance between natural ecological attributes and the social and economic services derived from rivers. On the one hand, it aims to serve humanity; on the other hand, it seeks to safeguard the potential for sustainable development without compromising ecological integrity. In areas with significant human activity, the health of rivers embodies the harmonious coexistence of human development and ecological protection, representing a holistic expression of the interplay between human-induced stress and the rivers’ responses. A healthy river system not only entails the maintenance of a sound ecological structure and the continuity of ecological processes, but also emphasizes the efficient utilization of human service functions, such as water supply, flood control, irrigation, and recreational amenities within the river ecosystem. Consequently, a river’s health encompasses the preservation of ecosystem stability through human intervention while simultaneously fulfilling the essential service functions for human well-being. This relationship is depicted conceptually in Figure 1.

2.2. Assessment Benchmarks for River Health in Areas of Significant Human Activity

The characteristics of rivers in areas of significant human activity play a pivotal role in shaping their assessment methods. The double regulating effect of human intervention on rivers is a defining trait of rivers in regions with significant human activity. For instance, the implementation of various water conservancy projects, such as water system connections, river damming, and riverbank hardening, has led to a more intricate river system network, decreased vertical connectivity of rivers, and increased stability of riverbanks. Diverse types, intensities, and changes in human activities result in varying impacts on rivers [35]. Although most rivers affected by significant human activity cannot be fully restored to their original state, they can still be deemed healthy to some extent and within a certain timeframe if they maintain their current condition or possess the potential for recovery and sustainable development [36]. Consequently, river health assessment must encompass the influence of human activities. When assessing river health in regions with significant human activity, using the natural state of rivers as the sole benchmark may yield lower assessment results and lack robustness as a reference. Therefore, it is imperative to take into account the dynamics and regionality of the river, along with its natural and social functions, in accordance with the specific disturbances present in the river’s characteristics.

2.3. General Framework of the Assessment System for Areas of Significant Human Activity

Rivers situated in regions with significant human activity exhibit dynamic and regional characteristics. Due to the diverse functions of these rivers, the system of assessment indicators and criteria cannot be rigidly standardized; instead, they should be tailored to specific assessment timeframes, regional attributes, and river functions. Building upon this premise, we aim to propose an indicator system for assessing river health in areas of significant human activity, which primarily involves the following steps: (1) Constructing an indicator system: The indicator system is developed by identifying commonalities and characteristics among rivers with different functions in regions with significant human activity. This process involves referencing the relevant literature and selecting representative assessment-related indicators. (2) Developing assessment criteria: by integrating existing international and Chinese standards, development planning, and the unique characteristics and functions of the target rivers, a graded and quantitative set of standards aligned with the assessment contents is defined. (3) Determining the assessment method: an effective quantitative method is selected, which is then combined with the established assessment indicator system to determine the calculation method and steps for conducting the assessment. (4) Application example research: Employing the established assessment system and method, case applications are conducted to validate the reliability of the assessment system. Additionally, the assessment results are used to identify the primary factors influencing the health of rivers in areas with significant human activity, thereby strengthening river protection and management efforts.
Through these steps, this research endeavors to contribute to the advancement of river health assessment methodologies in regions characterized by significant human activity. The proposed approach aims to enhance the accuracy and applicability of river health assessments, ultimately aiding in the conservation and management of rivers facing substantial human impact.

3. Methodology for Assessing the Health of Rivers in Areas of Significant Human Activity

3.1. Assessment Indicator of Rivers in Areas of Significant Human Activity

3.1.1. Framework of the Assessment Indicator System

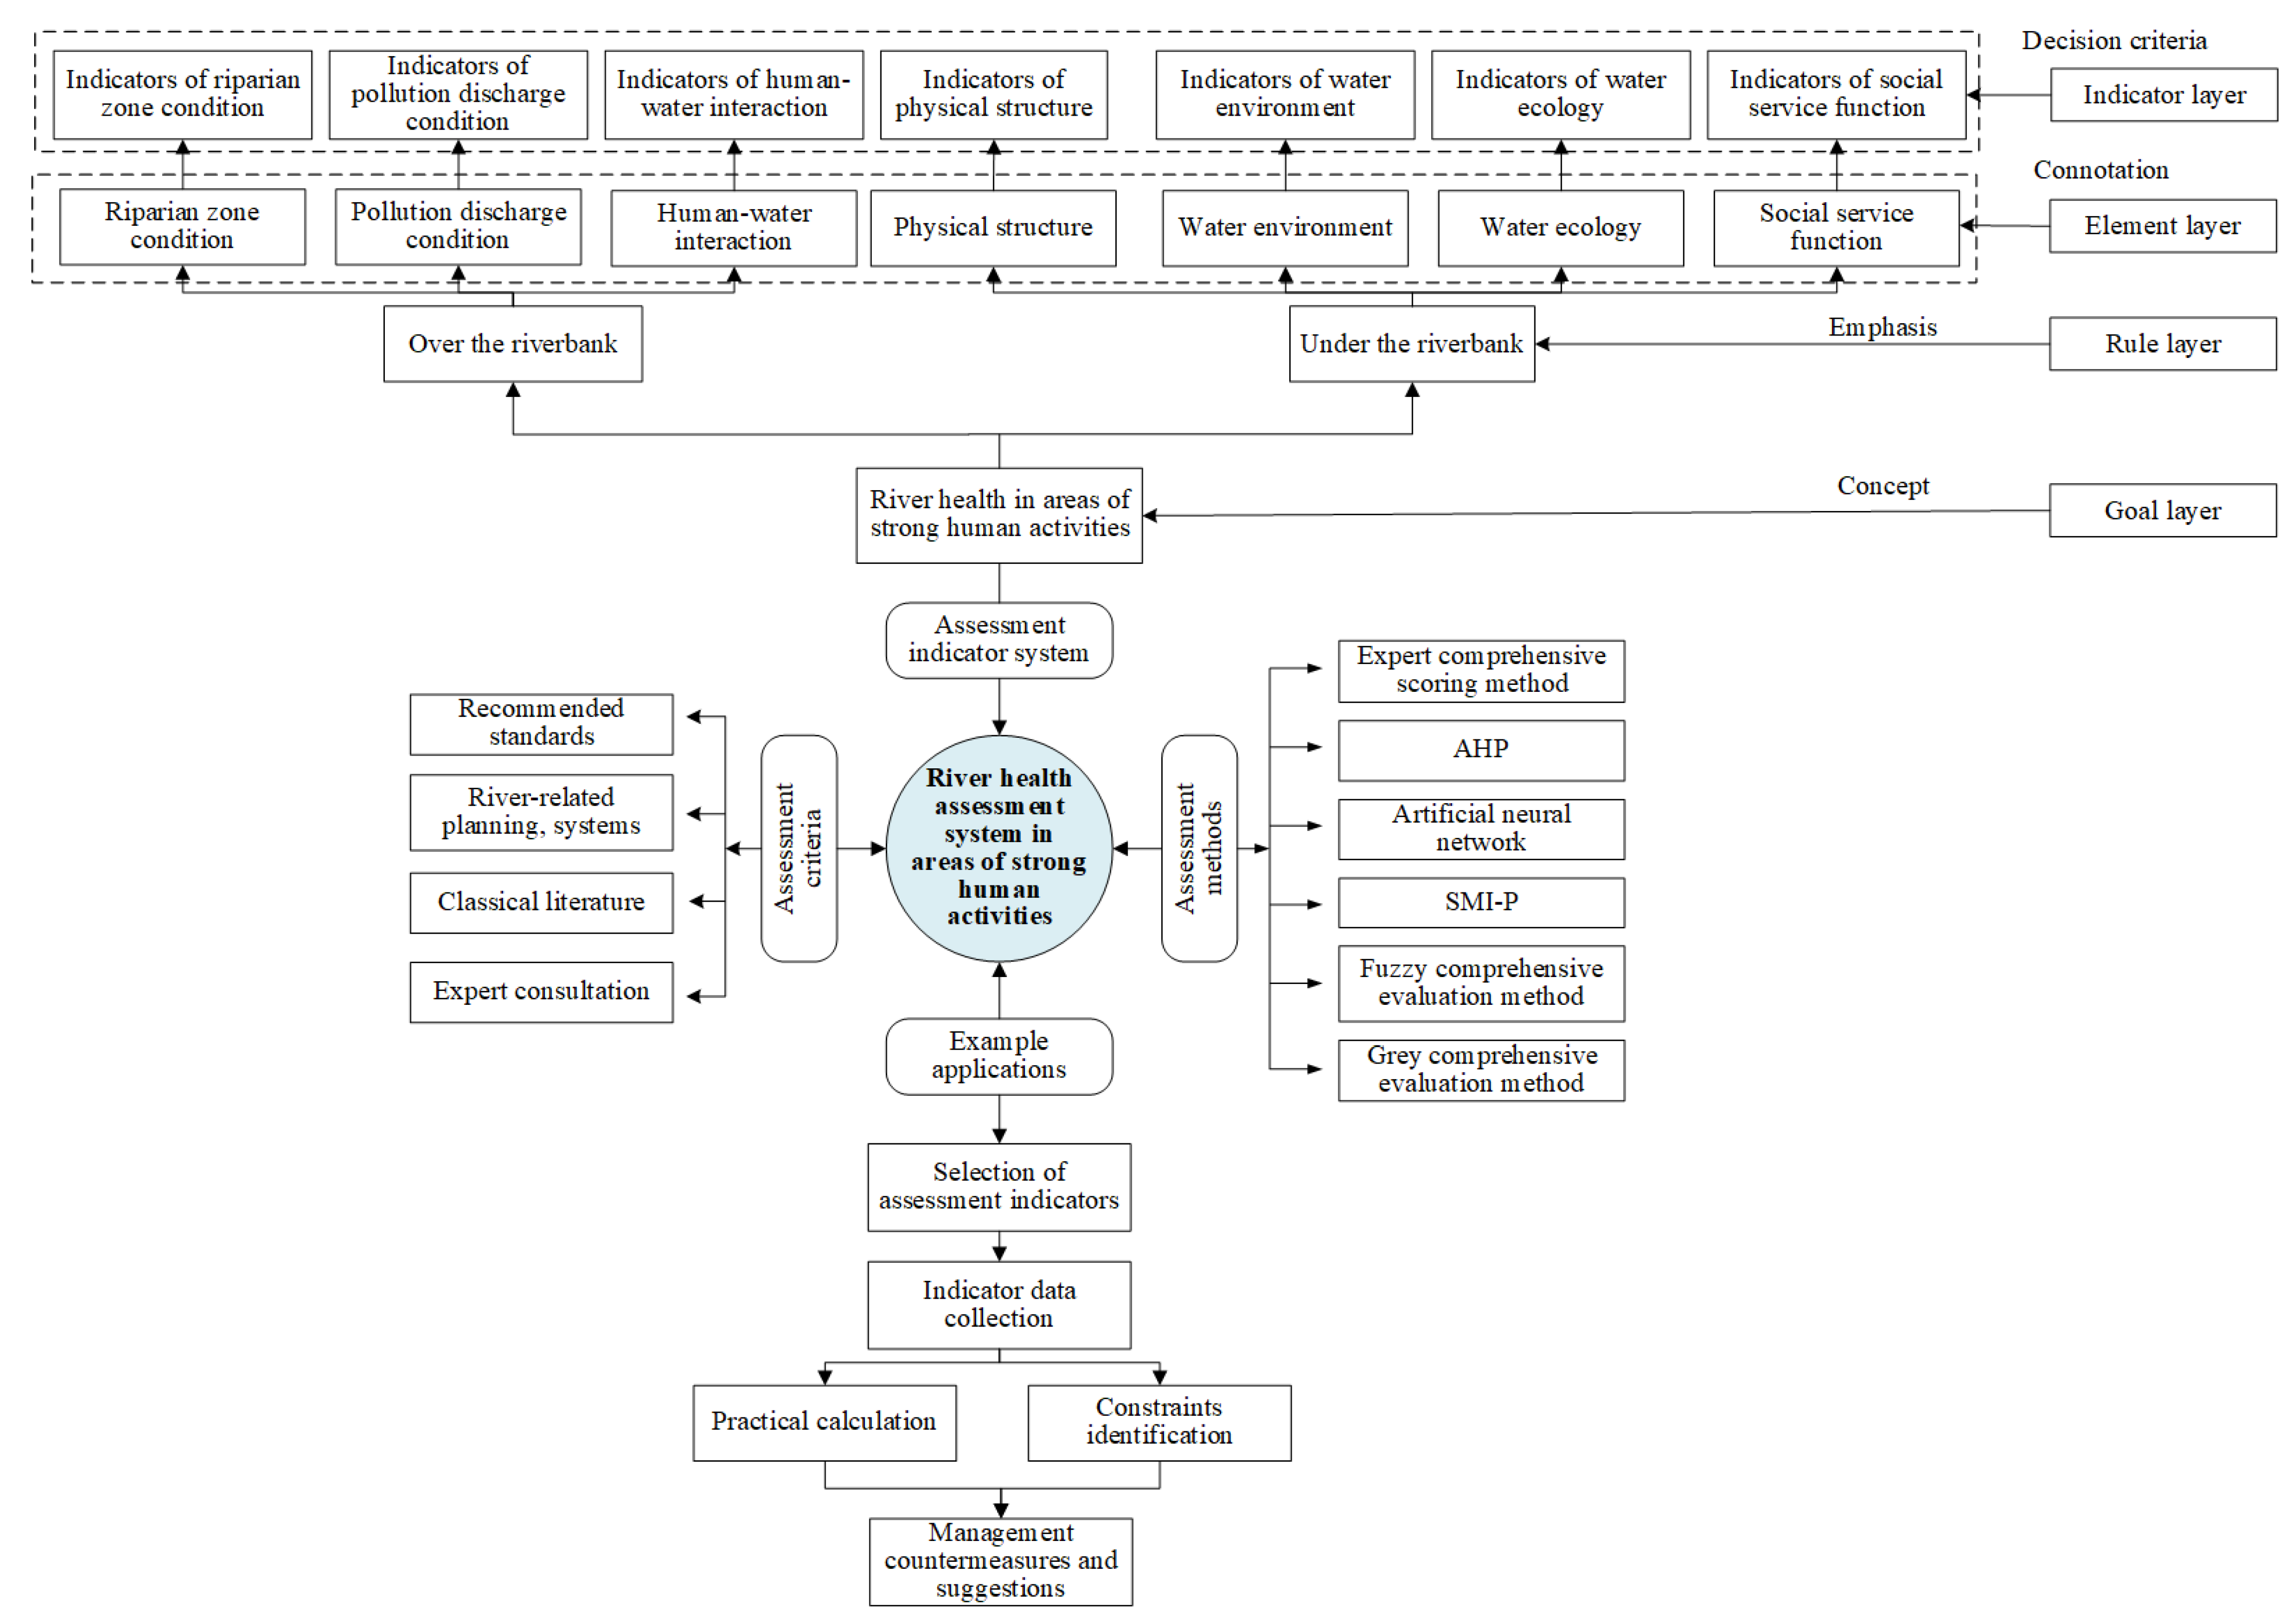
Based on the conceptual understanding and aspects of river health in regions with significant human activity, and in consideration of the two criteria levels, “over the riverbank” and “under the riverbank,” we propose a comprehensive four-level assessment index system termed “goal–rule–element–indicator” for river health evaluation. The framework is as follows: (1) Goal layer (GL): This layer entails a comprehensive assessment of the ecological health of rivers in the study area, as well as the level of social development and their interrelationship. In this paper, it is represented as the “River Health Index in Areas of significant human activity” (abbreviated to RHI). (2) Rule layer (RL): taking into account the distinct focus on the selection of indicators for “over the riverbank” and “under the riverbank” segments of rivers, the basic framework employs two decision rules for each segment and subsequently assesses their role relationships. (3) Element layer (EL): drawing from the rule layers, the river health indicators are measured based on various perspectives, including riparian zone condition, pollution discharge condition, human–water interaction, physical structure, water environment, water ecology, and socio-economic function. (4) Indicator layer (IL): within this layer, specific quantitative indicators are established for each element, effectively reflecting the degree of river health in individual layers. The visual representation of the proposed assessment index system is provided in Figure 2.

3.1.2. Selection of Assessment Indicators

In accordance with the distinct characteristics of rivers with different functions in regions with significant human activity, we conducted indicator screening by referencing documents related to river health assessment, standards, and technical guidelines issued by management departments [37,38,39]. The screening process involved employing frequency analysis, theoretical analysis, and expert consultations.
The first step was statistical screening. Building upon the established rule layer and taking into account the key factors characterizing river conditions in areas with significant human activity, we extensively gathered relevant literature on rivers, river health, water ecological health, river health assessment, river–lake water system connectivity, and the water resource carrying capacity assessment in regions with significant human activity [40,41,42]. From this collection, we selected literature sources with relatively comprehensive index systems, significant influence, and high citation frequency to serve as data sources for statistical analysis. Next, the preliminary screening of indicators was performed. By comparing the assessment indicators from the selected literature with the judgment rule layer, we analyzed their correlation with each rule layer. Indicators closely related to the rule layer were retained for frequency statistical analysis, and those with overlapping meanings were merged to obtain the preliminary screening results of the assessment indicators. Finally, the definitive index system was determined. Based on the outcomes of the preliminary indicator screening, we adhered to principles of scientific rigor, completeness, operability, independence, and dynamism in the selection process. We also considered relevant documents issued by management departments and sought input from experts [43]. Through this rigorous approach, we finalized the index system for river health assessment, comprising a total of 35 indicators. Of these, 12 indicators were deemed essential for all functional rivers in regions with significant human activity, while the remaining indicators were selected based on the specific functions of the rivers.

3.2. Criteria for Assessing the Health of Rivers in Areas of Significant Human Activity

The classification of indicator criteria and the determination of standard values presented in this paper are primarily based on the following types of documents: (1) goal values outlined in water resources, economic, and social-related plans and systems in the basin [44,45,46,47]; (2) corresponding indicator criteria derived from the relevant classical literature [48,49,50,51,52,53,54]; (3) input from expert consultations; (4) national standards and related research findings [55,56,57]; and (5) expert judgments.
The assessment indicators for rivers in regions with significant human activity are categorized into five levels, denoted as I to V, representing excellent, good, fair, poor, and very poor conditions, respectively. These classifications serve as a reference for related research. It is important to note that rivers in regions with significant human activity are dynamic and exhibit regional variations, making it challenging to assess them using standardized criteria. Therefore, the values provided in this paper are solely for reference purposes, and each region should selectively determine appropriate standard values suitable for their specific context and the assessment of river health in areas with significant human activity, considering the actual conditions and evolving goal requirements. The indicator system and assessment criteria for evaluating river health in regions with significant human activity are presented in Table 1 and Table 2, respectively.

3.3. Assessment Methodology

The assessment of river health in regions with significant human activity is a comprehensive process involving multiple indicators, rules, and layers. Various methods can be utilized for this assessment, such as matter element analysis [58], fuzzy comprehensive assessment method [59], gray relational analysis [60], and more. These methods all entail the calculation of weights during the assessment process. Weight determination methods can be broadly classified into three main categories: subjective weighting methods (analytic hierarchy process, cycle ratio scoring method, expert consultation method, binomial coefficient method), objective weighting methods (principal component analysis method, entropy weight method, neural network method), and other weighting methods. The selection of a specific method should align with the specific requirements of the study. In this study, the health status of rivers in regions with significant human activity was classified into five categories based on their RHI values: Class I rivers (excellent, 90 ≪ RHI ≪ 100), Class II rivers (good, 75 ≪ RHI < 90), Class III rivers (fair, 60 ≪ RHI < 75), Class IV rivers (poor, 40 ≪ RHI < 60), and Class V rivers (very poor, RHI < 40). It is crucial to note that the assessment of river health in areas with significant human activity is relative, and there is no absolute distinction between healthy and unhealthy. The assessment system primarily serves to gauge the relative condition of rivers in regions with significant human activity across different areas and at different time points. Its purpose is to identify key constraints and challenges affecting river health.

4. Case Study

4.1. Overview of the Study Area

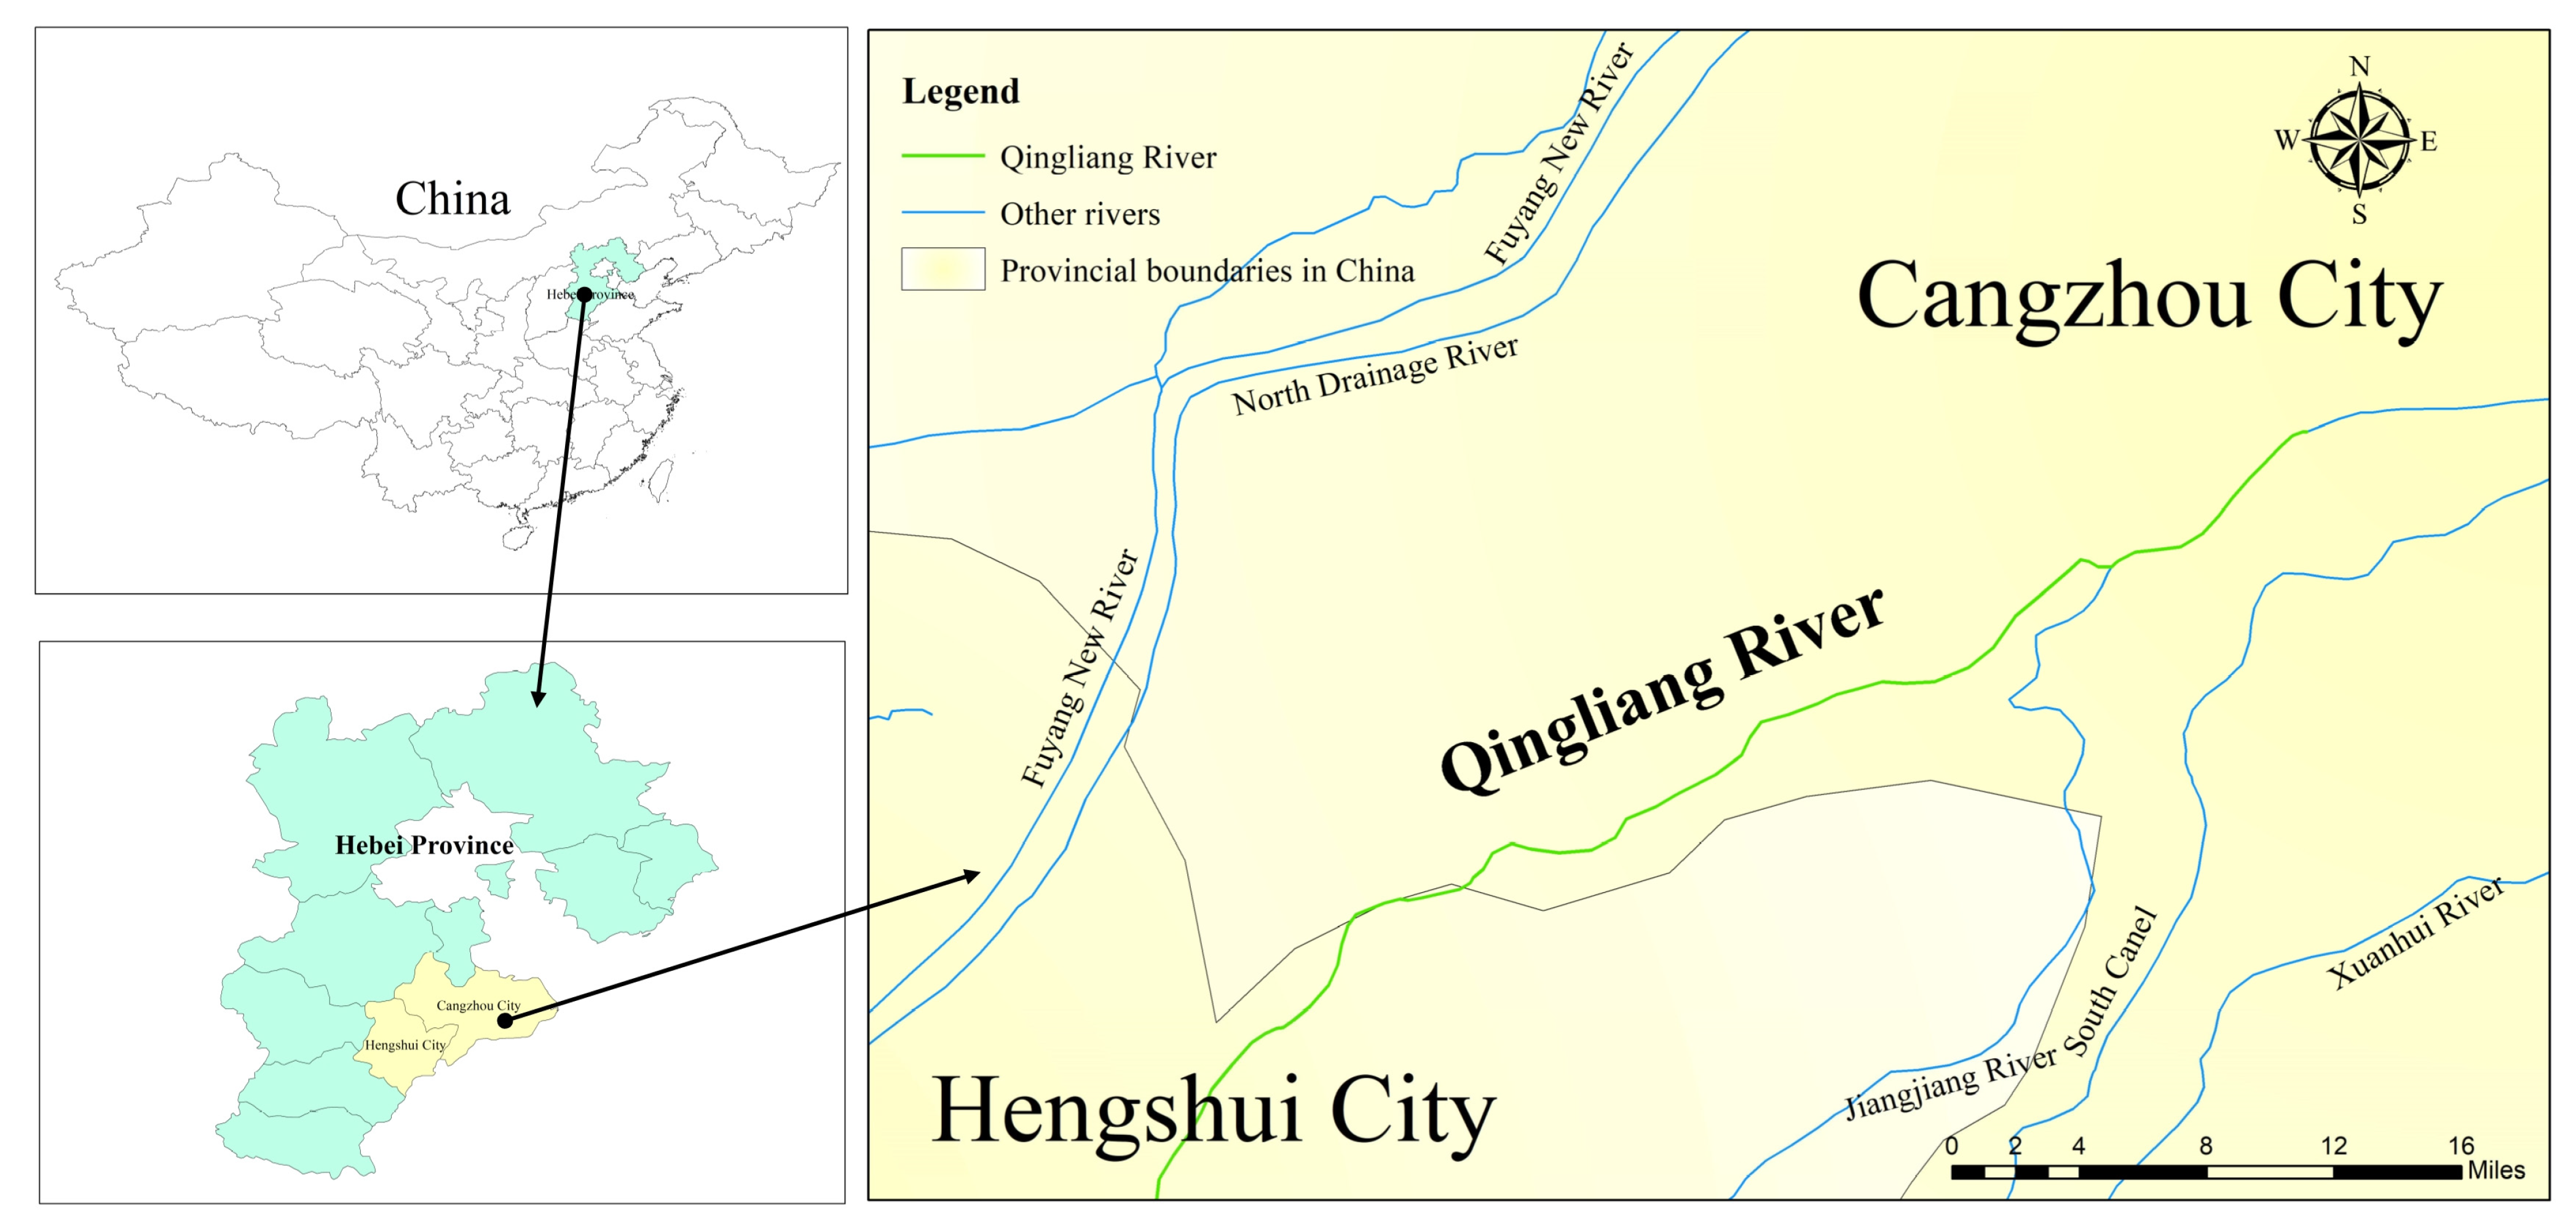
The Qingliang River originates from Niujiazhai, Wei County, Xingtai City, Hebei Province, and is connected to the Old Sha River (which starts from Anzhai, Quzhou County, Hebei Province) and the Dongfeng Canal (a major channel drawing water from the Wei River through the Zhang River), with the Qingliang River flowing below. It passes through several counties, including Nangong, Zaoqiang, Wuyi, Jingxian, and Fucheng, before converging with the Jiangjiang River at Sanjikou, Jiaoghe Town, Botou City, and the Old Salt River at Wenmiao. At Qiaoguantun, it merges into the mainstream of the South Drainage River and ultimately flows into the sea through the South Drainage River. The watershed area comprises Jiuji dike and Solu River to the east, Wei Canal to the north, and the Jiangjiang River basin to the west, covering an area of 2037 km2. When including its tributaries, the Dongfeng Canal and the confluence area of the Lao Sha River, the total watershed area expands to 4659 km2. The hydrographic chart of the Qingliang River is depicted in Figure 3. The Cangzhou City section of the Qingliang River starts from Xixindian Township, entering from Qin Village, and extends northeast through eight townships, including Xixindian, Siying, Jiaohe, Temple Village, Wangwu, Wali Wang, Qiqiao, and Wenmiao, encompassing a total length of 60 km and a catchment area of 240 km2. This section serves as a multifunctional river supporting drainage, water withdrawal, and irrigation in Cangzhou City [61]. However, being situated in an area with significant human activity, the Qingliang River faces several prominent issues. These include insufficient overall water volume, a lack of ecological base flow, seasonal drying during the agricultural water usage period, limited mobility and self-purification capacity of the water body, a decline in aquatic plants and animals, and degradation of the aquatic environment. As a result, comprehensive water ecology construction of the river requires enhancement and improvement. In light of these challenges, we present an example of applying river health assessment in regions with significant human activity, specifically in the Cangzhou section of the Qingliang River. This case study serves as a model and guidance for promoting ecological protection and promoting the high-quality development of the Qingliang River, as well as other rivers and regions facing similar challenges.

4.2. Data Sources

Utilizing the established assessment system for river health in regions with significant human activity, a study was undertaken to assess river health along the entire stretch of the mainstream of the Qingliang River. The specific assessment scope covers the river segment from the entry point at Qin Village in Xixindian Township to Qiaoguantun Village in Wenmiao Township, where it merges into the South Pai River. The assessed river reach measures 60 km in length. The original data for the indicators were sourced from the Statistical Yearbook of 2021 [62], the Water Resources Bulletin of 2021 [63], the Statistical Yearbook of Chinese Cities of 2021 [64], and the Statistical Yearbook of Cangzhou City [65]. Additionally, current values for other quantitative indicators were primarily derived from data collection efforts, as well as field research and experiments [66,67,68]. The status quo values and corresponding data sources for each indicator are detailed in Table 3.
Once the basic information is gathered, the assessment process primarily encompassed the following steps: (1) Comprehensive mapping and first-hand river information: This step involves conducting a site survey of the Qingliang River to obtain up-to-date river information. It includes collecting statistical data related to river-related structures, reviewing historical river information, and conducting UAV aerial photography. Based on the specific characteristics of the Qingliang River [65], the assessment of river reach was carried out, and indicators established in the previous paper for assessing river health in areas with significant human activity were further screened. This process yields an indicator system tailored to the assessment of river health in the Qingliang River. (2) Data collection for each indicator: relevant information was reviewed and combined with the river assessment criteria established in the previous paper to obtain the data for each indicator. (3) Determination of indicator weights: The weights of each indicator factor were determined by referring to weight calculation methods such as those found in the “Technical Guidelines for River and Lake Health Assessment” [69] and “Guidelines for River and Lake Health Assessment” [70]. The comprehensive assessment and analysis were then carried out step by step to determine the river health status and obtain the river health assessment results for the Qingliang River. (4) Analysis of assessment results: the reasonableness of the assessment results was analyzed, and the main constraints affecting the river health in the area with significant human activity in the Qingliang River were initially identified.

4.3. Health Assessment Methods

4.3.1. Health Assessment of River Reaches Division

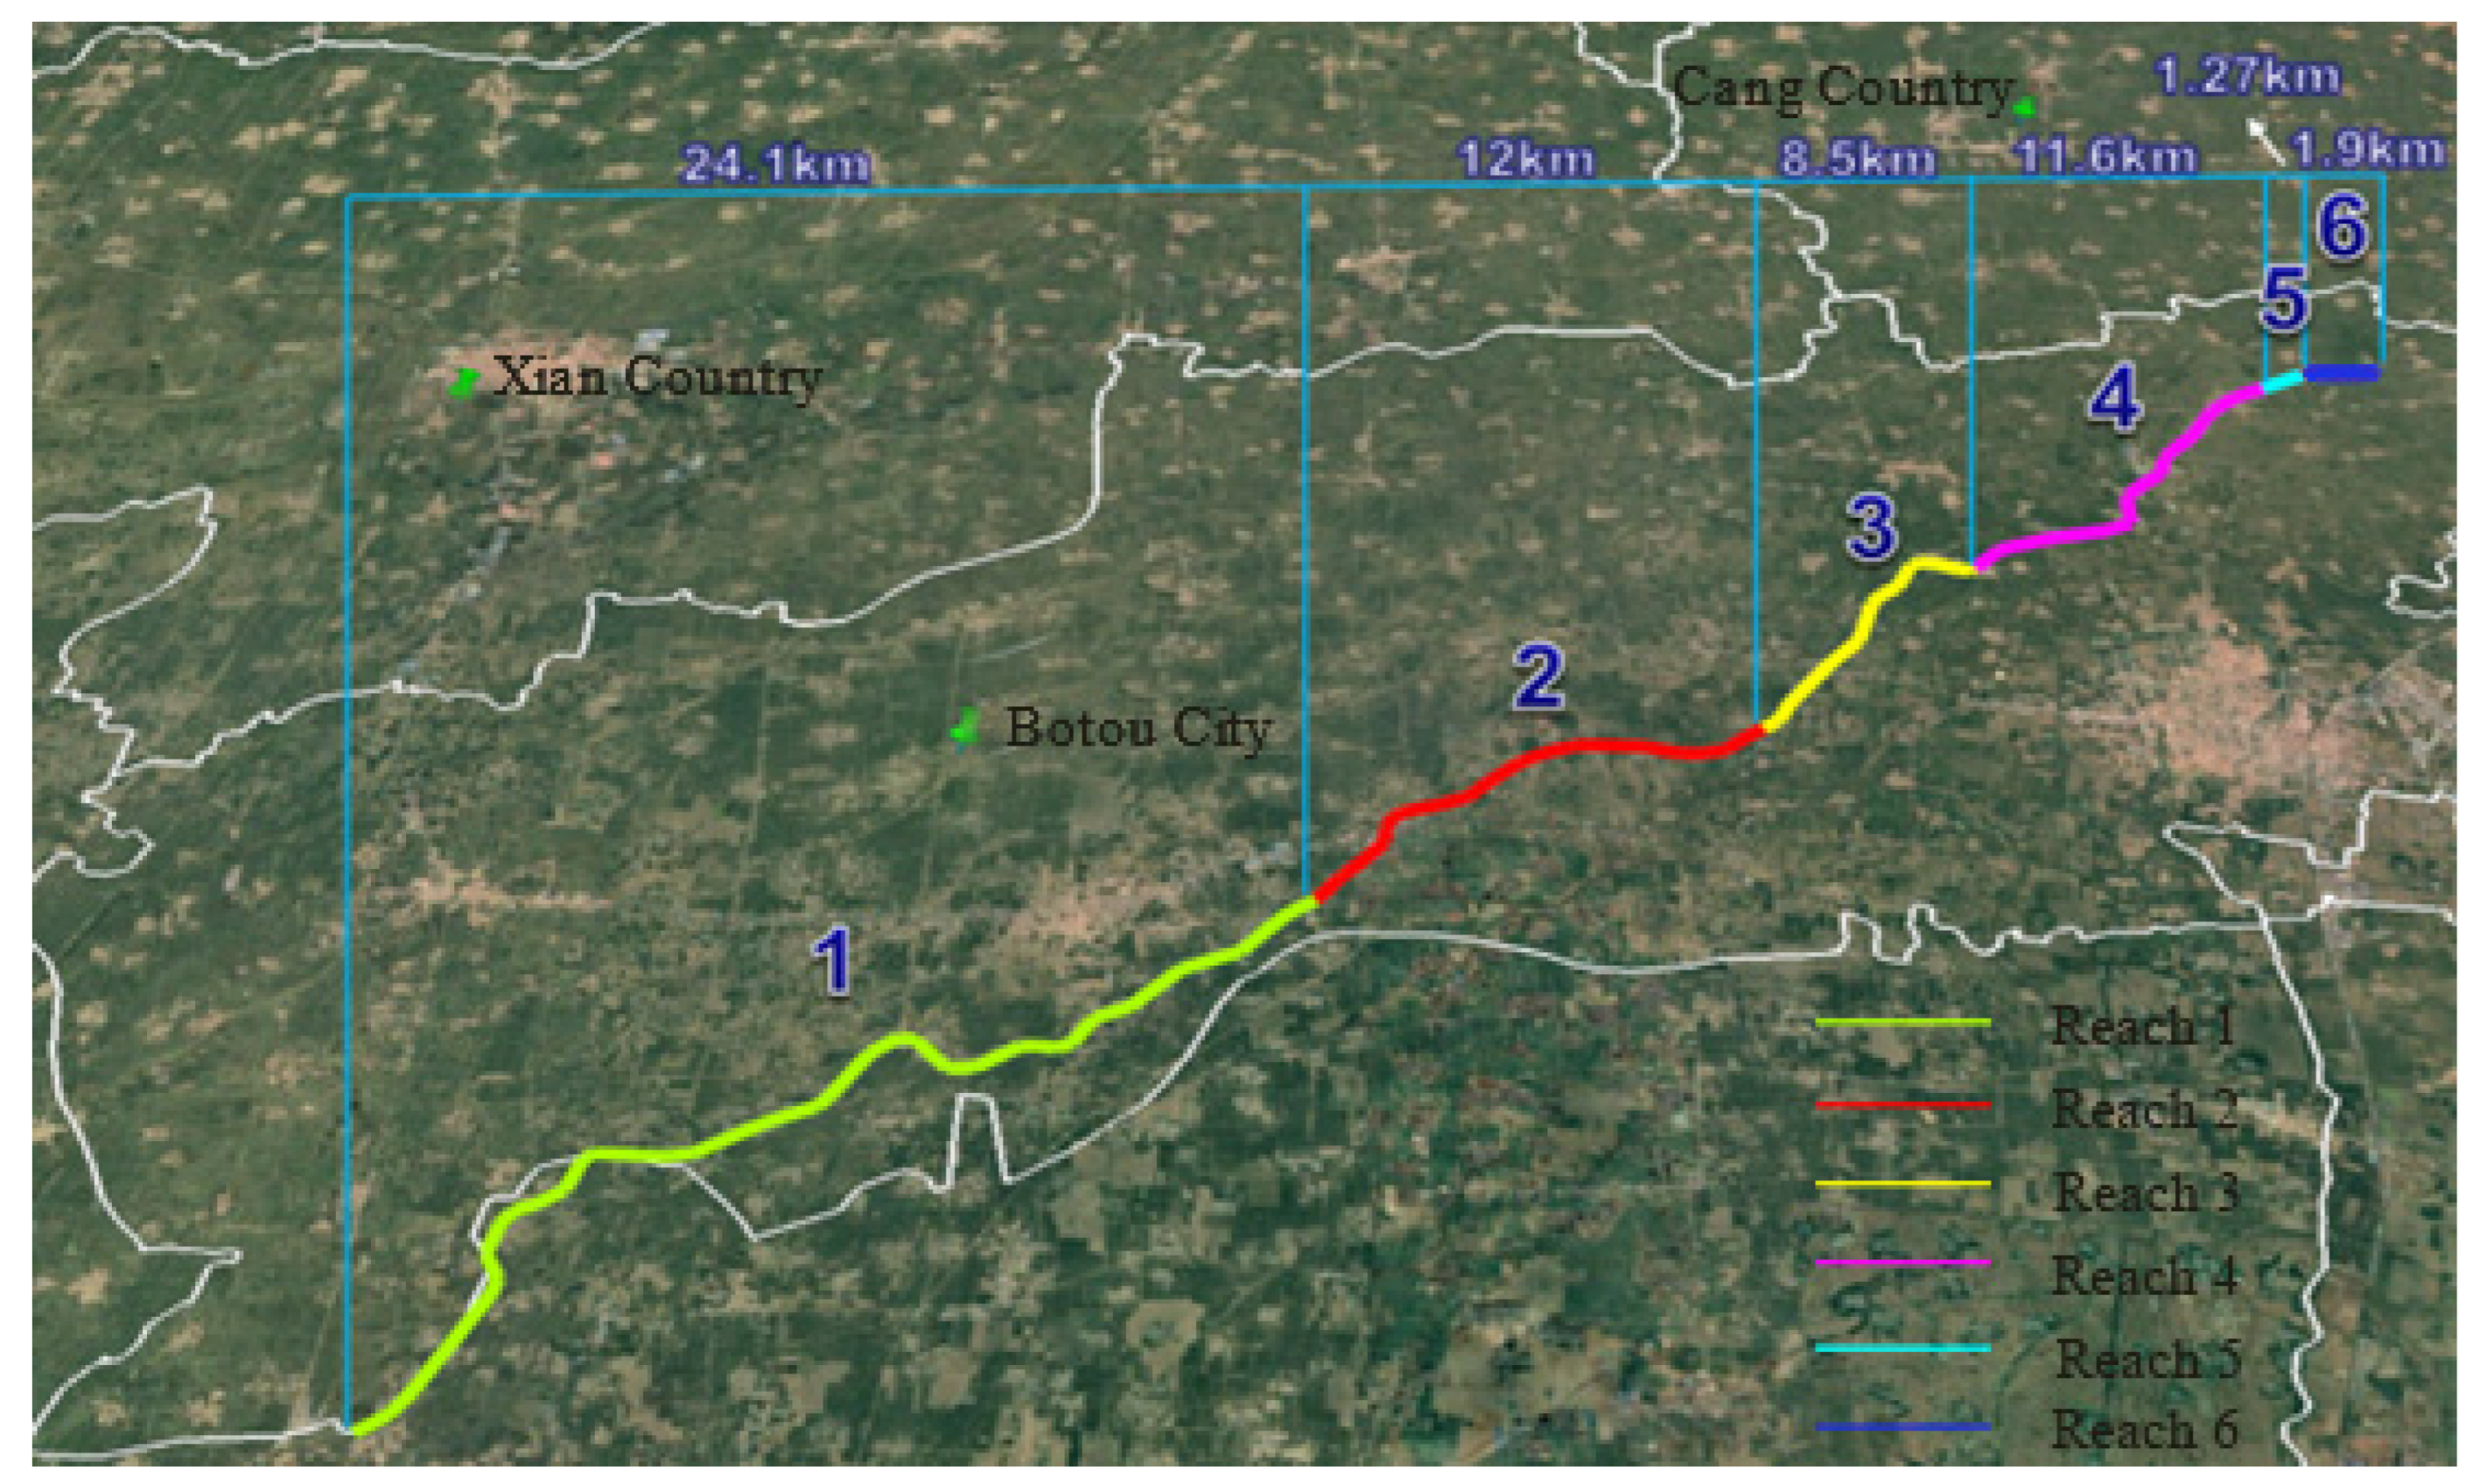
Following the fundamental principles of river health and river reach division, and considering the hydrological, riverbed, and channel morphological characteristics, land use status, social and economic development [71,72], as well as relevant zoning of the Qingliang River, the river reach division of the Qingliang River was performed using administrative region boundaries in accordance with the established method for river reach division. Consequently, the Qingliang River was divided into six assessment river reaches within the assessment area. Specific information for each assessment river reach, including its number, the cities and counties through which it flows, starting location details, and the length of each divided river reach, is presented in Table 4 and Figure 4.

4.3.2. Health Assessment Indicators and Weights

By considering the specific conditions of the Qingliang River and taking into account the indicator system and standards for river health assessment in regions with significant human activity, the indicators for assessing the river health of the Qingliang River were categorized into four layers: the goal layer, rule layer, element layer, and indicator layer. This results in a total of 15 indicators, comprising 12 compulsory indicators and 3 reserve indicators, namely channel stability, aquatic plant community condition, and flood control compliance rate. The weights for the indicator layer were determined based on the actual situation of the Qingliang River, with reference to weight calculation methods such as the “Technical Guidelines for River and Lake Health Assessment [69]”, “Guidelines for River and Lake Health Assessment [70]”, ISC (Index of Stream Condition) [31], RBPS (River Bioassessment using Paired Sites) [7], and others. The weighted comprehensive assessment was then conducted step by step. Detailed information on the indicators and their respective weights can be found in Table 5.

4.3.3. Comprehensive Calculation Method for Health Assessment Assignment Scores

The final assessment results of river health were calculated according to the calculation method of assigning scores and weighting by layers of goal layer, rule layer, element layer and indicator layer, and the length of the river reach was used as the weight for weighting calculation. The formula for calculating the comprehensive score of a river reach is:
RHI i = m [ YMB mw × n YS nw × n ( ZB nw × ZB nr ) ]
RHIi—the ith assessment reach of river health comprehensive assignment score;
YSnw—weight of the nth indicator in the element layer (the specific value is determined by the actual situation of Qingliang River and expert demonstration and consultation);
ZBnw—weight of the nth indicator in the indicator layer (the specific value is determined by the actual situation of Qingliang River and expert demonstration and consultation);
ZBnr—assigned score of the nth indicator in the indicator layer;
YMBmw—weights of the mth rule layer in the rule layer.
The comprehensive river health of the Qingliang River rivers was calculated using the assessment of river reach weights method:
RHI = i = 1 Rs ( RHI i × SL i RIVL )
RHI—assessed river comprehensive health assessment score.
RHIi—assessment of river reach indicator and rule layer assignment scores.
SLi—river length of the assessed river reach.
RIVL—total length of the assessed river.

4.4. Health Assessment Results and Analysis

4.4.1. Integral Health Characteristics of Each River Reach

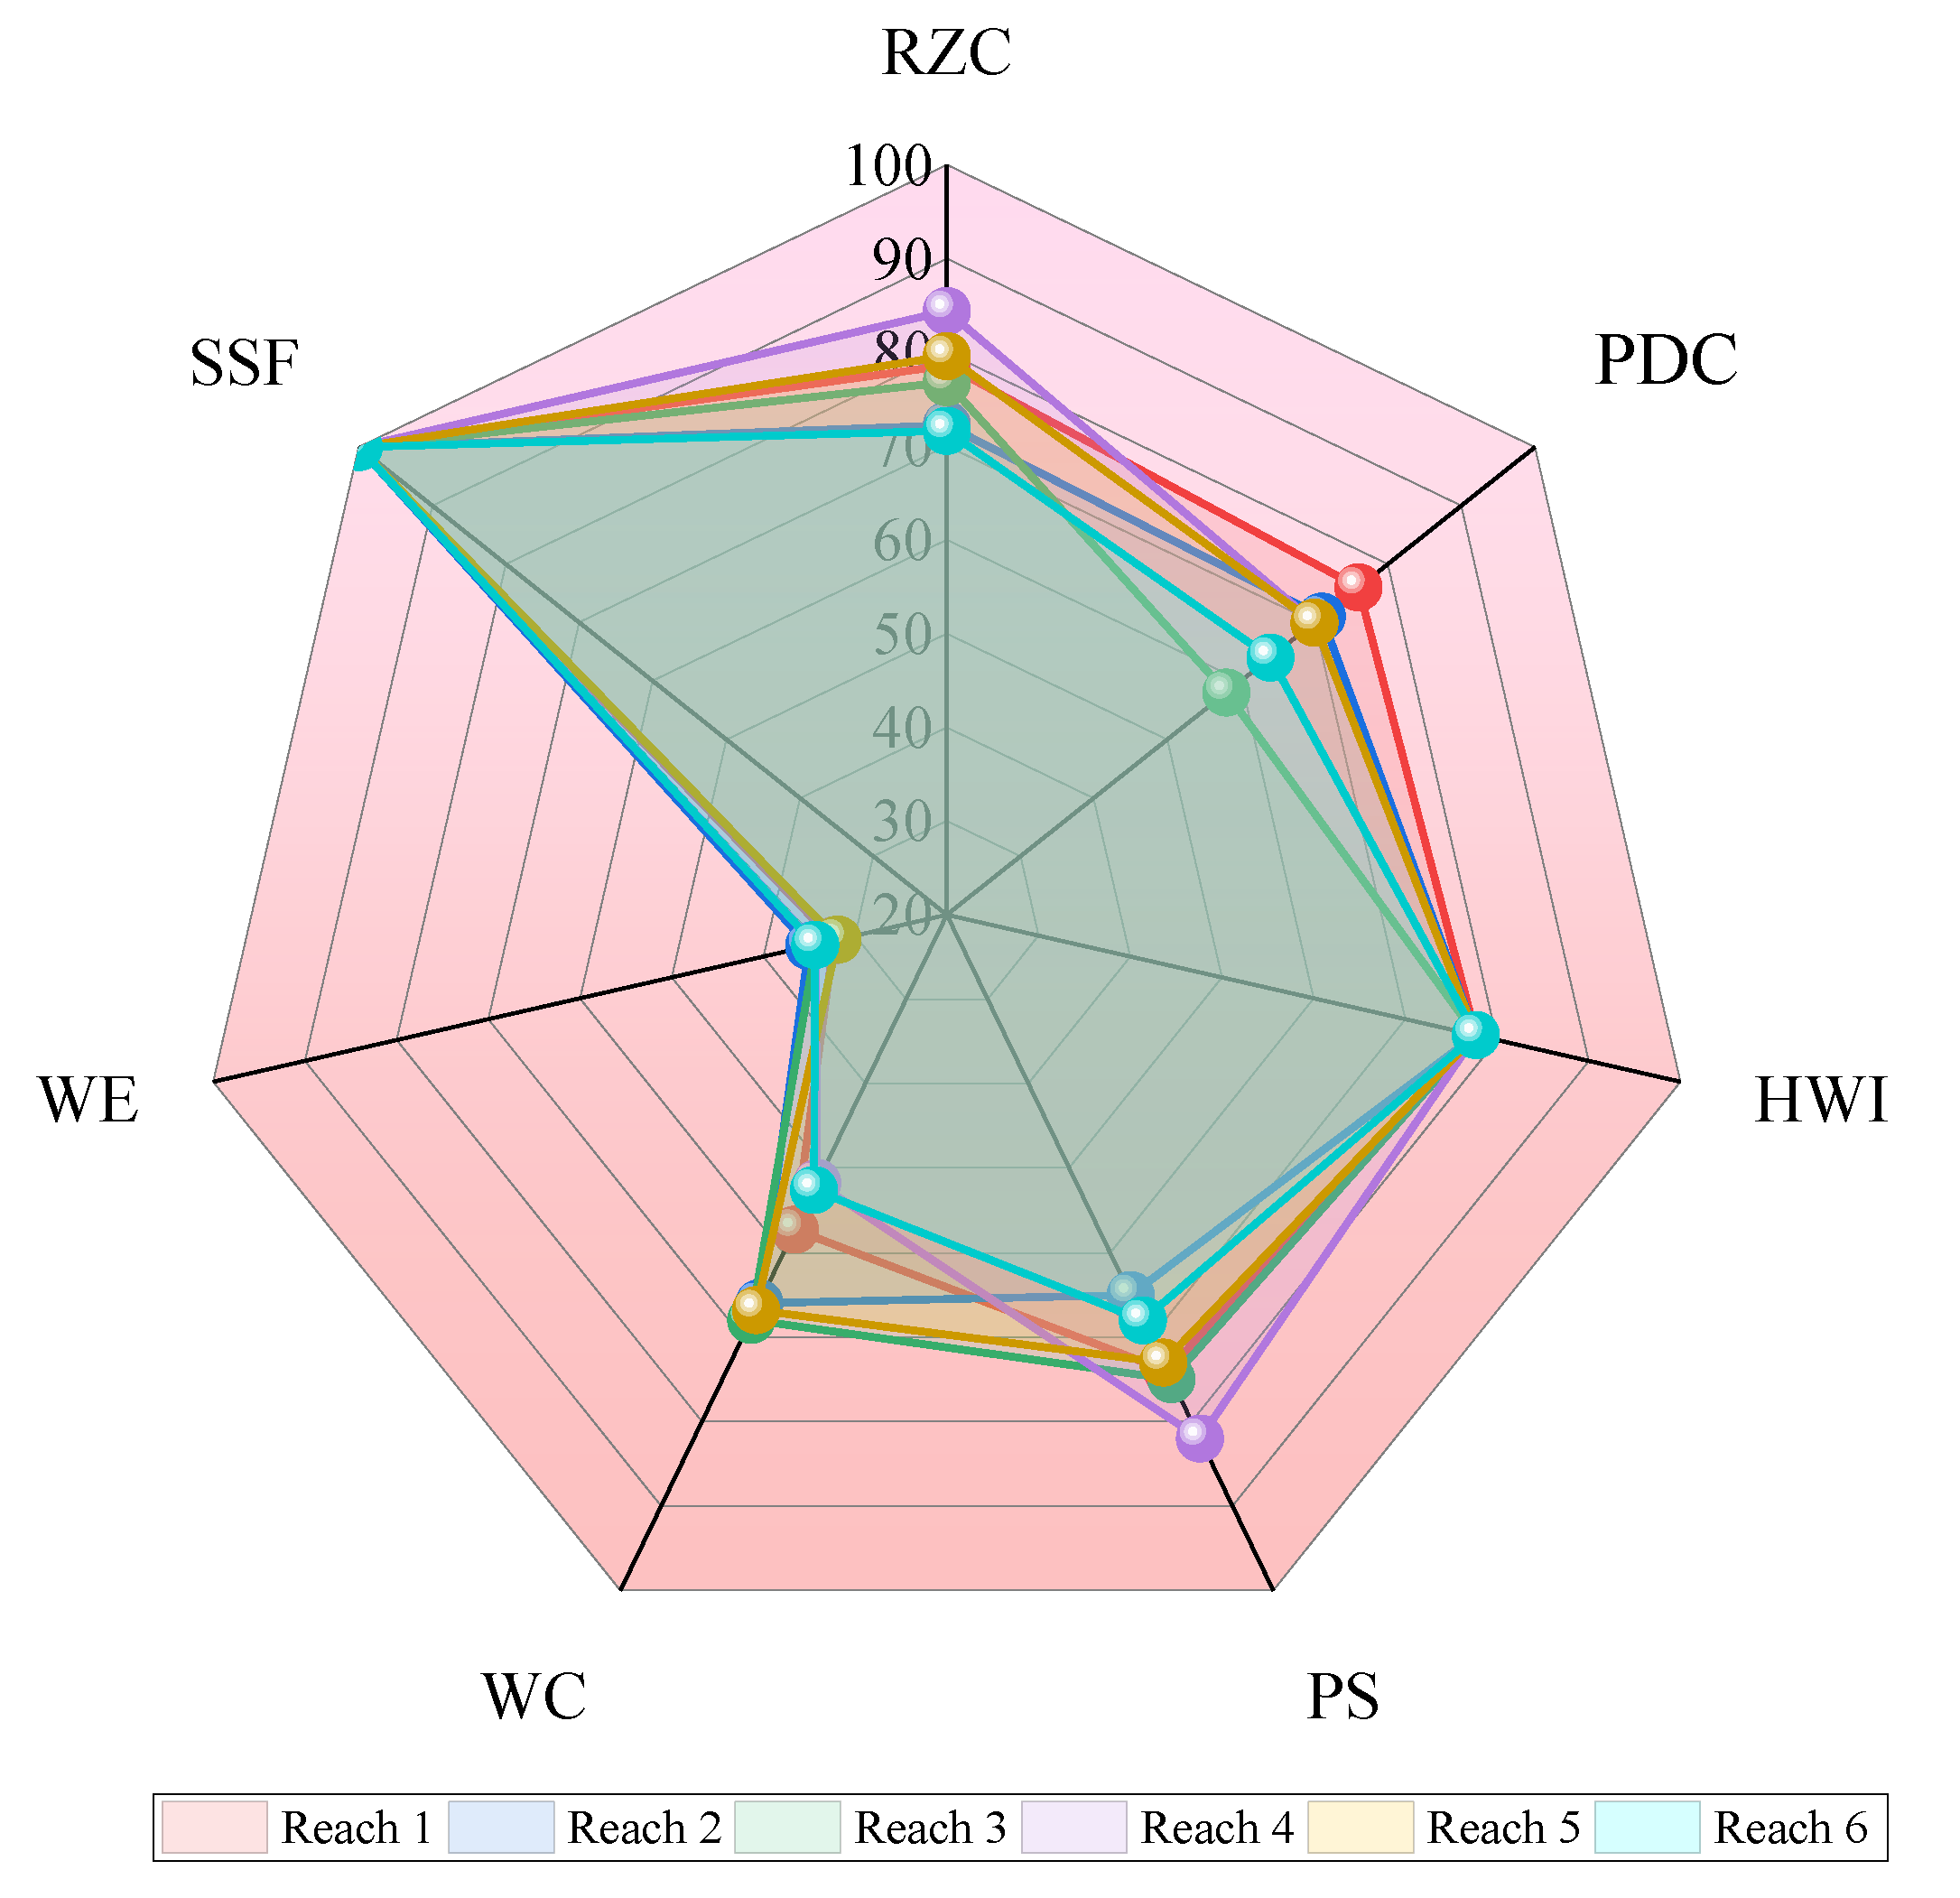
Based on the classification criteria for river health assessment in areas with significant human activity, the assessment results for each river section were determined. The health RHI values of all river sections of the Qingliang River were found to range from 64.57 to 69.37, and all sections were categorized as “Class III rivers,” indicating a “fair” status. The comprehensive assignment results for the goal and element layer of the Qingliang River are presented in Table 6 and Figure 5.
As depicted in Table 6, the overall RHI value of the Qingliang River is 68.19, indicating a “fair” status. Among the six river reaches, the RHI values are ranked as follows: river reach 5 > river reach 4 > river reach 3 > river reach 1 > river reach 2 > river reach 6. It can be observed that the overall spatial differences between the river reaches are relatively small. Furthermore, the calculation results for each rule layer and element layer in each river reach also exhibit relatively minor differences.

4.4.2. Integral River Health Characteristics

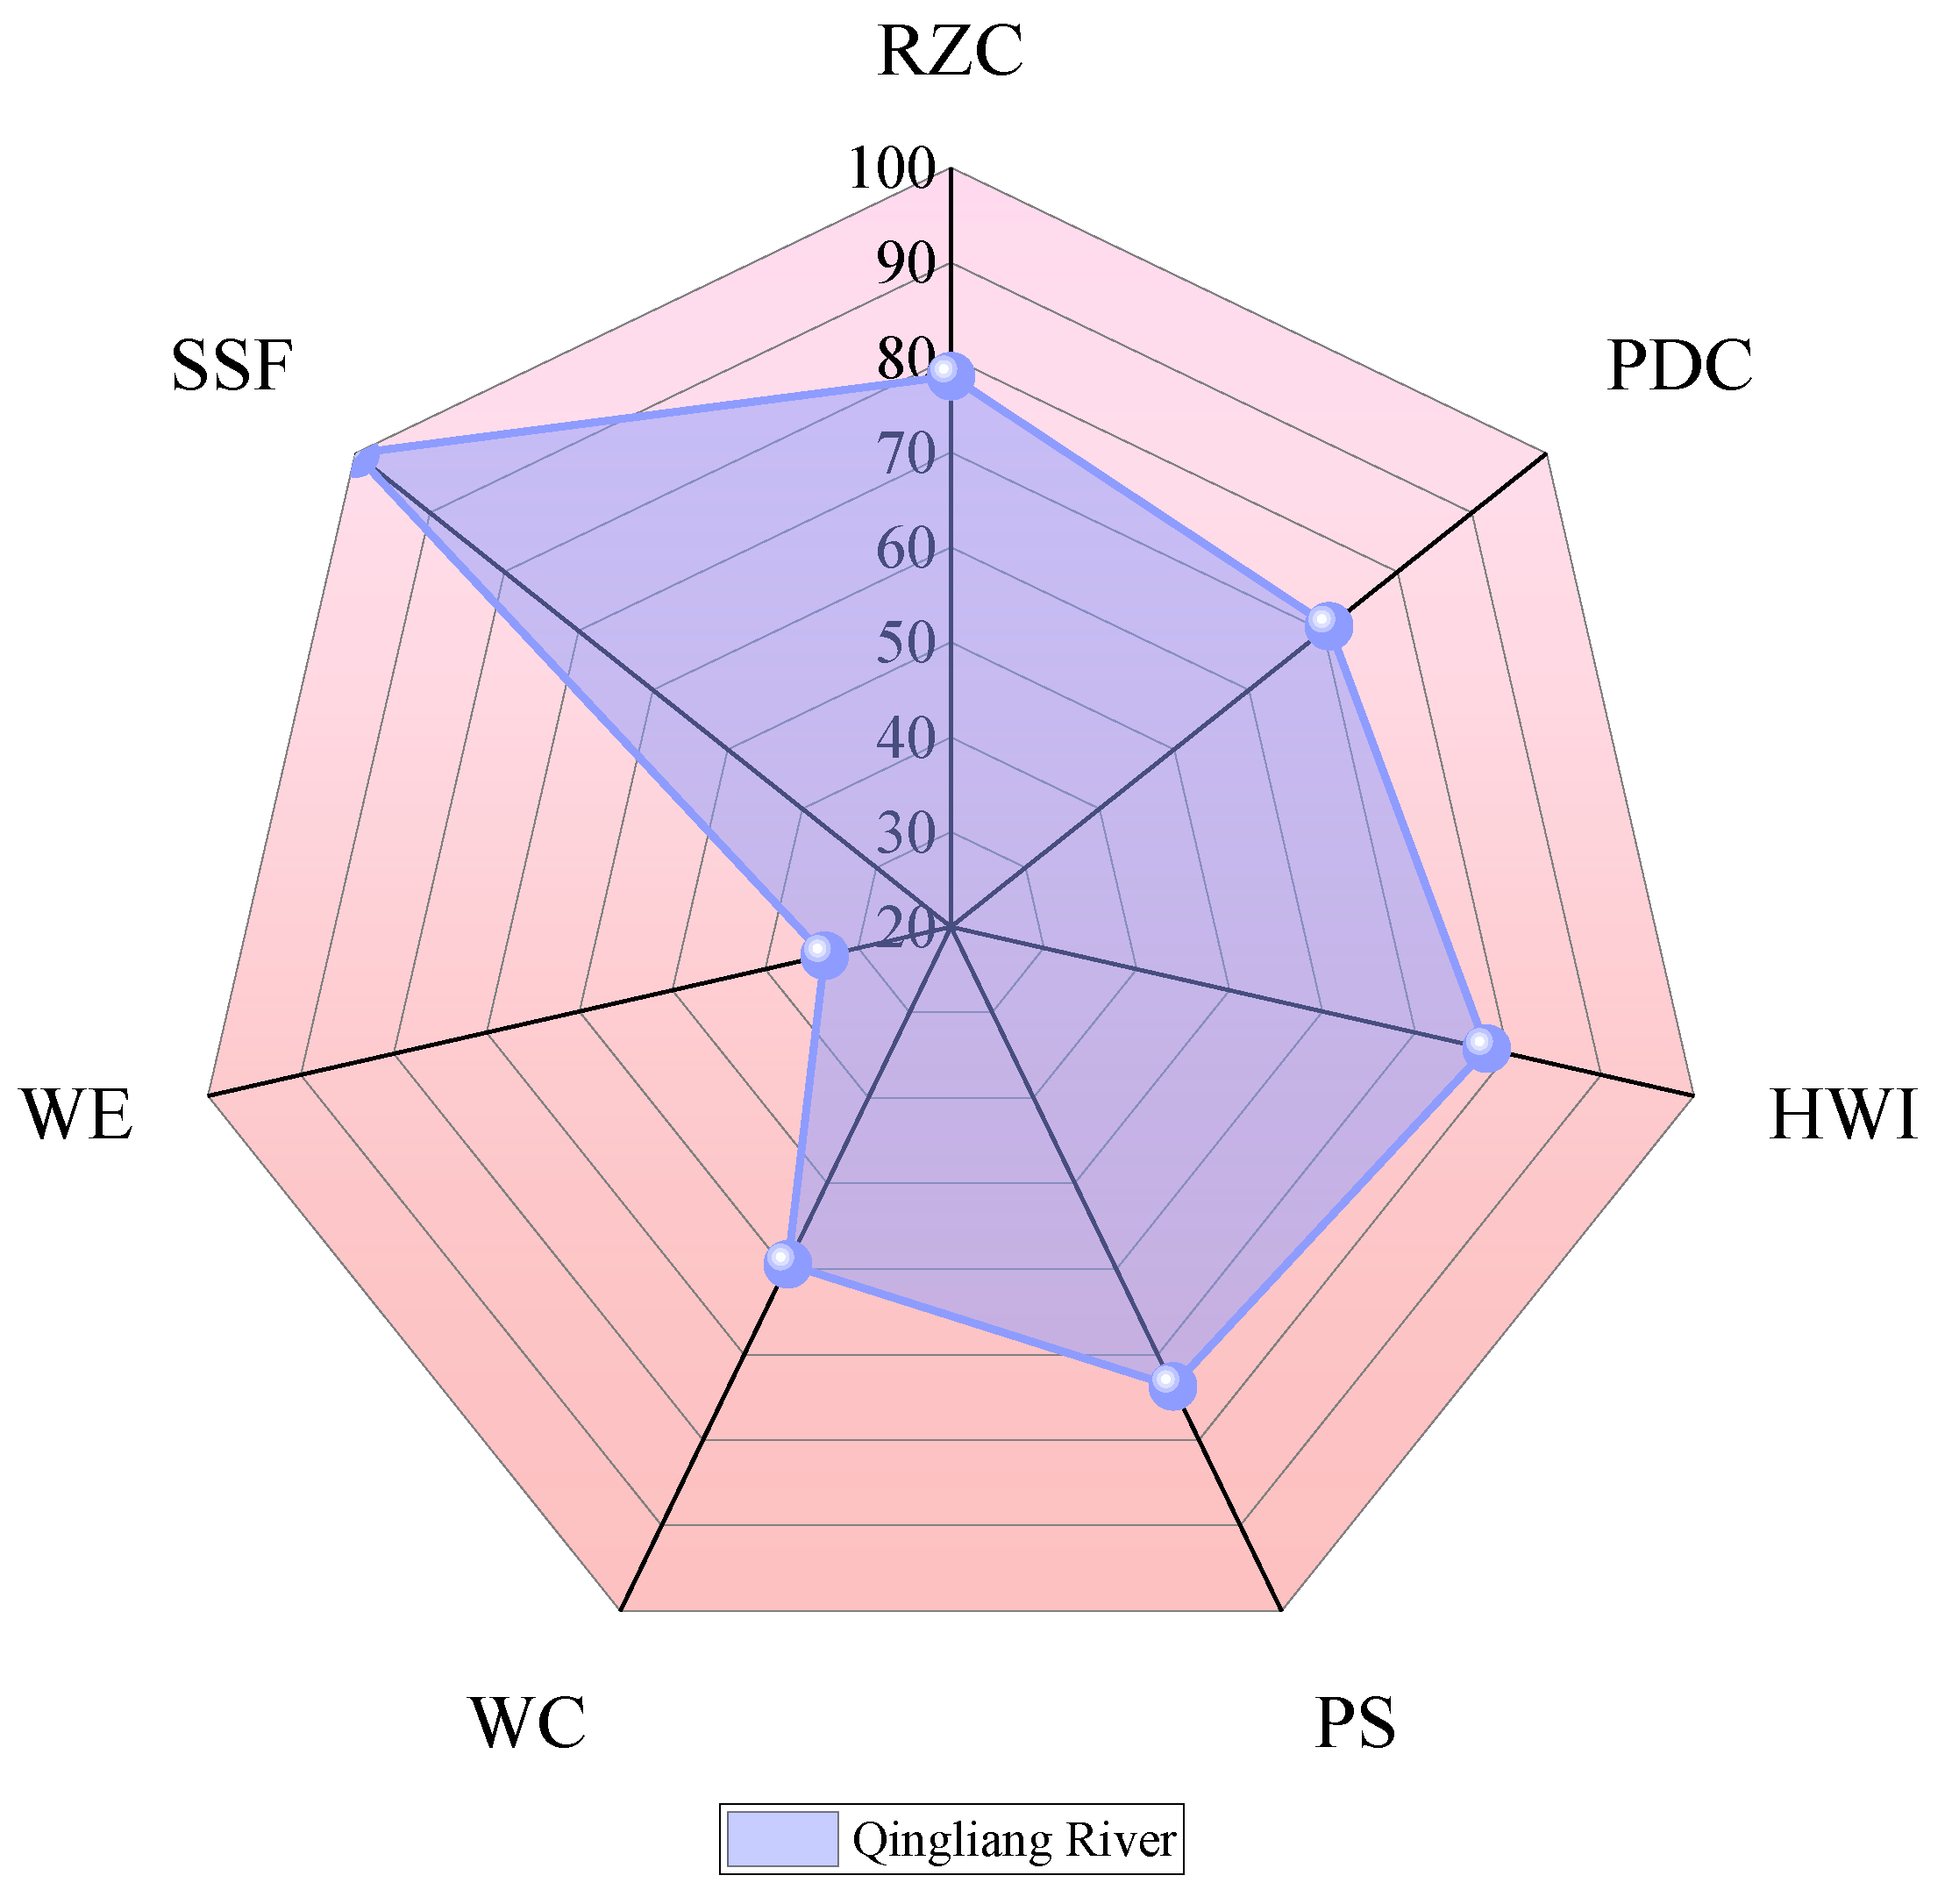
The comprehensive health indicator of the Qingliang River is 68.19 points, categorizing it as a “Class III river”, indicating a “fair” status. A detailed examination of the radar chart (Figure 6) and the assessment results (Table 7) reveals that the highest RHI score is achieved in the socio-economic service element layer, attaining a score of 100, denoting an “excellent” status comparable to a Class I river. The “riparian zone condition” element layer falls within the range of 63 to 100, while both the “pollutant discharge condition” element layer and the “physical structure” element layer lie in the range of 70 to 74, both constituting a “fair” status corresponding to Class III rivers. The RHI of the “human-water interaction” element layer reaches 77.71, belonging to Class II rivers. On the other hand, the “water environment” element layer attains an RHI of 59.46, categorizing it as a Class Ⅳ river and depicting a “poor” status. The “water ecology” element layer demonstrates an RHI lower than 40, falling under Class Ⅴ rivers and indicating a “very poor” status.
Based on the assessment of the indicator layers of the Qingliang River, the key elements that limit river health are identified as “water environment” and “water ecology”. It is noted that flood control rate (FDR), longitudinal continuity (LC), and water self-purification capacity (SP) exhibit relatively high values, whereas fish retention index (FRI), satisfaction degree of ecological flow (EF), and degree of river cutoff (RC) demonstrate lower values. The “poor” status of the “water environment” element layer is mainly attributed to the presence of river disconnection, while the “very poor” status of the “water ecology” element layer is primarily influenced by the insufficient assurance of ecological flow, the decline in fish populations, and the decrease in the integrity of fish communities. Overall, the results obtained by applying the health assessment index system proposed in this paper are found to be consistent with the actual situation of the Qingliang River, demonstrating good reliability, as indicated by the survey report from the project “Health Assessment of Major Rivers and Lakes in Cangzhou—Health Assessment of Qingliang River and Heilonggang River,” as well as the field survey.
The comprehensive assessment of the river health of the Qingliang River reveals the main issues that negatively impact its health. Firstly, the ecological flow of the river lacks sufficient assurance, and there are instances of river cut-offs. Secondly, there is an uneven spatial and temporal distribution of water resources in the Qingliang River. Thirdly, the ecological base flow is not adequately met, and water quality standards are not satisfactorily adhered to. In response to these challenges, we propose several countermeasures to improve the river health of the Qingliang River. Firstly, the scientific formulation of ecological water dispatching and emergency water replenishment plans, determination of ecological flow and ecological water levels for the Qingliang River, afforestation, and grass planting, along with increased soil erosion control, can guarantee ecological base flow and ecological water levels. Secondly, emphasis should be placed on water significance, enhancing water use efficiency, and promoting the economical and non-intensive use of water resources. Finally, river dredging, water system connectivity, and other river ecological treatment or water quality standardization projects that effectively improve river water quality should be implemented.

5. Conclusions

This research focuses on river health assessment in areas with significant human activity and addresses existing limitations in current assessment methods, such as poor applicability and reliance on single evaluation methods. To address these issues, a river health assessment index system is proposed based on the status of river health in areas with significant human activity. The objective is to conduct theoretical and practical case studies on river health assessment, particularly in areas with significant human activity, providing valuable references for such assessments.
Using the Qingliang River as a case study, we assessed its health status, revealing a “fair” overall health status. The key elements limiting the river health of the Qingliang River are identified as “water environment” and “water ecology”. In-depth analysis of the indicators highlights fish retention index (FEI), satisfaction degree of ecological flow (EF), and degree of river cutoff (RC) as major influencing factors. Consequently, ecological restoration efforts for the Qingliang River should prioritize biodiversity protection, water conservation, and soil erosion control.
During further research on river health assessment in areas with significant human activity, several aspects merit attention. Firstly, the proposed river health assessment standard emphasizes understanding relative differences in space and time, rather than merely classifying and dividing river health scores in the assessment area. Secondly, considering the many implications and complexity of river health in areas with significant human activity, continuous development in society and evolving perceptions necessitate ongoing revisions and improvements to the river health assessment index system. Lastly, subsequent academic research should validate the accuracy and efficiency of river health assessment indicators from multiple perspectives, incorporating more scientific methods for indicator selection and integrating objective weighting methods that better align with the actual context, thus enhancing the reliability and soundness of the assessment results.

Author Contributions

Conceptualization, H.J. and Y.L.; methodology, H.J. and Y.L.; software, Y.L.; validation, Y.L.; formal analysis, Y.L.; investigation, L.C. and Y.C.; resources, L.C. and Y.C.; data curation, H.W.; writing—original draft preparation, Y.L.; writing—review and editing, J.L.; visualization, Y.L.; supervision, H.W.; project administration, J.L.; funding acquisition, J.L. All authors have read and agreed to the published version of the manuscript.

Funding

This publication is funded by the National Natural Science Foundation of China (No. 51909091), China Scholarship Council (No. 202108410234), Science and Technology Projects of Water Resources Department of Henan Province, China (GG202332 and GG202334) and Henan Province Soft Science Research Project (232400411111).

Data Availability Statement

Not applicable.

Acknowledgments

The authors are grateful to the editors and anonymous reviewers for their insightful comments and helpful suggestions.

Conflicts of Interest

The authors declare no conflict of interest.

References

  1. Fowler, A.C.; Kopteva, N.; Oakley, C. The formation of river channels. SIAM J. Appl. Math. 2007, 67, 1016–1040. [Google Scholar] [CrossRef]
  2. Zhai, T.; Wang, J.; Fang, Y.; Qin, Y.; Huang, L.; Chen, Y. Assessing ecological risks caused by human activities in rapid urbanization coastal areas: Towards an integrated approach to determining key areas of terrestrial-oceanic ecosystems preservation and restoration. Sci. Total Environ. 2020, 708, 135153. [Google Scholar] [CrossRef] [PubMed]
  3. Luo, Z.; Zuo, Q.; Shao, Q. A new framework for assessing river ecosystem health with consideration of human service demand. Sci. Total Environ. 2018, 640–641, 442–453. [Google Scholar] [CrossRef] [PubMed]
  4. Karr, J.R. Assessment of Biotic Integrity Using Fish Communities. Fisheries 1981, 6, 21–27. [Google Scholar] [CrossRef]
  5. Wright, J.F.; Sutcliffe, D.W.; Furse, M.T. Assessing the Biological Quality of Fresh Waters: RIVPACS and Other Techniques; Freshwater Biological Association: Ambleside, UK, 2000; pp. 1–24. [Google Scholar]
  6. Petersen, R.C., Jr. The RCE: A Riparian, Channel, and Environmental Inventory for small streams in the agricultural landscape. Freshw. Biol. 1992, 27, 295–306. [Google Scholar] [CrossRef]
  7. Barbour, M.T.; Gerritsen, J.; Snyder, B.D.; Stribling, J.B. Rapid Bioassessment Protocols for Use in Streams and Wadable Rivers: Periphyton, Benthic Macroinvertebrates and Fish, 2nd ed.; US Environmental Protection Agency: Washington, DC, USA, 1999; pp. 1–10.
  8. Sue, O.; Taffs, K.H. Developing a regional diatom index for assessment and monitoring of freshwater streams in sub-tropical Australia. Ecol. Indic. 2017, 80, 135–146. [Google Scholar]
  9. Memet, V.; Karakaya, G.; Alpaslan, K. Water quality assessment of the Karasu River (Turkey) using various indices, multivariate statistics and APCS-MLR model. Chemosphere 2022, 308, 136415. [Google Scholar]
  10. James, L.A.; Marcus, W.A. The human role in changing fluvial systems: Retrospect, inventory and prospect. Geomorphology 2006, 79, 152–171. [Google Scholar] [CrossRef]
  11. Wohl, E. Rivers in the Anthropocene: The US perspective. Geomorphology 2020, 366, 106600. [Google Scholar] [CrossRef]
  12. O’Connor, J.E.; Duda, J.J.; Grant, G.E. 1000 dams down and counting. Science 2015, 348, 496–497. [Google Scholar] [CrossRef]
  13. Passalacqua, P. The Delta Connectome: A network-based framework for studying connectivity in river deltas. Geomorphology 2017, 277, 50–62. [Google Scholar] [CrossRef]
  14. Tang, T.; Cai, Q.; Liu, J. River ecosystem health and its evaluation. J. Appl. Ecol. 2002, 9, 1191–1194. (In Chinese) [Google Scholar]
  15. Wang, B.; Yang, L. Biointegrity index and water ecosystem health assessment. J. Ecol. 2006, 6, 707–710. (In Chinese) [Google Scholar]
  16. Liu, X.; Zhang, J.; Zhang, Y. Indicator system of healthy life in Yellow River. Acta Geogr. Sin. 2006, 5, 451–460. (In Chinese) [Google Scholar]
  17. Gao, X.; Zhao, S.; Zhang, C.; Tu, X. Evaluation system and method of river system health status. J. Hydraul. Eng. 2009, 40, 962–968. (In Chinese) [Google Scholar]
  18. Yao, N.; Feng, B.; Zhang, M.; He, L.; Zhang, H.; Liu, Z. Impact of industrial production, dam construction, and agriculture on the Z-IBI in river ecosystems: A case study of the wanan river basin in China. Water 2021, 13, 123. [Google Scholar] [CrossRef]
  19. Wan, X.; Yang, T.; Zhang, Q.; Yan, X.; Hu, C.; Sun, L.; Zeng, Y. A novel comprehensive model of set pair analysis with extenics for river health evaluation and prediction of semi-arid basin-A case study of Wei River Basin, China. Sci. Total Environ. 2021, 775, 145845. [Google Scholar] [CrossRef]
  20. Zhao, C.; Yang, Y.; Yang, S.; Xiang, H.; Zhang, Y.; Wang, Z.; Chen, X.; Mitrovic, S.M. Predicting future river health in a minimally influenced mountainous area under climate change. Sci. Total Environ. 2019, 656, 1373–1385. [Google Scholar] [CrossRef]
  21. Xia, J.; Lin, L.; Lin, J.; Nehal, L. Development of a GIS-based decision support system for diagnosis of river system health and restoration. Water 2014, 6, 3136–3151. [Google Scholar] [CrossRef]
  22. Song, D.; Gao, Z.; Zhang, H.; Xu, F.; Zheng, X.; Ai, J.; Hu, X.; Huang, G.; Zhang, H. GIS-based health assessment of the marine ecosystem in Laizhou Bay, China. Mar. Pollut. Bull. 2017, 125, 242–249. [Google Scholar] [CrossRef]
  23. Su, Y.; Li, W.; Liu, L.; Hu, W.; Li, J.; Sun, X.; Li, Y. Health assessment of small-to-medium sized rivers: Comparison between comprehensive indicator method and biological monitoring method. Ecol. Indic. 2021, 126, 107686. [Google Scholar] [CrossRef]
  24. Rapport, D.J.; Regier, H.A.; Hutchinson, T.C. Ecosystem Behavior Under Stress. Am. Nat. 1985, 125, 617–640. [Google Scholar] [CrossRef]
  25. Karr, J.R. Defining and measuring river health. Freshw. Biol. 1999, 41, 221–234. [Google Scholar] [CrossRef]
  26. An, K.G.; Park, S.S.; Shin, J.Y. An evaluation of a river health using the index of biological integrity along with relations to chemical and habitat conditions. Environ. Int. 2002, 28, 411–420. [Google Scholar] [CrossRef] [PubMed]
  27. Schofield, N.J.; Davies, P.E. Measuring the health of our rivers. Water 1996, 23, 39–43. [Google Scholar]
  28. Fairweather, P.G. State of environment indicators of ‘river health’: Exploring the metaphor. Freshw. Biol. 1999, 41, 211–220. [Google Scholar] [CrossRef]
  29. Meyer, J.L. Stream Health: Incorporating the Human Dimension to Advance Stream Ecology. J. N. Am. Benthol. Soc. 1997, 16, 439–447. [Google Scholar] [CrossRef]
  30. Vugteveen, P.; Leuven, R.S.E.W.; Huijbregts, M.A.J.; Lenders, H.J.R. Redefinition and Elaboration of River Ecosystem Health: Perspective for River Management. Hydrobiologia 2006, 565, 289–308. [Google Scholar] [CrossRef]
  31. Ladson, A.R.; White, L.J.; Doolan, J.A.; Finlayson, B.L.; Hart, B.T.; Lake, P.S.; Tilleard, J.W. Development and testing of an Index of Stream Condition for waterway management in Australia. Freshw. Biol. 1999, 41, 453–468. [Google Scholar] [CrossRef]
  32. Rogers, K.H. The real river management challenge: Integrating scientists, stakeholders and service agencies. River Res. Appl. 2006, 22, 269–280. [Google Scholar] [CrossRef]
  33. Norris, R.H.; Thoms, M.C. What is river health? Freshw. Biol. 1999, 41, 197–209. [Google Scholar] [CrossRef]
  34. Czerniawski, R.; Sługocki, Ł.; Krepski, T.; Wilczak, A.; Pietrzak, K. Spatial Changes in Invertebrate Structures as a Factor of Strong Human Activity in the Bed and Catchment Area of a Small Urban Stream. Water 2020, 12, 913. [Google Scholar] [CrossRef]
  35. Maavara, T.; Chen, Q.; Meter, K.V.; Brown, L.E.; Zhang, J.; Ni, J.; Zarfl, C. River dam impacts on biogeochemical cycling. Nat. Rev. Earth Environ. 2020, 2, 103–116. [Google Scholar] [CrossRef]
  36. Xue, C.; Shao, C.; Chen, S. SDGs-based river health assessment for small-and medium-sized watersheds. Sustainability 2020, 12, 1846. [Google Scholar] [CrossRef]
  37. Ko, N.T.; Suter, P.; Conallin, J.; Rutten, M.; Bogaard, T. The urgent need for river health biomonitoring tools for large tropical rivers in developing countries: Preliminary development of a river health monitoring tool for Myanmar rivers. Water 2020, 12, 1408. [Google Scholar] [CrossRef]
  38. Li, J.; Chen, X.; Zhang, X.; Huang, Z.; Xiao, L.; Huang, L.; Kano, Y.; Sato, T.; Shimatani, Y.; Zhang, C. Fish biodiversity conservation and restoration, yangtze river basin, china, urgently needs ‘scientific’ and ‘ecological’ action. Water 2022, 12, 3043. [Google Scholar] [CrossRef]
  39. Anderson, E.P.; Jackson, S.; Tharme, R.E.; Douglas, M.; Flotemersch, J.E.; Zwarteveen, M.; Lokgariwar, C.; Montoya, M.; Wali, A.; Tipa, G.T.; et al. Understanding rivers and their social relations: A critical step to advance environmental water management. Wiley Interdiscip. Rev.—Water 2019, 6, e1381. [Google Scholar] [CrossRef]
  40. Anwar, M.S.; Guan, Y.; Zhang, D.; Shao, G.; Cheng, X.; Yang, Y. The associations between river health and water resources management lead to the assessment of river state. Ecol. Indic. 2020, 109, 105814. [Google Scholar] [CrossRef]
  41. Zhang, Y.; Zhou, K.; Yang, Z.; Zhang, L.; Ren, X. The definition and index system of hydro-ecological carrying capacity (HECC). J. Northwest Univ. (Nat. Sci. Ed.) 2019, 49, 42–53. (In Chinese) [Google Scholar]
  42. Geng, L.; Liu, H.; Zhong, H.; Liu, C. Indicators and criteria for evaluation of healthy rivers. J. Hydraul. Eng. 2006, 37, 253–258. (In Chinese) [Google Scholar]
  43. Ministry of Water Resources of the People’s Republic of China. Evalution Guide of Water Ecological Civilization Construction: SL/Z 738-2016; China Water Power Press: Beijing, China, 2016. (In Chinese)
  44. Gleick, P.H. Global Freshwater Resources: Soft-Path Solutions for the 21st Century. Science 2003, 302, 5650. [Google Scholar] [CrossRef] [PubMed]
  45. Rowntree, K.M.; Wadeson, R.A. A Hierarchical Geomorphological Model for the Classification of Selected South African Rivers; Water Research Commission Report, No. 497/1/99; Water Research Commission: Pretoria, South Africa, 1994. [Google Scholar]
  46. Water Function Division of Hebei Province. Available online: http://slt.hebei.gov.cn/a/2018/10/31/2018103137436.html (accessed on 25 July 2023).
  47. Measures for the Administration of Water Functional Zones. Available online: http://www.mwr.gov.cn/zwgk/gknr/201707/t20170726_1442596.html (accessed on 25 July 2023).
  48. Xu, W.; Dong, Z.; Hao, H.; Li, D.; Ren, L. River health evaluation based on the fuzzy matter-element extension assessment model. Pol. J. Environ. Stud. 2017, 26, 1353–1361. [Google Scholar] [CrossRef]
  49. Chovanec, A.; Schiemer, F.; Waidbacher, H.; Robert, S. Rehabilitation of a Heavily Modified River Section of the Danube in Vienna (Austria): Biological Assessment of Landscape Linkages on Different Scales. Int. Rev. Hydrobiol. 2002, 87, 18. [Google Scholar] [CrossRef]
  50. Jungwirth, M.; Susanne, M.; Stefan, S. Re-establishing and assessing ecological integrity in riverine landscapes. Freshw. Biol. 2022, 47, 867–887. [Google Scholar] [CrossRef]
  51. Jaiswal, D.; Pandey, J. Anthropogenically enhanced sediment oxygen demand creates mosaic of oxygen deficient zones in the ganga river: Implications for river health. Ecotoxicol. Environ. Saf. 2019, 171, 709–720. [Google Scholar] [CrossRef]
  52. Llansó, R.J.; Dauer, D.M.; Volstad, J.H. Assessing ecological integrity for impaired waters decisions in Chesapeake bay, USA. Mar. Pollut. Bull. 2009, 59, 48–53. [Google Scholar] [CrossRef]
  53. Fu, B.; Liu, S.; Ma, M. Content and methods of ecosystem comprehensive assessment. Acta Ecol. Sin. 2001, 11, 1885–1892. [Google Scholar]
  54. Johnson, L.B.; Breneman, D.H.; Richards, C. Macroinvertebrate community structure and function associated with large wood in low gradient streams. River Res. Appl. 2003, 19, 199–218. [Google Scholar] [CrossRef]
  55. Sands, P.; Galizzi, P. Directive 2000/60/EC of the European Parliament and of the Council of 23 October 2000 Establishing a Framework for Community Action in the Field of Water Policy. Documents in European Community Environmental Law; Cambridge University Press: Cambridge, UK, 2006; pp. 879–969. [Google Scholar] [CrossRef]
  56. Ministry of Water Resources of the People’ s Republic of China. National River Health Assessment Indicators, Standards and Methods; General Office of the Ministry of Water Resources: Beijing, China, 2010. (In Chinese)
  57. Vörösmarty, C.J.; McIntyre, P.B.; Gessner, M.O.; Dudgeon, D.; Prusevich, A.; Green, P.; Glidden, S.; Bunn, S.E.; Sullivan, C.A.; Liermann, C.R.; et al. Global threats to human water security and river biodiversity. Nature 2010, 467, 555–561. [Google Scholar] [CrossRef]
  58. Deng, X.; Xu, Y.; Han, L.; Yu, Z.; Yang, M.; Pan, G. Assessment of river health based on an improved entropy-based fuzzy matter-element model in the Taihu Plain, China. Ecol. Indic. 2015, 57, 85–95. [Google Scholar] [CrossRef]
  59. Chen, J.; Wang, Y.; Li, F.; Liu, Z. Aquatic ecosystem health assessment of a typical sub-basin of the Liao River based on entropy weights and a fuzzy comprehensive evaluation method. Sci. Rep. 2019, 9, 14045. [Google Scholar] [CrossRef] [PubMed]
  60. Wang, S.; Zhang, Q.; Yang, T.; Zhang, L.; Li, X.; Chen, J. River health assessment: Proposing a comprehensive model based on physical habitat, chemical condition and biotic structure. Ecol. Indic. 2019, 103, 446–460. [Google Scholar] [CrossRef]
  61. Yang, X. Cangzhou Yearbook; Kyushu Press: Beijing, China, 2021. [Google Scholar]
  62. Fu, L.; Liu, A. China Statistical Yearbook—2021; China Statistics Press: Beijing, China, 2021; pp. 4–5. [Google Scholar]
  63. Water Resources Bulletin Information Query. Available online: http://app.gjzwfw.gov.cn/jmopen/webapp/html5/szygbxxcx/index.html (accessed on 25 July 2023).
  64. Hu, Z. Statistical Yearbook of Chinese Urban Construction; China Statistics Press: Beijing, China, 2021; pp. 4–5. [Google Scholar]
  65. Cangzhou Hydrology and Water Resources Survey Bureau, Hebei Province. Cangzhou Yearbook; Hebei People’s Publishing House: Shijiazhuang, China, 2002; p. 111. [Google Scholar]
  66. Li, J. Qinghe Yearbook; China Literature and History Publishing House: Beijing, China, 2021; p. 139. [Google Scholar]
  67. Zhao, G.; He, D.; Yao, S. Hebei Rural Statistical Yearbook; China Statistics Press: Beijing, China, 2019; pp. 191–197. [Google Scholar]
  68. Zhang, B. Botou Yearbook; Hebei People’s Publishing House: Shijiazhuang, China, 2016; p. 185. [Google Scholar]
  69. Ministry of Water Resources of the People’s Republic of China. Technical Guidelines for River and Lake Health Assessment (SL/T 793-2020); China Water & Power Press: Beijing, China, 2020.
  70. Guidelines for Health Assessment of Rivers and Lakes of the Ministry of Water Resources, PRC (Trial) (No. 43). Available online: http://slt.ah.gov.cn/xwzx/ztzl/zhz/tzgghwjjs/120535061.html (accessed on 25 July 2023).
  71. Ministry of Water Resources of the People’s Republic of China. National Major Rivers and Lakes Water Function Zoning (2011–2030); China Water & Power Press: Beijing, China, 2013.
  72. National Ecological Function Zoning (Revised Edition). Available online: https://www.mee.gov.cn/gkml/hbb/bgg/201511/t20151126_317777.html. (accessed on 25 July 2023).
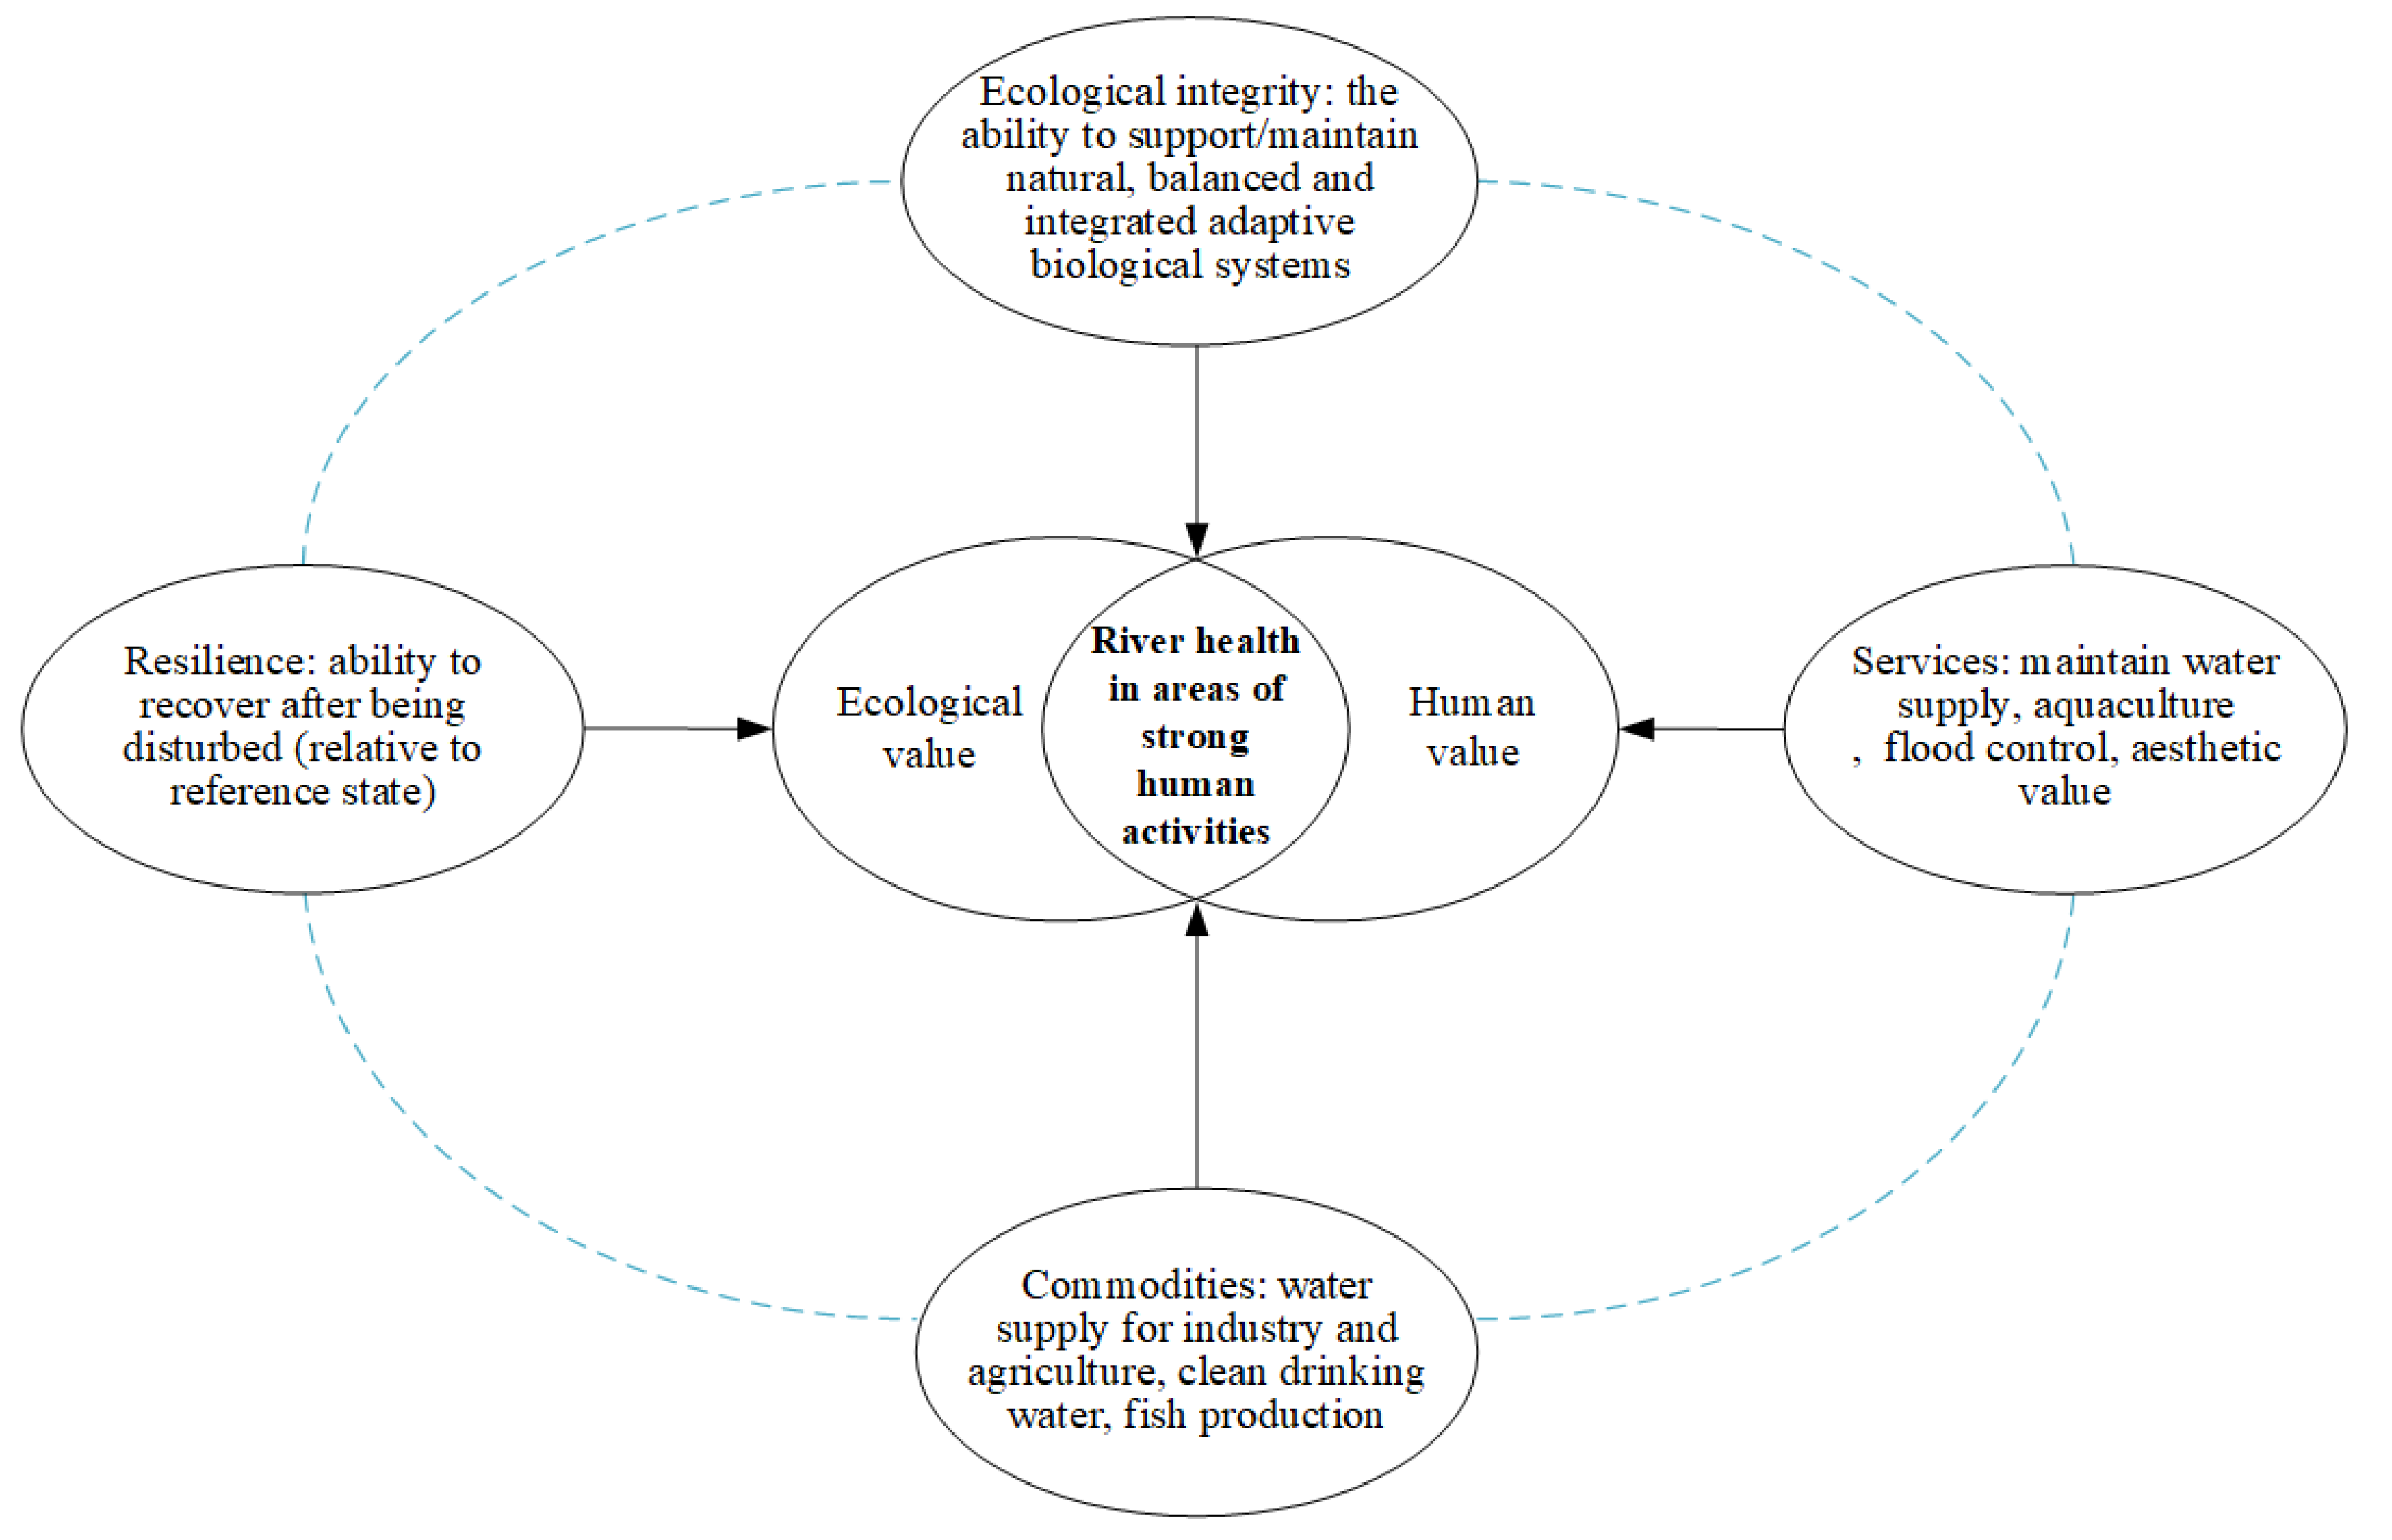
Figure 1. Aspects of river health in areas of significant human activity.
Water 15 02969 g001
Figure 2. The framework of river health assessment system in areas of significant human activity.
Water 15 02969 g002
Figure 3. Hydrographic chart of Qingliang River.
Water 15 02969 g003
Figure 4. Diagram of Qingliangjiang Subdistrict.
Water 15 02969 g004
Figure 5. Radar chart of element layer assignment for each river reach.
Water 15 02969 g005
Figure 6. Radar chart of element layer assignment of Qingliang River.
Water 15 02969 g006
Table 1. Indicator system for assessing the health of rivers in areas of significant human activity.
Rule LayerElement LayerIndicator LayerIndicator Type
Over the riverbankRiparian zone conditionRiverbank stabilityCompulsory indicator
Longitudinal continuityCompulsory indicator
Vegetation coverage ratioCompulsory indicator
Side connectivityReserve indicator
Soil and water loss treatment degreeReserve indicator
Artificial interference degree of riparian zoneCompulsory indicator
Pollution discharge conditionSewage treatment ratioCompulsory indicator
Pollution load emission indexReserve indicator
Human–water interactionPublic satisfactionCompulsory indicator
Riverine landscape effectReserve indicator
Number of water culture heritage carriersReserve indicator
Public awareness of eco-civilization of waterCompulsory indicator
Perfection degree of water laws and regulations constructionReserve indicator
Under the riverbankPhysical structureChannel stabilityReserve indicator
Bending degree of river channel changeReserve indicator
Form of embankment of river channelCompulsory for rivers with landscape entertainment function, optional for others
Water environmentWater qualityCompulsory indicator
Water self-purification capacityCompulsory indicator
Sediment pollution statusCompulsory for rivers with habitat function, optional for others
Degree of river cutoffCompulsory indicator
Water ecologySatisfaction degree of ecological flowCompulsory indicator
Flow process variation degreeReserve indicator
Habitat conditionCompulsory for rivers with corridor or habitat function, optional for others
Migrating conditionCompulsory for rivers with corridor or habitat function, optional for others
Fish retention indexCompulsory indicator
Biotic Integrity Index of MacroinvertebratesCompulsory indicator
Aquatic plant community statusCompulsory for rivers with habitat function, optional for others
Waterbird conditionCompulsory for rivers with habitat function, optional for others
Socio-economic service functionInsurance probability of irrigation waterCompulsory for rivers with irrigation function, optional for others
Flood control compliance ratioCompulsory for rivers with flood control function, optional for others
Urban water supply guarantee ratioCompulsory for rivers with water supply function, optional for others
Average per capita water resourcesReserve indicator
Cruise ship navigation guarantee ratioCompulsory for rivers with navigation function, optional for others
Degree of control of water consumption target of 10,000 CNY GDPReserve indicator
Water conservancy facilities ready ratioCompulsory for rivers with flood control, water supply, or hydropower function, optional for others
Table 2. Indicator criteria for assessing the health of rivers in areas of significant human activity.
Element LayerIndicator LayerCharacteristics of IndicatorsUnitStandard Values of Indicators
Riparian zone conditionRiverbank stabilityPositive%[98, 100][85, 98)[70, 85)[50, 70)<50
Longitudinal continuityNegativepcs/102 km[0, 0.3](0.3, 0.5](0.5, 0.8](0.8, 1.2]>1.2
Vegetation coverage ratioPositive%>75[50, 75)[25, 50)[5, 25)[0, 5)
Side connectivityNegative%[0, 5)[5, 25)[25, 50)[50, 75)>75
Soil and water loss treatment degreePositive%[95, 100][80, 95)[60, 80)[40, 60)<40
Artificial interference degree of riparian zoneNegative-[95, 100][80, 95)[60, 80)[30, 60)[0, 30)
Pollution discharge conditionSewage treatment ratioPositive%[95, 100][80, 95)[60, 80)[40, 60)<40
Pollution load emission indexNegative-[0, 0.5](0.5, 0.9](0.9, 1.1](1.1, 1.5]>1.5
Human–water interactionPublic satisfactionPositive-[95, 100][80, 95)[60, 80)[30, 60)[0, 30)
Riverine landscape effectPositive%[95, 100][80, 95)[65, 80)[50, 65)<50
Number of water culture heritage carriersPositivepcs≥8[6, 8)[3, 6)[1, 3)0
Public awareness of eco-civilization of waterPositive%≥20[15, 20)[10, 15)[5, 10)[0, 5)
Perfection degree of water laws and regulations constructionPositive%[90, 100][70, 90)[40, 70)[20, 40)<20
Physical structureChannel stabilityPositive%[98, 100][85, 98)[70, 85)[50, 70)<50
Bending degree of river channel changePositive%[95, 100][80, 95)[65, 80)[50, 65)<50
Form of embankment of river channelPositive-[95, 100][80, 95)[60, 80)[30, 60)[0, 30)
Water environmentWater qualityPositive-I, IIIIIIVVPoor V
Water self-purification capacityPositivemg/L≥7.5≥6≥3≥20
Sediment pollution statusNegative-[0, 1)[1, 2)[2, 3)[3, 5)>5
Degree of river cutoffNegative%[0, 15)[15, 30)[30, 40)[40, 50)≥50
Water ecologySatisfaction degree of ecological flowPositive%≥30[20, 30)[10, 20)[5, 10)<5
Flow process variation degreePositive-[0, 0.05](0.05, 0.1](0.1, 0.3](0.3, 1.5]>1.5
Habitat conditionPositive-[95, 100][80,95)[60, 80)[30, 60)[0, 30)
Migrating conditionPositive-[95, 100][80,95)[60, 80)[30, 60)[0, 30)
Fish retention indexPositive%100[75, 100)[50, 75)[25, 50)[0, 25)
Biotic Integrity Index of MacroinvertebratesPositive-≥1.62[1.03, 1.62)[0.31, 1.03)[0.1, 0.31)[0, 0.1)
Aquatic plant community statusPositive-[90, 100][80, 90)[60, 80)[30, 60)[0, 30)
Waterbird conditionPositive-[90, 100][80, 90)[60, 80)[30, 60)[0, 30)
Socio-economic service functionInsurance probability of irrigation waterPositive%[95, 100][80, 95)[65, 80)[50, 65)<50
Flood control compliance ratioPositive%[95, 100][90, 95)[85, 90)[70, 85)≤50
Urban water supply guarantee ratioPositive%[95, 100][85, 95)[60, 85)[20, 60)[0, 20)
Average per capita water resourcesPositivem3/person≥900[667, 900)[435, 667)[307, 435)<307
Cruise ship navigation guarantee ratioPositive%[95, 100][80, 95)[65, 80)[50, 65)<50
Degree of control of water consumption target of 10,000 CNY GDPPositive%[95, 100][85, 95)[70, 85)[50, 70)<50
Water conservancy facilities ready ratioPositive%[98, 100][90, 98)[75, 90)[60, 75)<60
Table 3. Data sources of Qingliang River reach assessment indicators.
IndicatorCodeData Sources
Riverbank stabilityRBSField research
Longitudinal continuityLCField research
Vegetation coverageVCField research
Sewage treatment ratioSTRField research
Public satisfactionPSQuestionnaire survey
Public awareness of eco-civilization of waterPAWQuestionnaire survey
Channel stabilityCSField research
Water qualityWQField research
Water self-purification capacitySPField research
Degree of river cutoffRCOnline monitoring daily scale long-sequence data of Qiaoguantun hydrologic station
Satisfaction degree of ecological flowEFDaily streamflow data of Qiaoguantun Hydrologic Station
Fish retention indexFRIField capture, complementary survey
Biotic Integrity Index of MacroinvertebratesBIBIField research
Aquatic plant community statusAPSetting section, sampling
Flood control compliance ratioFDRField research,
hydrology data
Table 4. Qingliang River assessment river reach division table.
RiverRiver Reach Serial NumberStarting PointEnding PointSegmented River Length (km)Total River Length (km)
Spot
Qingliang River1Cangzhou boundaryNorth Bailizhuang Village24.159.38
2North Bailizhuang VillageHoubachigao Village12
3Houbachigao VillageSanchahe Village8.5
4Sanchahe VillageWenmiao Village11.6
5Wenmiao VillageXiaolizhuang Village1.27
6Xiaolizhuang VillageHuangmanzhuang Village1.91
Table 5. Qingliang River health assessment indicator system.
Goal LayerRule LayerElement LayerIndicator Layer
Layer NameWeightLayer NameWeightLayer NameCodeWeight
Qingliang River (RHI)Over the riverbank
(ORB)
0.4Riparian zone condition (RZC)0.5Riverbank stabilityRBS0.4
Longitudinal continuityLC0.2
Vegetation coverageVC0.4
Pollution discharge condition (PDC)0.2Sewage treatment ratioSTR1
Human–water interaction (HWI)0.3Public satisfactionPP0.6
Public awareness of eco-civilization of waterPAW0.4
Under the riverbank
(URB)
0.6Physical structure (PS)0.2Channel stabilityCS1
Water environment (WC)0.3Water qualityWQ0.4
Water self-purification capacitySP0.3
Degree of river cutoffRC0.3
Water ecology (WE)0.3Satisfaction degree of ecological flowEF0.5
Fish retention indexFRI0.2
Biotic Integrity Index of MacroinvertebratesBIBI0.2
Aquatic plant community statusAP0.1
Socio-economic service function (SSF)0.2Flood control compliance ratioFDR1
Table 6. Results of the overall health assignment for the goal layer of the river.
RiverRiver Reach Serial NumberSegmented River Length (km)Total River Length (km)WeightGoal Layer of Each River Reach (RHIi)Overall Goal Layer of the River (RHI)
Score (RHIir)Score (RHIr)Health ClassificationState of Health
Qingliang River124.10 59.38 0.41 68.13 68.19 Class III riverfair
212.00 0.20 67.43
38.50 0.14 68.73
411.60 0.20 69.14
51.27 0.02 69.37
61.91 0.03 64.57
Table 7. Qingliang River assessment of river health score table.
Goal LayerRule LayerElement LayerIndicator LayerAssessed River ReachWeightScore of Criteria LayerWeight of Criteria LayerScore of Element LayerWeight of Element LayerOverall Score
123456
Indicator Assignment of Monitoring Sites
Qingliang River (RHI)Over the riverbankRiparian zone condition (RZC)Riverbank stability7568728074660.476.490.478.040.568.19
Longitudinal continuity93931001001001000.2
Vegetation coverage7566708175630.4
Pollution discharge condition (PDC)Sewage treatment rate767158707064170.800.2
Human–water interaction (HWI)Public satisfaction78.8578.8578.8578.8578.8578.850.677.710.3
Public awareness of eco-civilization of water7676767676760.4
Under the riverbankPhysical structure (PS)Channel stability746575827368162.660.673.740.2
Water environment (WC)Water quality6477826979660.459.460.3
Water self-purification capacity88.310010063.3100700.3
Degree of river cutoff17.2517.2517.2517.2517.2517.250.3
Water ecology (WE)Satisfaction degree of ecological flow8.148.148.148.148.148.140.533.590.3
Fish retention index28.228.228.228.228.228.20.2
Biotic Integrity Index of Macroinvertebrates86.186.186.186.186.186.10.2
Aquatic plant community status5477728658660.1
Socio-economic service function (SSF)Flood control compliance rate10010010010010010011000.2
Disclaimer/Publisher’s Note: The statements, opinions and data contained in all publications are solely those of the individual author(s) and contributor(s) and not of MDPI and/or the editor(s). MDPI and/or the editor(s) disclaim responsibility for any injury to people or property resulting from any ideas, methods, instructions or products referred to in the content.