Article

The Seepage Evolution Characteristics in Undisturbed Loess under Dynamic Preferential Flow: New Insights from X-ray Computed Tomography

1
Key Laboratory of Roads and Railway Engineering Safety Control, Shijiazhuang Tiedao University, Ministry of Education, Shijiazhuang 050043, China
2
School of Civil Engineering, Shijiazhuang Tiedao University, Shijiazhuang 050043, China
3
Sichuan Institute of Geological Engineering Investigation Group Co., Ltd., Chengdu 610072, China
4
School of Water and Environment, Chang’an University, Xi’an 710054, China
*
Author to whom correspondence should be addressed.
Water 2023, 15(16), 2963; https://doi.org/10.3390/w15162963
Submission received: 23 July 2023 / Revised: 11 August 2023 / Accepted: 13 August 2023 / Published: 17 August 2023
(This article belongs to the Special Issue Geological Hazards: Landslides Induced by Rainfall and Infiltration)

Abstract

:
Preferential flow is widely developed in varieties of voids (such as macropores and fissures) in loess areas, affecting slope hydrology and stability and even leading to geological disasters. However, the model of seepage evolution with dynamic preferential flow is not clear, which obstructs the disclosure of the mechanism of landslides induced by the preferential flow. This study aimed to capture the seepage and occurrence status of water in loess voids, explain the variability characteristics of the loess pore structure, and reveal the seepage evolution model of dynamic preferential flow. Preferential infiltration experiments were conducted by combining X-ray computed tomography (X-ray CT) nondestructive detection with contrast techniques under dynamic seepage conditions. Three-dimensional (3D) visualized reconstruction, digital image correlation (DIC), image processing, and quantitative analyses were performed in AVIZO 2019.1, including two-dimensional (2D) and 3D characteristics of preferential flow distribution and macropore changing, dynamic variation of the porosity, pore number, volume, dip angle, and connectivity. Results showed that (1) preferential flow exists under saturated and unsaturated conditions in loess with strong uniformity and anisotropy; (2) preferential flow not only migrates into existing connected macropores, but also connects the original isolated pores into channels and forms larger percolation groups of contrast medium under the gradually increased high pressure; (3) the seepage develops with the evolution model of ‘preferential flow–piston flow–preferential piston mixture flow–piston flow’ in the dynamic process. The new insights into the characteristics of the seepage evolution in undisturbed loess under dynamic preferential flow will enrich the understanding of loess seepage and provided an important reference for future research on the slope instability of the loess induced by preferential flow.

1. Introduction

Loess is a sediment caused by wind deposits in arid and semi-arid areas [1,2], which is widely distributed in China and covers about 633,000 km2 accounting for 6.6% of the Chinese mainland, where the Loess Plateau of China (LPC), a continuous loess distribution area, has covered 440,000 km2 with complete strata since the Quaternary [3,4,5,6].
With the advancement of the Western Development and the Belt and Road Initiative strategies, the LPC has become the core area for the construction of the Silk Road [7]. However, in this region, the ecological environment is fragile and geological disasters, such as collapse, landslides, and debris flow, occur frequently [8]. Human engineering activities, such as flood irrigation and frequent excavation, have altered the inner structure and physical and mechanical properties of the loess, posing a serious challenge to the traditional geological cognition of the loess [9,10,11,12].
Fundamentally, loess has a metastable structure of loose porosity, developed columnar joints, and weak cementation [6,8,13,14,15,16], showing collapsibility [17,18,19], water sensitivity [20], and other special physical, mechanical, and hydraulic properties [20,21,22,23]. As a result, the loess develops a variety of voids from tens of meters to a few microns, including sinkholes, joints, hydro-chemical potential corrosion caves, large-scale decay root channels, soil animal channels, earthworms tunnels, ant holes, macropores, micro-fissures, etc. [8,24,25,26,27,28]. Consequently, voids facilitate the development of preferential flow (a kind of fast infiltration bypassing the soil matrix [29]) and significantly affect the infiltration path and spatial distribution of water in building foundations, the highway railway subgrade, and slopes in loess areas [30]. It makes engineering construction more difficult and leads to more frequent geological disasters [31,32].
Therefore, it is essential to study the structural parameters (such as the geometric shape, porosity, connectivity, tortuosity, and spatial distribution of different types of voids) of the loess preferential channels and the distribution of water in them to solve construction problems in the Yellow River Basin [33,34,35].
However, for a long time, it has been difficult to visualize the distribution of water in the soil [36]. With the rapid development and extensive application of X-ray CT, it is possible to study the internal structure [37,38] and the water distribution of the soil due to its non-destructive nature and its visual detection capabilities of the three-dimensional structures [39,40]. However, the difference between the attenuation coefficient of water and air in soil is so small that it is difficult to distinguish the three phases of water, air, and soil particles by CT scanning alone. Even with the latest CT scanning equipment and high resolution, it is difficult to accurately segment water, pores, and the solid matrix in soil, which has become a challenge in soil moisture research [41].
To overcome this difficulty, CT scan experiments were conducted for the infiltration of water in porous geotechnical materials by adding contrast agents, such as potassium iodide (KI), potassium bromide (KBr), cesium chloride (CsCl), medical meglumine diatrizoate, etc. [42]. The X-ray attenuation coefficients of different geotechnical components and water were compared, and it was found that the degree of recognition of each component can be greatly improved by adding a contrast agent [43]. Consequently, the undisturbed farmland soil [43,44,45], artificially filled sand [46], Ottawa sand [47,48], cement slurry [49], sandstone [50] and unsaturated compacted soil [39] were studied to quantitatively separate and distinguish solid soil, voids or air, organic matter, minerals, water, and so on, to further reveal the relationship between soil macropores and preferential flow.
The research in the previous paragraph focused mainly on the ‘static’ characteristic of water, pores, and other components. However, it is always necessary to learn the ‘dynamic’ changing characteristic of the structure, permeability, and mechanical properties of geotechnical materials [51]. Digital image correlation (DIC) combined with CT is a powerful tool [52] that has been used to dynamically observe the seepage [53], displacement [54,55], and strain fields [56,57,58] in soils [59] or rocks [60] before and after rain or irrigation, load [61], plant growth [62], and the other disturbances.
In summary, the addition of a contrast agent can effectively improve the identification ability when identifying various voids (such as macropores and fractures) or extracting different material components in humidification CT scanning experiments. Moreover, the application of DIC aids in learning the dynamic law of geotechnical properties. However, currently, there is no research report on the detection of the spatial distribution of preferential infiltration with special structural, fragile, water-sensitive loess-use contrast agents and CT (see Figure 1). Furthermore, the seepage evolution model with the dynamic preferential flow is not clear, thus obstructing the disclosure of the mechanism of landslides induced by the preferential flow.
There exists a gap in the literature on the study on the seepage evolution characteristics in undisturbed loess under dynamic preferential flow by integrating X-ray CT, contrast agent, and DIC technologies. Therefore, the purposes of this paper are to (1) capture the seepage and occurrence status of water in loess voids, (2) explain the variability characteristics of the loess pore structure, and (3) reveal the seepage evolution model of dynamic preferential flow. Accordingly, preferential infiltration experiments were conducted by combining non-destructive detection with X-ray computed tomography with contrast techniques under dynamic seepage conditions. The three-dimensional (3D) visualized reconstruction, image registration, processing, and quantitative analyses were handled in AVIZO software (Thermo Fisher Scientific Inc., Waltham, MA USA, version 2019.1), including two-dimensional (2D) and 3D characteristics of preferential flow distribution and macropore changing, dynamic variation of porosity, pore number, volume, dip angle, and connectivity. The new insights were derived and discussed, providing an important reference for future research on the loess slope instability induced by preferential flow.

2. Materials and Methods

2.1. Study Site and Sample Preparation

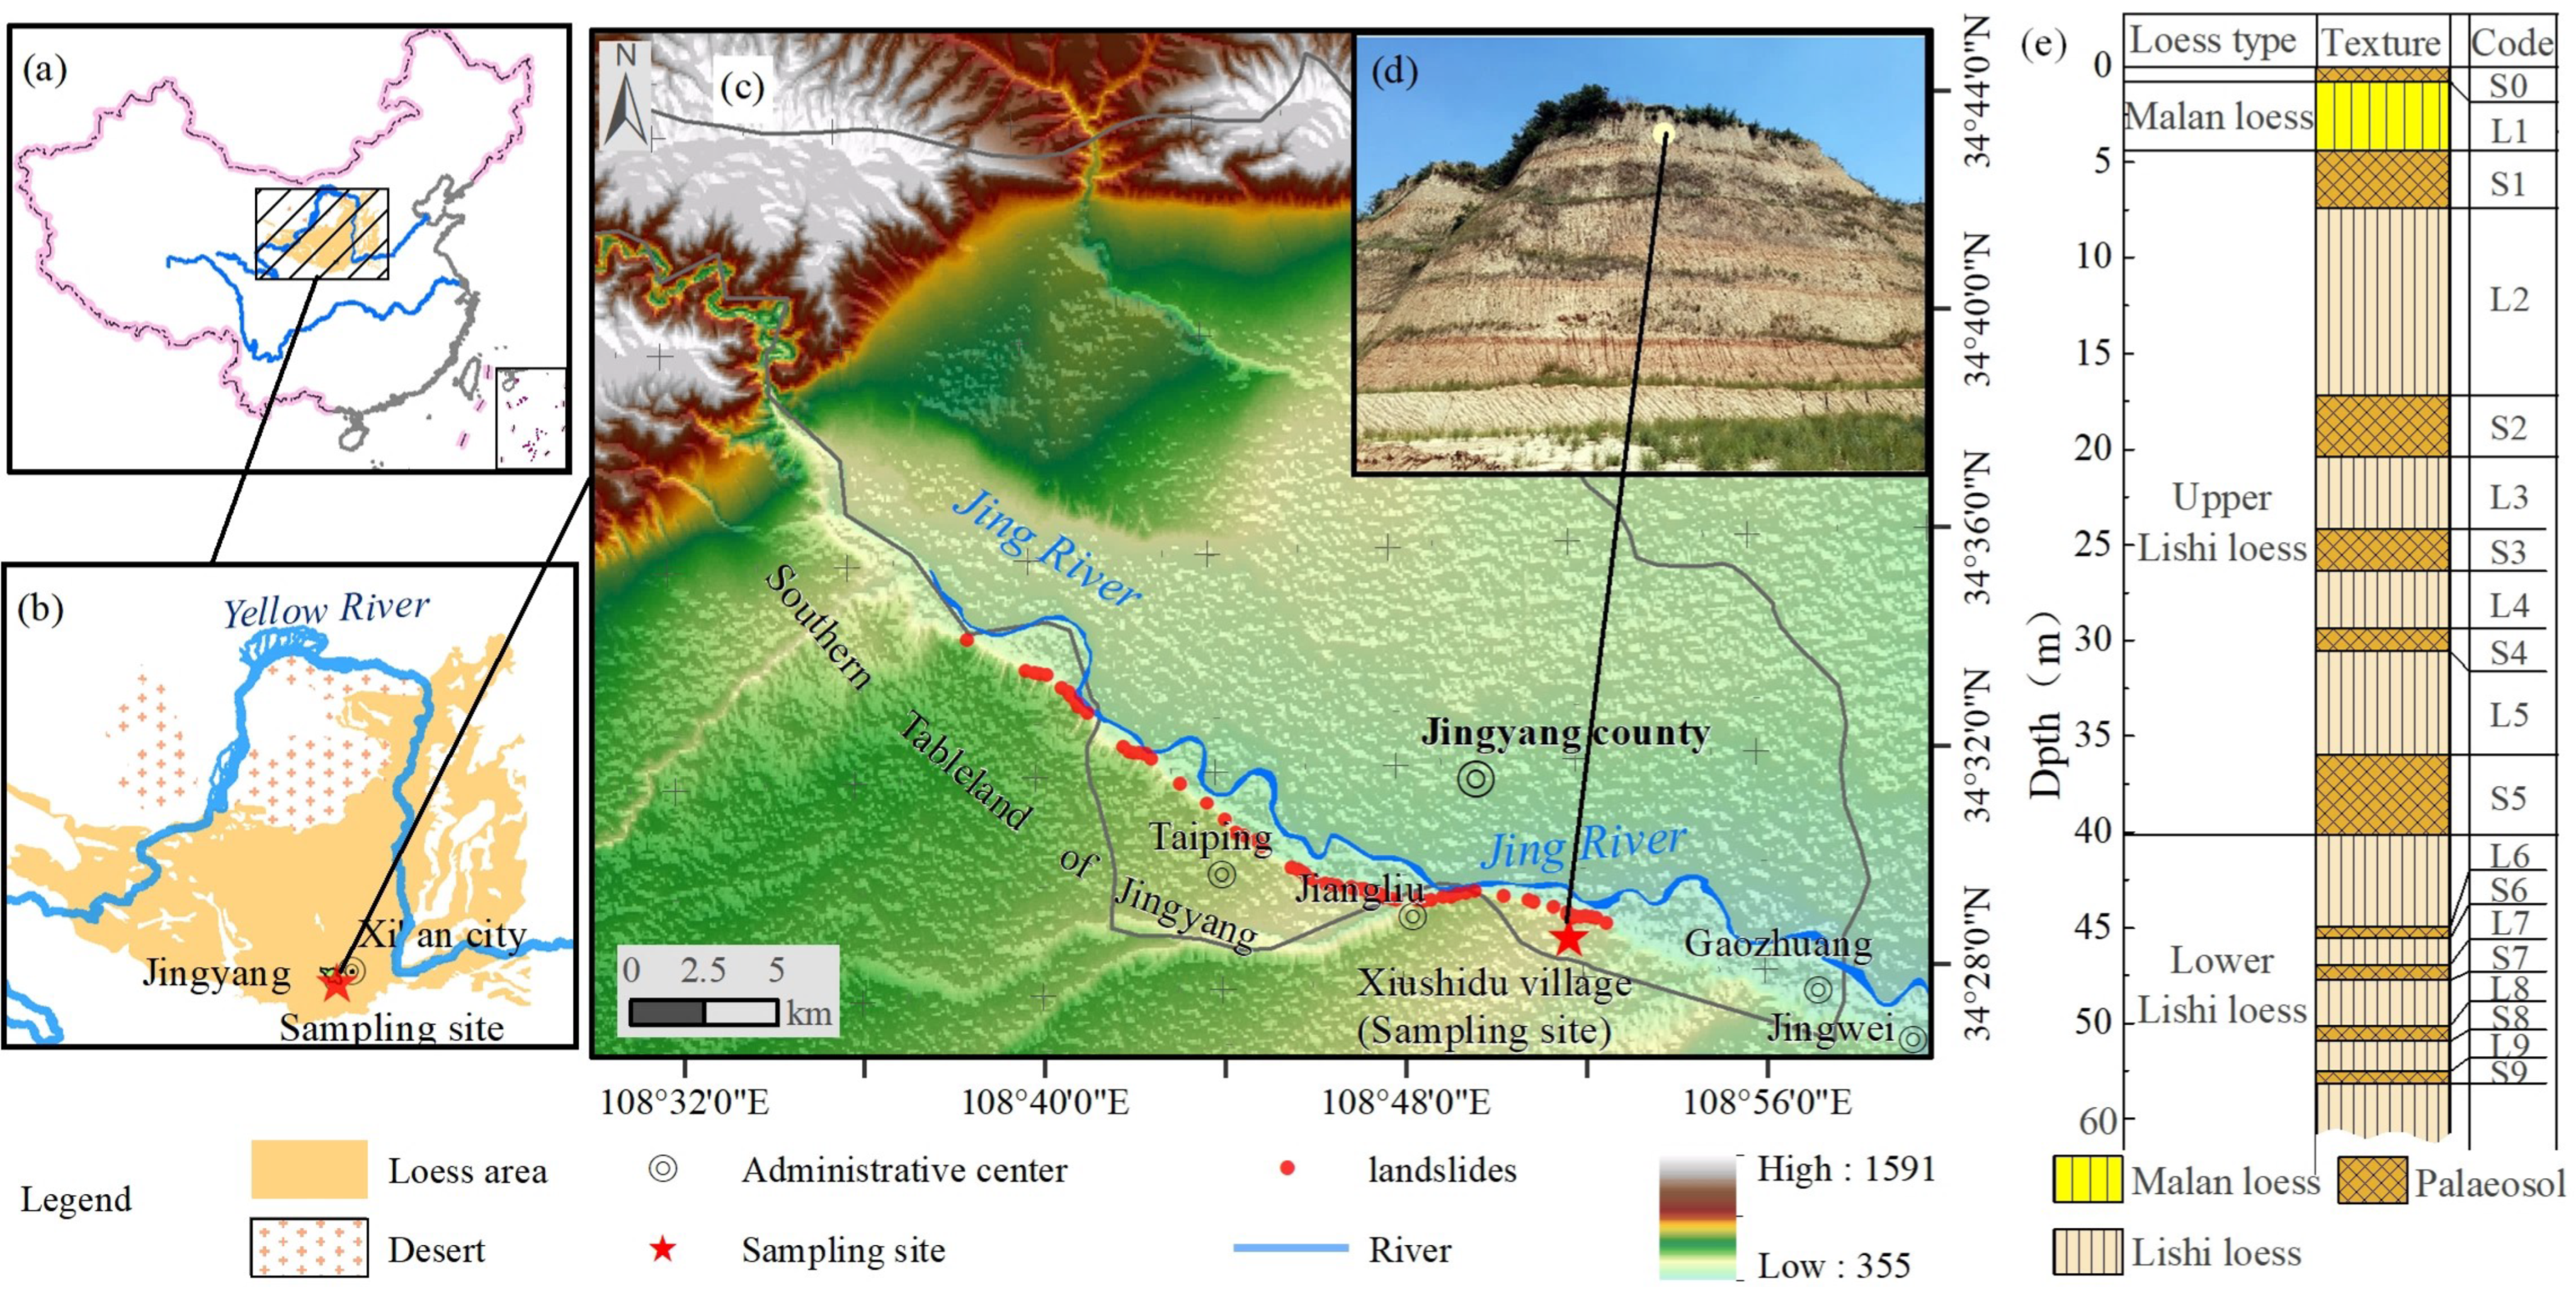
The study site is located in the Southern Jingyang Tableland (SJT) on the southern bank of the Jinghe River in Jingyang County, Shaanxi province (see Figure 2). The region covers an area of about 70 km2, which belongs to one part of the Northern Arid Plateau of the Weihe River basin [24]. The strata of the SJT include loess in the three geological ages of the middle Pleistocene ( Q 2 ), late Pleistocene ( Q 3 ), and Holocene ( Q 4 ) of the Quaternary, forming a loess–paleosol sequence that is alternately layered and laminated according to the order of the geological ages from the old to the new [63]. In terms of landforms, a cliff and ridge landform forms on the edge of the SJT due to the long-term retrogressive erosion of the first terrace and floodplain of the Jinghe River, which provides a gravity drive for the initiation of landslides [64]. In terms of geological structure, the fault structure of the SJT is very developed and is influenced by the movement of the Ordos block and the continental movement of the Qinling fold belt. In terms of human engineering activities, farmland irrigation, road construction, water and electricity pipeline laying, slope toe excavation, etc., have produced serious environmental geological problems, affecting the distribution of seepage fields and stress fields on the slope and increasing the risk of geological disasters. Particularly, flood irrigation in farmland raises the groundwater level of the loess slope [65,66], reduces the suction and shear strength of the matrix of the loess, and increases the effects of hydraulic erosion and hydro-chemical leaching and the dissolution effect, making the preferential channels, such as sinkholes, joints, and cracks, on the edge of the Tableland more developed and produce preferential flow to weaken the stability of the slope and even induce collapses or landslides [67,68].
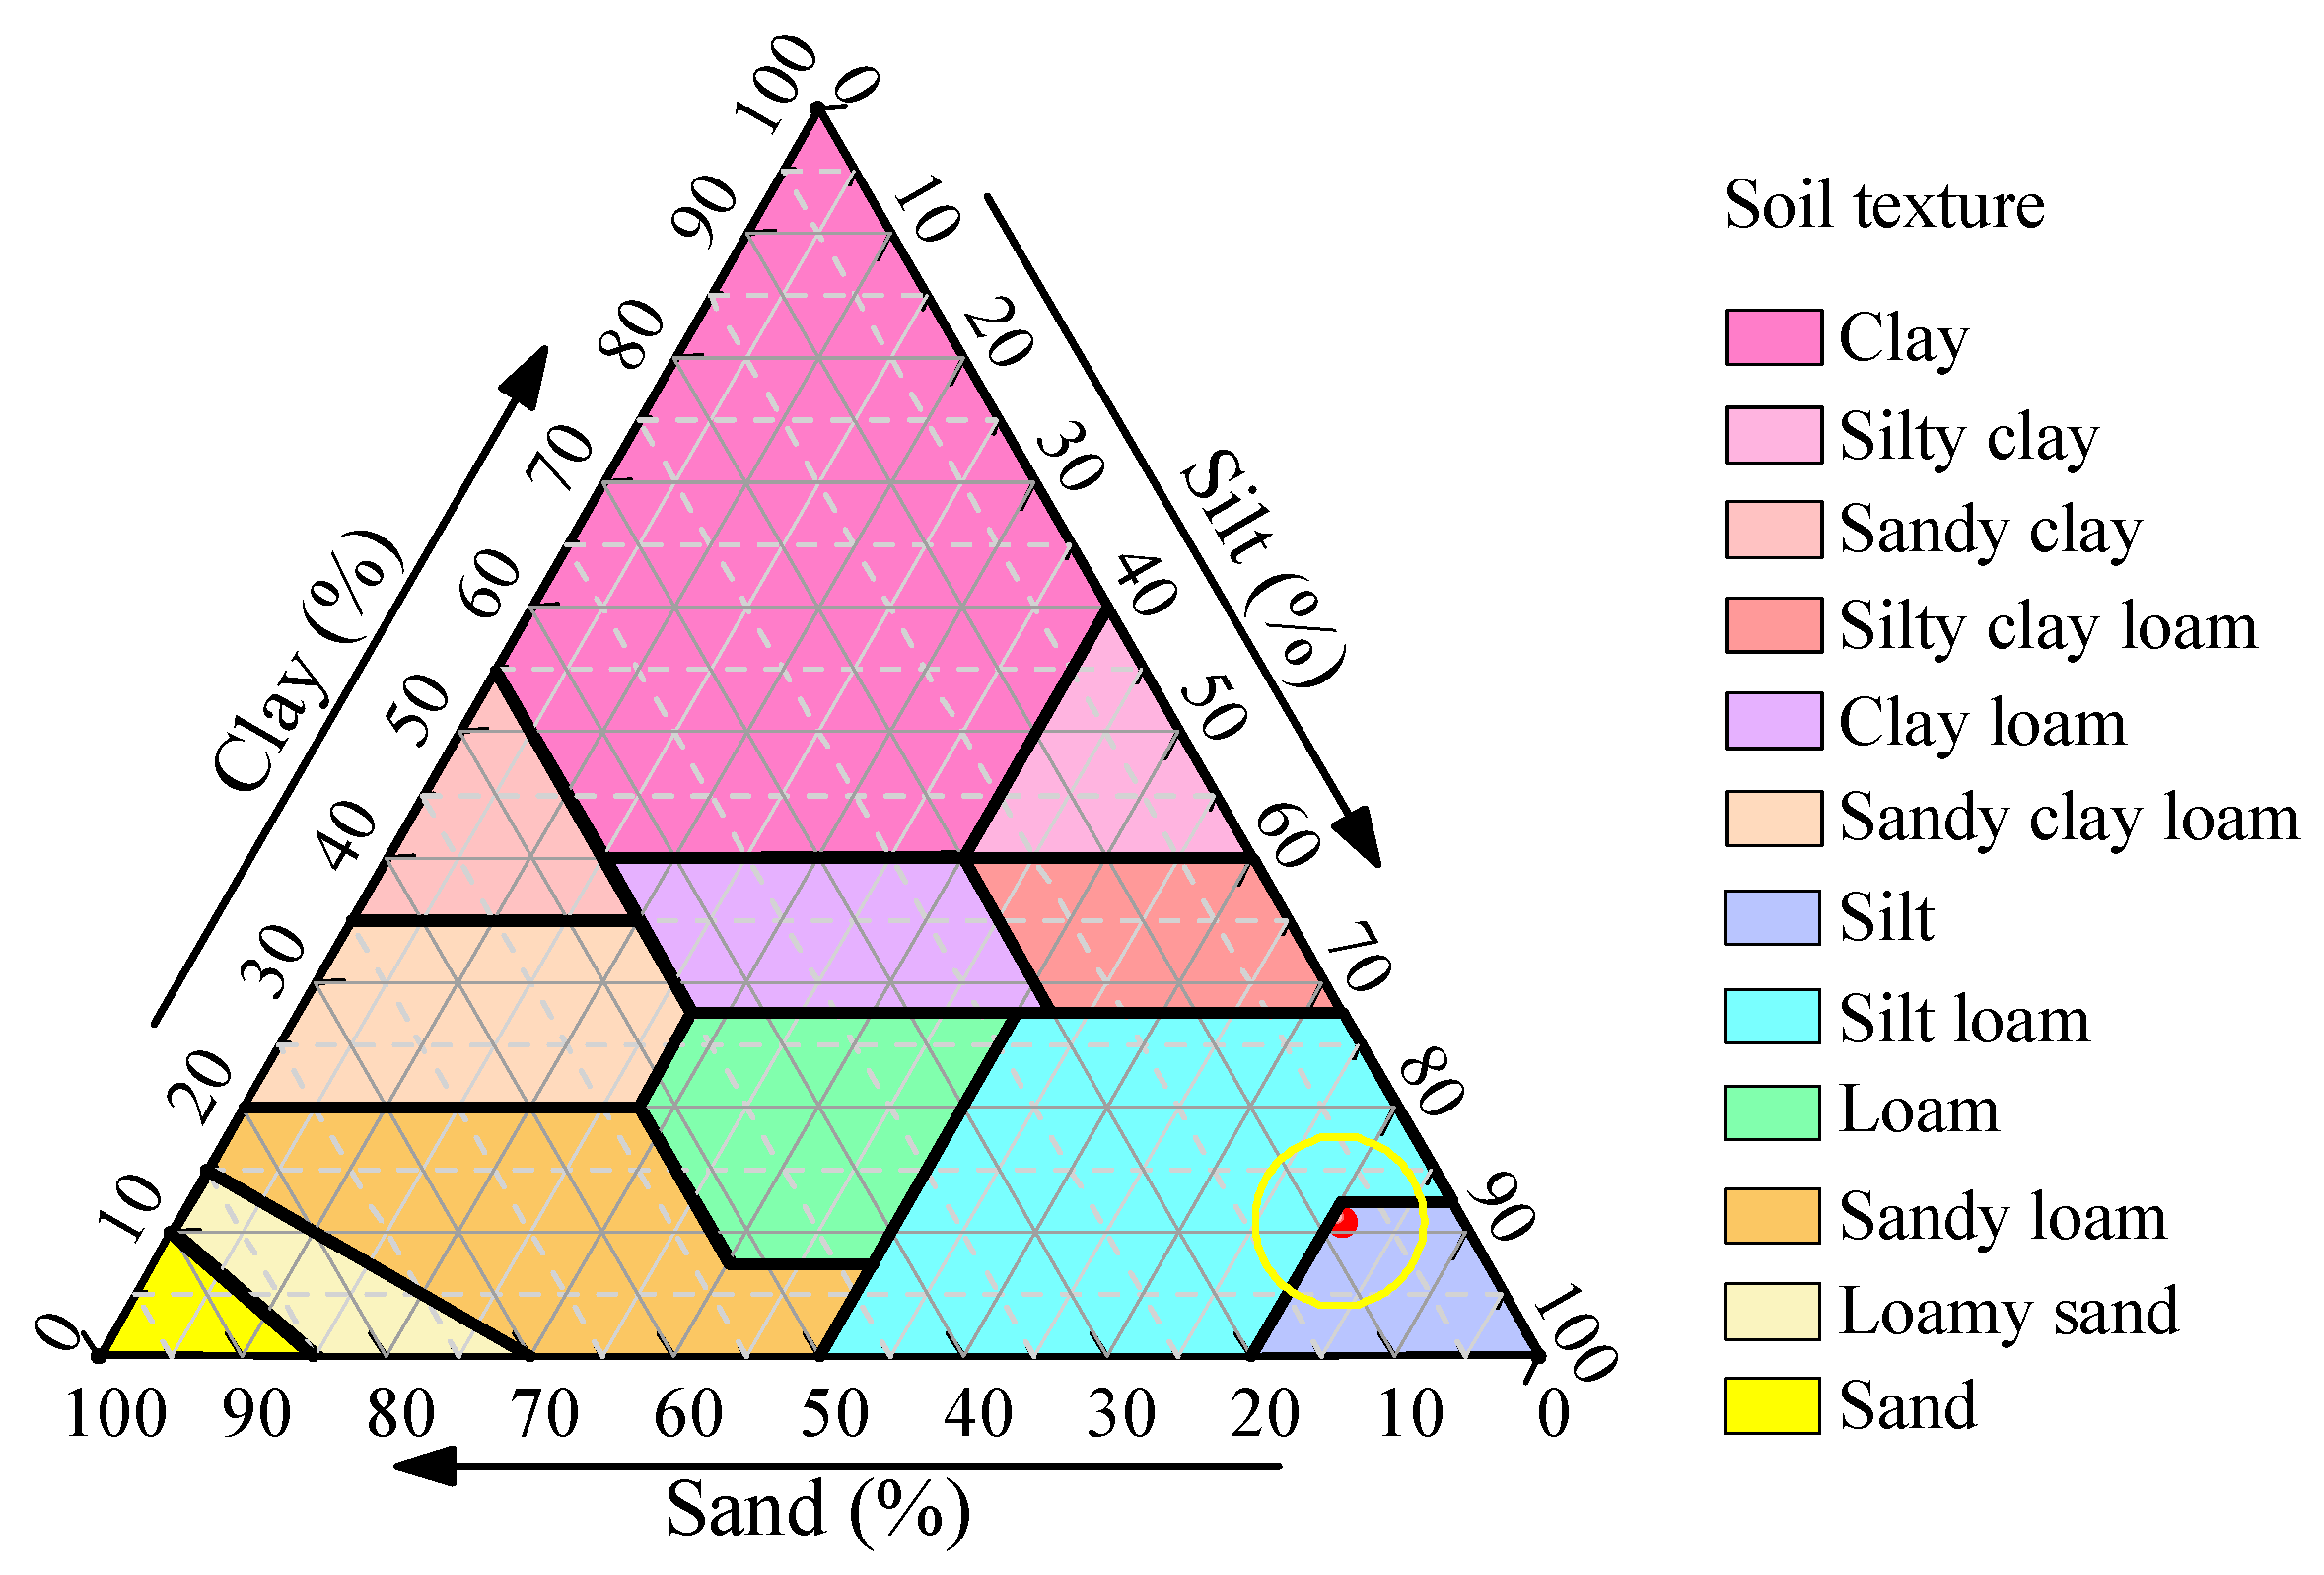
The sampling point is selected at an earth-fetching site in Xiushidu village, Gaozhuang Town, which is prone to geological disasters. It provides an ideal section to collect loess samples that reveal a complete and continuous loess–paleosol sequence of S0~S9 (see Figure 2e) [63]. In this paper, the intact samples were collected in the formations of Malan loess. To ensure that the samples remained as undisturbed as possible, some measures were taken, as described in the article by Li, et al. [24]. When collecting each intact sample, some cutting ring samples and loose soil samples were also collected at the same time to determine the basic physical and mechanical properties according to the standard for geotechnical testing method (GB/T 50123—2019) of China [69]. The particle size grading experiment (see Figure 3) was measured by Bettersize 2000 (Dandong Bettersize Instruments Ltd., Dandong, China). The type of soil was determined by the soil classification system of the US Department of Agriculture (USDA) (see Figure 4). The results of basic physical mechanics parameters, such as dry density, specific gravity, porosity, void ratio, etc., are shown in Table 1.

2.2. Apparatus for the Preferential Infiltration Experiment

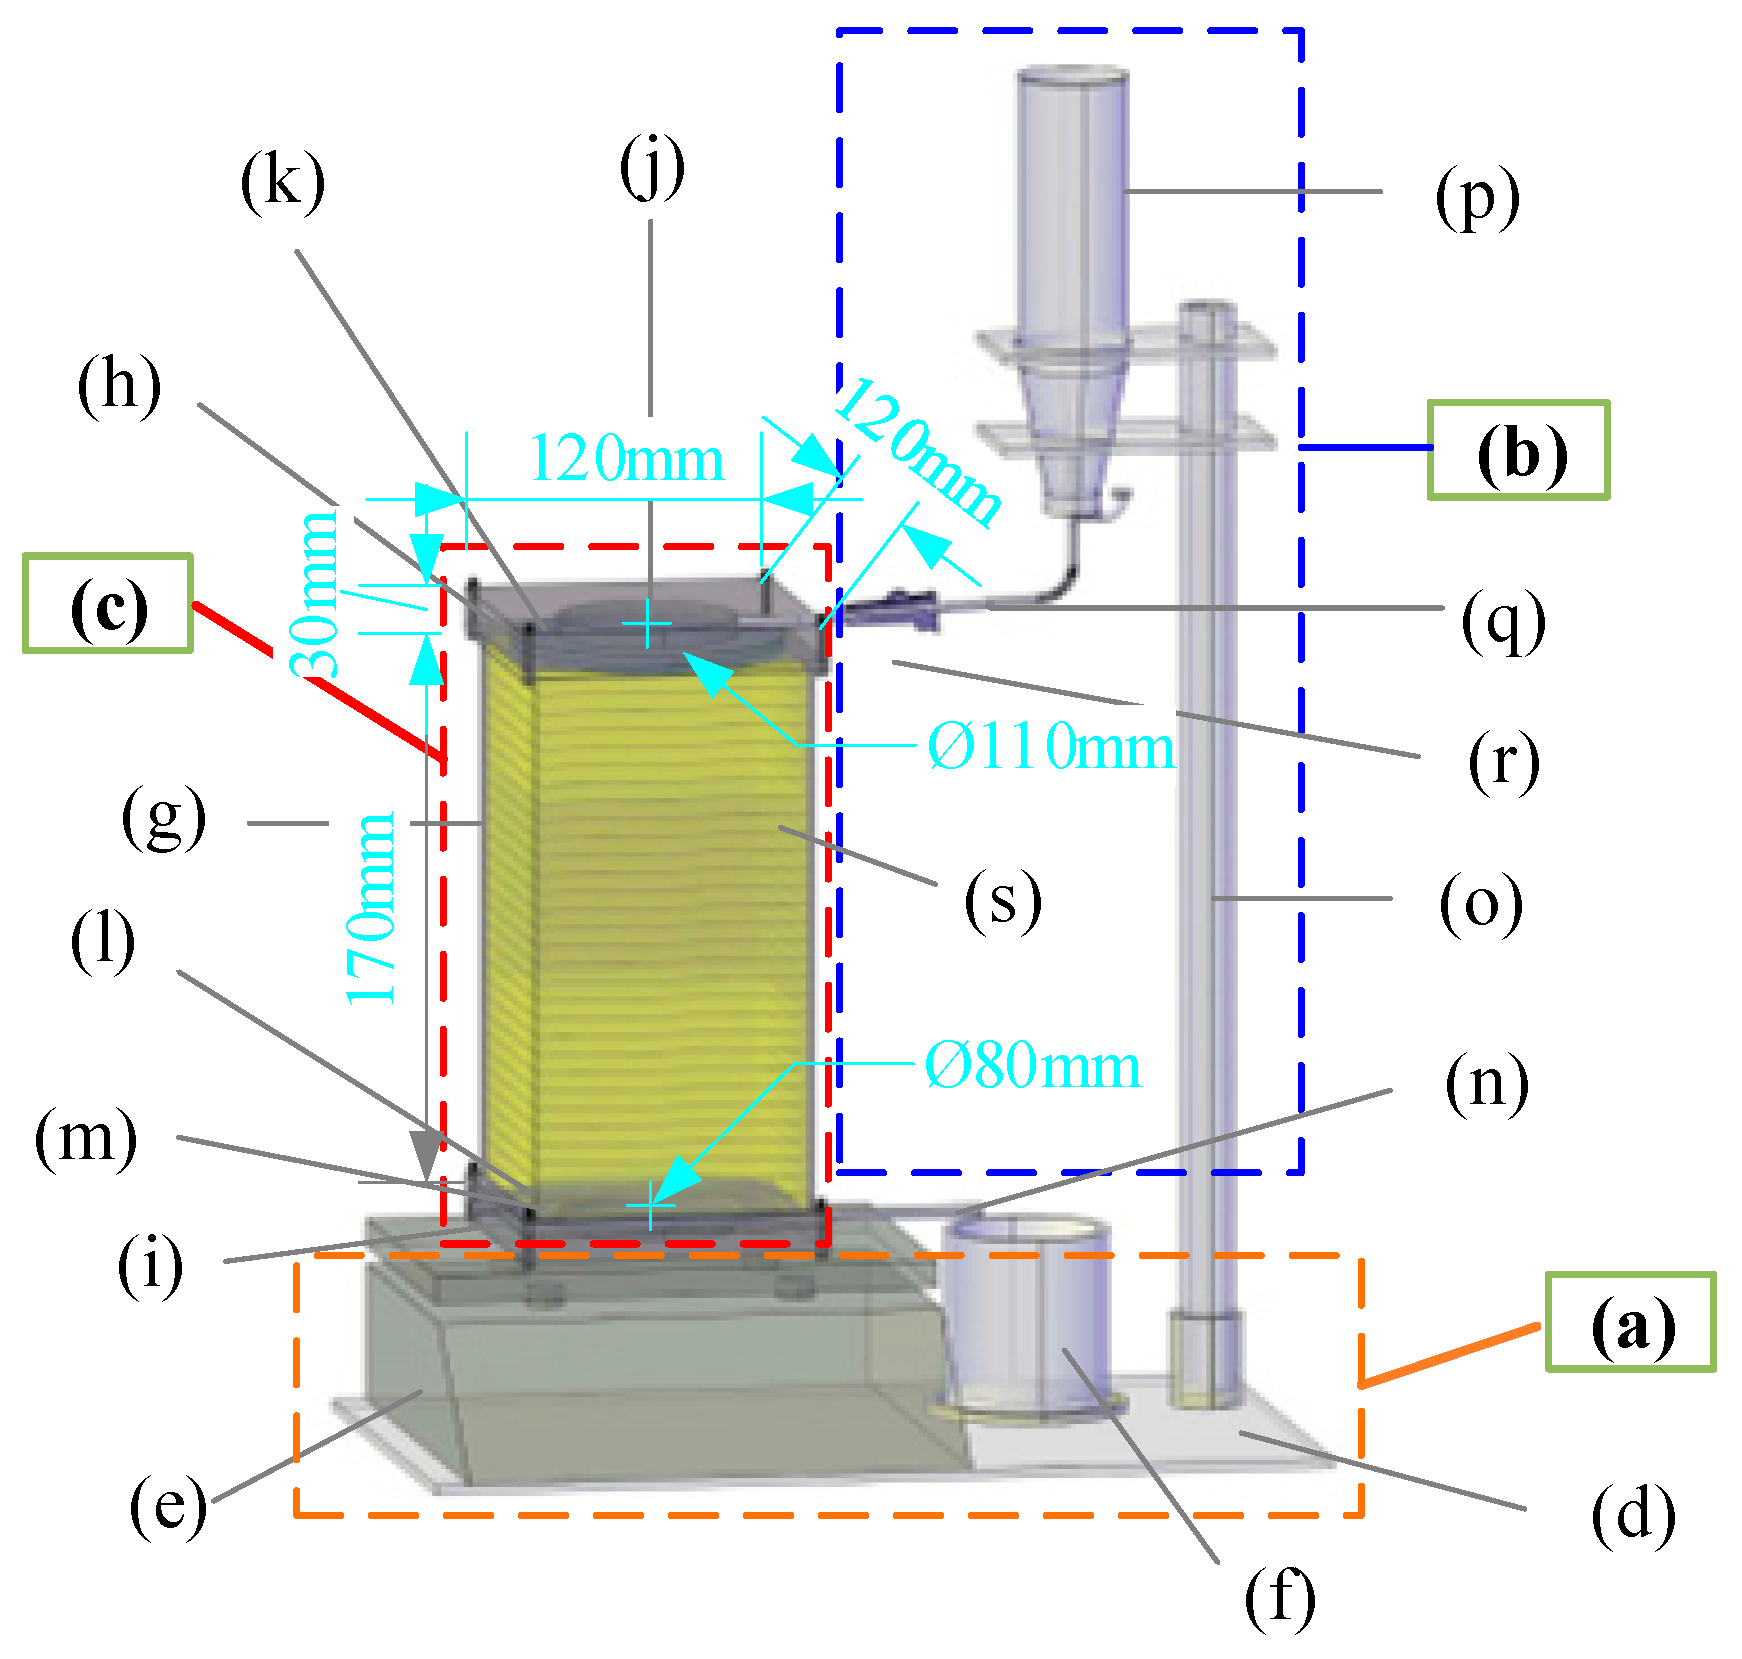
A set of apparatus (see Figure 5) for CT scan was designed to facilitate the dynamic monitoring of the preferential flow for the same loess sample. The apparatus consists of three parts, including a substrate (see Figure 5a), a visualized seepage device (see Figure 5b), and a continuous liquid supply device (see Figure 5c). In detail, the substrate includes a bottom plate (see Figure 5d), a real-time weighing balance (see Figure 5e), and a beaker (see Figure 5f) for liquid collection. The visualized seepage device, which is disposed on the real-time weighing balance, includes a seepage chamber (see Figure 5g) with the size of 120 mm × 120 mm × 170 mm, a top cover (see Figure 5h) and a bottom cover (see Figure 5i) with the size of 120 mm × 120 mm × 30 mm at the top and bottom of the seepage chamber. Among them, an inlet water storage area with the size of φ80 mm × 10 mm (see Figure 5j) is arranged in the top cover, and a permeable stone with the size of φ110 mm × 10 mm (see Figure 5k) is fixed in the inlet water storage area. An outlet water storage area with the size of φ80 mm×10 mm (see Figure 5l) is arranged in the bottom cover, and a permeable stone with the size of φ110 mm × 10 mm (see Figure 5m) is fixed in the outlet water storage area. Additionally, a drainage pipe with an inner diameter of φ5 mm (see Figure 5n) is placed on the bottom cover of the seepage to transport water to the liquid collection beaker. The liquid supply device, which is placed on the bottom plate, includes a support rod (see Figure 5o) and a liquid bottle (see Figure 5p). There is a hose (see Figure 5q) inserted into the liquid bottle and put on the tube punch into the top seepage cover that connects the liquid supply device to the visualized seepage device. A flow meter (see Figure 5r) is installed on the hose to quantitatively control the flow rate injected into the soil sample (see Figure 5s).
Using the aforementioned apparatus, the dynamic process of preferential flow infiltration can be observed for the same loess sample from the original dry state to the later wetting stages via an enhanced CT scan.

2.3. Preferential Infiltration Experiment

To acquire the water distribution of preferential flow and make a comparison of the structure under dry and wet conditions in the same soil by CT scanning experiment, some necessary steps were conducted. The flow chart is shown in Figure 6.
Step 1: preparation of the columnar sample
A columnar sample was processed from an undisturbed loess block collected from the sampling site. Two square grooves were machined in the top and bottom of the columnar sample, respectively. Of these, the top groove is used to collect the liquid from the permeable stone and the bottom groove is used to block the capillary rise phenomenon caused by the contact between the bottom of the loess sample and the liquid during the scanning process. Cautiously, the Loess dust on the surface of the processed columnar sample was blown off.
Step 2: brush glue for the columnar sample
A ready-made AB glue was brushed on the areas outside the circular groove of the columnar sample to ensure that the liquid completely penetrates the soil sample without flowing out. AB glue is composed of epoxy resin (glue A) and polyamide resin (glue B) that mixed in a 1:1 volume ratio, with a brushing time less than 30 min to prevent the AB glue from becoming viscous or even solidified.
Step 3: industrial CT scan experiment for the dry sample
The dried loess sample was scanned by industrial X-ray CT (YXLON Y.CT, Modula, Germany) to accurately obtain the 3D inner structure at the Engineering Research Center of Transportation Materials of the Ministry of Education, Chang’an University, Xi’an, PR China. The working principle is referred to in the book by Carmignato et al. [37]. The methodologies of 3D visualized reconstruction and the acquisition of structural parameters refer to Li et al. [24].
Step 4: preferential infiltration experiment
Before conducting the preferential infiltration, the experiment using the apparatus introduced in Section 2.2, some preliminary steps were performed. The dry sample that had been scanned with CT was placed in the seepage chamber, with the liquid-supplying device remaining closed. The liquid supply bottle was filled with potassium iodide (KI) contrast agent solution, which can enhance and highlight the flow trace [39], with a concentration of 60 g/L and set the real-time weigh balance in automatic continuous reading mode with the reading frequency set to 10 times per second.
Step 5: industrial CT scan experiment for wet samples
The real-time weighing balance and the continuous liquid supply device are opened; thus, the liquid bottle begins to transport potassium iodide solution into the seepage chamber and, at the same time, begins CT scanning and obtains the corresponding structural parameters by using AVIZO for comparison among the original dry sample and wet sample in the subsequent wetting process.
Step 6: comparison analyses between dry and wet state
A comparison of the quantitative structural parameters of the loess sample obtained by Step 3 and Step 5 was performed to explore the evolution law of the loess structure under humidification activity.

2.4. 3D Image Registration

To find the law of change of the loess structure in the process of gradual humidification, fine contrasts of the structure under wet and dry conditions should be conducted. Because the position will inevitably change during each time a CT scan is performed for the loess specimen from dry to wet during the humidification process, the series data acquired by each scanning of the same specimen in different wetting stages may not overlap well (see Figure 7). In this paper, to analyze the structural changes and the water distribution in loess under preferential flow between wet and dry samples, the wet CT images after humidification were registered with the original dry image by adopting the technique developed by Latham et al. [70] with the Register image module in AVIZO.
The Register image module uses an iterative optimization algorithm to calculate the affine transformation relationship for the common registration of two image data sets, which belongs to digital image correlation (DIC) technology. DIC technology has been widely used in the study of micro-deformation fields and displacement fields. It can track the coordinates between the deformed body and the reference point, detect the position difference between the deformation data set and the reference data, and achieve the purpose of a quantitative study of local pores, changes in particle structure, mechanical analysis, and numerical simulation under various loads and percolation [55,71].
The specific steps for the image registration are as follows: Firstly, use the Transform Editor tool to manually translate, rotate, and scale the wet CT data so that it generally overlaps with the reference data (that is, the originally dry CT data) as much as possible under the visual resolution of the naked eye. Secondly, employ Align centers with coarse layered resampling algorithms in the Register images module to perform alignment corrections in both vertical and horizontal directions. Finally, apply Align principal axes with perform pixel by pixel resampling algorithms in Register images to conduct the final precise correction. Fine resampling is carried out employing a refined iterative that is based on the normalized mutual information measure, Euclidean distance, mark difference, correlation, and other measurement rules to calculate the center of gravity and moment of inertia of the two data (that is, the wet and dry CT data). Through the fine correction, it achieves the best alignment with the undistorted part of the data to the maximum extent possible and ensures the accuracy of subsequent comparative analysis. The comparison of 2D slice data in different planes before and after image registration is shown in Figure 8.

2.5. Data Processing and Analysis

For quantitative analysis of the 2D characteristics of the preferential flow, the two-dimensional slice preferential flow distribution maps were classified by the image supervision classification method in ArcGIS 10.6 (Esri Inc., Redlands, CA, USA), and furthermore, the area change of the preferential flow and voids were calculated. Preferential flow distribution and infiltration characteristics in a 3D space were acquired by AVIZO. All statistics were performed using Excel 2019 (Microsoft Corp, Redmond, WA, USA). The diagram and graph were drawn and processed by Origin 2016 (OriginLab Corp, Northampton, MA, USA) and Visio 2019 (Microsoft Corp, Redmond, WA, USA).

3. Results and Analyses

3.1. Infiltration Characteristics under Dynamic Seepage Conditions

The 3D spatial correction of the CT scan data of the same sample before and after humidification provides the basis for the comparative analysis of the same specimen during the water seepage process. As a result, the spatial distribution of preferential flow in loess macropores can be obtained by segmenting and extracting the pores, liquid, and soil matrix of CT data under dry and wet conditions.
Here, we take CT scanning results of the first two stages of loess samples under seepage conditions to explain the basic distribution characteristics of preferential flow in loess in two and three dimensions.

3.1.1. Two-Dimensional Preferential Flow Characteristics

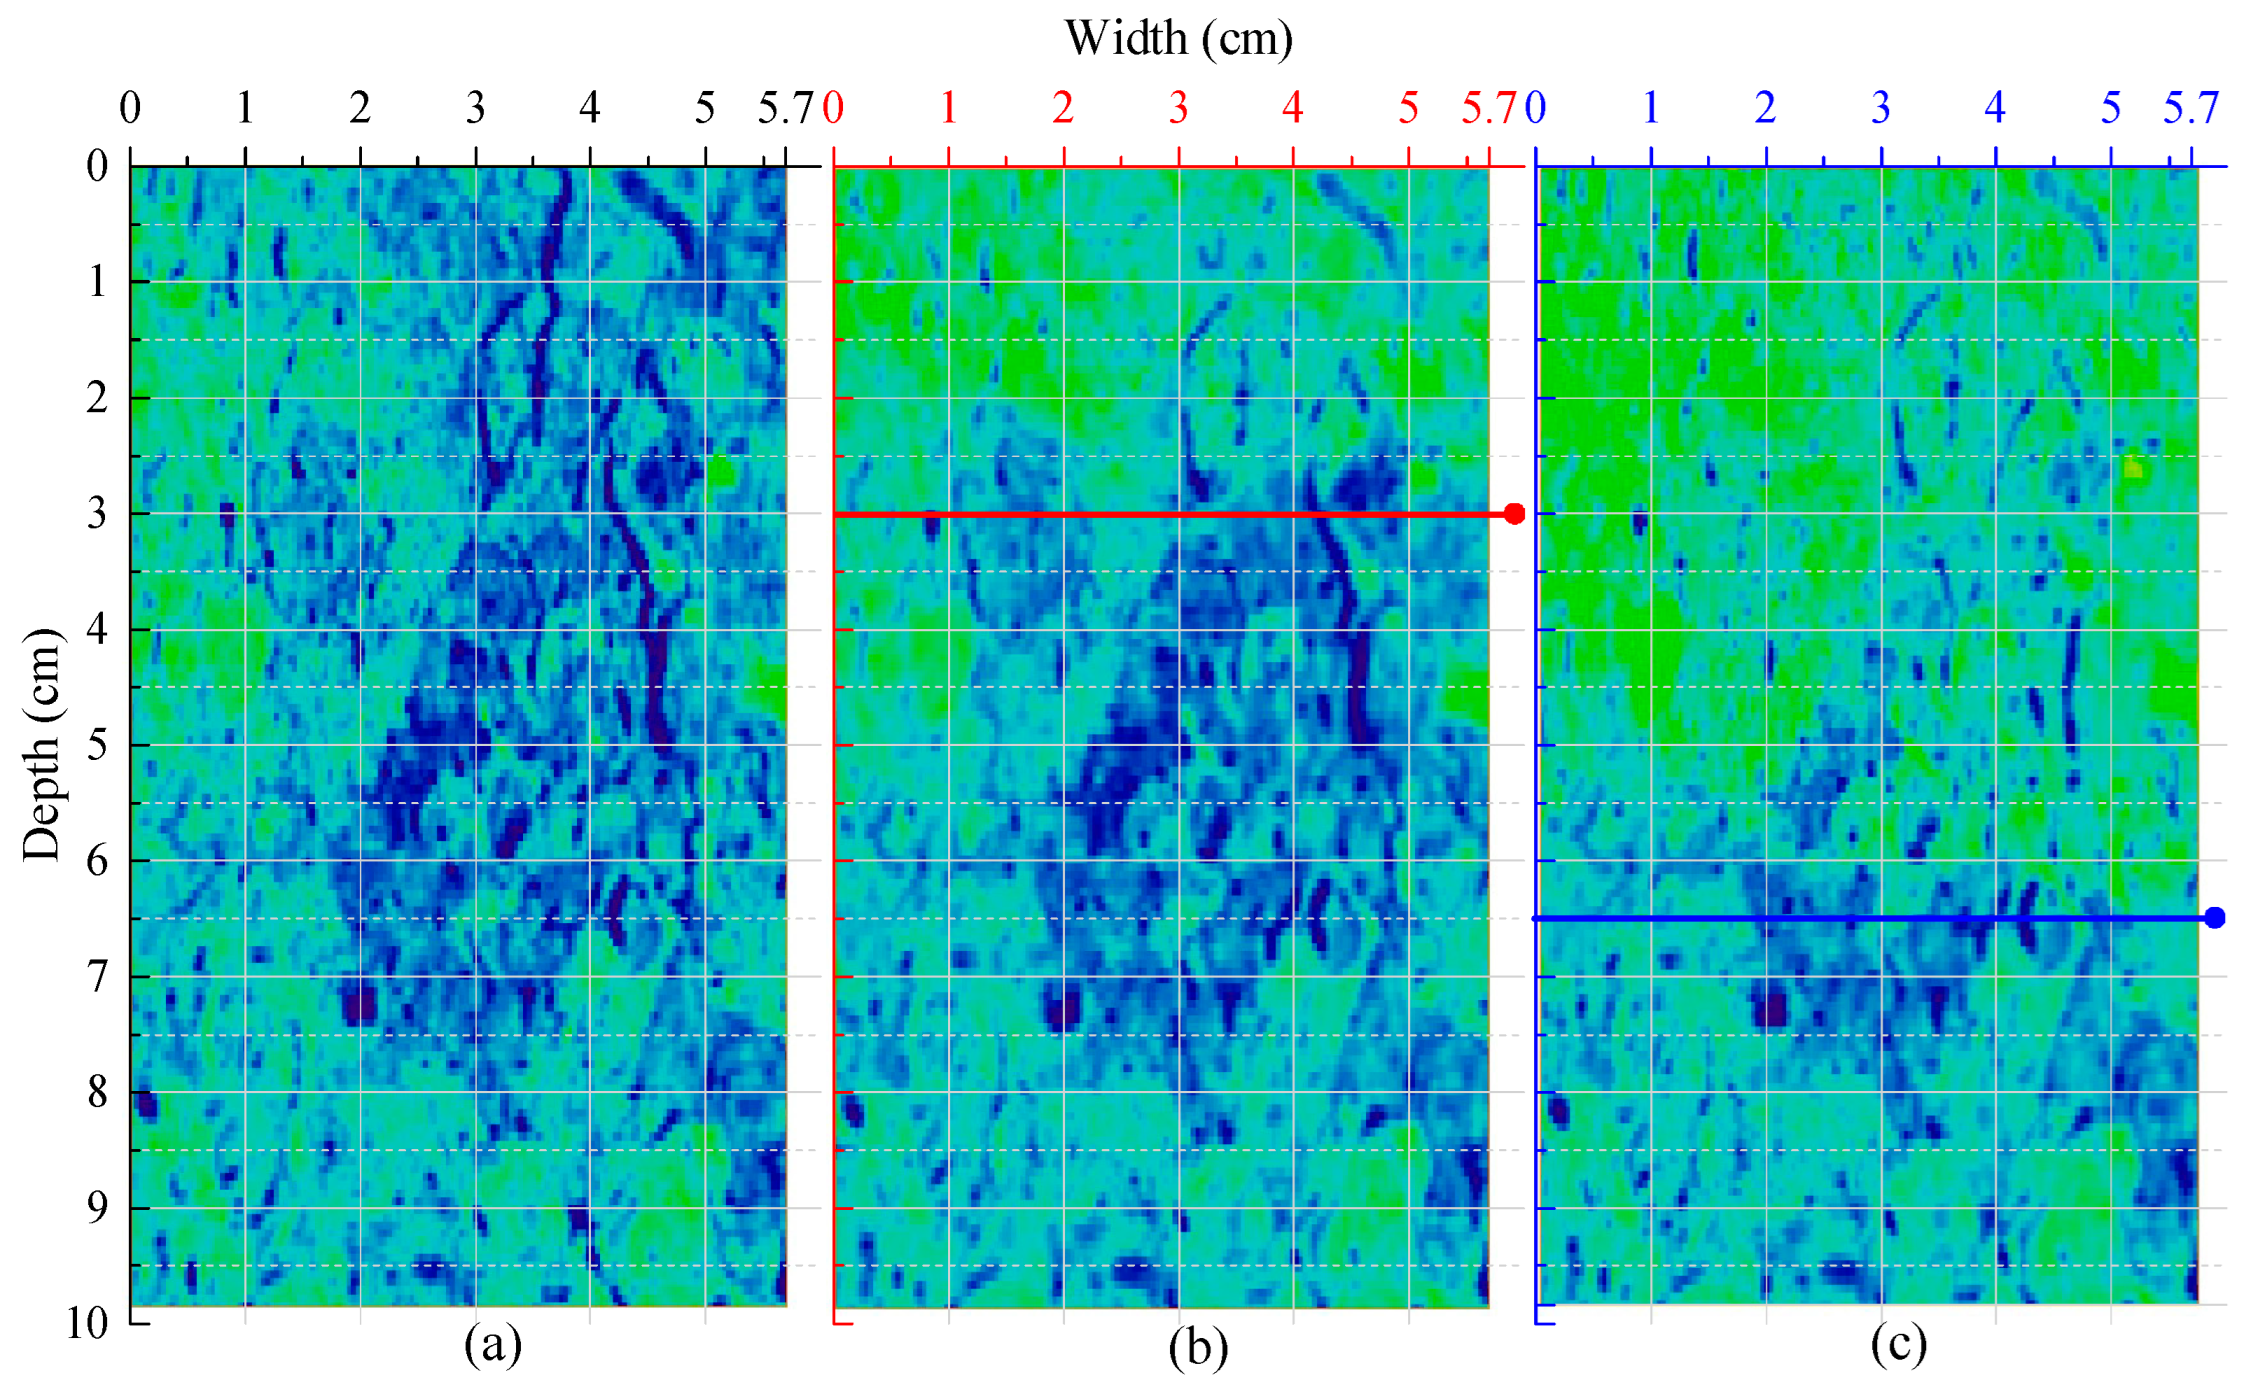
Figure 9 takes slice 71 on the YZ plane as an example to show the two-dimensional preferential flow distribution of the original dry state, the first and the second infiltration activities in the infiltration process in loess. It is shown in Figure 9a that large macropores developed in the original dry loess sample, which create the pathways for the production of preferential flow when it infiltrates, thus providing detailed evidence of the existence of preferential in loess [72].
Compared to Figure 9a, it can be seen from Figure 9b that the green highlight portion of the YZ section gradually increases. At the same time, some of the large-size macropore channels are filled with a contrast agent solution; however, there are still some pores without liquid penetration. This indicates that not all macropores contribute to infiltration, which is consistent with the view in [73]. In the earlier seepage stage, the contrast agent only preferentially percolates along the connected macropores, whereas the isolated macropores do not conduct water. In general, the green high-brightness staining region is unevenly distributed, which shows that the whole seepage process is not a uniform infiltration with piston flow, but rather is a preferential infiltration with non-equilibrium macropore flow and finger flow [74]. Some researchers believe that preferential flow exists only in saturated loess [75]. However, in this paper, the result proves that preferential flow also develops in unsaturated loess.
To perform a quantitative analysis, the image-supervised classification of Figure 9a–c was performed, and the wet rid and distribution area of the contrast agent were calculated in ArcGIS 10.6. Comparing Figure 9a and Figure 9b, it can be observed that, after the first seepage, the contrast agent distribution area increased by 25.34 cm2, and the wet rid is presented as a finger-like distribution with a maximum depth of 3 cm. The stain areas are unevenly distributed with scattered patches locally and have poor connectivity overall. When comparing Figure 9b and Figure 9c, it can be seen that after the second seepage, the contrast agent distribution area has increased by 14.57 cm2 and the maximum wet rid is approximately 6.5 cm based on the first seepage. It shows that although the green highlight staining area has expanded further and more large pores were filled with the contrast agent, there were still some pores without liquid infiltration.
Figure 9b,c give the characteristics of the preferential flow that the percolation staining areas in the two-dimensional plane distribute with irregular patches locally and dispersedly distributed with poor connectivity in general. The 2D phenomenon indicates that the contrast agent solution seeps along the complex macropore network with the preferential flow in the three-dimensional space. Therefore, it is essential to perform a 3D analysis for the preferential flow.

3.1.2. Three-Dimensional Preferential Flow Characteristics

Some understanding of the distribution characteristics of preferential flow in the two-dimensional plane has already been obtained. However, it is difficult to reflect the actual water distribution in a real 3D space. To this end, we extracted some three-dimensional distribution maps to reveal the dynamic change laws during the seepage process (see Figure 10). In the 3D perspective, the macropores can be accurately presented with spatial distribution and connect manners.
Figure 10 shows the distribution of the preferential flow after the first and second seepage in a 3D view. Figure 10a–c represent the macropores, preferential flow, and the superimposition of pores and flow after the first seepage, respectively, while Figure 10d–f represent those after the second seepage.
Comparing Figure 9b and Figure 10b, Figure 9b shows that the wet rid depth in the 2D slice after the first seepage is only 3 cm from the top, whereas Figure 10b shows that in the 3D space, the maximum wet rid depth is larger than that in the 2D space. The volume of the 3D preferential flow is 3.75 × 104 mm3 after the first seepage. In the same way, compared to Figure 9c and Figure 10e, Figure 9c shows that the wet rid depth in the 2D slice after the second seepage is only 6.5 cm from the top, whereas Figure 10e shows that in the 3D space, the maximum wet rid reaches the bottom of the loess specimen. The volume of the 3D preferential flow is 4.74 × 104 mm3 after the first seepage.
The reason for the above phenomenon is that the macropore network is complex in 3D space, resulting in strong space heterogeneity and showing greater depth in 3D space than in the 2D slice. This indicates that the preferential flow is controlled by the distribution of the 3D macropore network, which presents the characteristics of spatial non-balance and anisotropy. According to Cristiano et al. [74], the anisotropy of preferential flow has a significant impact on the stability of slopes.

3.1.3. Characteristics of 3D Macropores

In the whole seepage process, the soil matrix interacts with the preferential flow [76]. As a result, on the one hand, the soil skeleton would be damaged when the water flows through, while on the other hand, it causes changes in the macropores.
Figure 10a–c show the results of macropores, water, and the superposition of the two in the sample, respectively, after the first seepage. Figure 10d–f show the results of macropores, water, and the superposition of the two in the sample, respectively, after the second seepage.
Some typical parts were selected to analyze the change law of the macropores. Comparing Figure 10a and Figure 10d, the changes in the red circle part in the two seepage processes are very significant. The comparison shows that there is a large lamellar pore in the extracted void after the first seepage in Figure 10a; however, the lamellar pores disappeared in Figure 10d. Similarly, comparing Figure 10b and Figure 10e, in the red circle part, the contrast agent space increased by invading and replacing the lamellar pores in Figure 10a.
Comparing Figure 10e and Figure 10b, in the black circle part, the space of the contrast agent increased further. It can be inferred that under the increasing water pressure, some previously isolated or dead pores were broken through by invading percolation, resulting in a larger contrast agent group [77].
Comparing Figure 10e and Figure 10b, in the green circle part, when the preferential wetting front continues to travel to further increase the water pressure, parts of the pores were flushed and merged, allowing the pore channel to expand. Comparing Figure 10d and Figure 10a, in the green circle part, some pores become thinner after the second seepage, and the reduced pores were occupied by the contrast agent.

3.2. Quantitative Characteristics of Pore Structure Change in the Seepage Process

The contents of Section 3.1 showed that the seepage process is complex with strong anisotropy and non-uniform preferential flow, as well as structural variability of the loess voids. The evolution of the seepage model is fundamentally determined by the change in the loess structures. Yu et al. [6], Wei et al. [7,15] and Li et al. [24] have conducted a detailed quantification of the loess structure by acquiring 2D and 3D parameters, such as porosity, equal diameter, aspect ratio, shape factor (SF), coordinate number, dip angle, dip direction angle, tortuosity, etc. In this paper, the authors selected porosity, pore number and volume, dip angle, and connectivity of the loess voids to reflect the change in pore structure in the seepage process.

3.2.1. Porosity

Porosity represents the volume fraction between the voids and the total sample, and is an effective index to reflect the change in the loess skeleton [24,44]. Table 2 shows the descriptive statistical results of the changes in porosity during the preferential infiltration process. In Table 2, the marks with D0 and W1~W5 represent the initial dry state and the wet state from the first to the fifth seepage, respectively.
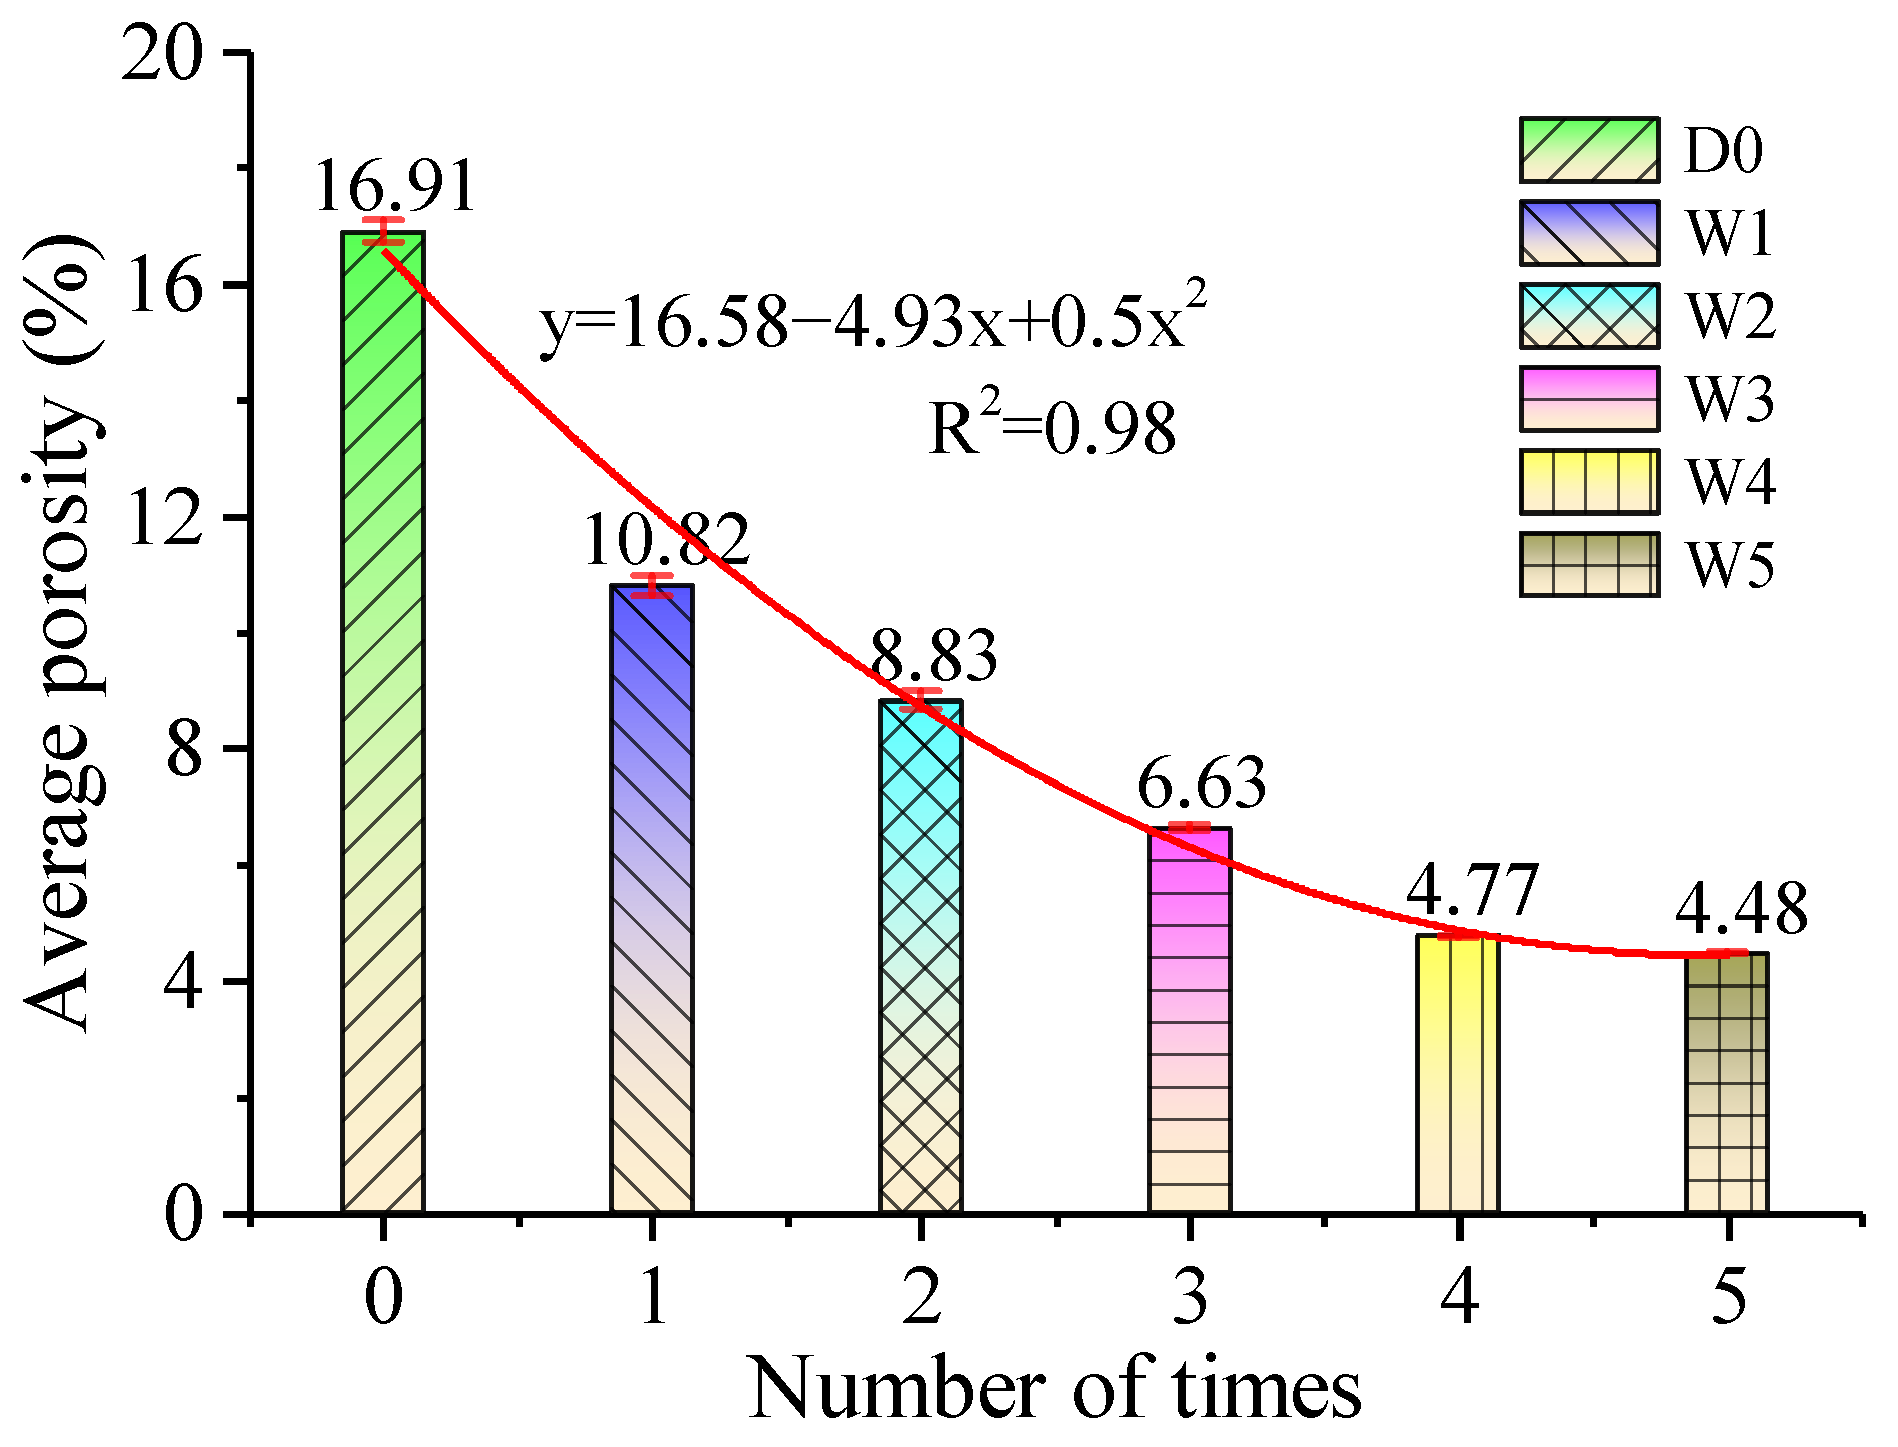
Based on Table 2, containing column diagrams of the average porosity variation, the relative and absolute change rate under dynamic seepage conditions were plotted and shown in Figure 11 and Figure 12, respectively.
As can be seen in Figure 11, the average porosity gradually decreases with increasing seepage times and decreases quantitatively from 16.91% to 4.48%. By fitting the average porosity value of the soil sample after each seepage, an equation was derived that is y = 16.58 − 4.93x + 0.5x2, R2 = 0.98, which is following the law of quadratic polynomial variation. As can be seen in Figure 12, porosity decreases significantly during the initial seepage stage with a reduction rate of 36.01% and decreases slower as the seepage continues with a rate of 6.08% in the last seepage.

3.2.2. Pore Number and Volume

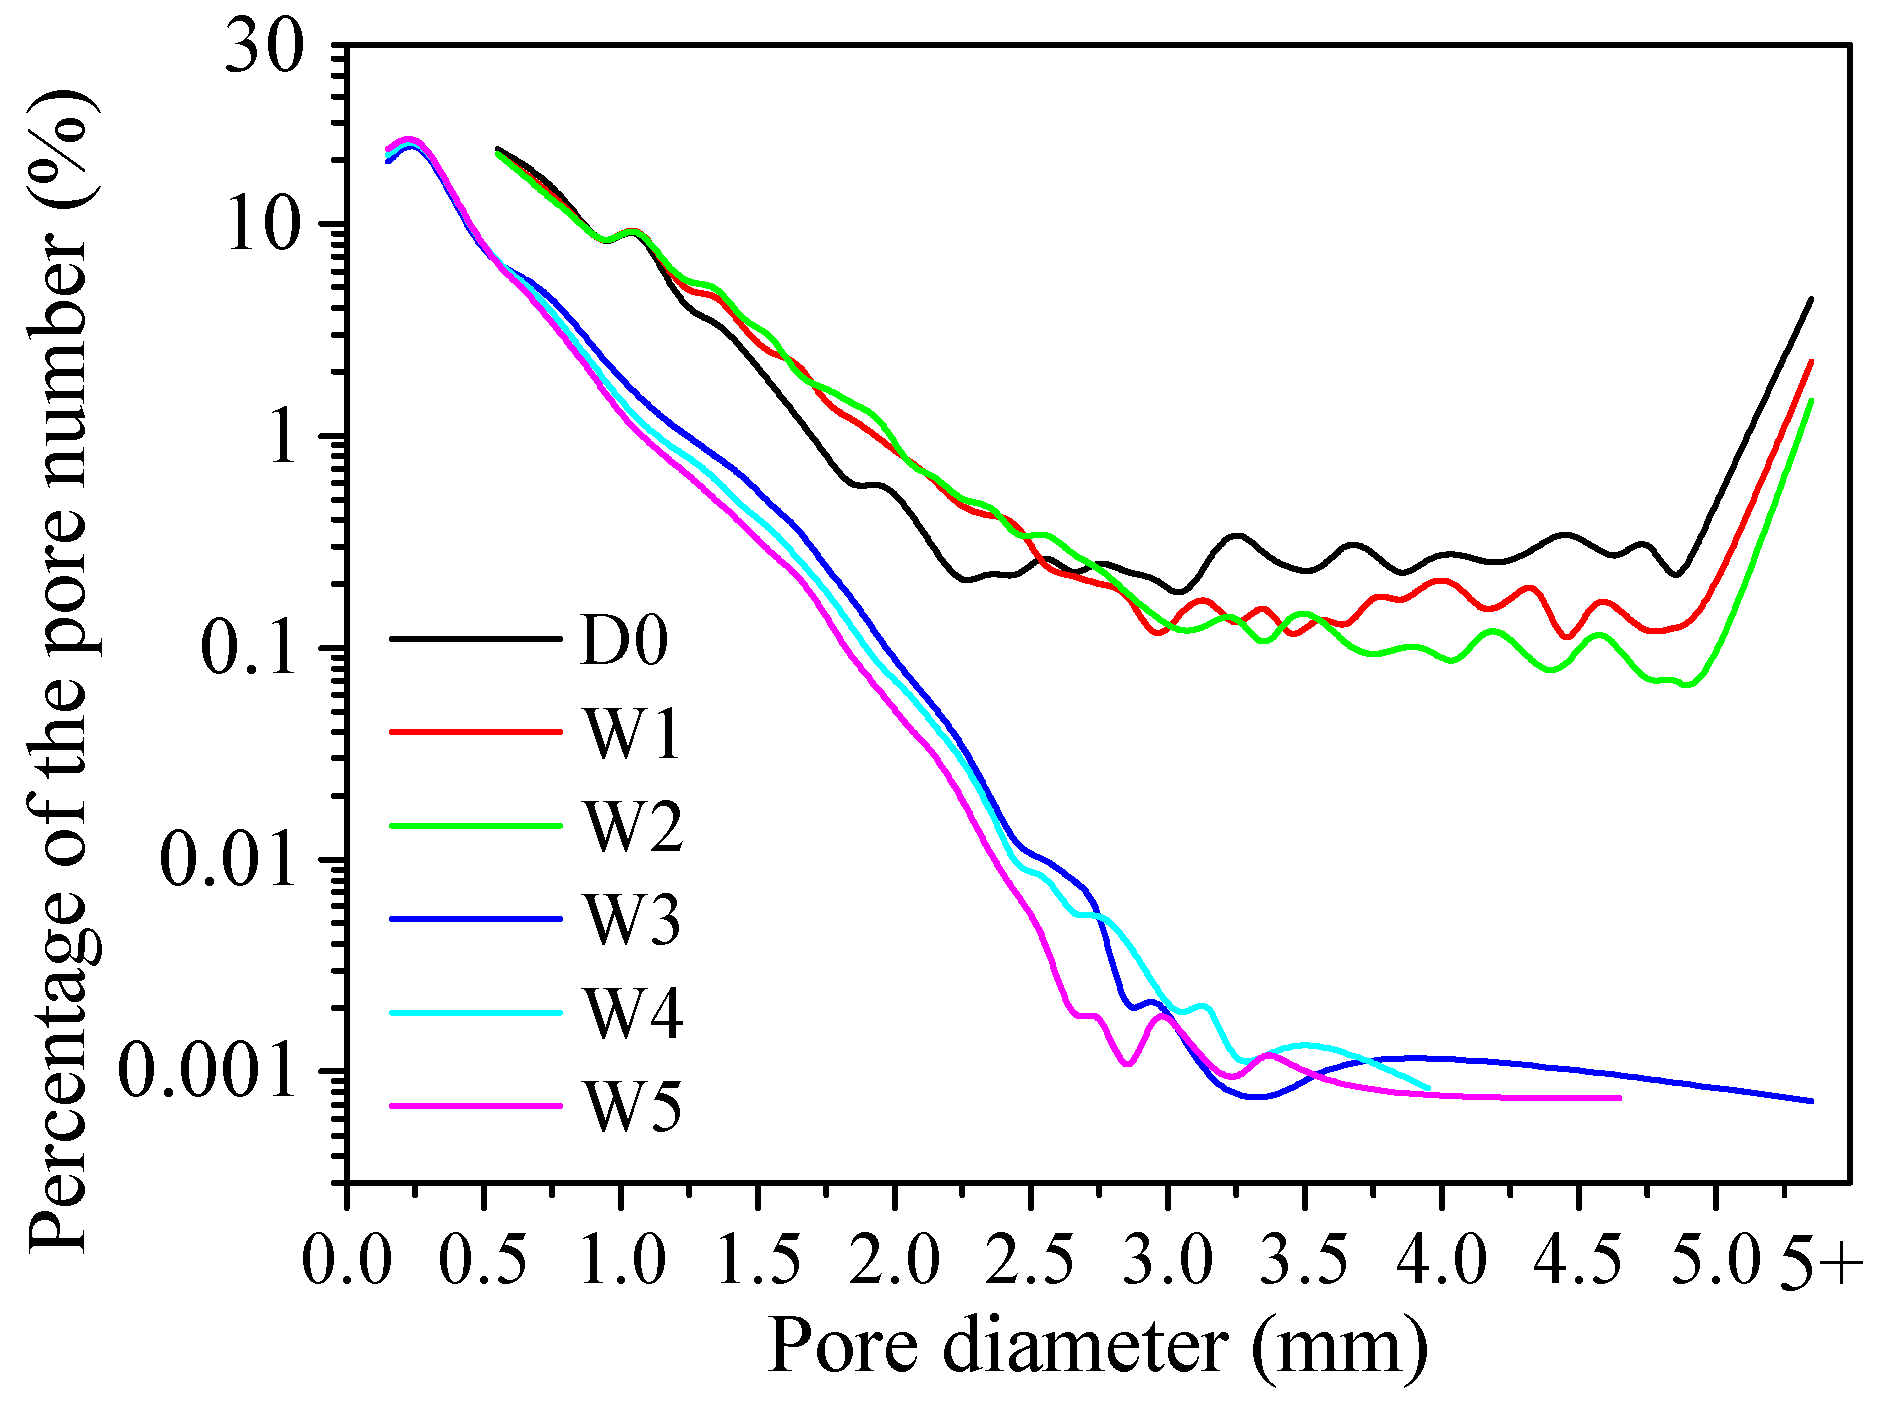
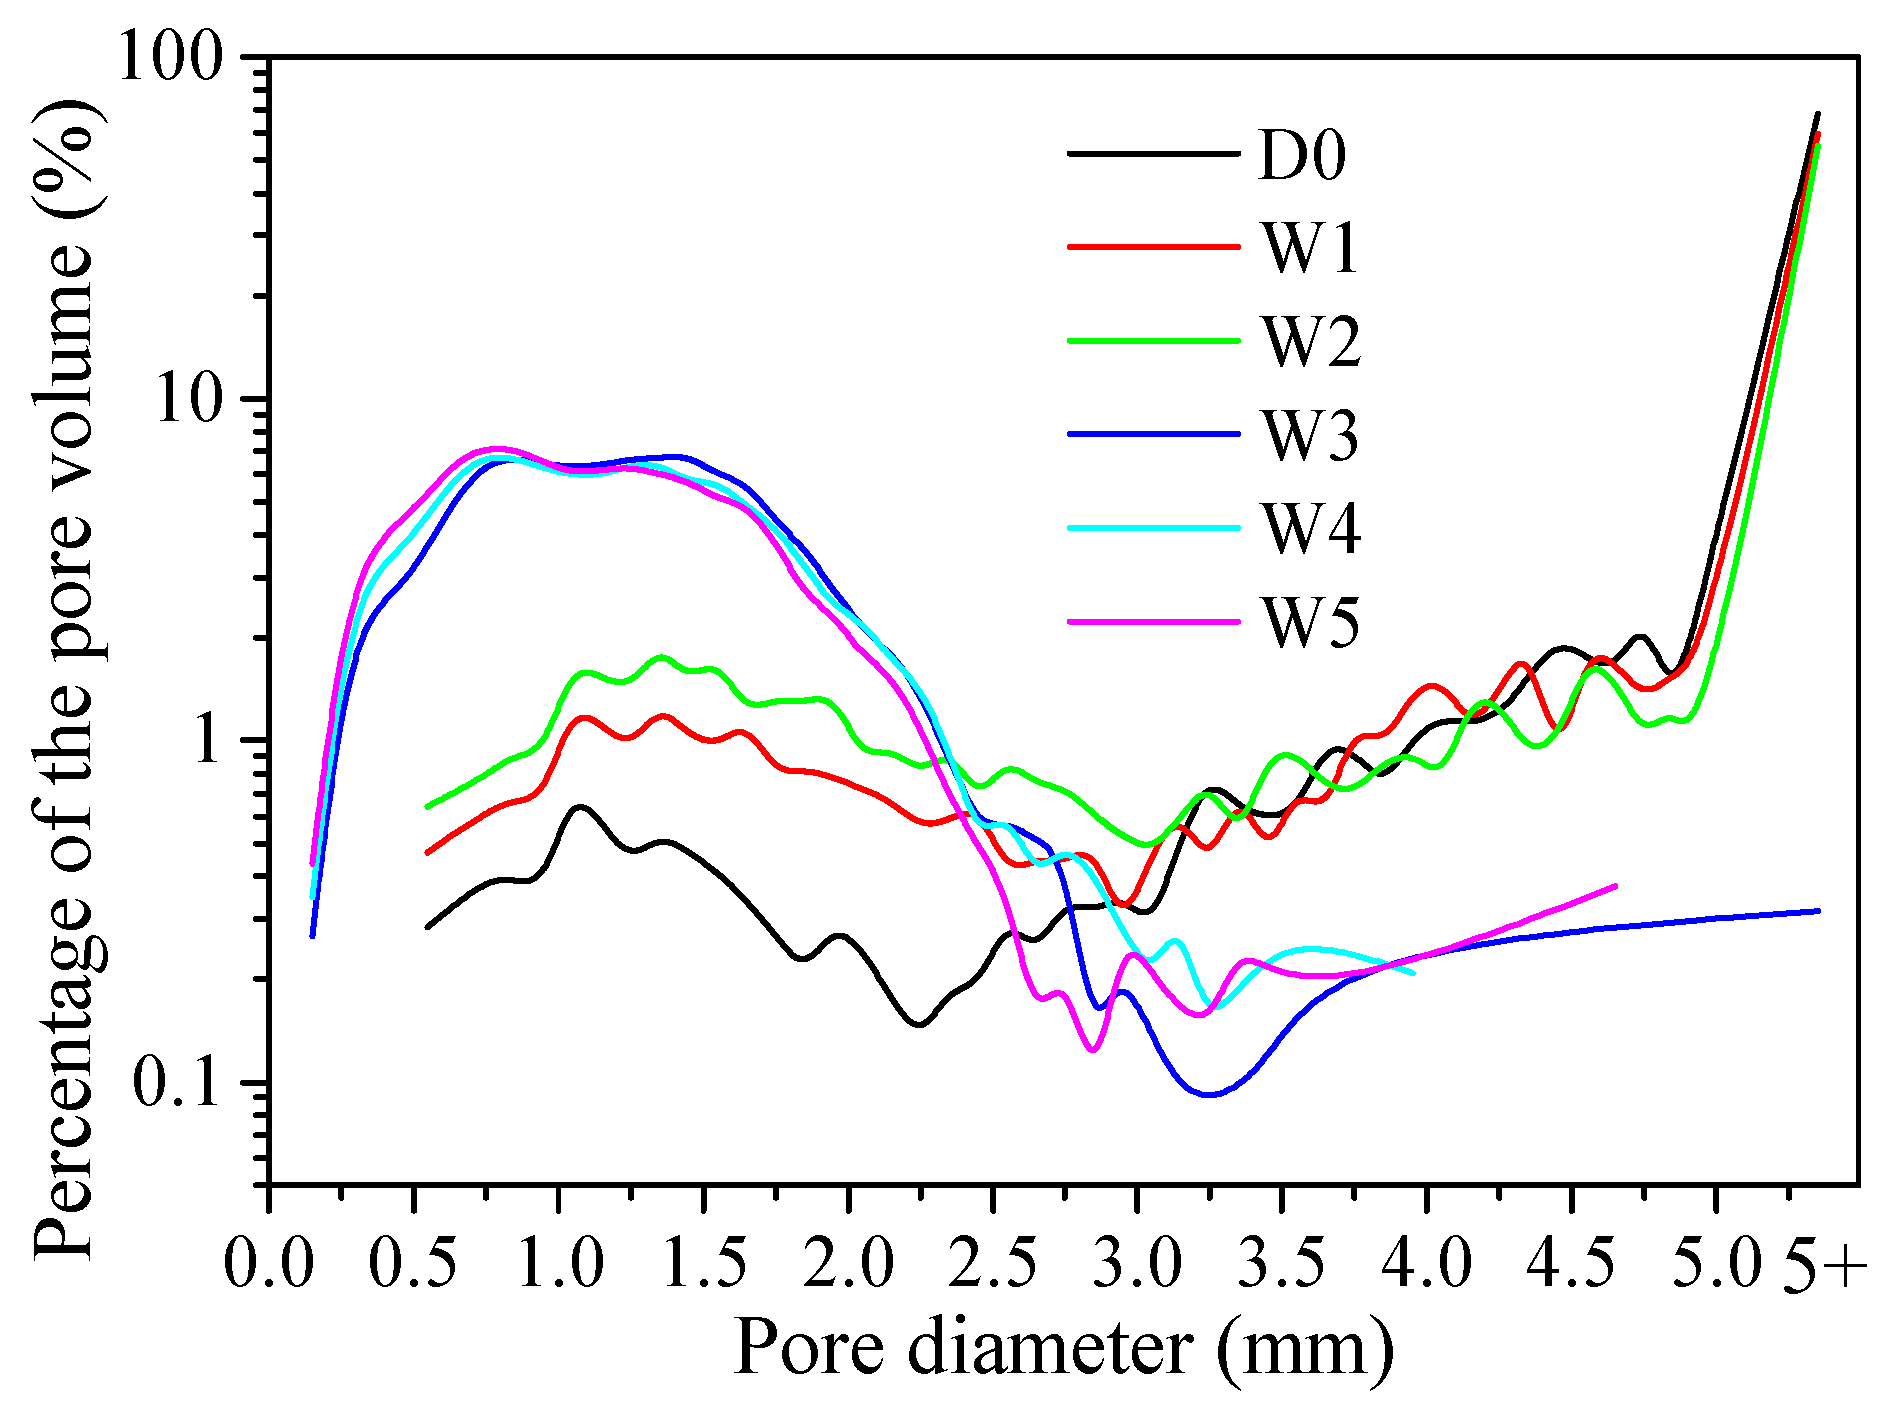
In Section 3.2.1, we find the seepage evolution model from the variation law of porosity in loess. To provide further evidence, the curves of pore number and pore volume varying with pore diameter for each seepage of the loess sample were plotted in Figure 13 and Figure 14, and the corresponding statistical results are shown in Table 3 and Table 4.
During the first seepage, the number of voids decreased by 3.049% in the interval of less than 1.0 mm, increased by 7.687% in the interval of 1.0~3.0 mm, decreased by 2.445% in the interval of 3.0~5.0 mm, and decreased by 2.193% in the interval of greater than 5.0 mm. Correspondingly, the volume of voids increased by 0.989% in the interval of less than 1.0 mm, increased by 8.660% in the interval of 1.0~3.0 mm, decreased by 1.267% in the interval of 3.0~5.0 mm, and decreased by 8.382% in the interval of greater than 5.0 mm.
During the second seepage, the number of voids decreased by 0.583% in the interval of less than 1.0 mm, increased by 2.361% in the interval of 1.0~3.0 mm, decreased by 1.008% in the interval of 3.0~5.0 mm, and decreased by 0.769% in the interval of greater than 5.0 mm. Correspondingly, the volume of voids increased by 0.824% in the interval of less than 1.0 mm, increased by 7.286% in the interval of 1.0~3.0 mm, decreased by 3.257 in the interval of 3.0~5.0 mm, and decreased by 4.583% in the interval of greater than 5.0 mm.
During the third seepage, the number of voids increased by 40.726% in the interval of less than 1.0 mm, decreased by 37.188% in the interval of 1.0~3.0 mm, decreased by 2.068% in the interval of 3.0~5.0 mm, and decreased by 1.469% in the interval of greater than 5.0 mm. Consequently, the volume of voids increased by 32.042% in the interval of less than 1.0 mm, increased by 41.275% in the interval of 1.0~3.0 mm, decreased by 18.716 in the interval of 3.0~5.0 mm, and decreased by 54.6% in the interval of greater than 5.0 mm.
During the fourth seepage, the number of voids increased by% in the interval of less than 1.0 mm, decreased by 1.553% in the interval of 1.0~3.0 mm, decreased by –1.557% in the interval of greater than 3.0 mm remaining unchanged. Correspondingly, the volume of voids increased by 3.610% in the interval of less than 1.0 mm, increased by 4.007% in the interval of 1.0~3.0 mm, decreased by 0.741 in the interval of 3.0~5.0 mm, and remained unchanged in the interval of greater than 5.0 mm.
During the fifth seepage, the number of voids increased by 0.948% in the interval of less than 1.0 mm, decreased by 0.946% in the interval of 1.0~3.0 mm, and remained unchanged in the interval of greater than 5.0 mm. Correspondingly, the volume of voids increased by 4.134% in the interval of less than 1.0 mm, increased by 4.144% in the interval of 1.0~3.0 mm, decreased by 0.364 in the interval of 3.0~5.0 mm, and remained unchanged in the interval of greater than 5.0 mm.

3.2.3. Dip Angle

Statistical analysis was performed on the dip angle of penetration of the pores from drying to the last seepage with an interval of 10°. The statistics results are listed in Table 5, and the rose map of the dip angle for each seepage is shown in Figure 15. Table 5 shows that the pores with a dip angle of more than 40° in the sample were found to decrease by 36.58% after five percolation times, and the reduced part was transformed into pores with a smaller dip angle, resulting in a corresponding increase in the number of pores with a dip angle of less than 40° by 36.58%. It can be seen from Figure 15 that after seepage occurs two times, there is an obvious ‘right deviation’ on the dip–rose diagram, and the most obvious is that the number of pores greater than 60° has decreased by 25.66%.

3.2.4. Connectivity

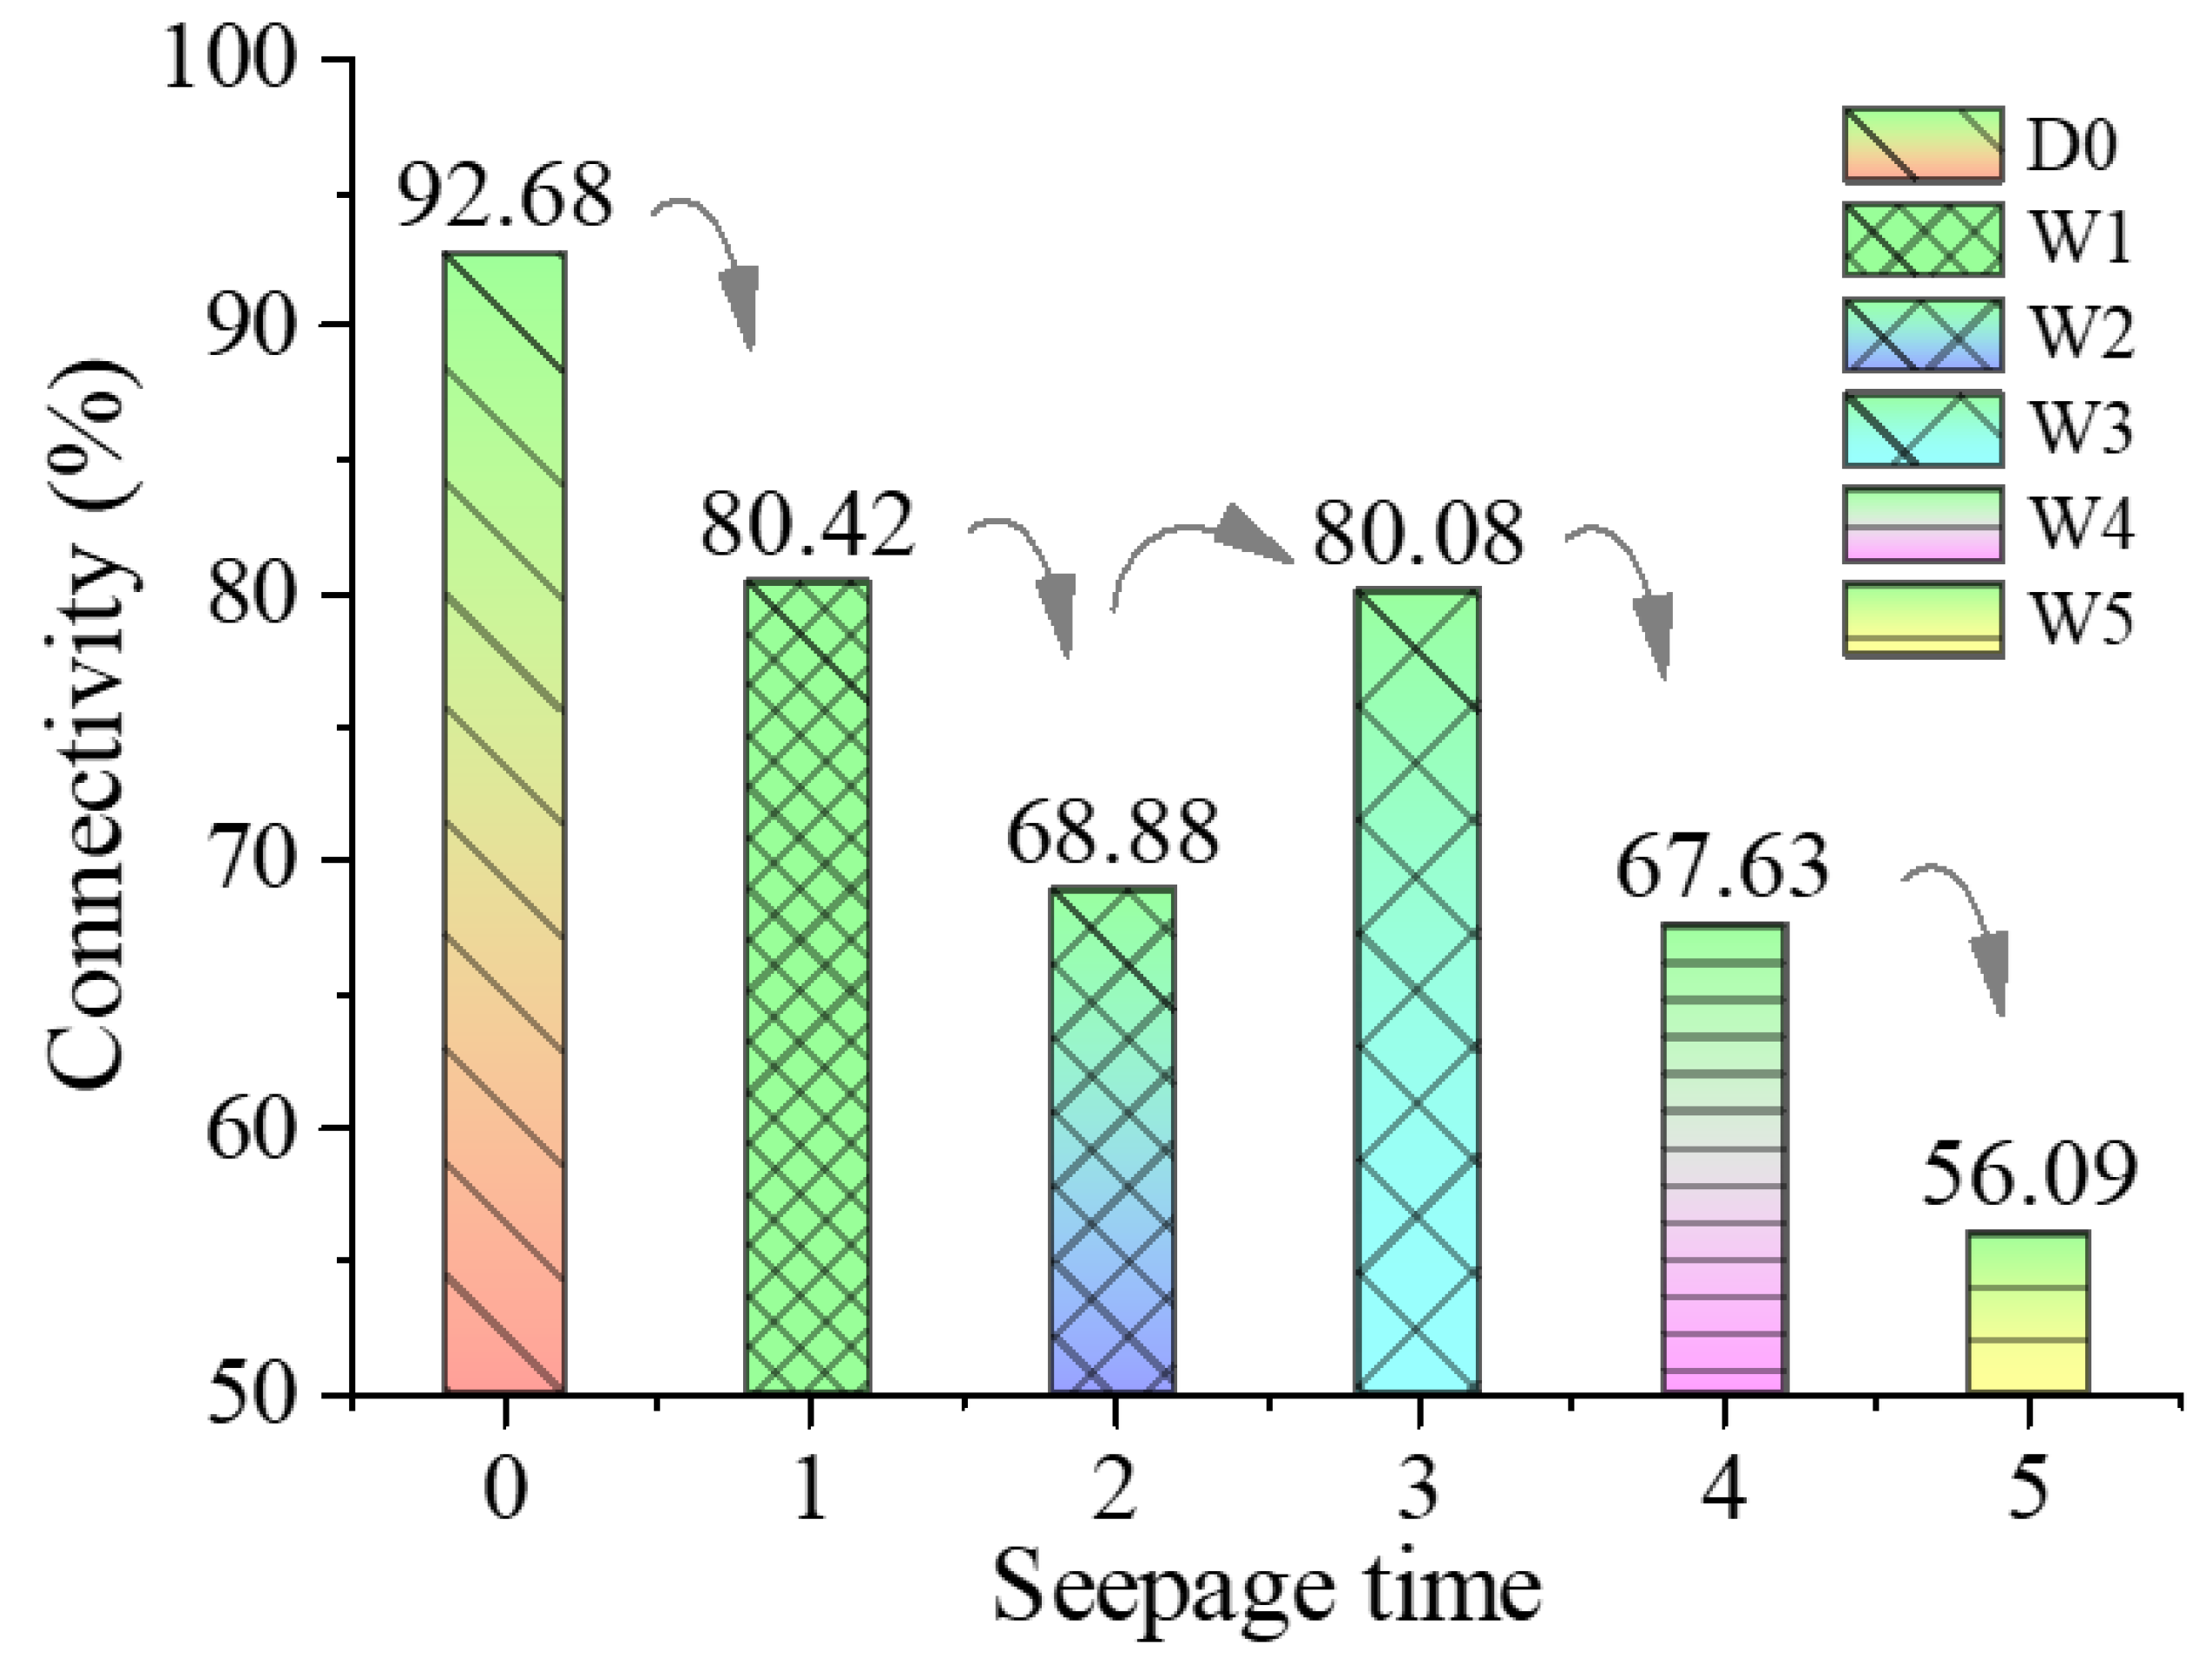
Note that the pore connectivity here actually refers to the air permeability of the loess sample. Although the contrast medium is added, only the part occupied by air can be identified and marked as pores. The contrast-solution-filling part includes the water-conductive pore and part of the soil matrix. Therefore, the decrease in pore connectivity precisely reflects the increase in water-conductive connectivity of the sample. The changing diagram is shown in Figure 16.
As can be seen in Figure 16, with continuous seepage, pore connectivity gradually decreases, indicating that the originally connected pores are gradually filled with the contrast agent solution, and the remaining pores tend to be blind-end pores and isolated pores. For the third seepage, the water pressure caused by the seepage forces the pores to expand, leading to an increase in connectivity. As the wetting front drives the bubbles traveling on, the newly expanded pores are temporarily occupied by air. Also, after the fourth seepage, the newly expanded pores are filled by the contrast agent solution, resulting in a further reduction in connectivity.

4. Discussions

4.1. The Formation Process of the Seepage Evolution Model

The study of the seepage evolution model is a critical technological issue for the construction and O&M (operation and maintenance) of important facilities located on the earth’s surface and underground [78], such as infrastructure embankments [79,80], tailings ponds and dams [81,82], and tunnels and pipelines [83,84]. However, when considering seepage problems in the loess region, it is always based on the macroscopic piston flow based on Darcy’s law [85]. There is relatively little research on the evolution of seepage patterns under the influence of preferential flow [86,87], so the research in this article is of great significance.
In the dynamic change in the structure of the loess, the variation in porosity is accompanied by the interaction between the soil and the water in the preferential infiltration process [44]. Therefore, in this paper, the authors utilize the changing law of porosity to explore the seepage evolution model of the undisturbed loess under dynamic infiltration.
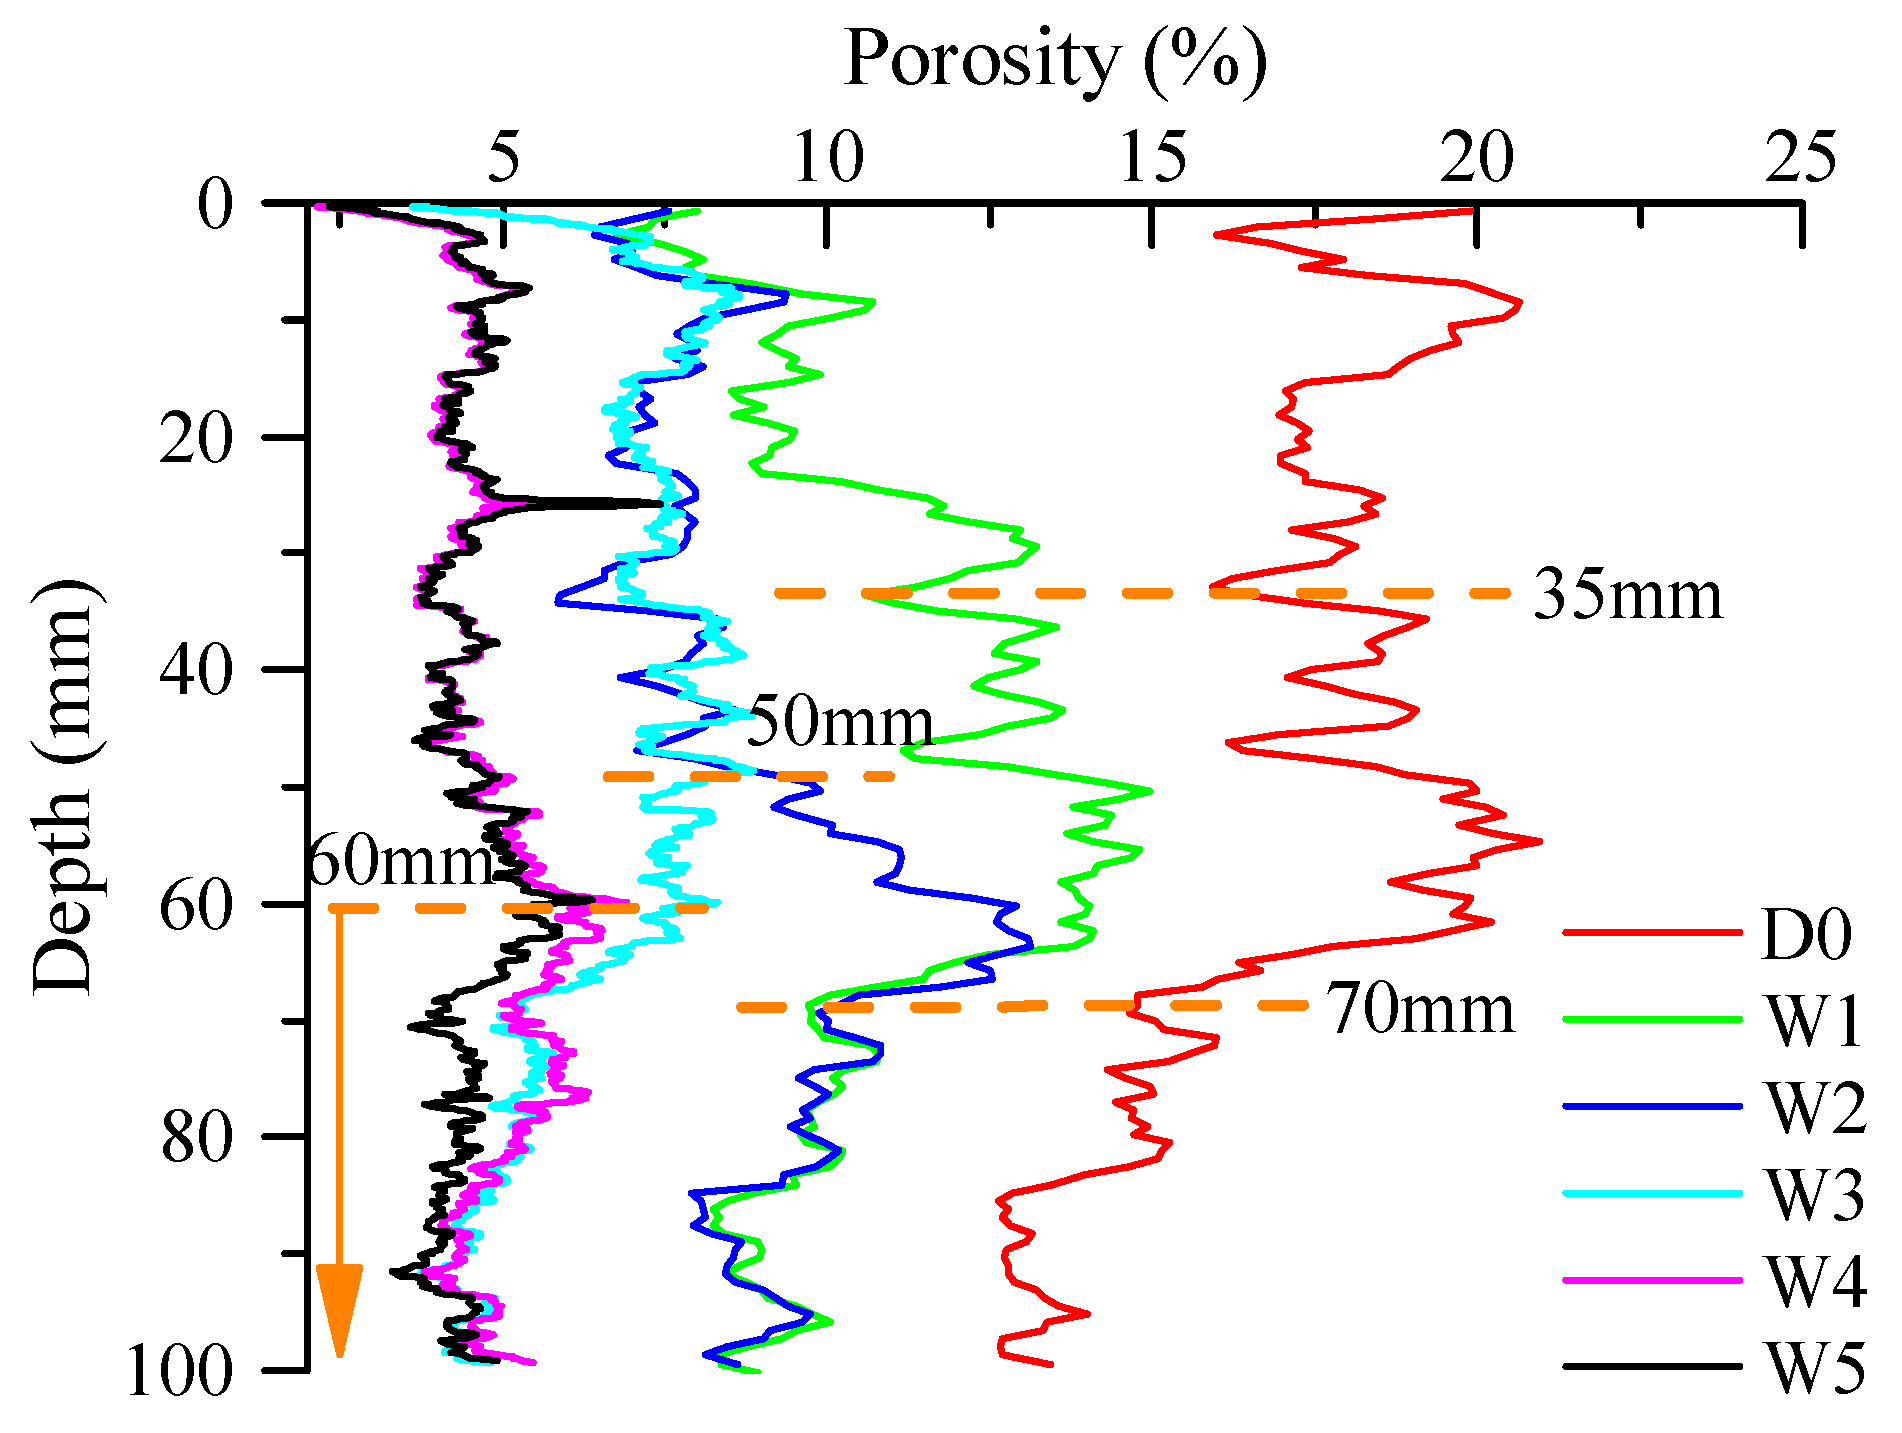
Based on the porosity change results in Table 2, and Figure 11 and Figure 12, there are six porosity distribution curves along the Z direction of the loess sample responding to the initial dry state and the wet state after the first to the fifth seepage, which are plotted in Figure 17. As can be seen from Figure 17, the six porosity distribution curves were marked as D0, W1, W2, W3, W4, and W5, respectively. Through the comparison of the six curves in Figure 17, several findings are derived.
(1) For the dry sample porosity curve, the porosity with an average value of 16.91% for D0 in each layer is the maximum along the z direction throughout the depth.
(2) Comparing the porosity curve of the wet sample after the first seepage (W1) to that of the dry sample (D0), there exists a characteristic location at a depth of 35 mm from the top. The porosity of W1 has a significant decrease compared to D0 overall, while it has the same varying trend below the depth of 35 mm with different porosity values. It shows that after the first seepage, the main wet rid reaches 35 mm; however, the preferential flow containing the contrast agent has been transported deep to the bottom of the sample along some certain well-connected channel. This is consistent with the results of Section 3.1.1 and Section 3.1.2. The performance of this stage is consistent with the findings of Mooney [43,85]; that is, during the initial stage of seepage, it migrates in a manner of high-speed preferential flow.
(3) Comparing W2 to W1, there is a second characteristic depth of 70 mm from the top. The porosity of W2 has a significant decrease compared to W1 above the 70 mm location, while it has a near amplitude and trend with W1 below the depth of 70 mm. This shows that after the second seepage, the preferential wet rid reaches 70 mm; however, the preferential flow remains to transport only the channel of W1 with subtle expansion or destruction of the channel during this process.
(4) Comparing W3 to W2, there is a third characteristic depth of 50 mm from the top. The porosity of W3 has a near amplitude and trend with W2 above the location of 50 mm, while it has a significant reduction with W2 below the depth of 50 mm. This shows that the sample is partially saturated above the location of 50 mm and that the soil structure does not change; however, some previous unconnected pores were broken through to be connected, so the contrast agent percolates into them [88], resulting in a decrease in the pore volume fraction further under the action of water pressure.
(5) Comparing W5 to W4, there is a fourth characteristic depth of 60 mm from the top. The porosity of W5 has nearly the same amplitude and trend as that of W4 above the 60 mm location. This illustrates that apart from some isolated pores, the rest are saturated by water and that the porosity will no longer decrease. In this part, the seepage of the contrast agent is dominated by piston flow. However, the porosity still decreased in a small range below 60 mm because there is a part of the pores that is still expanding and developing, and preferential flow still exists but with weaker action intensity.
Based on the analysis in Figure 17, it can be seen that there is an obvious preferential flow phenomenon in the infiltration process of the loess sample [29]. The strong argument is that if the infiltration is uniform across the entire sample, the porosity will change above the main wet rid and remain unchanged below the wet front [89]. However, the porosity decreases as it increases or decreases with the average wetting front. The seepage infiltrated first along the preferential flow pathways and bypassed part of the soil matrix to penetrate deep into the loess [44]. It is worth addressing that the porosity decreased overall for the connected pores being filled with a contrast agent, however, at some local depth or stage the porosity increased occasionally. For example, in the situation mentioned above, the porosity curve of W3 locally increased compared to W2 above the characteristic depth because the pores expanded and developed under water pressure. However, not all of them serve as conductive pores for the existence of preferential flow; some newly created pores are just blind-end pores connected with the trunk pores. Although these pores do not have infiltration contributions, they contribute a certain volume fraction of the pores.
To reveal a seepage evolution model of the seepage in loess, a summary of the variation law of porosity in loess samples along the z direction in the seepage process is provided: The contrast agent first infiltrated with a fast preferential flow to fill most of the preferential flow pathway [86] and made the porosity decrease rapidly, then infiltrated by piston flow with high water pressure to enter the pores with relatively small size. Due to the high water pressure, the original discontinuous pores could expand and develop [90], induced preferential flow once again locally until there is no significant pore expansion, and finally infiltrated via piston flow. Therefore, it presents a seepage evolution model of ‘preferential flow-piston flow–mixture flow (preferential and piston flow)–piston flow’.

4.2. Evidence for the Seepage Evolution Model

Diameter, volume, and dip angle are key parameters that reflect the change in the geometry of the pores, which serves as strong evidence for the interaction between preferential flow and loess [24]. And, coincidentally, the seepage evolution occurred during such an interaction process.
From Figure 13 and Figure 14, together with Table 3 and Table 4, the changes in pore number and volume were presented. The variation law can be divided into three stages and summarized as follows.
In the early stage of the seepage (that is, the first and second seepage), the contrast agent infiltrates along the large channel in the initial stage of the seepage, and the gaps larger than 5.0 mm are first filled with contrast agent. At the same time, the number and volume of the voids identified by CT begin to decrease. Furthermore, since the voids are filled with contrast agents, the initial voids become intermediate apertures (2.0~5.0 mm). The voids in this interval are in a dynamic change of expansion, development, and destruction accompanied by seepage erosion [82]. Therefore, there is not much fluctuation in the number and volume of voids. The variation pattern conforms to the seepage mode evolving from preferential flow to piston flow.
However, with further infiltration (the middle stage, that is, the third seepage), the invasion of the contrast agent solution will break and block the branches or blind ends of large channels to form many dispersed voids, thus increasing the number and volume of voids with a pore size smaller than 2.0 mm. In the middle stage of seepage, the number and volume of pores with a pore size less than 2.0 mm continue to increase, and the number of pores with intermediate pore size changes steadily, but the volume changes intensify. For example, in the third seepage, the volume of pores with a size of pores greater than 3.0 mm decreases by 73.316%, and these pores are further transformed into small pores. In this stage, the seepage mode belongs to the mixture flow (preferential and piston flow), and both flow patterns exist simultaneously, resulting in a complex change of the soil structure under continuous seepage erosion [91].
In the later stage of seepage, the number of pores smaller than 4.0 mm still fluctuates but with a small amplitude. In particular, the volume of the voids did not change in the pores larger than 4.0 mm. The seepage pattern in this stage is piston flow with steady change.
In Figure 15, there is an obvious ‘right deviation’ in the dip–rose diagram. The main reason is that in the infiltration process, the pores with better vertical orientation are infiltrated first and filled by a contrast agent, and the content of the pores with a greater dip angle (greater than 45°) decreases. Since not all pores are saturated, the part occupied by air is identified as pores during CT scanning, and most of these pores are spherical and ellipsoidal, increasing the blocking of macropore branch pores by contrast agent and the sealing of blind pores. The spherical and ellipsoidal pores also increase, and their dip angles are generally small, so the pores under 40° increase.

4.3. The Inner Motivation of Percolation

Previous studies mainly focused on the hydraulic contribution of connected pores. However, the potential hydraulic effects of disconnected or isolated pores are often overlooked [92]. The authors find that during the seepage process, the pore structure is often changing under the action of water pressure and hydraulic erosion. This is mainly due to the presence of a percolation phenomenon [93,94].
In Figure 16, with continuous percolation, the pore connectivity gradually decreases, indicating that the originally connected pores are gradually filled by the contrast medium solution and that the remaining pores tend to be the remaining blind-end pores and isolated pores. For the third seepage stage, the connectivity increases, mainly due to the expansion of the pores caused by the water pressure under percolation [95]. As the bubbles in the water and the bubbles at the leading edge of the hydraulically driven wetting front travel, the newly expanded pores are temporarily occupied by gas, and after further seepage, that is, the fourth seepage, the newly expanded pores are filled by the contrast medium solution, resulting in further reduced connectivity.
This phenomenon shows that the loess pores have been further expanded and developed in the infiltration process, and that some pores that do not conduct water have been ‘break-through’ by water pressure and have become connected pores with the hydraulic contribution.

4.4. Limitations and Future Research

For loess slopes, when rainfall or irrigation water infiltrates, the soil–water interaction process involves not only mechanical expansion and development but also particle migration and blockage under seepage, accompanied by hydro-chemical reactions [96]. Carbonate, clay minerals, and other types of cement in loess are dissolved under the hydro-chemical action, which can change the structure of loess [97]. Strictly speaking, it has an impact on the structure of loess. Currently, in the study of collapsibility, the hydro-chemical effects of loess cannot be ignored. However, this paper mainly focuses on the migration of particles and changes in pore structure under the action of preferential flow. Compared to chemical action, the physical effects generated by this water flow are more intense, so the focus is mainly on flow action, and for now, the hydro-chemical action is not considered, as it has a limited impact on the results of this article. In the future, it is necessary to strengthen the hydro-chemical interaction between preferential flow and the loess matrix under unsaturated conditions to obtain more refined results.
In addition, this article mainly discovered the seepage evolution mode through experiments; there is still a lack of quantitative theoretical models. The water infiltration model in the loess has important hydraulic significance, providing an important reference for future research on the seepage process and the disaster mechanism of the slope instability of loess under the action of water.

5. Conclusions

CT has been widely used in industrial engineering; pedology; geology; material science; archaeology; aerospace, coal, rock, oil and gas, and chemical engineering; geotechnical engineering; and other fields, but few scholars have used it to study changes in seepage channels and changes in preferential flow distribution in the process of dynamic seepage. In this chapter, using an experimental seepage device, the dynamic CT scanning of preferential flow was carried out under humidification conditions, two-dimensional and three-dimensional distribution characteristics of preferential flow were obtained, and the pore structure parameters of loess samples under humidification conditions were extracted. The following are some conclusions reached:
(1) From the point of view of the seepage in the two-dimensional section, the whole seepage process exhibits nonequilibrium macropore flow and finger-shaped preferential infiltration with the water-passing area unsaturated and accompanied by the water exchange between the preferential area and the surrounding matrix area.
(2) From the dynamic distribution of the three-dimensional preferential flow in loess, the three-dimensional seepage of the contrast medium in loess is mainly controlled by the distribution of macropores with non-equilibrium and anisotropy characteristics. With the increase in the water content, the preferential flow not only migrates in the existing connected macropores, but also makes the originally isolated pores into connected channels and forms larger contrast medium seepage groups under the function of percolation.
(3) From the dynamic change of the porosity in loess, the seepage evolution model was summarized as ‘preferential flow-piston flow-preferential piston mixture flow-piston flow’.
(4) The variation characteristics of the number and volume of pores with the diameter of pores in the dynamic humidification seepage process show that (a) in the early stage of the seepage, the contrast agent preferentially infiltrates along larger pores in the form of preferential flow and gradually evolves to piston flow; (b) in the middle stage, the seepage mode belongs to mixture flow (preferential and piston flow), resulting in the complex change of the soil structure; and (c) in the later stage of seepage, the seepage pattern in this stage is piston flow, with small fluctuation of the pore number and volume.
(5) With the inner motivation of percolation, the pore structure changes dynamically with increasing water pressure, resulting in the corresponding variation of the pore connectivity and even the evolution of the seepage model during the infiltration process.
Limitations exist in no consideration of the hydro-chemical action, although the physical effects generated by the preferential water flow are more intense, and the hydro-chemical action is not considered temporary. In the future, it is necessary to strengthen the hydro-chemical interaction between preferential flow and loess matrix under unsaturated conditions to obtain deeper results, as well as to establish theoretical models to conduct deeper research on the seepage process and the disaster mechanism of loess slope instability under preferential flow.

Author Contributions

Conceptualization, X.L. and Q.L.; methodology, Y.L. (Yang Li); software, X.L. and Y.L. (Yang Li); validation, Q.L., X.Z. and L.Z.; formal analysis, X.L.; investigation, X.L., Y.L. (Yang Li), X.S. and Y.L. (Yudong Lu); resources, X.L.; data curation, X.Z. and S.Z.; writing—original draft preparation, X.L.; writing—review and editing, Q.L.; visualization, X.L. and X.S.; funding acquisition, X.L. and Q.L. All authors have read and agreed to the published version of the manuscript.

Funding

This research was funded by the Natural Science Foundation of Hebei Province (Grant No.: E2021210092, E2019210304), the Youth Top Talent Project of Hebei Province, and S&T Program of Hebei (Grant No.: 22375412D).

Institutional Review Board Statement

Not applicable.

Informed Consent Statement

Not applicable.

Data Availability Statement

Data available upon request from the authors.

Conflicts of Interest

The authors declare no conflict of interest.

References

  1. Liu, T. The Mass Composition and Structure of Loess; Science Press: Beijing, China, 1966. (In Chinese) [Google Scholar]
  2. Sun, J.-Z. Loessology (Volume I); Hong Kong Archaeological Society: Hong Kong, 2005. (In Chinese) [Google Scholar]
  3. Wei, Y.-N.; Fan, W.; Yu, N.; Deng, L.-S.; Wei, T. Permeability of loess from the South Jingyang Plateau under different consolidation pressures in terms of the three-dimensional microstructure. Bull. Eng. Geol. Environ. 2020, 79, 4841–4857. [Google Scholar] [CrossRef]
  4. Zhang, X.; Lu, Y.; Li, X.; Lu, Y.; Pan, W. Microscopic structure changes of Malan loess after humidification in South Jingyang Plateau, China. Environ. Earth Sci. 2019, 78, 287. [Google Scholar] [CrossRef]
  5. Xu, P.; Zhang, Q.; Qian, H.; Qu, W.; Li, M. Microstructure and permeability evolution of remolded loess with different dry densities under saturated seepage. Eng. Geol. 2020, 282, 105875. [Google Scholar] [CrossRef]
  6. Yu, B.; Fan, W.; Dijkstra, T.; Wei, Y.; Deng, L. Heterogeneous evolution of pore structure during loess collapse: Insights from X-ray micro-computed tomography. CATENA 2021, 201, 105206. [Google Scholar] [CrossRef]
  7. Wei, Y.; Fan, W.; Yu, B.; Deng, L.; Wei, T. Characterization and evolution of three-dimensional microstructure of Malan loess. CATENA 2020, 192, 104585. [Google Scholar] [CrossRef]
  8. Feng, L.; Lin, H.; Zhang, M.; Guo, L.; Jin, Z.; Liu, X. Development and evolution of Loess vertical joints on the Chinese Loess Plateau at different spatiotemporal scales. Eng. Geol. 2020, 265, 105372. [Google Scholar] [CrossRef]
  9. Li, P.; Qian, H.; Wu, J. Environment: Accelerate research on land creation. Nature 2014, 510, 29–31. [Google Scholar] [CrossRef]
  10. Zhang, M.; Liu, J. Controlling factors of loess landslides in western China. Environ. Earth Sci. 2010, 59, 1671–1680. [Google Scholar] [CrossRef]
  11. Zhuang, J.; Peng, J.; Wang, G.; Javed, I.; Wang, Y.; Li, W. Distribution and characteristics of landslide in Loess Plateau: A case study in Shaanxi province. Eng. Geol. 2018, 236, 89–96. [Google Scholar] [CrossRef]
  12. Peng, J.; Wang, Q.; Zhuang, J.; Leng, Y.; Fan, Z.; Wang, S. Dynamic formation mechanism of landslide disaster on the Loess Plateau. J. Geomech. 2020, 26, 714–730. (In Chinese) [Google Scholar]
  13. Dijkstra, T.A.; Rogers, C.D.F.; Smalley, I.J.; Derbyshire, E.; Li, Y.J.; Meng, X.M. The loess of north-central China: Geotechnical properties and their relation to slope stability. Eng. Geol. 1994, 36, 153–171. [Google Scholar] [CrossRef]
  14. Li, Y.; Zhang, T.; Zhang, Y.; Xu, Q. Geometrical appearance and spatial arrangement of structural blocks of the Malan loess in NW China and the implications for the formation of loess columns. J. Asian Earth Sci. 2018, 158, 18–28. [Google Scholar] [CrossRef]
  15. Wei, T.; Fan, W.; Yu, N.; Wei, Y.-n. Three-dimensional microstructure characterization of loess based on a serial sectioning technique. Eng. Geol. 2019, 261, 105265. [Google Scholar] [CrossRef]
  16. Giménez, R.G.; Martín, J.A.G. Characterization of loess in central Spain: A microstructural study. Environ. Earth Sci. 2012, 65, 2125–2137. [Google Scholar] [CrossRef]
  17. Zhang, X.; Li, X.; Lu, Y.; Lu, Y.; Fan, W. A study on the collapse characteristics of loess based on energy spectrum superposition method. Heliyon 2023, 9, 18643. [Google Scholar] [CrossRef]
  18. Liu, Z.; Liu, F.; Ma, F.; Wang, M.; Bai, X.; Zheng, Y.; Yin, H.; Zhang, G. Collapsibility, composition, and microstructure of loess in China. Can. Geotech. J. 2015, 53, 673–686. [Google Scholar] [CrossRef]
  19. Jotisankasa, A. Collapse Behaviour of a Compacted Silty Clay; University of London: London, UK, 2005. [Google Scholar]
  20. Zhang, M.S.; Hu, W.; Sun, P.P.; Wang, X.L. Advances and prospects of water sensitivity of loess and the induced loess landslides. J. Earth Environ. 2016, 7, 323–334. [Google Scholar] [CrossRef]
  21. Luo, H.; Wu, F.; Chang, J.; Xu, J. Microstructural constraints on geotechnical properties of Malan Loess: A case study from Zhaojiaan landslide in Shaanxi province, China. Eng. Geol. 2018, 236, 60–69. [Google Scholar] [CrossRef]
  22. Yan, G.; Bore, T.; Schlaeger, S.; Scheuermann, A.; Li, L. Investigating scale effects in soil water retention curve via spatial time domain reflectometry. J. Hydrol. 2022, 612, 128238. [Google Scholar] [CrossRef]
  23. Yan, G.; Li, Z.; Bore, T.; Galindo Torres, S.A.; Scheuermann, A.; Li, L. A lattice Boltzmann exploration of two-phase displacement in 2D porous media under various pressure boundary conditions. J. Rock Mech. Geotech. Eng. 2022, 14, 1782–1798. [Google Scholar] [CrossRef]
  24. Li, X.; Lu, Y.; Zhang, X.; Fan, W.; Lu, Y.; Pan, W. Quantification of macropores of Malan loess and the hydraulic significance on slope stability by X-ray computed tomography. Environ. Earth Sci. 2019, 78, 522–540. [Google Scholar] [CrossRef]
  25. Fan, W.; Deng, L.; Yuan, W. Double parameter binary-medium model of fissured loess. Eng. Geol. 2018, 31, 1752–1756. [Google Scholar] [CrossRef]
  26. Li, Y.; He, S.; Deng, X.; Xu, Y. Characterization of macropore structure of Malan loess in China based on 3D pipe models constructed by using computed tomography technology. J. Asian Earth Sci. 2018, 154, 271–279. [Google Scholar] [CrossRef]
  27. Zhang, J.F.; Lin, X.C.; Wang, W.Y. Characteristics of macro-pore and macro-pore flow in loess soil. J. Soil Water Conserv. 2003, 17, 168–171. (In Chinese) [Google Scholar] [CrossRef]
  28. Lipiec, J.; Turski, M.; Hajnos, M.; Świeboda, R. Pore structure, stability and water repellency of earthworm casts and natural aggregates in loess soil. Geoderma 2015, 243–244, 124–129. [Google Scholar] [CrossRef]
  29. Zhang, Y.; Zhang, M.; Niu, J.; Zheng, H. The preferential flow of soil: A widespread phenomenon in pedological perspectives. Eurasian Soil Sci. 2016, 49, 661–672. [Google Scholar] [CrossRef]
  30. Guo, Z.; Torra, O.; Hürlimann, M.; Abancó, C.; Medina, V. FSLAM: A QGIS plugin for fast regional susceptibility assessment of rainfall-induced landslides. Environ. Model. Softw. 2022, 150, 105354. [Google Scholar] [CrossRef]
  31. Pan, W.; Xu, Y.; Lu, Y.; Gao, L.a.; Yao, X. Quantitative determination of preferential flow characteristics of loess based on nonuniformity and fractional dimension. Trans. Chin. Soc. Agric. Eng. 2017, 33, 140–147. (In Chinese) [Google Scholar] [CrossRef]
  32. Li, X.; Lu, Y.; Fan, W.; Pan, W.; Zhang, X.; Lu, Y. Current Status and Prospects of Research on Mechanism of Preferential Flow-induced Sliding in Loess Slope. Bull. Soil Water Conserv. 2019, 39, 294–301+324. (In Chinese) [Google Scholar] [CrossRef]
  33. Peng, J.; Lan, H.; Qian, H.; Wang, W.; Li, R.; Li, Z.; Zhuang, J.; Liu, X.; Liu, S. Scientific research framework of livable yellow river. J. Eng. Geol. 2020, 28, 189–201. (In Chinese) [Google Scholar]
  34. Li, Y.; Zhao, J. Loess and Loess Geohazards in China; CRC Press: London, UK, 2017. [Google Scholar] [CrossRef]
  35. Peng, J.B.; Lin, H.C.; Wang, Q.Y.; Zhuang, J.Q.; Cheng, Y.X.; Zhu, X.H. The critical issues and creative concepts in mitigation research of loess geological hazards. J. Eng. Geol. 2014, 22, 684–691. (In Chinese) [Google Scholar] [CrossRef]
  36. Heijs, A.W.J.; de Lange, J.; Schoute, J.F.T.; Bouma, J. Computed tomography as a tool for non-destructive analysis of flow patterns in macroporous clay soils. Geoderma 1995, 64, 183–196. [Google Scholar] [CrossRef]
  37. Carmignato, S.; Dewulf, W.; Leach, R. Industrial X-ray Computed Tomography; Springer International Publishing: Cham, Switzerland, 2018. [Google Scholar] [CrossRef]
  38. Taina, I.A.; Heck, R.J.; Elliot, T.R. Application of x-ray computed tomography to soil science: A literature review. Can. J. Soil Sci. 2008, 88, 1–19. [Google Scholar] [CrossRef]
  39. Li, Z.; Tang, L. Using Synchrotron-Based X-Ray Microcomputed Tomography to Characterize Water Distribution in Compacted Soils. Adv. Mater. Sci. Eng. 2019, 2019, 7147283. [Google Scholar] [CrossRef]
  40. Tippkötter, R.; Eickhorst, T.; Taubner, H.; Gredner, B.; Rademaker, G. Detection of soil water in macropores of undisturbed soil using microfocus X-ray tube computerized tomography (μCT). Soil Tillage Res. 2009, 105, 12–20. [Google Scholar] [CrossRef]
  41. Cnudde, V.; Boone, M.N. High-resolution X-ray computed tomography in geosciences: A review of the current technology and applications. Earth Sci. Rev. 2013, 123, 1–17. [Google Scholar] [CrossRef]
  42. Loo, D.V.; Bouckaert, L.; Leroux, O.; Pauwels, E.; Dierick, M.; Hoorebeke, L.V.; Cnudde, V.; Neve, S.D.; Sleutel, S. Contrast agents for soil investigation with X-ray computed tomography. Geoderma 2014, 213, 485–491. [Google Scholar] [CrossRef]
  43. Mooney, S.J. Three-dimensional visualization and quantification of soil macroporosity and water flow patterns using computed tomography. Soil Use Manag. 2002, 18, 142–151. [Google Scholar] [CrossRef]
  44. Luo, L.; Lin, H.; Halleck, P. Quantifying Soil Structure and Preferential Flow in Intact Soil Using X-ray Computed Tomography. Soil Sci. Soc. Am. J. 2008, 72, 1058–1069. [Google Scholar] [CrossRef]
  45. Luo, L. Quantification of Soil Macropore Network and Its Relationship to Preferential Flow Using Combined X-ray Computed Tomography and Breakthrough Curve Analysis. Ph.D. Thesis, The Pennsylvania State University, State College, PA, USA, 2009. [Google Scholar]
  46. Wildenschild, D.; Hopmans, J.W.; Rivers, M.; Kent, A. Quantitative analysis of flow processes in a sand using synchrotron-based X-ray microtomography. Vadose Zone J. 2005, 4, 112–126. [Google Scholar] [CrossRef]
  47. Willson, C.; Lu, N.; Likos, W. Quantification of Grain, Pore, and Fluid Microstructure of Unsaturated Sand from X-Ray Computed Tomography Images. Geotech. Test. J. 2012, 35, 911–923. [Google Scholar] [CrossRef]
  48. Luo, L.; Lin, H.; Li, S. Quantification of 3-D soil macropore networks in different soil types and land uses using computed tomography. J. Hydrol. 2010, 393, 53–64. [Google Scholar] [CrossRef]
  49. Yang, L.; Zhang, Y.; Liu, Z.; Zhao, P.; Liu, C. In-situ tracking of water transport in cement paste using X-ray computed tomography combined with CsCl enhancing. Mater. Lett. 2015, 160, 381–383. [Google Scholar] [CrossRef]
  50. Jianmei, W.; Zengchao, F.; Dong, Z.; Jing, Z. Microscopic Imaging of the Sandstone Under Hydrostatic Pressure and Its Preliminary Analysis Based on the Micro-CT and Medical Imaging Agents. J. Taiyuan Univ. Technol. 2015, 46, 405–409. (In Chinese) [Google Scholar] [CrossRef]
  51. Dai, X.; He, L.; Wu, W.; Chen, J. Visualization experiment technology based on transparent geotechnical materials and its engineering application. J. Vis. 2023, 26, 145–159. [Google Scholar] [CrossRef]
  52. Iskander, M.; Sadek, S.; Liu, J. Soil structure interaction in transparent synthetic soils using digital image correlation. In Proceedings of the TRB 2003 Session on Recent Advances in Modeling Techniques in Geomechanics, Washington, DC, USA, January 2003; p. 03-2360. Available online: https://www.researchgate.net/publication/258311199_Soil_structure_interaction_in_transparent_synthetic_soils_using_digital_image_correlation (accessed on 12 August 2023).
  53. Chen, Y.; Xu, J.; Peng, S.; Zhang, Q.; Chen, C. Strain localisation and seepage characteristics of rock under triaxial compression by 3D digital image correlation. Int. J. Rock Mech. Min. Sci. 2022, 152, 105064. [Google Scholar] [CrossRef]
  54. Pengjin, Y.; Shengjun, M.; Yuting, M.; Wenxuan, Y.; Xiangfan, S. Multi-dimensional non-uniform deformation and failure of siltstone determined using acoustic, 3D-digital image correlation, and computed tomography. Theor. Appl. Fract. Mech. 2023, 125, 103800. [Google Scholar] [CrossRef]
  55. Higo, Y.; Oka, F.; Sato, T.; Matsushima, Y.; Kimoto, S. Investigation of localized deformation in partially saturated sand under triaxial compression using microfocus X-ray CT with digital image correlation. Soils Found. 2013, 53, 181–198. [Google Scholar] [CrossRef]
  56. Nohara, S.; Mukunoki, T. Quantitative Evaluation of Soil Structure and Strain in Three Dimensions under Shear Using X-ray Computed Tomography Image Analysis. J. Imaging 2021, 7, 230. [Google Scholar] [CrossRef]
  57. Doreau-Malioche, J.; Galvis-Castro, A.; Tovar-Valencia, R.; Viggiani, G.; Combe, G.; Prezzi, M.; Salgado, R. Characterising processes at sand-pile interface using digital image analysis and X-ray CT. Geotech Lett. 2019, 9, 254–262. [Google Scholar] [CrossRef]
  58. Keyes, S.D.; Cooper, L.; Duncan, S.; Koebernick, N.; McKay Fletcher, D.M.; Scotson, C.P.; van Veelen, A.; Sinclair, I.; Roose, T. Measurement of micro-scale soil deformation around roots using four-dimensional synchrotron tomography and image correlation. J. R. Soc. Interface 2017, 14, 20170560. [Google Scholar] [CrossRef] [PubMed]
  59. Khatami, H.; Deng, A.; Jaksa, M. An experimental study of the active arching effect in soil using the digital image correlation technique. Comput. Geotech. 2019, 108, 183–196. [Google Scholar] [CrossRef]
  60. Tianhua, W.; Yu, Z.; Li, W.; Jinmei, S.; Huan, Z.; Zheng, S. Mesoscopic study of interaction mechanism between circular hole and fissures inrock under uniaxial compression. Rock Soil Mech. 2018, 39, 463–472. (In Chinese) [Google Scholar] [CrossRef]
  61. Wu, Y.; Li, X.; Zhang, L.; Zhou, J.; Mao, T.; Li, M. Analysis on Spatial Variability of SRM Based on Real-Time CT and the DIC Method Under Uniaxial Loading. Front. Phys. 2022, 10, 789068. [Google Scholar] [CrossRef]
  62. Keyes, S.D.; Gillard, F.; Soper, N.; Mavrogordato, M.N.; Sinclair, I.; Roose, T. Mapping soil deformation around plant roots using in vivo 4D X-ray Computed Tomography and Digital Volume Correlation. J. Biomech. 2016, 49, 1802–1811. [Google Scholar] [CrossRef]
  63. Xu, P.; Lin, T.; Qian, H.; Zhang, Q. Anisotropic microstructure of loess-paleosol sequence and its significance for engineering and paleoclimate: A case study from Xiushidu (XSD) profile, southern Chinese Loess Plateau. Eng. Geol. 2021, 286, 106092. [Google Scholar] [CrossRef]
  64. Hou, K. Pedogenic and Composition Characteristics of the Loess Soil and Its Paleo-environmental Significance in the Xiushidu Profile of Jingyang. Master’s Thesis, Chang’an University, Xi’an, China, 2018. (In Chinese). [Google Scholar]
  65. Gerke, K.M.; Karsanina, M.V. Pore-scale modelling of flow and transport phenomena in soils. In Reference Module in Earth Systems and Environmental Sciences; Elsevier: Amsterdam, The Netherlands, 2023. [Google Scholar] [CrossRef]
  66. Yan, R.-X.; Peng, J.-B.; Huang, Q.-B.; Chen, L.-J.; Kang, C.-Y.; Shen, Y.-J. Triggering influence of seasonal agricultural irrigation on shallow loess landslides on the south Jingyang Plateau, China. Water 2019, 11, 1474. [Google Scholar] [CrossRef]
  67. Hong, B.; Du, S.; Li, X.a.; Wang, L.; Wang, S.; Zhang, H. Infiltration Characteristics and Disaster-forming Mechanism of Loess in South Jinghe Tableland. Bull. Soil Water Conserv. 2019, 39, 75–79. (In Chinese) [Google Scholar]
  68. Claes, N.; Paige, G.B.; Parsekian, A.D. Uniform and lateral preferential flows under flood irrigation at field scale. Hydrol. Process. 2019, 33, 2131–2147. [Google Scholar] [CrossRef]
  69. GBT50123-2019; Standard for Geotechnical Testing Method. China Planning Press: Beijing, China, 2019.
  70. Latham, S.; Varslot, T.; Sheppard, A. Image registration: Enhancing and Calibrating X-ray Micro-CT Imaging. In Proceedings of the International Symposium of the Society of Core Analysts, Austin, TX, USA, 19–22 September 2008; p. 12. [Google Scholar]
  71. Takano, D.; Lenoir, N.; Otani, J.; Hall, S.A. Localised deformation in a wide-grained sand under triaxial compression revealed by X-ray tomography and digital image correlation. Soils Found. 2015, 55, 906–915. [Google Scholar] [CrossRef]
  72. Ma, J.; Zeng, R.; Yao, Y.; Meng, X.; Meng, X.; Zhang, Z.; Wang, H.; Zhao, S. Characterization and quantitative evaluation of preferential infiltration in loess, based on a soil column field test. CATENA 2022, 213, 106164. [Google Scholar] [CrossRef]
  73. Nimmo, J.R. Preferential flow occurs in unsaturated conditions. Hydrol. Process. 2012, 26, 786–789. [Google Scholar] [CrossRef]
  74. Cristiano, E.; Bogaard, T.; Barontini, S. Effects of Anisotropy of Preferential flow on the Hydrology and Stability of Landslides. Procedia Earth Planet. Sci. 2016, 16, 204–214. [Google Scholar] [CrossRef]
  75. Li, T.; Wang, Y.; Hu, X.; Li, P.; Wang, Y. Discussion on preferential flow and piston flow in thick loess vadose zone. J. Eng. Geol. 2022, 30, 1842–1848. (In Chinese) [Google Scholar] [CrossRef]
  76. Liu, M.; Guo, L.; Yi, J.; Lin, H.; Lou, S.; Zhang, H.; Li, T. Characterising preferential flow and its interaction with the soil matrix using dye tracing in the Three Gorges Reservoir Area of China. Soil Res. 2018, 56, 588–600. [Google Scholar] [CrossRef]
  77. Li, X.; Lu, Y.; Zhang, X.; Lu, Y.; Yang, Y. Pore-fissure Identification and Characterization of Paleosol Based on X-ray Computed Tomography. Bull. Soil Water Conserv. 2018, 38, 224–230. (In Chinese) [Google Scholar] [CrossRef]
  78. Chen, Y.; Hu, R.; Zhou, C.; Li, D.; Rong, G.; Jiang, Q. A new classification of seepage control mechanisms in geotechnical engineering. J. Rock Mech. Geotech. Eng. 2010, 2, 209–222. [Google Scholar] [CrossRef]
  79. Chambers, J.E.; Gunn, D.A.; Wilkinson, P.B.; Meldrum, P.I.; Haslam, E.; Holyoake, S.; Kirkham, M.; Kuras, O.; Merritt, A.; Wragg, J. 4D electrical resistivity tomography monitoring of soil moisture dynamics in an operational railway embankment. Near Surf. Geophys. 2014, 12, 61–72. [Google Scholar] [CrossRef]
  80. Polemio, M.; Lollino, P. Failure of infrastructure embankments induced by flooding and seepage: A neglected source of hazard. Nat. Hazards Earth Syst. Sci. 2011, 11, 3383–3396. [Google Scholar] [CrossRef]
  81. Li, Q.; Wu, B.-Z.; Li, X.; Jia, S.; Zhen, F.-H.; Gao, S. The Relatively Stable Seepage Field: A New Concept to Determine Seepage Field in the Design of a Dry-Stack Tailings Pond. Appl. Sci. 2022, 12, 12123. [Google Scholar] [CrossRef]
  82. Wang, Y.; Duan, X.; Gu, Y.; Wang, S. Experimental Investigation of the Seepage-Induced Failure Process in Granular Soils. Geofluids 2022, 2022, 5703151. [Google Scholar] [CrossRef]
  83. Zhang, D.-M.; Gao, C.-P.; Yin, Z.-Y. CFD-DEM modeling of seepage erosion around shield tunnels. Tunn. Undergr. Space Technol. 2019, 83, 60–72. [Google Scholar] [CrossRef]
  84. Li, X.; Chen, R.; Liu, L.; Zhou, C.; Bate, B. A non-Darcy flow CFD–DEM method for simulating ground collapse induced by leakage through underground pipeline defect. Comput. Geotech. 2023, 162, 105695. [Google Scholar] [CrossRef]
  85. Lu, Y.; Lu, Y.; Lu, T.; Wang, B.; Zeng, G.; Zhang, X. Computing of Permeability Tensor and Seepage Flow Model of Intact Malan Loess by X-ray Computed Tomography. Water 2023, 15, 2851. [Google Scholar] [CrossRef]
  86. Qin, Y.; Qiu, J.; Lai, J.; Liu, F.; Wang, L.; Luo, Y.; Liu, T. Seepage characteristics in loess strata subjected to single point water supply. J. Hydrol. 2022, 609, 127611. [Google Scholar] [CrossRef]
  87. Chen, G.; Meng, X.; Qiao, L.; Zhang, Y.; Wang, S. Response of a loess landslide to rainfall: Observations from a field artificial rainfall experiment in Bailong River Basin, China. Landslides 2018, 15, 895–911. [Google Scholar] [CrossRef]
  88. Soto-Gómez, D.; Vázquez Juíz, L.; Pérez-Rodríguez, P.; López-Periago, J.E.; Paradelo, M.; Koestel, J. Percolation theory applied to soil tomography. Geoderma 2020, 357, 113959. [Google Scholar] [CrossRef]
  89. Šimůnek, J.; Jarvis, N.J.; Genuchten, M.T.V.; Gärdenäs, A. Review and comparison of models for describing non-equilibrium and preferential flow and transport in the vadose zone. J. Hydrol. 2003, 272, 14–35. [Google Scholar] [CrossRef]
  90. Wilson, G.V.; Cullum, R.F.; Römkens, M.J.M. Ephemeral gully erosion by preferential flow through a discontinuous soil-pipe. CATENA 2008, 73, 98–106. [Google Scholar] [CrossRef]
  91. Wang, Y.; Duan, X.; Gu, Y.; Wang, S. Fractal Characteristics of the Seepage Erosion Process in Porous Soil. Geofluids 2022, 2022, 3383773. [Google Scholar] [CrossRef]
  92. Nieber, J.L.; Sidle, R.C.; Beven, K.J. How do disconnected macropores in sloping soils facilitate preferential flow? Hydrol. Process. 2010, 24, 1582–1594. [Google Scholar] [CrossRef]
  93. Zhang, Z.; Liu, K.; Zhou, H.; Lin, H.; Li, D.; Peng, X. Linking saturated hydraulic conductivity and air permeability to the characteristics of biopores derived from X-ray computed tomography. J. Hydrol. 2019, 571, 1–10. [Google Scholar] [CrossRef]
  94. Wilkinson, D.J.; Willemsen, J.F. Invasion Percolation: A New Form of Percolation Theory. J. Phys. A Gen. Phys. 1999, 16, 3365. [Google Scholar] [CrossRef]
  95. Ghanbarian, B.; Hunt, A.G. Improving unsaturated hydraulic conductivity estimation in soils via percolation theory. Geoderma 2017, 303, 9–18. [Google Scholar] [CrossRef]
  96. Sedighi, M. An Investigation of Hydro-Geochemical Processes in Coupled Thermal, Hydraulic, Chemical and Mechanical Behaviour of Unsaturated Soils; Cardiff University (United Kingdom): Cardiff, UK, 2011. [Google Scholar]
  97. Xu, P.; Zhang, Q.; Qian, H.; Guo, M.; Yang, F. Exploring the saturated permeability of remolded loess under inorganic salt solution seepage. Eng. Geol. 2021, 294, 105927. [Google Scholar] [CrossRef]
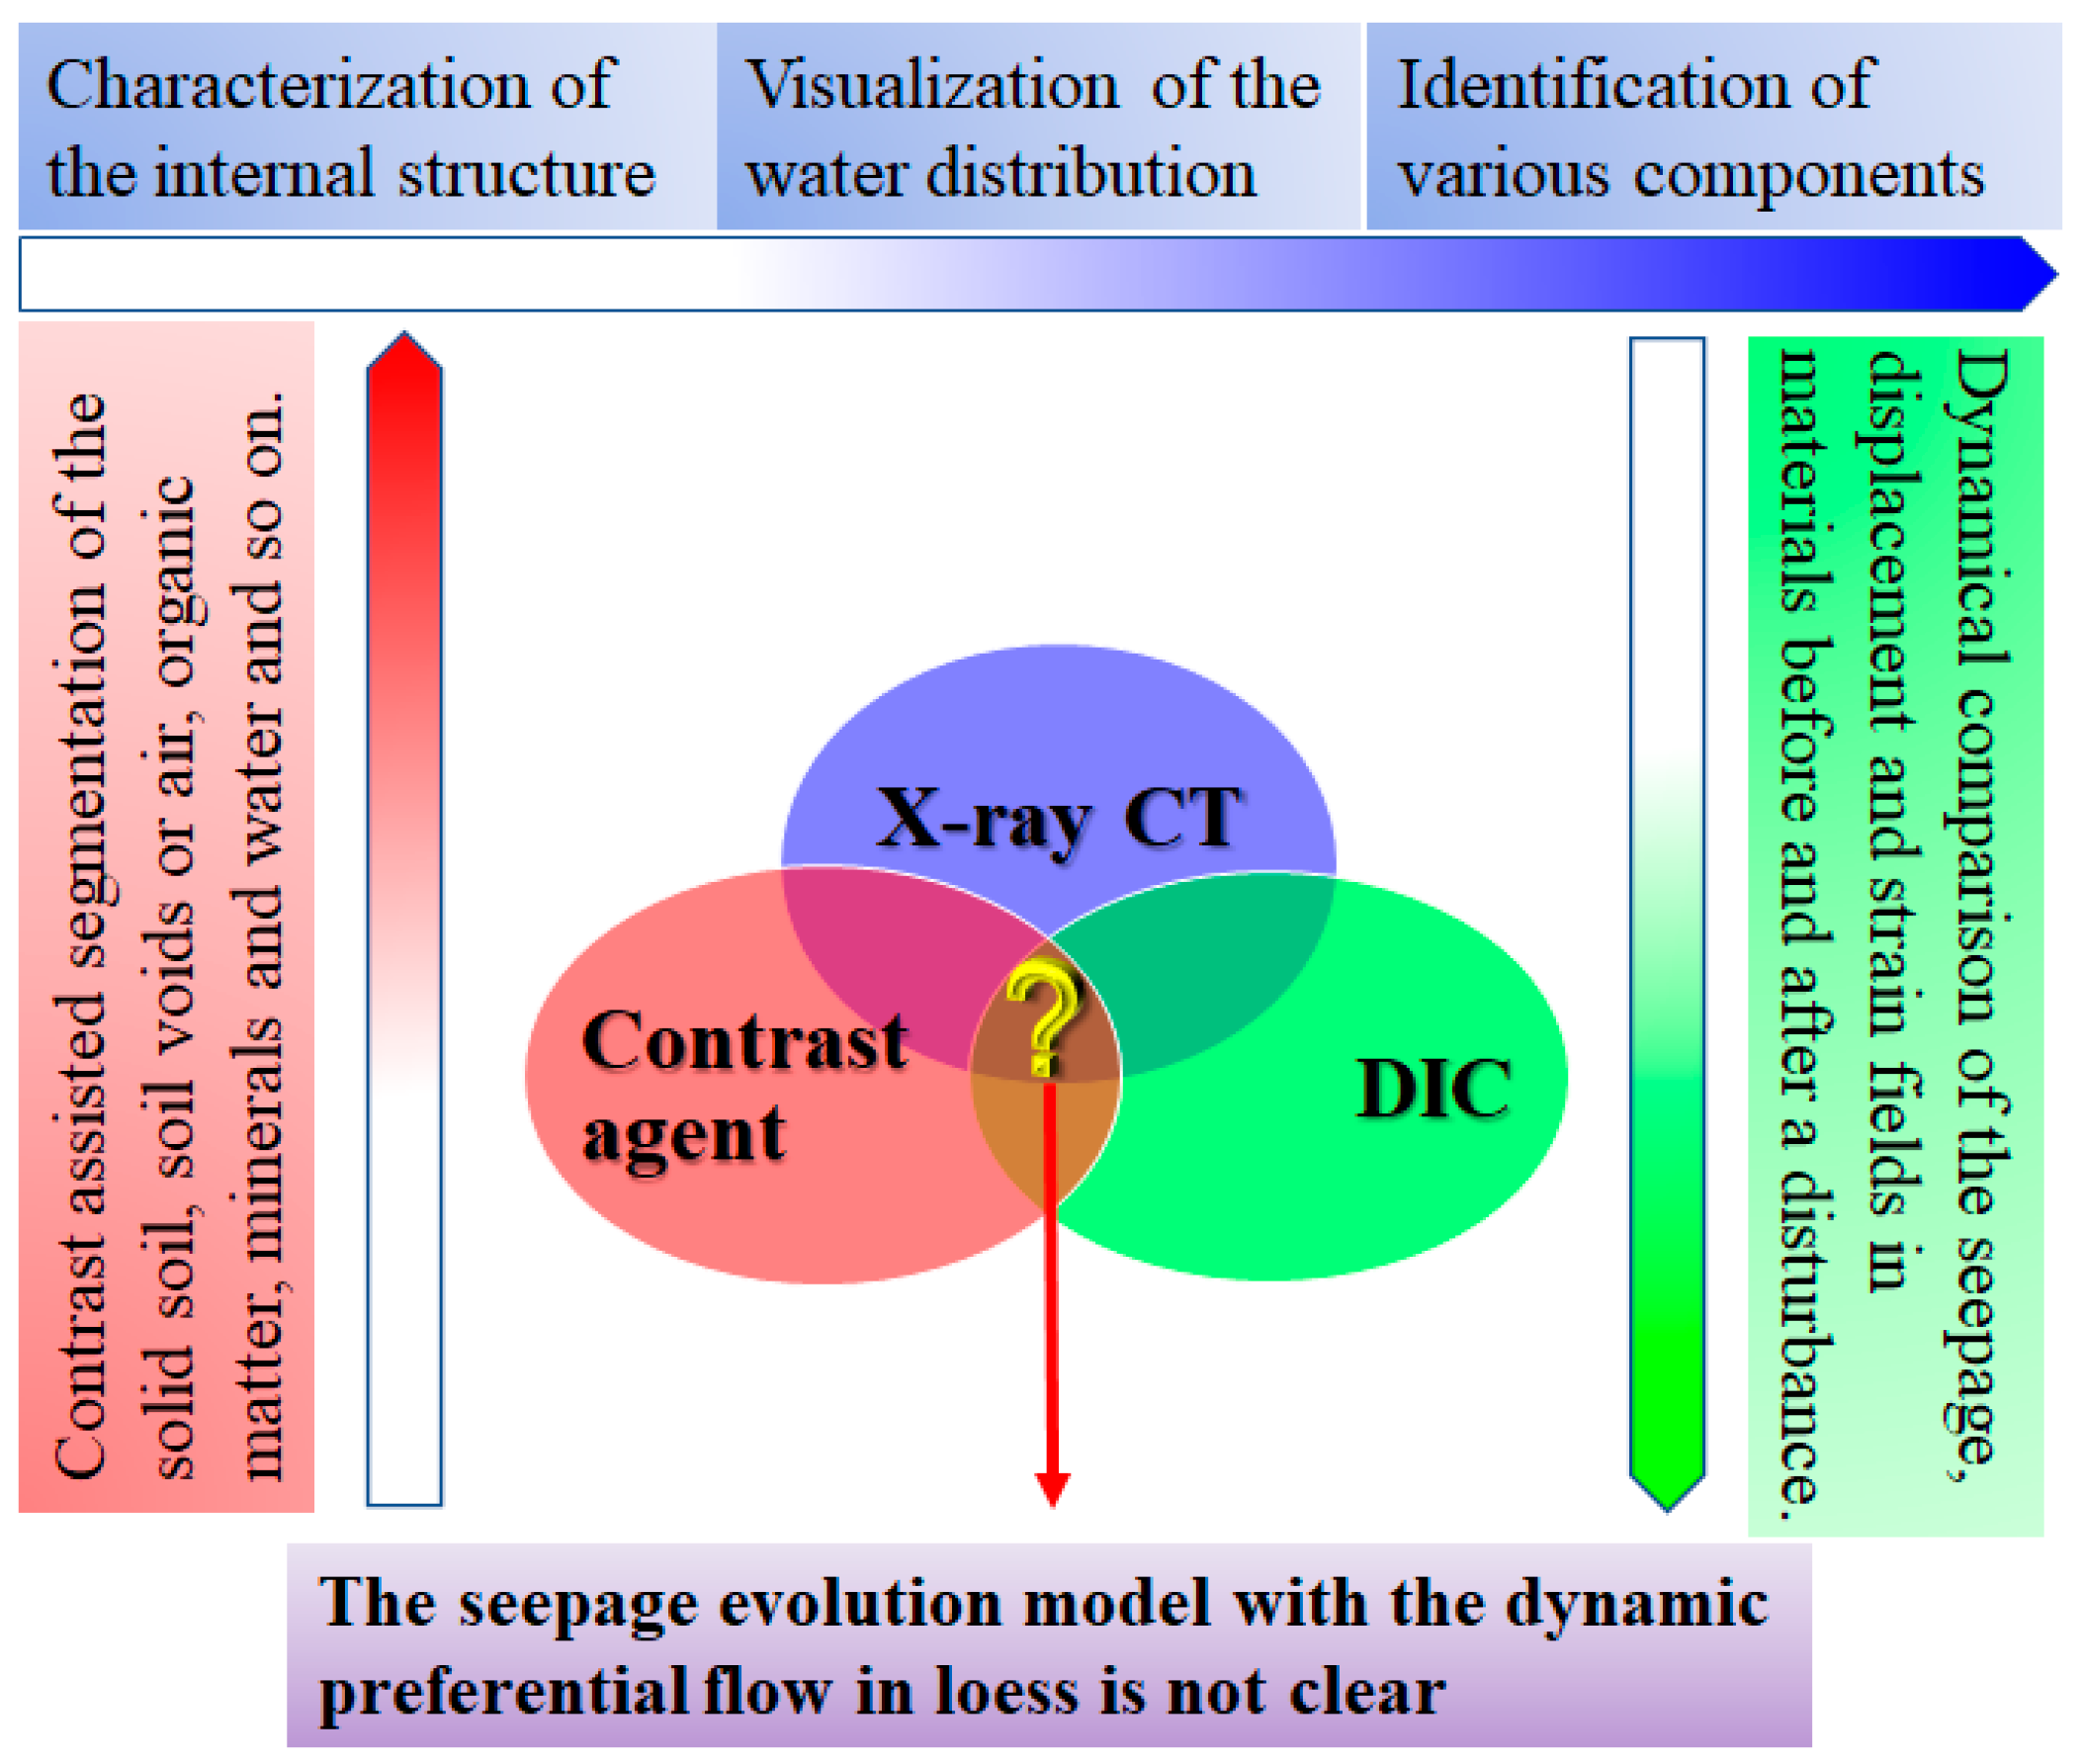
Figure 1. Relationship between the research of X-ray CT, contrast agents, and DIC technologies.
Water 15 02963 g001
Figure 2. Location map: (a) thumbnail map of China; (b) loess plateau and loess distribution area; (c) topographical map of the southern tableland of Jingyang County with distribution of landslides and location of the sampling site; (d) photo of the loess layer at Xiushidu village; (e) stratigraphic sequence of loess–paleosol.
Water 15 02963 g002
Figure 3. Particle size distribution curve for the loess sample.
Water 15 02963 g003
Figure 4. USDA triangle for soil classification.
Water 15 02963 g004
Figure 5. Apparatus for the preferential infiltration experiment: (a) substrate; (b) visualized seepage device; (c) continuous liquid supply device; (d) bottom plate; (e) real-time weighing balance; (f) beaker; (g) seepage chamber; (h) top cover; (i) bottom cover; (j) inlet water storage area; (k) permeable stone; (l) outlet water storage area; (m) permeable stone; (n) drainage pipe; (o) support rod; (p) liquid bottle; (q) connecting hose; (r) flow meter; and (s) soil sample.
Water 15 02963 g005
Figure 6. Flow chart of the procedure for preferential infiltration experiment.
Water 15 02963 g006
Figure 7. Image of the uncorrected CT scan data: (a) dry CT data; (b) wet CT data after the first seepage; (c) wet CT data after the second seepage; and (d) stacking of three unregistered data that do not overlap well.
Water 15 02963 g007
Figure 8. Comparison of 2D slice data before and after image registration: (a) and (e) are the unregistered and registered slices in the XY plane, respectively; (b) and (f) are the unregistered and registered slices in the XZ plane, respectively; (c) and (g) are the unregistered and registered slices in the YZ plane, respectively; (d) and (h) are the unregistered and registered 2D slices in different planes superimposed in a 3D space, respectively.
Water 15 02963 g008
Figure 9. CT images of loess under different injection levels of contrast agents of slice 71 in the YZ plane: (ac) are slices of the YZ plane in the initial state, after the first and second liquid addition, respectively (blue in the image represents pores, where green in the initial state represents the loess matrix, and green in the image after liquid addition represents the portion occupied by the developer solution).
Water 15 02963 g009
Figure 10. Distribution of pores and preferential flow with contrast agents in loess (where yellow represents pores, and blue represents contrast agents): (a) pores after the first liquid addition; (b) contrast agent after the first infusion; (c) superimposition of pores and contrast agent after the first addition of liquid; (d) pores after the second addition of liquid; (e) contrast agent after the second infusion; and (f) superimposition of pores and contrast agents after the second fluid addition. The red, black, and green circles in the figure are the characteristic parts selected for the comparison of the changes in macropores before and after seepage.
Water 15 02963 g010
Figure 11. Column diagrams of the average porosity variation under dynamic seepage conditions.
Water 15 02963 g011
Figure 12. Column diagrams of the relative and absolute change rate under dynamic seepage conditions.
Water 15 02963 g012
Figure 13. Curves of pore number varying with pore diameter for the dry state and each seepage.
Water 15 02963 g013
Figure 14. Curves of pore volume varying with pore diameter for the dry state and each seepage.
Water 15 02963 g014
Figure 15. Dip–rose diagram of the percentage of pore number in each dip angle interval of 10°, including the initial dry state and the wet state after the first to the fifth seepage.
Water 15 02963 g015
Figure 16. Change in the connectivity of the pores during the seepage process.
Water 15 02963 g016
Figure 17. Porosity distribution curves along the Z direction of the loess sample responding to the initial dry state and the wet state after the first to the fifth seepage. The dashed lines represent the typical depth mentioned in the main text.
Water 15 02963 g017
Table 1. Basic properties of loess samples.
Dry Density
(g/cm3)
Specific GravityPorosity
(%)
Void
Ratio
Liquid LimitPlastic LimitPlastic
Index
Clay (%)
(d ≤ 2 μm)
Silt (%) (2 < d ≤ 50 μm)Sand (%)
(d > 50 μm)
Soil TypeCuCc
1.322.6743.940.7928.2116.0511.9410.6581.068.29Silt14.502.45
Table 2. Descriptive statistical results of the changes in porosity.
State MarkAverageMinimumMaximumStandard
Error
Standard
Deviation
Variance
D016.91%12.61%20.97%±0.20%2.38%5.66%
W110.82%6.75%14.95%±0.17%2.09%4.35%
W28.83%5.85%13.13%±0.14%1.69%2.87%
W36.63%3.62%8.88%±0.04%1.37%1.89%
W44.77%2.15%6.92%±0.02%0.71%0.50%
W54.48%2.35%7.45%±0.02%0.54%0.29%
‘D0’ represents the initial dry state of the sample; ‘W1~W5’ represents the wet state after the first to the fifth seepage, respectively.
Table 3. Statistics of the percentage of change in the pore number during the seepage process.
Equal Diameter (mm)Changing Percentage of the Pore Number (%)
W1W2W3W4W5
<1–3.049–0.583+40.726+1.553+0.948
1~2+6.686+2.123–33.573–1.525–0.879
2~3+1.001+0.238–3.615–0.032–0.066
3~4–1.074–0.378–1.173+0.005–0.003
4~5–1.371–0.631–0.8950.0000.000
>5–2.193–0.769–1.4690.0000.000
‘+’ represents an increase, and ‘–’ represents a decrease.
Table 4. Statistics of the percentage of change in the pore volume during the seepage process.
Equal Diameter (mm)Changing Percentage of the Pore Volume (%)
W1W2W3W4W5
<1+0.989+0.824+32.042+3.610+4.134
1~2+5.895+4.804+40.320–4.370–1.797
2~3+2.765+2.481+0.955+0.363–2.347
3~4+0.414–0.115–6.971+0.714–0.364
4~5–1.681–3.142–11.7450.0000.000
>5–8.382–4.853–54.6000.0000.000
‘+’ represents an increase, and ‘–’ represents a decrease.
Table 5. Statistics of the pore number percentage and the change value in each dip angle interval.
Dip Angle (°)D0W1W2W3W4W5Δ
0~107.477.237.4218.5620.9221.83+14.37
10~206.476.896.7517.7018.2218.86+12.39
20~308.537.828.1815.6715.5215.68+7.15
30~409.959.319.3114.1713.0112.62+2.67
40~5012.8512.9512.2711.6910.5810.00–2.86
50~6016.0915.8015.569.078.668.03–8.06
60~7018.3118.7216.636.886.766.63–11.68
70~8014.3914.9416.224.624.654.54–9.85
80~905.946.357.661.641.671.81–4.13
‘+’ represents an increase, and ‘–’ represents a decrease. ‘△’ represents the change in the percentage of the pore number in each 10° interval between W5 and D0.
Disclaimer/Publisher’s Note: The statements, opinions and data contained in all publications are solely those of the individual author(s) and contributor(s) and not of MDPI and/or the editor(s). MDPI and/or the editor(s) disclaim responsibility for any injury to people or property resulting from any ideas, methods, instructions or products referred to in the content.